-
Noroviruses (NoV) are the leading causes of acute viral gastroenteritis worldwide [1,2], contributing to substantial morbidity and mortality in impoverished and developing countries and also causing huge economic losses in developed countries [3–5]. According to its genetic characteristics, NoV can be divided into 10 genogroups (GI‐GX) [6], in which GI, GII, and GIV are the three main genomes that cause acute gastroenteritis in humans [7]. NoV mutates rapidly, and new strains that cause global epidemics can appear every 2–3 years [8,9]. NoVs are also strongly resistant to the environment with low infection doses [10]. They are infectious at room temperature and cannot be completely eradicated by ordinary disinfectants [11]. The antibodies produced after infection do not provide long-term immunity to NoVs; even if the patients were previously infected, the same individual can be repeatedly infected [12]. Generally, the entire population is susceptible to NoV infection, and people of all ages are affected to a different extent [13,14]. NoVs cause approximately 90% of viral gastroenteritis outbreaks and 50% of all-cause gastroenteritis outbreaks annually worldwide, resulting in a total of 4.2 billion in direct health system costs and 60.3 billion in societal costs per year [15,16]. NoVs are associated with 18% of diarrheal diseases globally, causing approximately 200,000 deaths annually worldwide, with 70,000 or more among children in developing countries [17]. This implies that people in developing countries are at greater risk, and more precautions should be taken.
NoV outbreaks in China are also a major public health concern, and the number of cases reported in China has increased sharply since 2014 [18]. To monitor outbreaks of NoV and other infectious diseases, China launched the National Notifiable Disease Reporting System (NNDRS) in 2003 and upgraded the system 3 years later [19]. NNDRS played an important role in collecting information on NoV outbreaks in China. This study collected data from this system, and the definition of a NoV outbreak came from the Guidelines on Outbreak Investigation, Prevention, and Control of Norovirus Infection (2015) [18]. According to the guideline, a NoV outbreak is defined as the infection of NoV with at least 20 cases occurring within a 7-day period in a school, childcare facility, healthcare facility, nursing home, factory, construction site, cruise ship, community/village, or other collective unit or location; at least two of these cases must be laboratory diagnosed.
Regarding the vast territory in China, the occurrence of NoV outbreaks in different regions shows significant spatial heterogeneity because of huge differences in economic level, climate conditions, and population density, while a few studies have focused on the spatial epidemiological characteristics of NoV outbreaks.
So far, specific antiviral drugs or vaccines for the NoV outbreak is still deficient [20], and non-pharmaceutical measures have become the pathway to prevent and control the infection [18,21]. Thus, this study aimed to identify the susceptible areas and high-risk groups through epidemiological characteristics and spatiotemporal distribution patterns of NoV outbreaks to provide a basis for implementing more specific non-pharmaceutical preventive measures. The results of this study will lay a solid foundation to formulate more targeted preventive and control measures that can be put forward to interrupt the spread of NoVs in areas with intensive outbreaks, which is of great significance to reducing disease burden through accurate prevention and control measures in the future.
-
In China, acute gastroenteritis caused by NoV infection is a class C infectious disease for reporting and management purposes [22]. The local Center for Disease Control and Prevention reports the relevant information through the NNDRS. According to the Regulations on Public Health Emergencies, the government of provinces, autonomous regions, and municipalities directly under the central government that has or may have an outbreak or epidemic of infectious diseases shall report to the competent administrative department of health under the State Council within 1 h after receiving the report. The implementation of this regulation ensures a reliable data source for NNDRS. Although the NoV outbreak in China was first reported in 2007, the coverage has not been fully extended to the whole country until at least 2012. The most recently accessed data in this study was up to 2018, and a total of 26 provinces have reported NoV outbreaks to the NNDRS. The epidemiological information used in this study was obtained from the NNDRS, including the location, setting type, date, and number of confirmed cases from 2012 to 2018 in China.
-
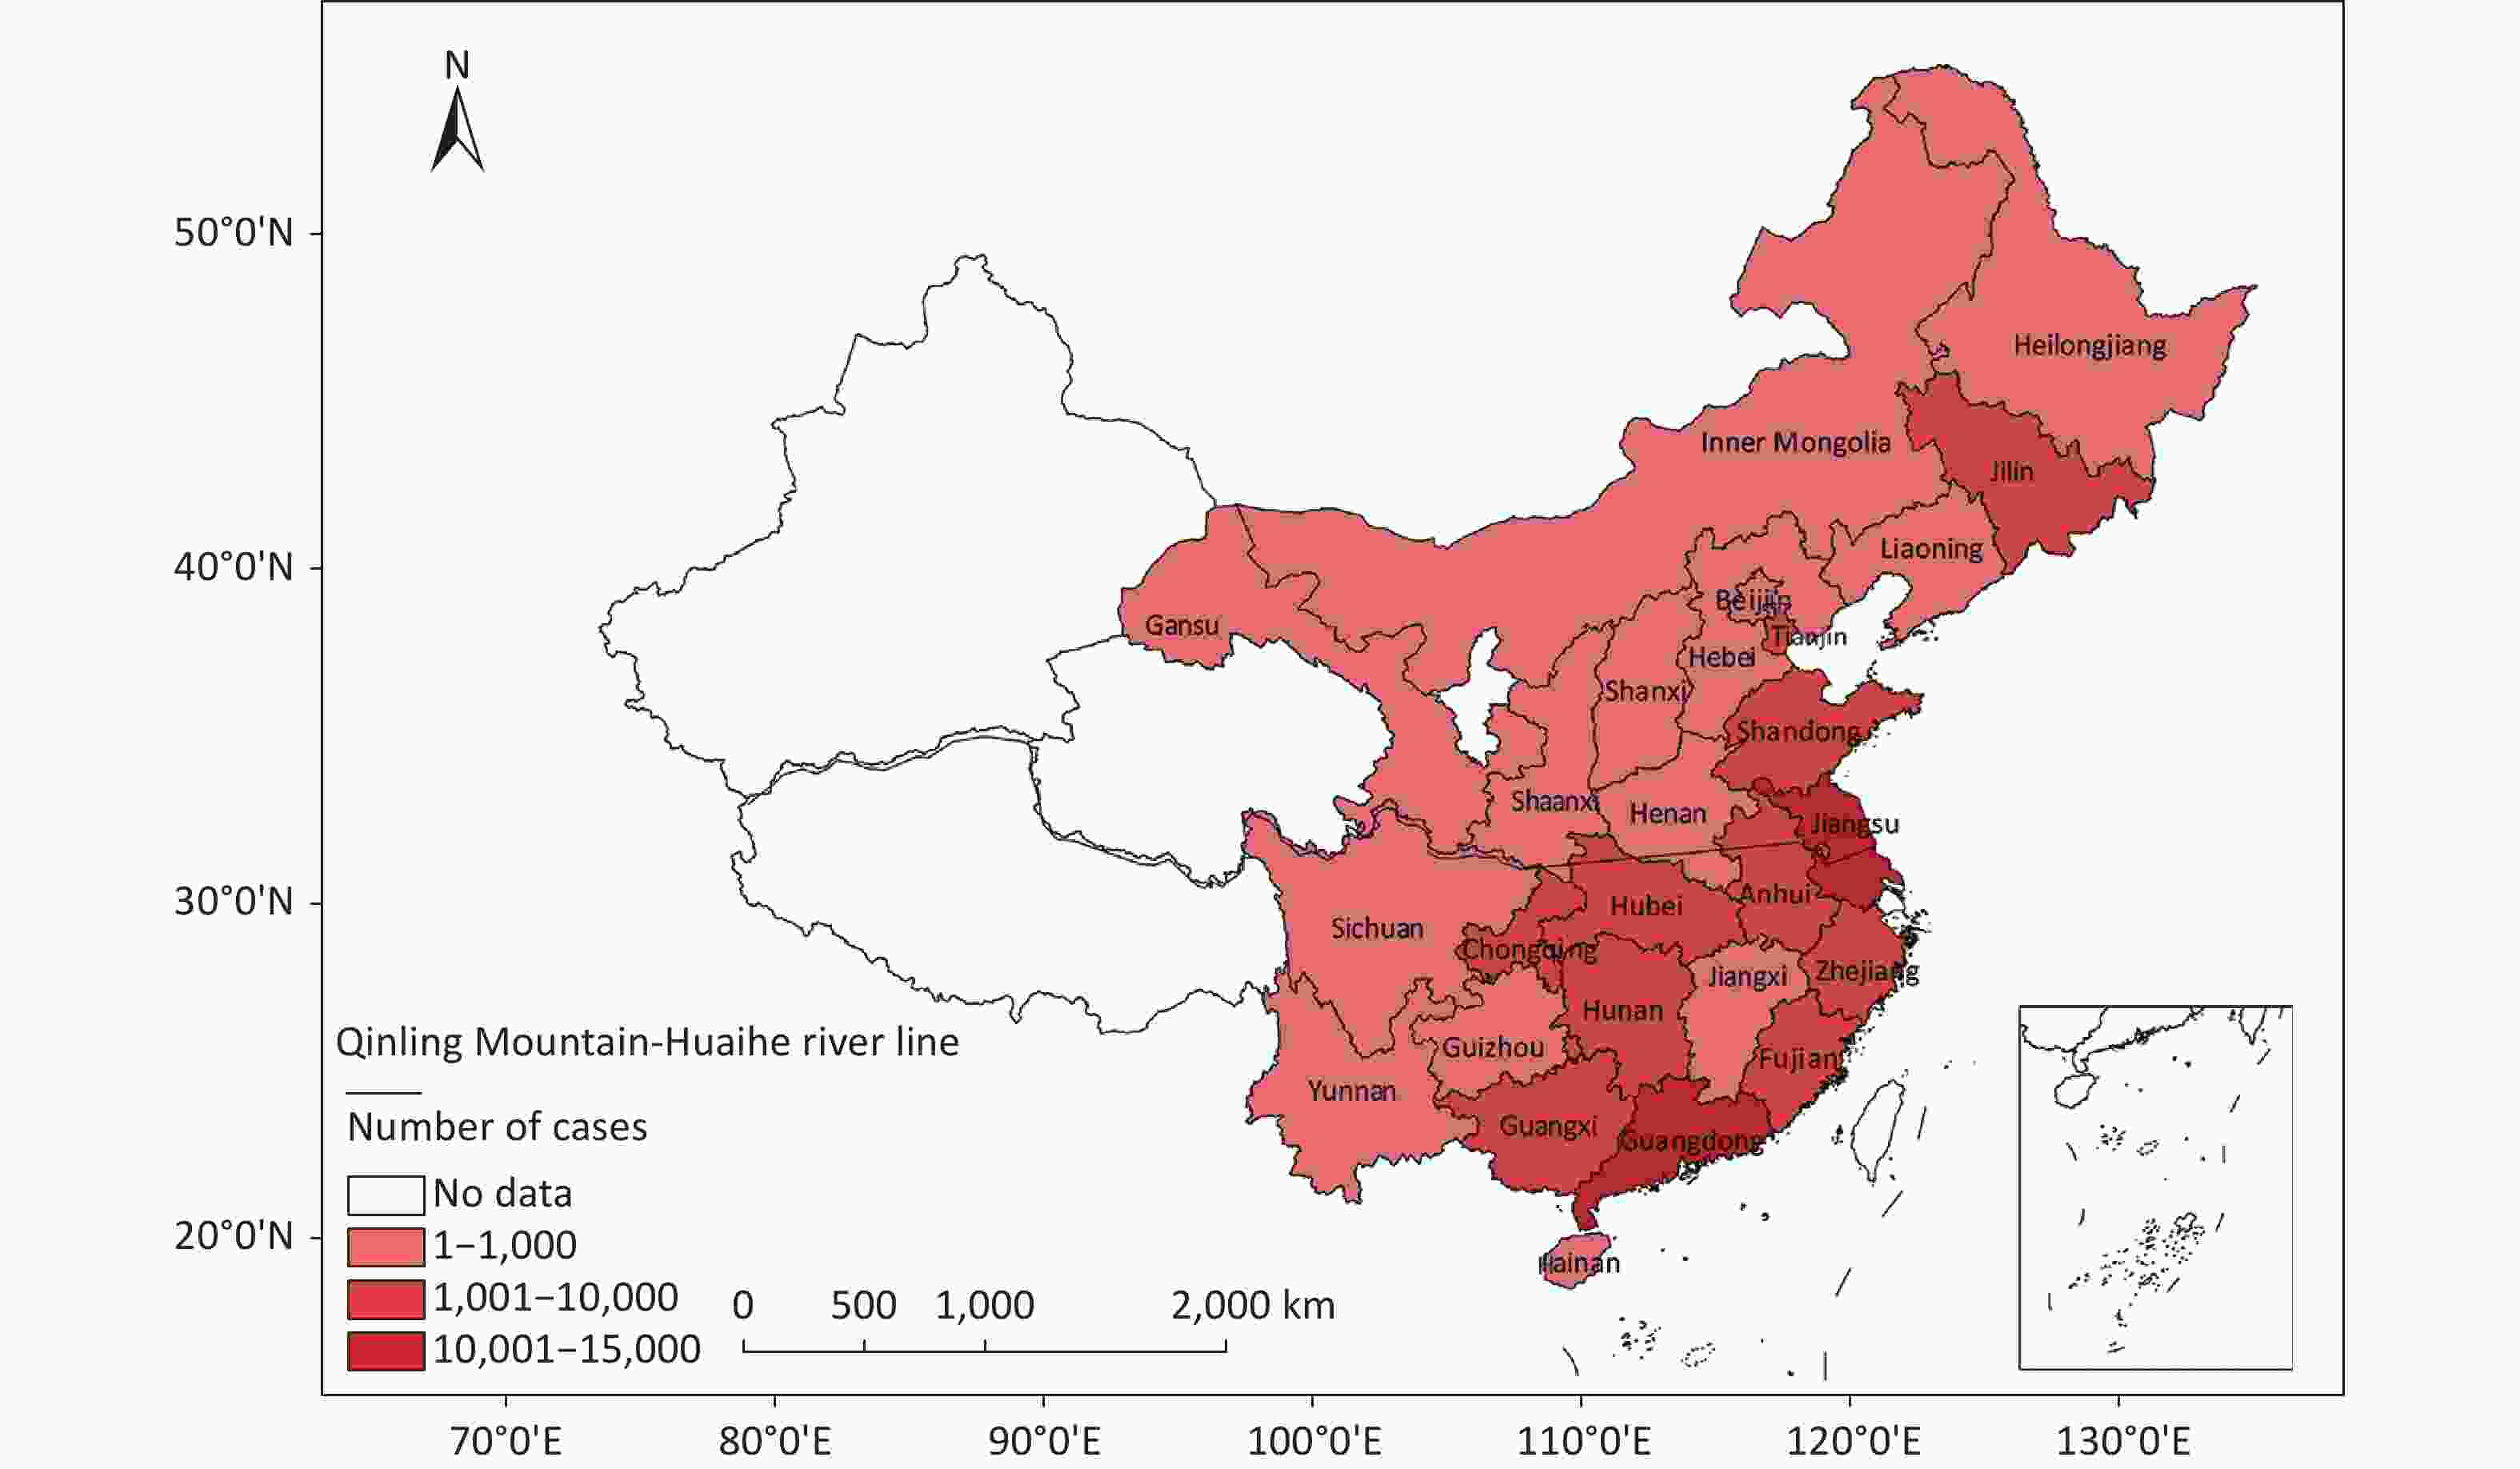
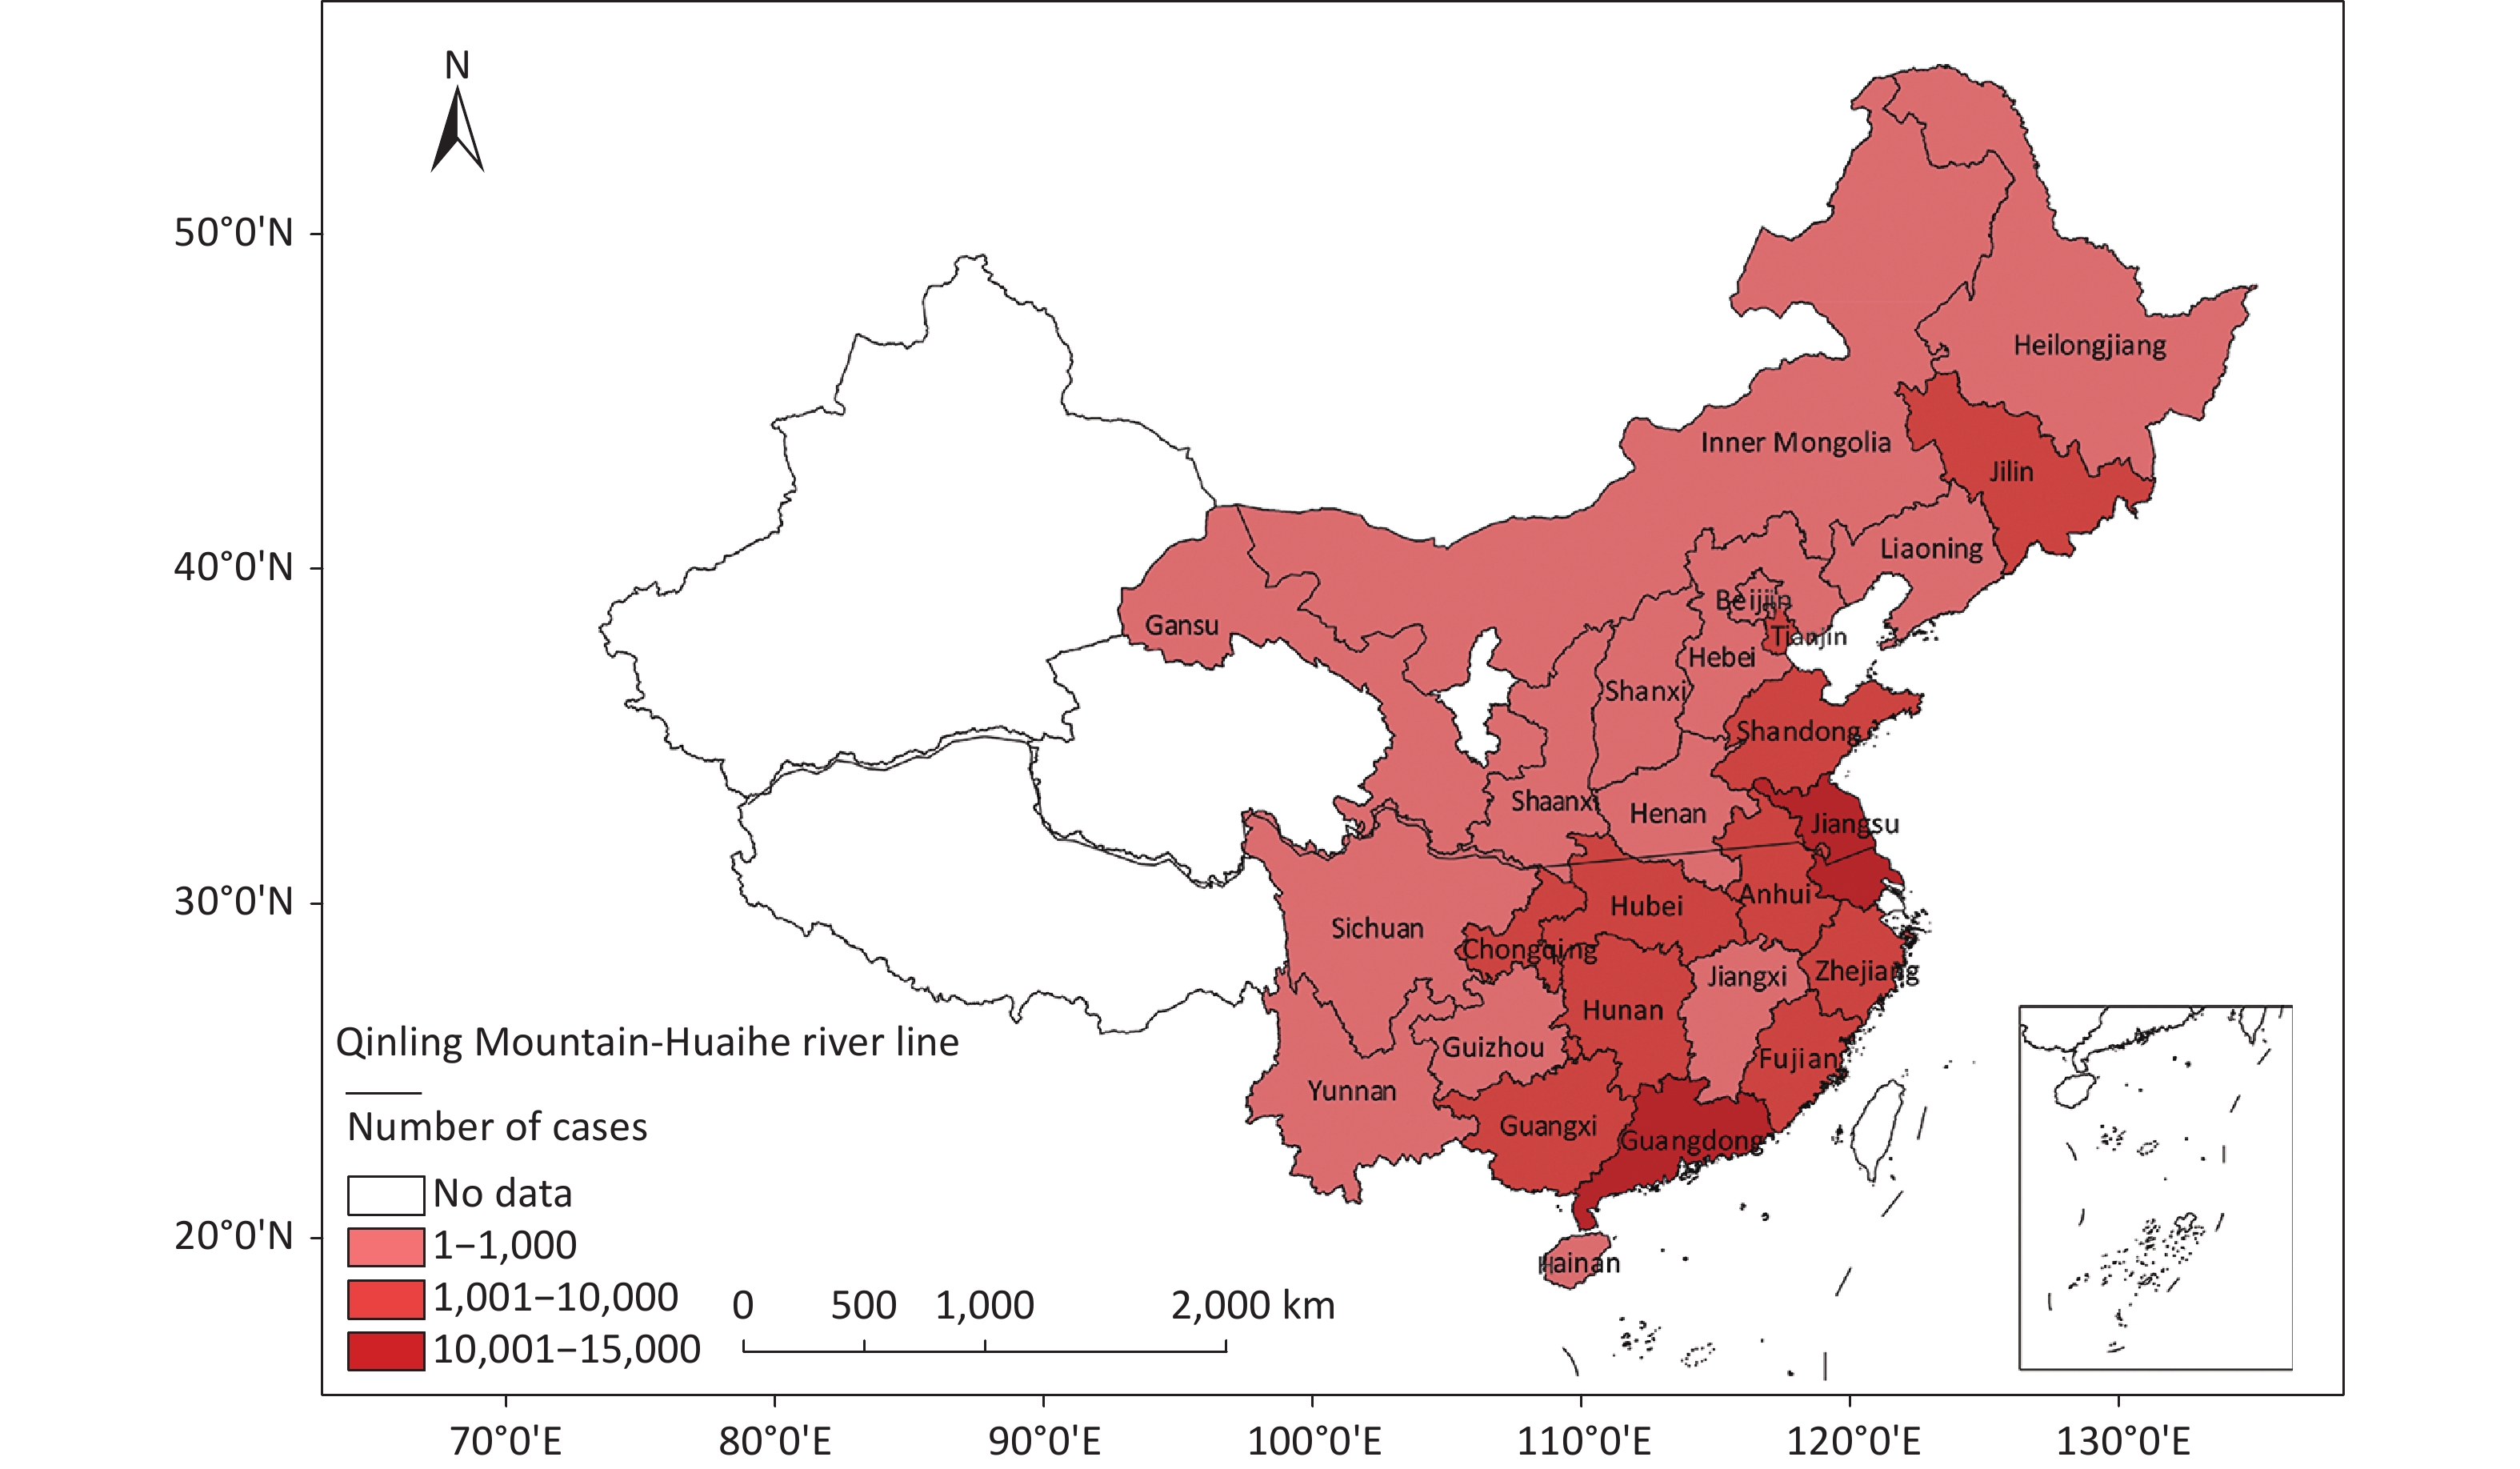
The study covered 26 provinces in Mainland China. As the largest developing country worldwide, China has a vast territory and a large population. Its population density, economic level, and eating habits of the population widely varied among regions. In this study, taking the Qinling Mountains and Huaihe River as the boundary, 14 provinces were located in South China and 12 in North China (Figure 1).
-
Descriptive data were calculated and analyzed using Microsoft Office Excel 2019 (Microsoft Redmond, WDC, USA). IBM SPSS Statistics for Windows, version 26 (IBM Armonk, NY, USA) was used for data analysis. Enumerated data are expressed as cases or percentages, and the χ2 test was used for statistical difference analysis. P < 0.05 was considered significant.
-
SaTScan was adopted to calculate the spatial scan statistics and identify the temporal and spatiotemporal clustering of the NoV outbreak. In this study, a discrete variable Poisson distribution model was adopted. A certain size (50% of the total population) and height (day) of the cylindrical space-time scanning window was set. Scanning was performed at the center of each sample. The log-likelihood ratio (LLR) of each window area was calculated simultaneously; the window region with the largest LLR value is the maximum likelihood aggregation area of NoV outbreaks, the window with the second largest LLR value is the likelihood aggregation area, and so on. Finally, the P-value corresponding to the LLR was calculated by Monte Carlo randomization (999 times), and the relative risk (RR value) of this region was also calculated.
-
A total of 964 NoV outbreaks in 26 provinces in China were reported to the NNDRS from January 1, 2012 to December 31, 2018. These outbreaks involved 50,548 confirmed cases, with an average of 7,221 cases reported annually. As shown in Figure 1, provinces with higher numbers of confirmed cases were concentrated in coastal areas, such as Guangdong and Jiangsu, which accounted for 27.4% (13,864/50,548) and 20.3% (10,265/50,548) of the total cases, respectively, together representing nearly half of all reported cases. Guangdong and Jiangsu were also the only two provinces where the number of cumulative reported cases was over 10,000. Another 10 provinces, namely, Jilin, Tianjin, Shandong, Fujian, Anhui, Zhejiang, Hubei, Hunan, Chongqing, and Guangxi, all reported confirmed cases in the range of 1,000–10,000. Fourteen provinces reported fewer than 1,000 cases, three of which (Guizhou, Shaanxi, and Yunnan) reported fewer than 100 cases. Data from Ningxia, Xinjiang, Qinghai, and Tibet are not available. Generally, the number of residents infected by NoV was evenly distributed across China but varied by province, and the differences were significant (P < 0.05).
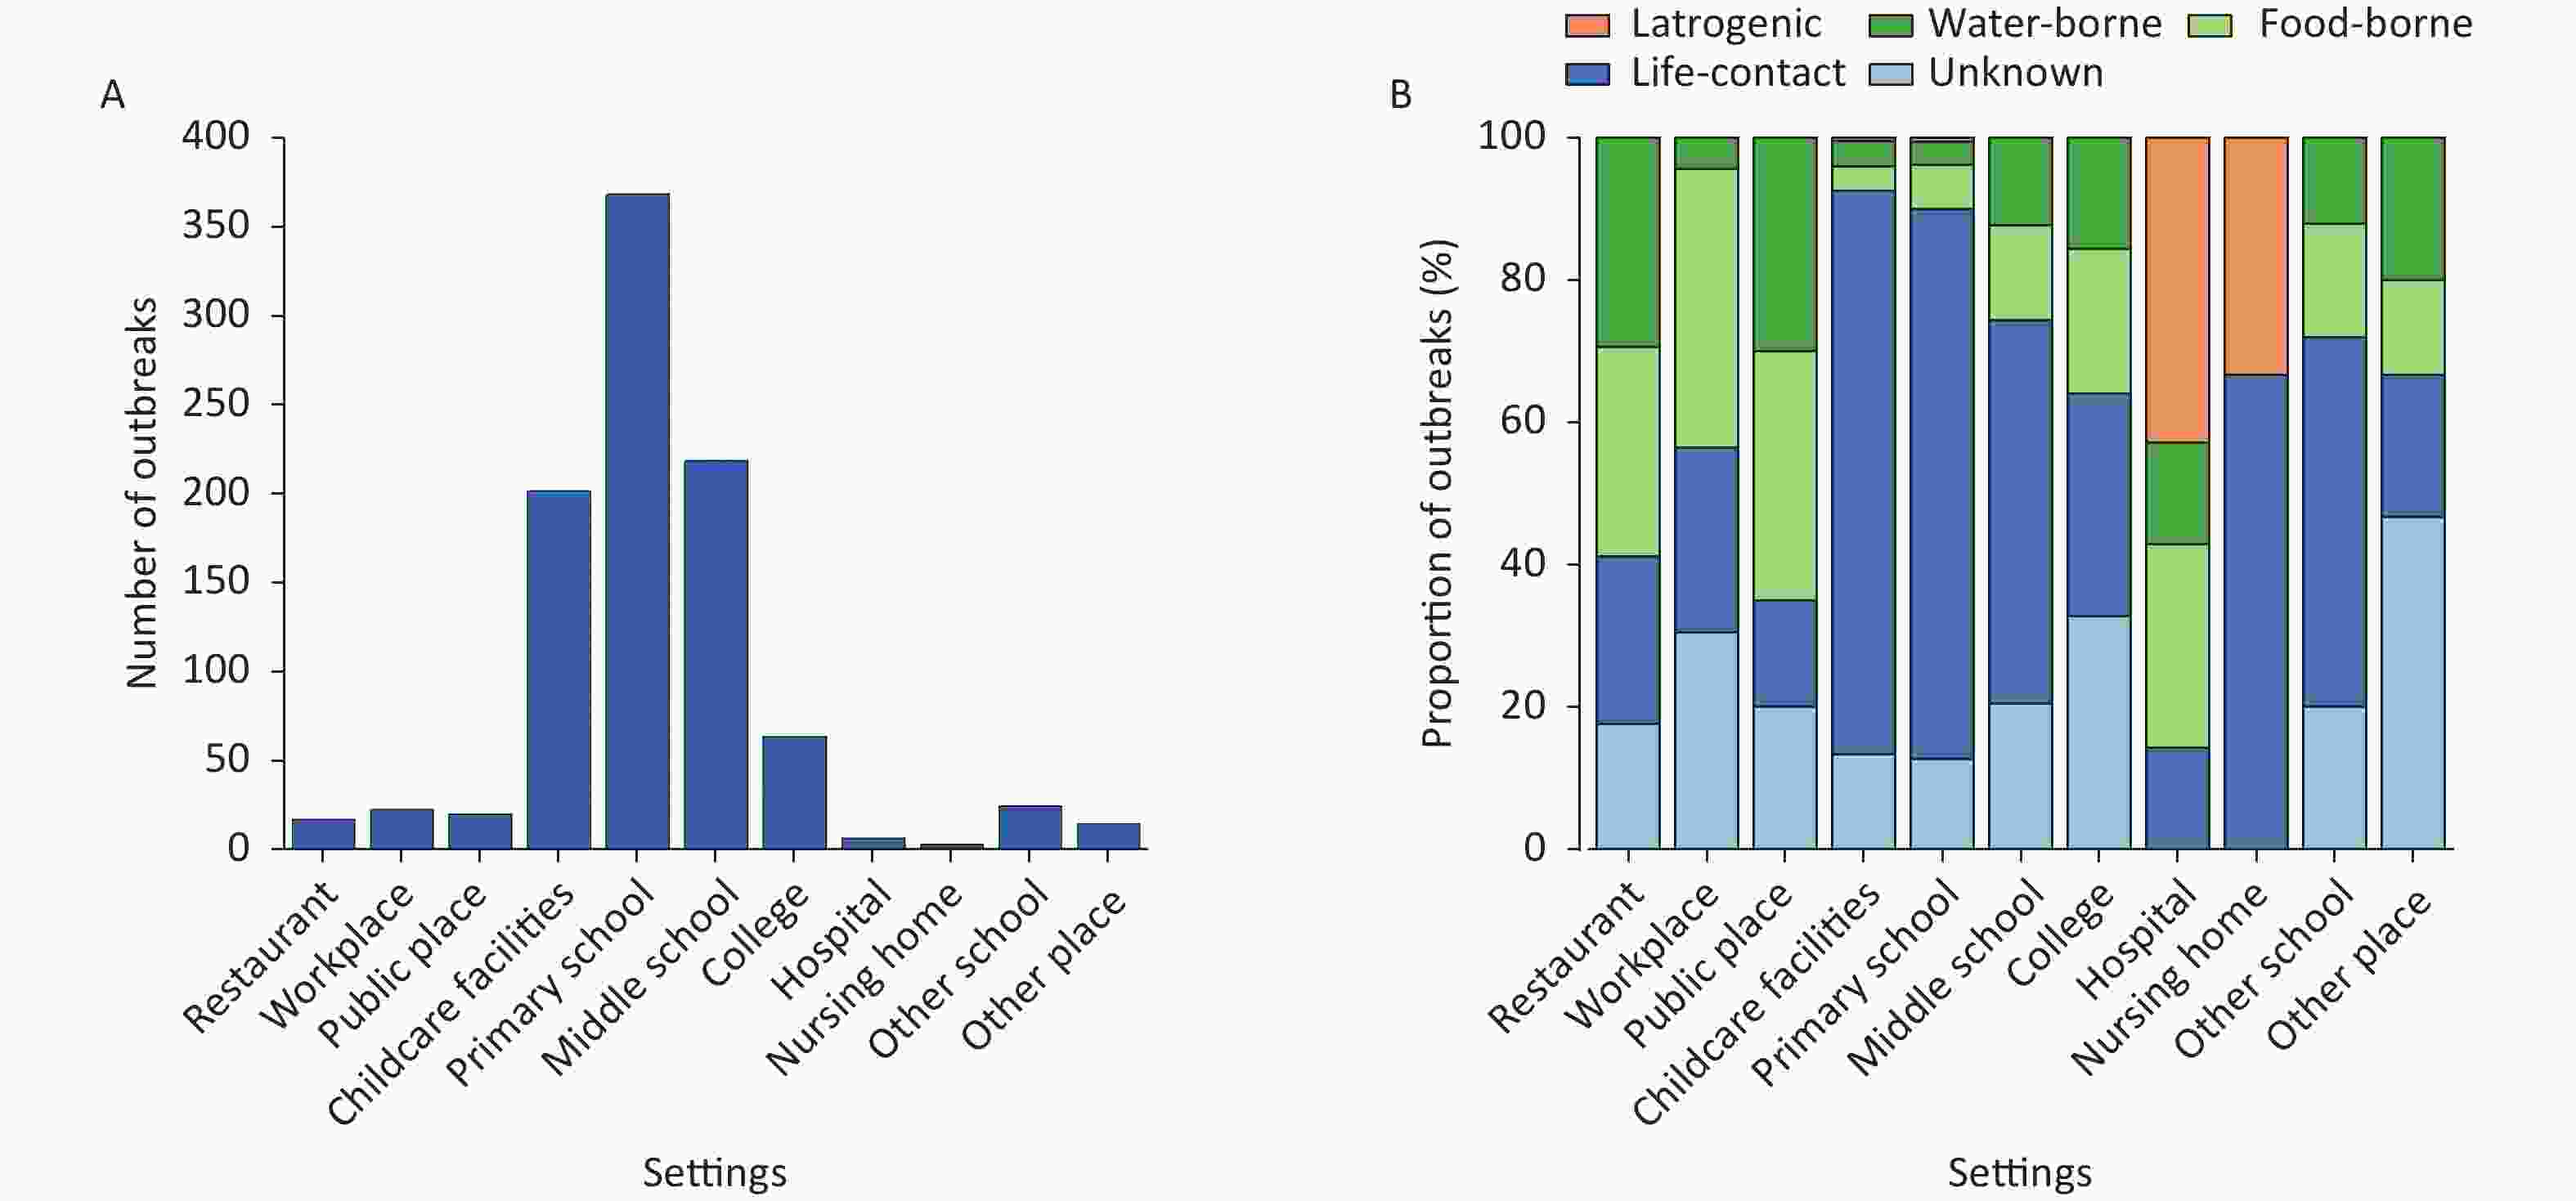
From Figure 2A, schools, especially middle schools, primary schools, and colleges, are settings with the most frequent NoV outbreaks, accounting for 70.2% (677/964) of all outbreaks, followed by childcare facilities (21%, 202/964). The frequency of NoV outbreaks in restaurants, public places, workplaces, and hospitals was relatively low, and only sporadic outbreaks were observed at these locations. The transmission routes for NoV outbreaks in these settings are shown in Figure 2B, including life contact, foodborne, waterborne, iatrogenic transmission, and unknown. Life contact transmission refers to transmission by fecal or oral route (including ingestion of aerosols from feces or vomitus) or indirect contact with fecal matter in contaminated environments. Foodborne transmission refers to getting infection by ingesting NoV-contaminated food. Waterborne transmission refers to the infection caused by drinking or touching NoV-contaminated water. Iatrogenic transmission is defined as an infection that occurs in patients following hospitalization for other reasons or when healthcare workers failed to protect themselves from pathogens excreted by patients. Unknown refers to the case in which the transmission route of the reported data is missing. As provided in Figure 2B, the life contact transmission was the main transmission route of NoV outbreaks in schools, childcare facilities, and nursing homes, accounting for 63.8% (615/964) of all outbreaks. Moreover, life contact transmission can be seen in every setting, implying that it is the most frequent transmission route of NoV. Foodborne, waterborne, and iatrogenic transmissions accounted for 10.5% (101/964), 7.8% (75/964), and 0.73% (7/964) of NoV outbreaks, respectively.
-
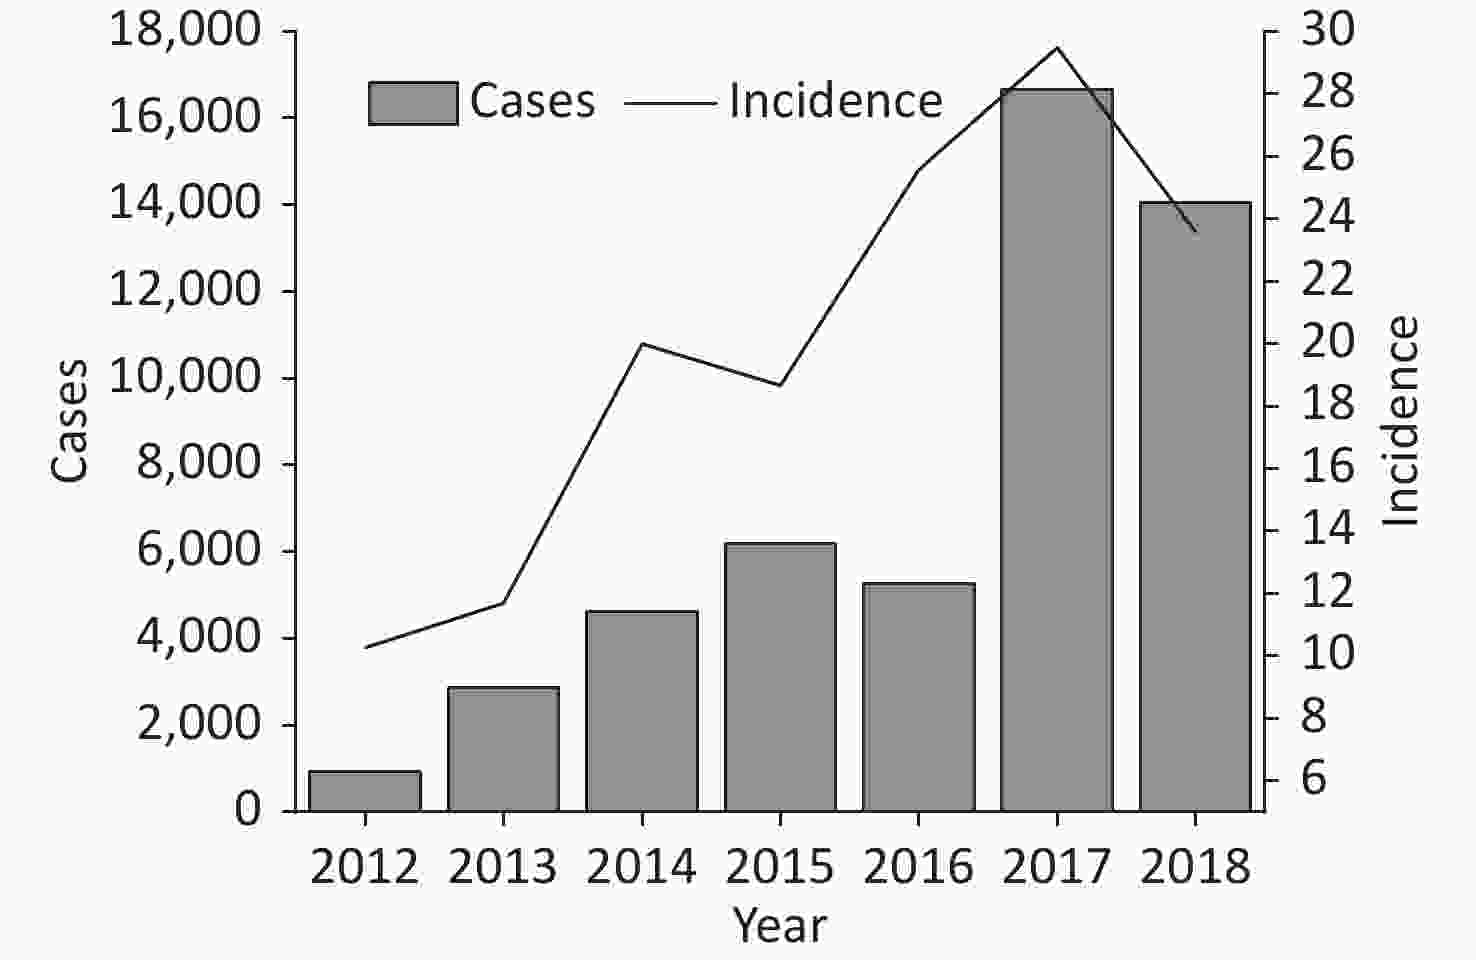
Spatial and Temporal Distribution of NoV Outbreaks As shown in Figure 3, the number of reported cases showed an obvious increasing trend from 2012 to 2018. It increased continuously from 2012 to 2015, slightly declined in 2016, and then steeply increased in 2017 (n = 16,644). The number of reported cases in 2018 slightly decreased to 14,051 cases. The trend of the incidence of NoV infection is similar to that of confirmed cases and shows a more obvious upward trend before 2018. Overall, human NoV outbreaks in China presented an increasing trend from 2012 to 2018.
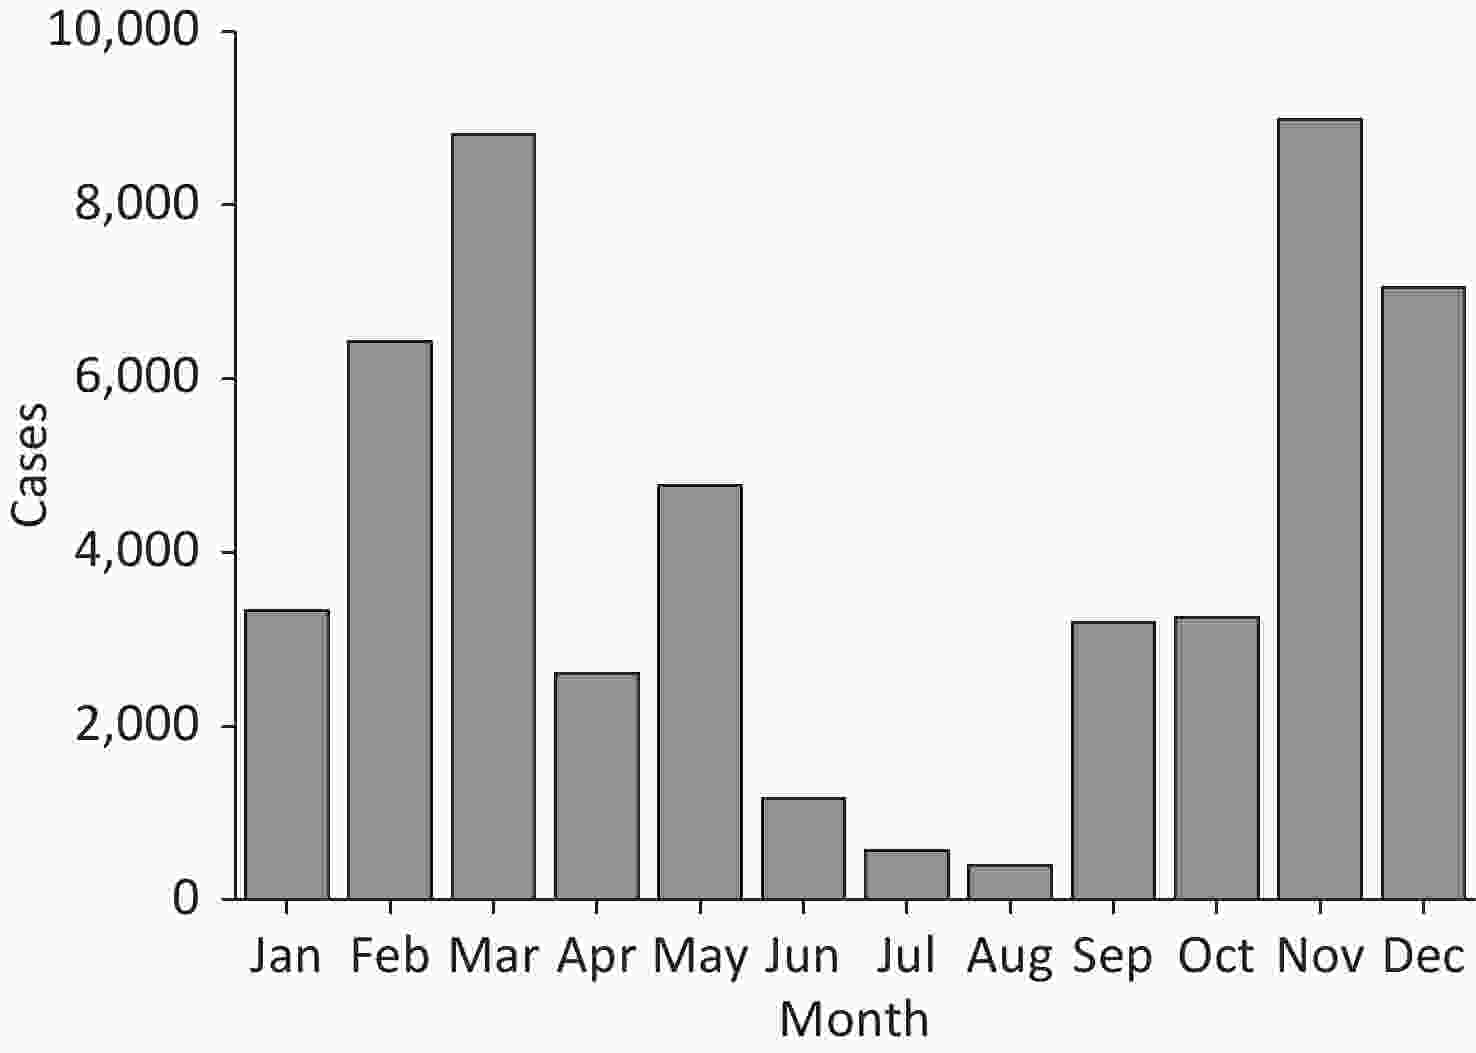
In this study, NoV outbreaks in China present an obvious seasonality, which implies a higher risk in winter and spring and a lower risk in summer. As shown in Figure 4, the cumulative number of reported NoV cases in different months shows a U-shaped distribution with peaks in March and November, accounting for 17.4% (8,806/50,548) and 17.8% (8,985/50,548) of all confirmed cases, respectively. The number of confirmed cases remains at a relatively high level from November to March of the next year. Thereafter, a gradual decline is observed from May to August, reaching the lowest number of reported cases in August (n = 395).
Only a few provinces have reported NoV cases during the period from 2012 to 2014, which are all located in Southeast China and experienced a higher risk of NoV infection in recent years (Table 1). In 2012, a total of 926 cases were reported in five provinces, including Fujian, Guangdong, Guangxi, Zhejiang, and Jiangsu. These provinces are all located in coastal areas that have developed economies, and these five provinces are also the only provinces that reported cases consecutive from 2012 to 2018. From 2013 to 2016, the number of provinces reporting NoV outbreaks has gradually increased to 14 provinces, and more cases have been reported in inland provinces. In 2017, a total of 21 provinces reported NoV outbreaks, with Jiangsu and Guangdong having the most cases, accounting for 28.5% (4,751/16,644) and 17.5% (2,915/16,644) of all cases in China, respectively. A large proportion of provinces reported much higher cases than last year in 2017, and some of the provinces started to report cases in 2017, which caused a surge of confirmed cases in 2017. Up to 2018, a total of 26 provinces have reported NoV outbreaks in China, with 14,051 confirmed cases. As the high-risk areas affected by NoV outbreaks, confirmed cases reported in Guangdong and Jiangsu accounted for 27.4% and 20.3% of total cases, respectively.
Table 1. Number of confirmed norovirus cases by provinces in China from 2012 to 2018
Location Province 2012 2013 2014 2015 2016 2017 2018 Total North China Beijing 0 0 23 0 373 186 410 992 Gansu 0 0 0 0 0 19 85 104 Hebei 0 0 0 314 43 0 88 445 Henan 0 0 0 753 0 0 0 753 Heilongjiang 0 0 0 0 211 224 62 497 Jilin 0 0 0 0 0 1,617 0 1,617 Liaoning 0 0 0 58 0 295 32 385 Inner Mongolia 0 0 0 0 0 189 67 256 Shandong 0 0 417 0 68 836 1,040 2,361 Shanxi 0 0 0 0 0 82 121 203 Shaanxi 0 0 0 0 0 87 0 87 Tianjin 0 0 0 18 74 650 267 1,009 South China Anhui 0 0 82 131 182 1,120 1,013 2,528 Fujian 105 102 98 19 281 867 364 1,836 Guangdong 250 1,978 1,830 2,616 1,789 2,915 2,486 13,864 Guangxi 51 27 507 311 325 606 722 2,549 Guizhou 0 0 0 0 0 0 50 50 Hainan 0 0 0 256 131 0 102 489 Hubei 0 36 0 105 0 884 653 1,678 Hunan 0 164 323 224 297 229 1,278 2,515 Jiangsu 147 326 545 886 477 4,751 3,133 10,265 Jiangxi 0 0 0 0 0 0 151 151 Sichuan 0 0 0 0 0 12 302 314 Yunnan 0 0 0 0 0 33 0 33 Zhejiang 373 230 715 481 157 419 533 2,908 Chongqing 0 0 77 22 845 623 1,092 2,659 Total 926 2,863 4,617 6,194 5,253 16,644 14,051 50,548 -
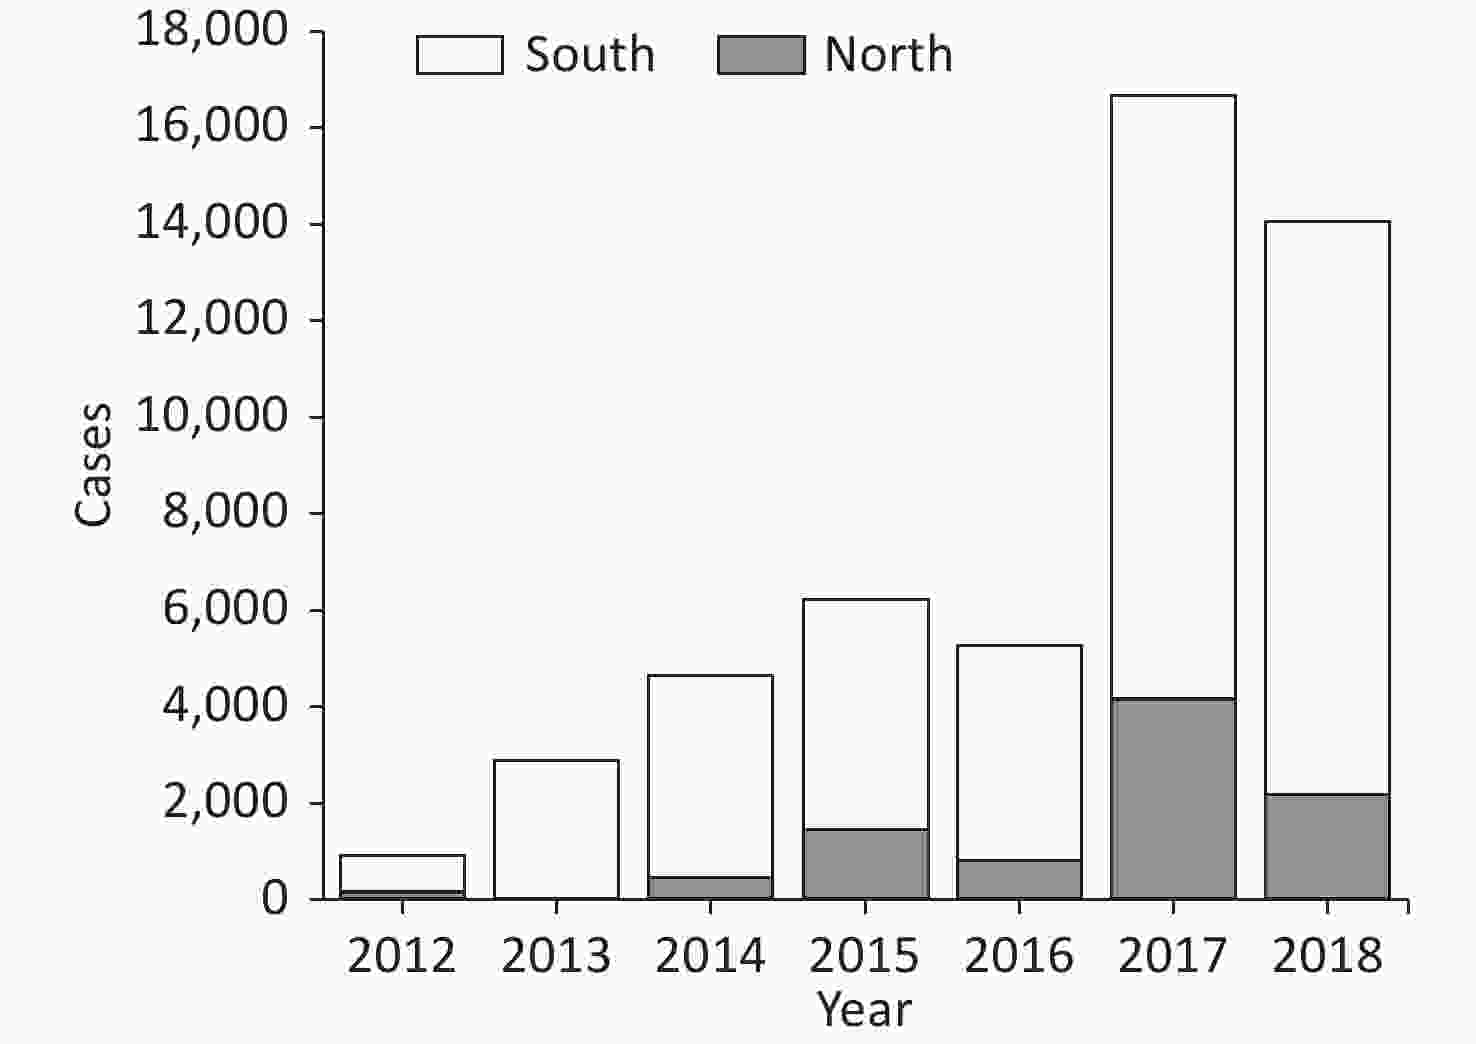
As shown in Figure 5, the number of cases was generally higher in the south than in the north (P < 0.05). Throughout the study period, a clear trend was observed toward a higher number of cases in the south than in the north. The difference was the highest in 2017, when 4,185 cases were reported in the north, and 12,459 cases were reported in the south. The peak that occurred in the north in 2017 was mainly due to 1,617 cases reported in Jilin, whereas no NoV outbreak was reported in this province in other years. In 2017, 12,459 cases were reported in South China, which significantly increased from the 4,484 cases reported in this region in 2016. The increase in reported cases in South China in 2017 was primarily due to cases reported in Guangdong, Guangxi, and Jiangsu.
-
The results of the space-time Poisson model in Figure 6 show the spatial aggregation of NoV outbreaks in China from 2012 to 2018. Regions with high clusters of human NoV outbreaks were identified during the 7 years, and the RR value was calculated in each region. Except for the spatial clustering in Heilongjiang, Jilin, and Liaoning in 2017, outbreaks in other years were all clustered in the southeast coastal area, and the hotspot area kept expanding and gradually covered the northern areas.
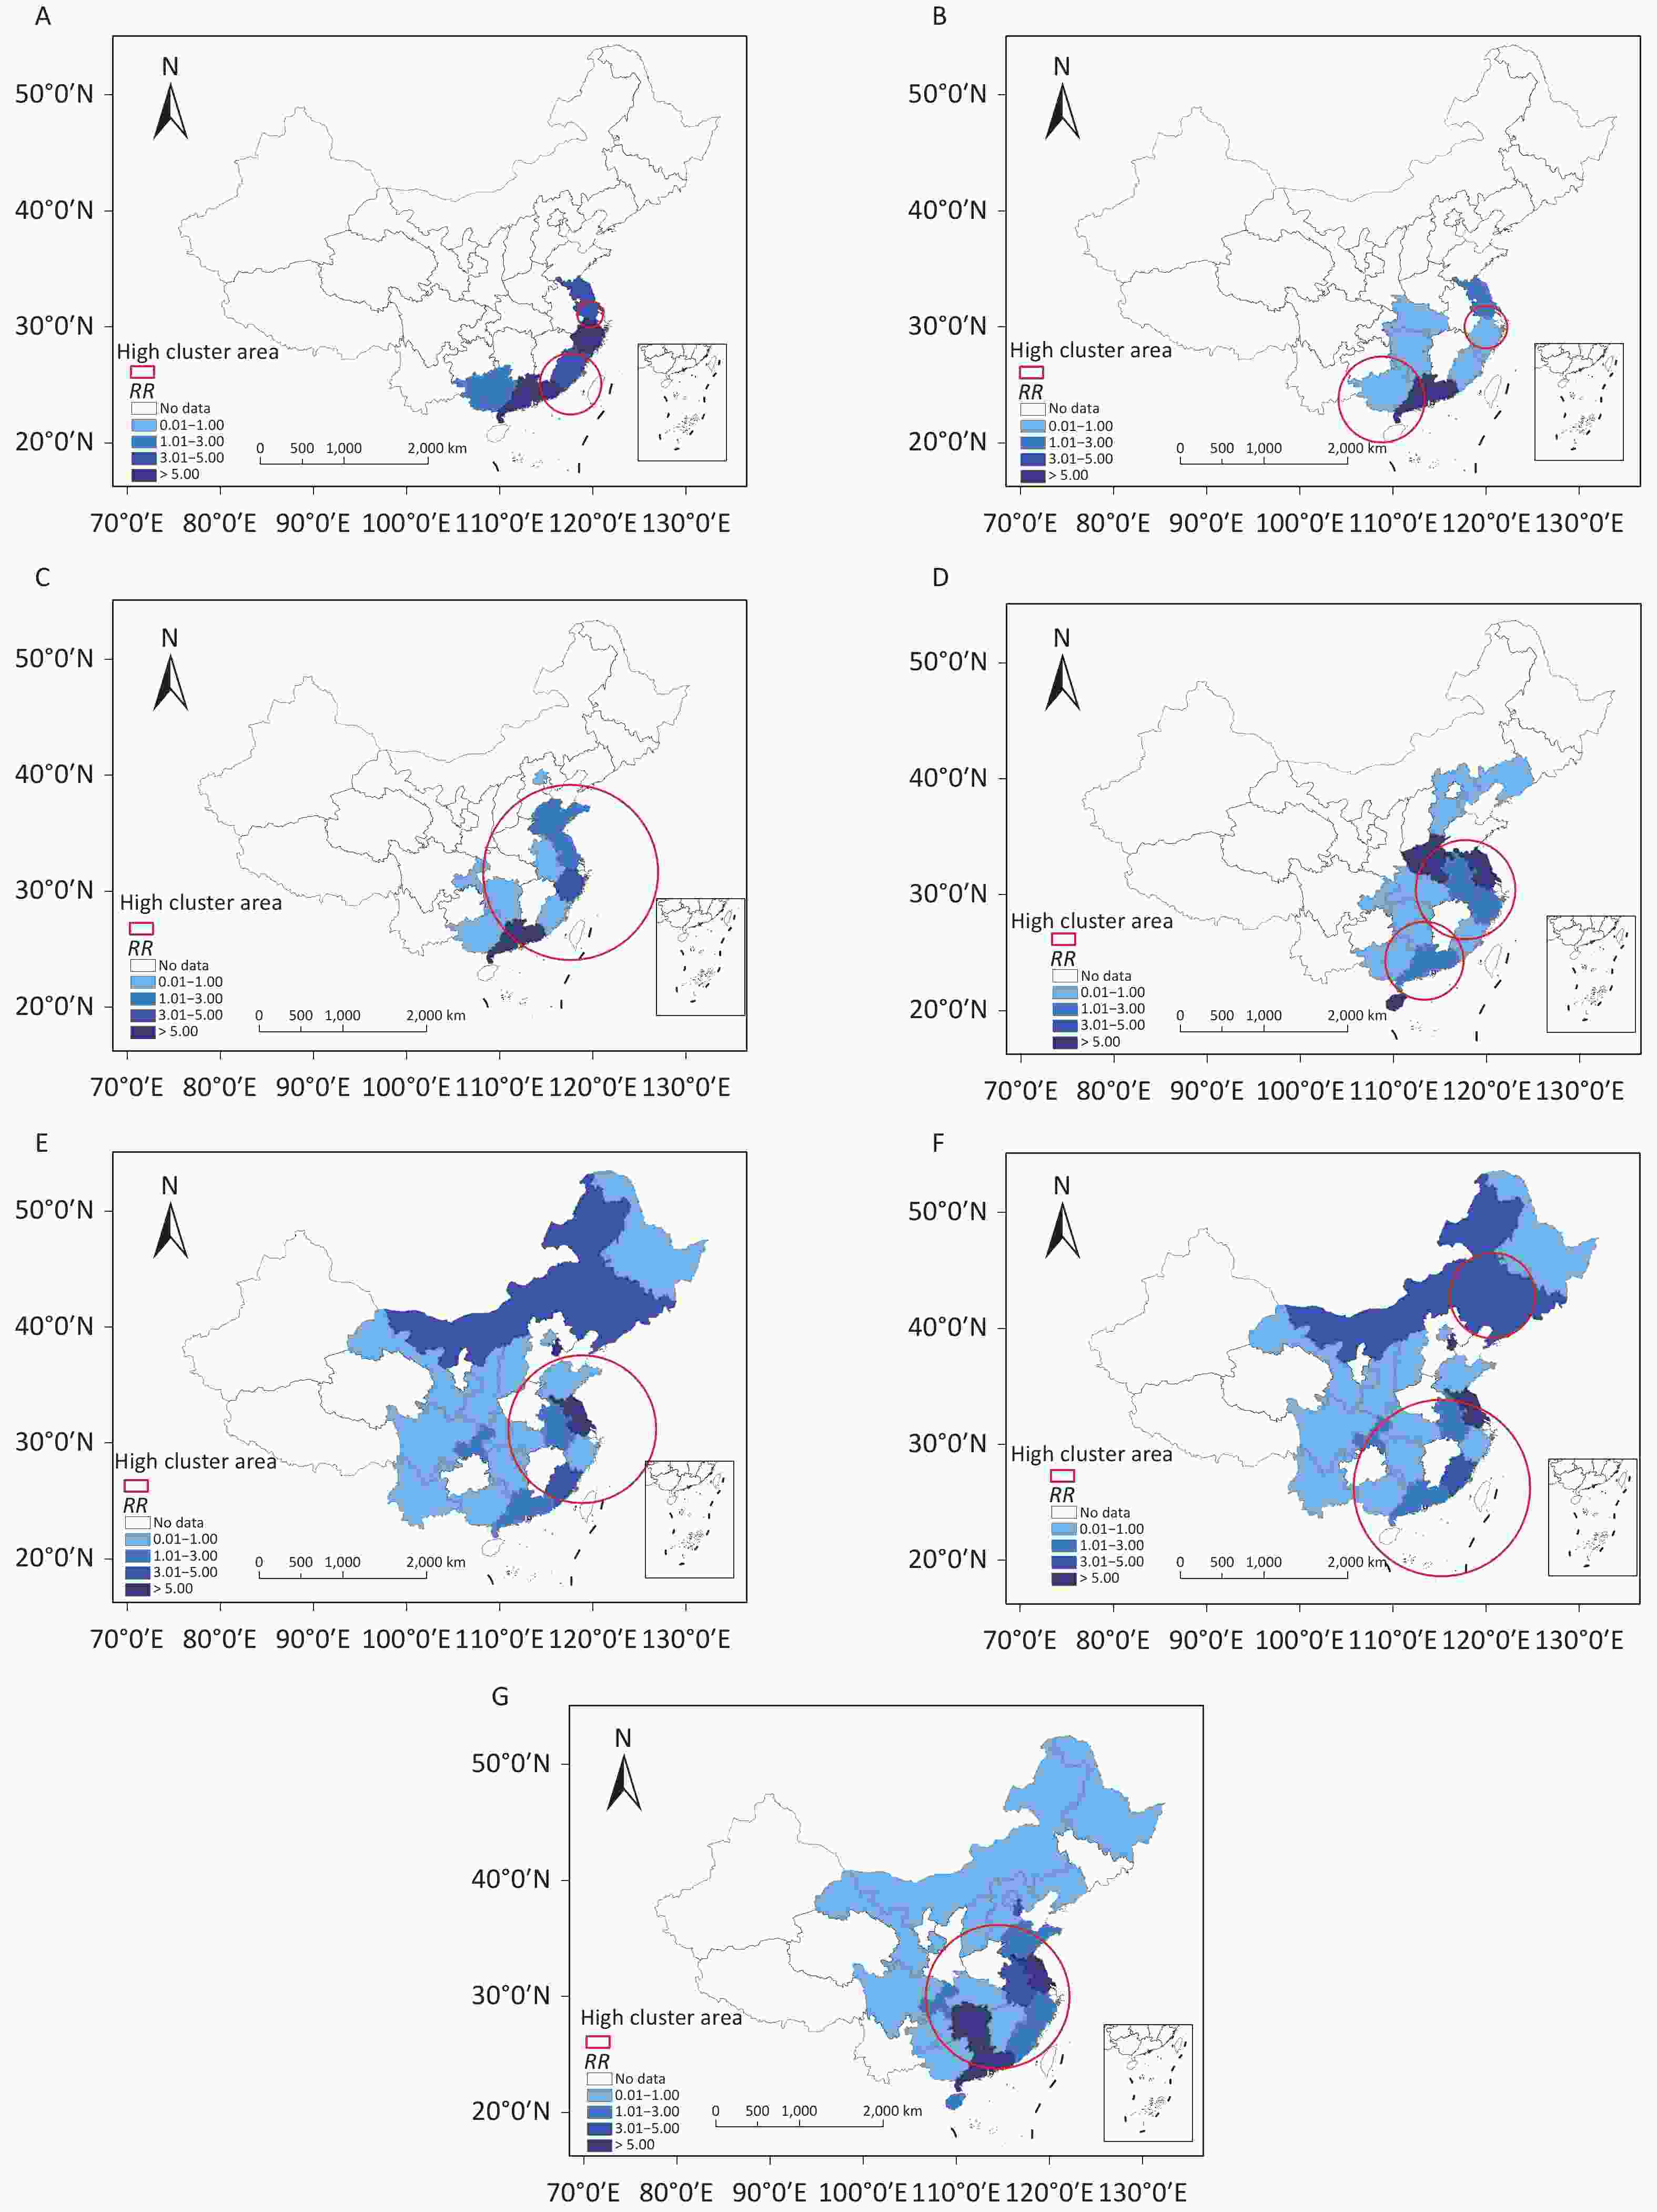
Figure 6. Spatiotemporal clustering of norovirus outbreaks in China in 2012 (A), 2013 (B), 2014 (C), 2015 (D), 2016 (E), 2017 (F), and 2018 (G).
In 2012 and 2013, only two highly clustered areas were observed in a relatively small area concentrated in Guangdong and Jiangsu. In 2014, the clustered area expanded, which contained most of the southern provinces. In 2015, it split into two clusters in Jiangsu and Guangdong again. The high aggregation areas in 2016 were similar to those in 2014, with more northern provinces included. In 2017, two highly clustered areas were observed, among which one was in the north and the other in the south. This is also the first year that shows a spatial cluster in North China since the implementation of NNDRS. Regarding provinces with the most cases reported in 2018, the highly clustered area included all southeast provinces and some central provinces. Considering the RR value, Guangdong and Jiangsu have the highest risks of human NoV outbreaks. In different years, some other provinces such as Zhejiang, Henan, Beijing, Hunan, and Hainan also showed higher RR values.
-
This study analyzed the epidemiological characteristics and spatiotemporal distribution patterns of NoV outbreaks in China from 2012 to 2018. In this period, the number of NoV outbreaks demonstrates an overall increasing trend, which is basically consistent with results from other studies performed in recent decades [19,23–25].
NoV outbreaks in China exhibited an increasing trend; thus, screening, preventive, control, and therapeutic interventions are needed, especially in high-risk areas such as southern and coastal areas in China. In this study, most NoV infections reported occurred in schools, especially in primary and middle schools. These findings were similar to the results in other Asian countries, such as Japan and South Korea [26,27], but different from those in America and Europe [28]. The most common outbreak sites of NoV in America and Europe were medical institutions, mainly sanatoriums and hospitals [28]. The data deficiency issue of nursing homes and medical institutions claimed by Jin et al. might explain the difference in the high-risk settings of NoV outbreaks in China and countries in America and Europe [29]. Another reason for the difference might be the higher population density in Asia, especially the density of students in schools. Students spend considerable time in crowded, enclosed classrooms where the virus can be transmitted easily through person-to-person contact. Moreover, NoVs can be present in the vomit of patients, which can contain hundreds of millions of virions[30] that can disperse in the air through aerosols, creating clusters of outbreaks; thus, once an individual infection occurs, it is likely to cause widespread transmission rapidly.
In this study, there was a clear seasonal trend in NoV outbreaks, as the number of NoV outbreaks increased in the winter and spring and decreased in summer, which is consistent with previous studies in other northern hemisphere countries [26,27,31]. A low temperature favors the survival of the NoV, which is the dominant influencing factor among all meteorological factors, explaining the strong seasonality [32]. The peak of accumulative cases occurred in March, which coincides with the back-to-school season in China, indicating that students returning to the classroom might increase their risk of infection. During this period, the cold weather and gatherings of students indoors significantly increase the probability of disease transmission.
In this study, significantly more outbreaks were reported in South China than in North China. According to Zhu et al., in developed countries, patients infected with NoV in low-income regions and healthcare facilities are younger, and the pathogen is more infectious [33]. However, historical NoV outbreaks are mainly concentrated in economically developed areas in Southeastern China, such as Guangdong and Jiangsu. According to statistics, cities in South China are generally more economically developed with high population density, implying abundant healthcare resources and a more comprehensive detection system for pathogens of infectious diseases compared with North China. Moreover, a dense population is attributed to more contact with other people and the environment in daily life, which facilitates the spread of NoVs. These differences in economic and social development might explain why the spatial distribution observed differs from previous studies. In addition, the difference might be caused by variations in eating habits and lifestyles in these two regions, which is consistent with the findings of Qin et al. [19]. Compared with residents in the north, the probability of eating raw foods (such as shellfish, vegetables, and fruits) is higher for those who live in southern and coastal areas, while these uncooked foods are a common cause of NoV outbreaks [34].
In the spatiotemporal aggregation analysis, the trend of highly clustered areas extending from the southern coast to the eastern coast and even some provinces in the north over time was found. A study of genomic diversity and phylogeography of NoV in China in 2017 reported that the migration patterns of GI and GII genogroups are roughly from south to north due to domestic poultry trade and population flow [35]. Based on a previous study [24], the spatial heterogeneity in NoVs is largely attributed to variations in environmental factors (e.g., temperature) and social scales (e.g., population density). Qin et al. [19] also found that a higher incidence might be related to climate, economic development level, and population density, which affect virus transmission and cause the spatial difference in NoV outbreaks. Moreover, with more healthcare facilities incorporated into NNDRS, newly reported outbreaks in areas other than the aforementioned 26 provinces might attribute to different modes of spatiotemporal aggregation.
Regarding the spatial epidemiological characteristics of NoV outbreaks and confirmed cases reported, it can be inferred in this study that schools and cities in Southeastern China are at a higher risk of NoV infections. Residents, students, faculties, and staff in these areas and specific settings should pay more attention to self-hygiene, and local policymakers should formulate targeted measures to prevent NoV transmission, especially in the cold season. Specifically, schools should improve health protection awareness of faculties and students, maintain good ventilation, and ensure food safety. A study conducted in schools suggests that strict hand hygiene and thorough disinfection of surfaces could reduce the likelihood of the virus spreading [36]. In addition, health promotion should be emphasized to curb virus transmission in high-risk areas and settings. Moreover, preventive measures should be required in other enclosed or semi-enclosed long-term care facilities, such as nursing homes and childcare facilities; for example, timely clean and disinfect public surfaces, educate staff, older people, and children to eat well-cooked food and drink boiled water.
-
In this study, the location, setting type, date, and number of confirmed cases of human NoV outbreaks reported were collected to analyze the epidemiological characteristics and spatiotemporal distribution in China from 2012 to 2018. The results of this study reveal the heterogeneity of NoV outbreaks and aggregation pattern of the NoV outbreaks reported in China, which is of great significance for precaution measure formulation and administrative management in settings with a higher risk of NoV infection. The following conclusions have been drawn:
(1) NoV outbreaks are on the rise in China, and the majority of confirmed cases occurred in schools. The transmission route was mainly through life contact.
(2) The NoV outbreaks show seasonality and north–south differentiation in China. In all reported NoV outbreaks, the accumulative cases in winter and spring are higher than in summer, and that in the south was higher than in the north. Both the spatial and temporal heterogeneity is significant.
(3) The highly clustered area first appeared in southern China, gradually extending to Eastern and Northern China with time. Up to 2018, nearly the entire southern region and part of the northern region in China have been involved in the hotspot of NoV outbreaks.
(4) To cope with NoV transmission in closed and semi-closed environments, it is necessary to implement precautions for people in high-risk areas and settings, such as hand hygiene, regular cleaning and disinfection, good ventilation, and health education.
-
ZHAI Meng Ying and WANG Lin conceived and designed the study. ZHAI Meng Ying and RAN Lu drafted the paper, and all authors critically revised the manuscript for important content and gave final approval for the version to be published. All authors agree to be accountable for all aspects of the work in ensuring that questions related to any part of the work are appropriately investigated and resolved. ZHAI Meng Ying and RAN lu contributed equally to this work.
doi: 10.3967/bes2023.007
Epidemiological Characteristics and Spatiotemporal Distribution Patterns of Human Norovirus Outbreaks in China, 2012–2018
-
Abstract:
Objective To clarify the epidemiological characteristics and spatial distribution patterns of human norovirus outbreaks in China, identify high-risk areas, and provide guidance for epidemic prevention and control. Methods This study analyzed 964 human norovirus outbreaks involving 50,548 cases in 26 provinces reported from 2012 to 2018. Epidemiological analysis and spatiotemporal scanning analysis were conducted to analyze the distribution of norovirus outbreaks in China. Results The outbreaks showed typical seasonality, with more outbreaks in winter and fewer in summer, and the total number of infected cases increased over time. Schools, especially middle schools and primary schools, are the most common settings of norovirus outbreaks, with the major transmission route being life contact. More outbreaks occurred in southeast coastal areas in China and showed significant spatial aggregation. The highly clustered areas of norovirus outbreaks have expanded northeast over time. Conclusion By identifying the epidemiological characteristics and high-risk areas of norovirus outbreaks, this study provides important scientific support for the development of preventive and control measures for norovirus outbreaks, which is conducive to the administrative management of high-risk settings and reduction of disease burden in susceptible areas. -
Key words:
- Norovirus outbreak /
- Epidemiological characteristics /
- Spatiotemporal heterogeneity /
- Spatiotemporal aggregation
&These authors contributed equally to this work.
注释:1) CONFLICTS OF INTEREST: -
Table 1. Number of confirmed norovirus cases by provinces in China from 2012 to 2018
Location Province 2012 2013 2014 2015 2016 2017 2018 Total North China Beijing 0 0 23 0 373 186 410 992 Gansu 0 0 0 0 0 19 85 104 Hebei 0 0 0 314 43 0 88 445 Henan 0 0 0 753 0 0 0 753 Heilongjiang 0 0 0 0 211 224 62 497 Jilin 0 0 0 0 0 1,617 0 1,617 Liaoning 0 0 0 58 0 295 32 385 Inner Mongolia 0 0 0 0 0 189 67 256 Shandong 0 0 417 0 68 836 1,040 2,361 Shanxi 0 0 0 0 0 82 121 203 Shaanxi 0 0 0 0 0 87 0 87 Tianjin 0 0 0 18 74 650 267 1,009 South China Anhui 0 0 82 131 182 1,120 1,013 2,528 Fujian 105 102 98 19 281 867 364 1,836 Guangdong 250 1,978 1,830 2,616 1,789 2,915 2,486 13,864 Guangxi 51 27 507 311 325 606 722 2,549 Guizhou 0 0 0 0 0 0 50 50 Hainan 0 0 0 256 131 0 102 489 Hubei 0 36 0 105 0 884 653 1,678 Hunan 0 164 323 224 297 229 1,278 2,515 Jiangsu 147 326 545 886 477 4,751 3,133 10,265 Jiangxi 0 0 0 0 0 0 151 151 Sichuan 0 0 0 0 0 12 302 314 Yunnan 0 0 0 0 0 33 0 33 Zhejiang 373 230 715 481 157 419 533 2,908 Chongqing 0 0 77 22 845 623 1,092 2,659 Total 926 2,863 4,617 6,194 5,253 16,644 14,051 50,548 -
[1] Glass RI, Parashar UD, Estes MK. Norovirus gastroenteritis. N Engl J Med, 2009; 361, 1776−85. doi: 10.1056/NEJMra0804575 [2] Razafimahefa RM, Ludwig-Begall LF, Thiry E. Cockles and mussels, alive, alive, oh-The role of bivalve molluscs as transmission vehicles for human norovirus infections. Transbound Emerg Dis, 2020; 67 Suppl 2, 9-25. [3] Siebenga JJ, Vennema H, Zheng DP, et al. Norovirus illness is a global problem: emergence and spread of norovirus GII. 4 variants, 2001-2007. J Infect Dis, 2009; 200, 802−12. doi: 10.1086/605127 [4] Patel MM, Widdowson MA, Glass RI, et al. Systematic literature review of role of noroviruses in sporadic gastroenteritis. Emerg Infect Dis, 2008; 14, 1224−31. doi: 10.3201/eid1408.071114 [5] Lopman BA, Steele D, Kirkwood CD, et al. The vast and varied global burden of norovirus: prospects for prevention and control. PLoS Med, 2016; 13, e1001999. doi: 10.1371/journal.pmed.1001999 [6] Chhabra P, Graaf M, Parra GI, et al. Corrigendum: updated classification of norovirus genogroups and genotypes. J Gen Virol, 2020; 101, 893. doi: 10.1099/jgv.0.001475 [7] Lin SC, Qu L, Ettayebi K, et al. Human norovirus exhibits strain-specific sensitivity to host interferon pathways in human intestinal enteroids. Proc Natl Acad Sci U S A, 2020; 117, 23782−93. doi: 10.1073/pnas.2010834117 [8] Lopman B, Vennema H, Kohli E, et al. Increase in viral gastroenteritis outbreaks in Europe and epidemic spread of new norovirus variant. Lancet, 2004; 363, 682−8. doi: 10.1016/S0140-6736(04)15641-9 [9] Yen C, Wikswo ME, Lopman BA, et al. Impact of an emergent norovirus variant in 2009 on norovirus outbreak activity in the United States. Clin Infect Dis, 2011; 53, 568−71. doi: 10.1093/cid/cir478 [10] Teunis PFM, Moe CL, Liu PB, et al. Norwalk virus: how infectious is it? J Med Virol, 2008; 80, 1468−76. [11] Park GW, Sobsey MD. Simultaneous comparison of murine norovirus, feline calicivirus, coliphage MS2, and GII. 4 norovirus to evaluate the efficacy of sodium hypochlorite against human norovirus on a fecally soiled stainless steel surface. Foodborne Pathog Dis, 2011; 8, 1005−10. doi: 10.1089/fpd.2010.0782 [12] Parrino TA, Schreiber DS, Trier JS, et al. Clinical immunity in acute gastroenteritis caused by Norwalk agent. N Engl J Med, 1977; 297, 86−9. doi: 10.1056/NEJM197707142970204 [13] Kabue JP, Meader E, Hunter PR, et al. Human Norovirus prevalence in Africa: a review of studies from 1990 to 2013. Trop Med Int Health, 2016; 21, 2−17. doi: 10.1111/tmi.12617 [14] Vinjé J. Advances in laboratory methods for detection and typing of norovirus. J Clin Microbiol, 2015; 53, 373−81. doi: 10.1128/JCM.01535-14 [15] Bartsch SM, Lopman BA, Ozawa S, et al. Global economic burden of norovirus gastroenteritis. PLoS One, 2016; 11, e0151219. doi: 10.1371/journal.pone.0151219 [16] Patel MM, Hall AJ, Vinjé J, et al. Noroviruses: a comprehensive review. J Clin Virol, 2009; 44, 1−8. doi: 10.1016/j.jcv.2008.10.009 [17] Centers for Disease Control and Prevention. Global burden of norovirus and prospects for vaccine development. https://www.cdc.gov/norovirus/trends-outbreaks/worldwide.html. Published January 5, 2017. [18] Liao QH, Ran L, Jin M, et al. Guidelines on outbreak investigation, prevention and control of norovirus infection (2015). Chin J Viral Dis, 2016; 50, 7−16. (In Chinese [19] Qin SW, Chan TC, Cai J, et al. Genotypic and epidemiological trends of acute gastroenteritis associated with noroviruses in China from 2006 to 2016. Int J Environ Res Public Health, 2017; 14, 1341. doi: 10.3390/ijerph14111341 [20] Robilotti E, Deresinski S, Pinsky BA. Norovirus. Clin Microbiol Rev, 2015; 28, 134−64. doi: 10.1128/CMR.00075-14 [21] Belliot G, Lopman BA, Ambert-Balay K, et al. The burden of norovirus gastroenteritis: an important foodborne and healthcare-related infection. Clin Microbiol Infect, 2014; 20, 724−30. doi: 10.1111/1469-0691.12722 [22] Liu K, Huang SC, Miao ZP, et al. Identifying potential norovirus epidemics in China via internet surveillance. J Med Internet Res, 2017; 19, e282. doi: 10.2196/jmir.7855 [23] Guo XH, Kan Z, Liu BW, et al. A foodborne acute gastroenteritis outbreak caused by GII. P16-GII. 2 norovirus in a boarding high school, Beijing, China: a case-control study. BMC Res Notes, 2018; 11, 439. doi: 10.1186/s13104-018-3532-1 [24] Zhou HL, Wang SM, von Seidlein L, et al. The epidemiology of norovirus gastroenteritis in China: disease burden and distribution of genotypes. Front Med, 2020; 14, 1−7. doi: 10.1007/s11684-019-0733-5 [25] Lian YY, Wu SY, Luo L, et al. Epidemiology of norovirus outbreaks reported to the public health emergency event surveillance system, China, 2014-2017. Viruses, 2019; 11, 342. doi: 10.3390/v11040342 [26] Thongprachum A, Khamrin P, Maneekarn N, et al. Epidemiology of gastroenteritis viruses in Japan: prevalence, seasonality, and outbreak. J Med Virol, 2016; 88, 551−70. doi: 10.1002/jmv.24387 [27] Kim JG, Kim JS, Kim JG. Characteristics of norovirus food poisoning outbreaks in Korea in the 2000s. J Food Prot, 2021; 84, 472−80. doi: 10.4315/JFP-20-093 [28] van Beek J, de Graaf M, Al-Hello H, et al. Molecular surveillance of norovirus, 2005-16: an epidemiological analysis of data collected from the NoroNet network. Lancet Infect Dis, 2018; 18, 545−53. doi: 10.1016/S1473-3099(18)30059-8 [29] Jin M, Wu SY, Kong XY, et al. Norovirus outbreak surveillance, China, 2016-2018. Emerg Infect Dis, 2020; 26, 437−45. doi: 10.3201/eid2603.191183 [30] Makison Booth C, Frost G. Potential distribution of viable norovirus after simulated vomiting. J Hosp Infect, 2019; 102, 304−10. doi: 10.1016/j.jhin.2019.02.010 [31] Hall AJ, Lopman BA, Payne DC, et al. Norovirus disease in the United States. Emerg Infect Dis, 2013; 19, 1198−205. doi: 10.3201/eid1908.130465 [32] Wang J, Deng ZQ. Modeling and prediction of oyster norovirus outbreaks along gulf of mexico coast. Environ Health Perspect, 2016; 124, 627−33. doi: 10.1289/ehp.1509764 [33] Zhu X, Jin M, Duan DZ. Research progress on the epidemiology and disease burden of norovirus. Dis Surveill, 2021; 36, 769−73. (In Chinese [34] Chenar SS, Deng ZQ. Hybrid modeling and prediction of oyster norovirus outbreaks. J Water Health, 2021; 19, 254−66. doi: 10.2166/wh.2021.251 [35] Qiao N, Ren H, Liu L. Genomic diversity and phylogeography of norovirus in China. BMC Med Genomics, 2017; 10, 51. doi: 10.1186/s12920-017-0287-9 [36] Venuto M, Garcia K. Analyses of the contributing factors associated with foodborne outbreaks in school settings (2000-2010). J Environ Health, 2015; 77, 16−20. -


 下载:
下载:



 Quick Links