

 下载:
下载:

-
Tuberculosis (TB) is an infectious disease caused by Mycobacterium tuberculosis and is primarily transmitted via the respiratory system. TB is a significant infectious disease and a leading cause of mortality globally[1]. According to the Global Tuberculosis Report 2023, an estimated 10.6 million new cases of tuberculosis occurred worldwide in 2022, reversing the multiyear downward trend observed until 2020. Of these cases, 1.3 million deaths were attributable to TB. Globally, the TB situation remains severe. China is the world's second-largest TB-burdened country, with an estimated 748,000 new TB cases in 2022, down from 780,000 in 2021, and a TB incidence rate of 52 per 100,000, down from 55 per 100,000 in 2021[2]. Significant strides have been made in the prevention and control of TB in China; however, the rate of incidence has remained gradual. In 2014, the World Health Organization introduced its 'Stop TB' strategic plan, aiming to reduce the global incidence of tuberculosis to less than 10 per 100,000 by 2035[3]. Based on the current downward trend in tuberculosis incidence, China will be unable to achieve its control targets by 2035[4].
Socioeconomic factors play a significant role in TB transmission and treatment of TB. Siroka et al. identified an inverse correlation between social protection spending and TB incidence, prevalence, and mortality[5]. A study conducted in Shandong, China, found that residents' income, medical resources, and population density were closely associated with the incidence of TB[6]. Populations with poor living conditions and limited access to healthcare facilities have a higher incidence of TB[7]. Similarly, a study in Baoshan District, Shanghai, found that per capita Gross Domestic Product (GDP), native-to-total population ratio, and the lowest society guarantee rate were significantly associated with the TB risk class among community residents[8]. These conditions, often resulting from a low socioeconomic status, significantly increase the susceptibility to TB infection.
Although the influence of socioeconomic factors on TB prevalence has been documented, the potential for spatiotemporal autocorrelation has not been extensively explored. Previous studies have shown that TB exhibits significant spatial and temporal clustering[9,10]. Given the variability in TB incidence and the corresponding socioeconomic conditions at the city level, elucidating these dynamics is crucial for enhancing local prevention and control strategies. Several traditional statistical models, including logistic regression, operate under the assumption of independent observations, thereby constraining the depth of inferences drawn from such modeling approaches[11]. A study that simultaneously integrates spatial and temporal factors would provide a better understanding of the association between socioeconomic factors and TB incidence. The ST-CAR model (ST-CAR), which operates within a Bayesian framework, captures simultaneous spatial and temporal nuances, offering the distinct advantage of generating more robust results by harnessing the collective strength of adjacent data points in both spatial and temporal dimensions. Notably, this model has proven effective in delineating time-variant interactions between meteorological variables, socioeconomic determinants, and infectious diseases[9,12].
Guangdong Province, located in southern China, is the largest province in terms of economy and population, with a population of 120 million. Guangdong Province also has the highest number of TB cases in China[13]. Based on surveillance data collected from 21 cities between 2010 and 2019, we employed the ST-CAR model to quantitatively estimate the impact of socioeconomic factors on TB incidence in Guangdong Province. This analysis allowed us to assess trends and regional risks of TB epidemics and our study findings provide critical evidence-based insights for TB prevention and control strategies.
-
We obtained annual data on TB cases in 21 cities in Guangdong Province from 2010 to 2019 through the online National Notifiable Infectious Diseases Reporting Information System (NNIDRIS).
-
Annual mean temperatures of the 21 cities were collected from the National Meteorological Information Center website (http://www.nmic.cn). If more than one monitoring station was identified in a city, the average value of all monitoring stations in that city was used to represent the annual mean temperature. Annual data on particulates smaller than 2.5 μm in aerodynamic diameter (PM2.5) for each city during the same period were retrieved from the National Urban Air Quality Real-time Publishing Platform (https://air.cnemc.cn:18007/).
-
The socioeconomic data, including population density, per capita Gross Domestic Product (GDP), ratio of health technical personnel to the population (per 1,000 people), ratio of licensed physicians and physician assistants to the population (per 1,000 people), and per capita local general public expenditure (measured in 1,000 Yuan) for the 21 cities of Guangdong Province, were collected from the Guangdong Statistical Yearbook and government reports (http://stats.gd.gov.cn/gdtjnj/).
-
We used the mean, standard deviation (SD), minimum, maximum, 25th percentile (P25), 50th percentile (P50), and 75th percentile (P75) to describe the distribution of TB, meteorological, air pollution, and socioeconomic data in Guangdong Province. Spearman’s correlation analysis was applied to obtain the correlation coefficients for population density, per capita GDP, ratio of health technical personnel to the population (per 1,000 individuals), ratio of licensed physicians and physician assistants to the population (per 1,000 individuals), per capita local general public expenditure (measured in 1,000 yuan), mean annual temperature, and mean annual PM2.5
Furthermore, we plotted the geographical distribution of TB cases and heat maps of Guangdong Province. Additionally, we used hierarchical agglomerative clustering to analyze TB incidence clusters in 21 cities in Guangdong Province.
-
The incidence of TB at a specific location can be influenced by various potential factors, including the epidemics in the surrounding areas during both the current and past periods. These complex spatial and spatiotemporal processes can be effectively modeled using Conditional Autoregressive (CAR) models within a Bayesian framework. We used the ST-CAR model to evaluate the spatiotemporal effects of social and environmental factors on TB incidence. The ST-CAR model has been widely employed to capture the time-varying nature of influencing variables associated with infectious diseases[14,15]. It can estimate the TB risk associated with social environmental factors by including spatiotemporal random effects to represent potential sources of variation that are unobserved and unmeasured in spatial and temporal dependency structures.
First, we applied a generalized linear regression model to test for spatial autocorrelation. Subsequently, we constructed an adjacency weight matrix Wij for 21 cities based on Rook’s case, where 1 and 0 indicate whether cities i and j share a border[16]. This matrix was then incorporated into a generalized linear regression model. Moran’s I was used to detect residual spatiotemporal correlations in the model for each year.
Finally, we used a CAR Bayesian model, including spatiotemporal random effects, to quantify the impact of social and environmental factors on TB incidence. Bayesian regressive models[17] were linked by a Poisson distribution, as the TB cases followed a Poisson distribution. The CAR model was selected to provide a prior distribution for uij. It introduces temporal and spatial autocorrelations through conditional expectation and precision matrices, respectively[17]. The temporal structure of the random effect followed a first-order autoregressive process, whereas the spatial structure evolved over time[17]. The CAR distributions indicate that adjacent variables in space or time are conditionally autocorrelated, whereas nonadjacent variables are conditionally independent. Markov chain Monte Carlo (MCMC) simulations were used to draw samples from the posterior distributions.
The univariate and multivariate models are presented as follows:
$$ {Y}_{ij}–Poision\left({E}_{ij}{R}_{ij}\right) $$ (1) $$ Log\left({R}_{ij}\right)={\beta }_{0}+{\beta }_{1}\times {Variable}_{ij}+offset\left(POP\right) +{u}_{ij} $$ (2) $$ \begin{aligned} Log\left({R}_{ij}\right)=&{\beta }_{0}+{\beta }_{1}\times {Pub\_exp}_{ij}+{\beta }_{2}\times {Density}_{ij}+{\beta }_{3}\times \\ &{GDP}_{ij}+{\beta }_{4}\times {Bed}_{ij}+{\beta }_{5}\times {Physician}_{ij}+{\beta }_{6}\times\\ & {Tem}_{ij}+{\beta }_{7}\times {PM}_{ij}{+\beta }_{8}\times {Tech}_{ij}+month+\\ &offset\left(POP\right) +{u}_{ij} \end{aligned} $$ (3) where Yij represents the observed number of TB cases in city i and year j, Eij denotes the expected number of TB cases, and Rij indicates the relative risk (RR) in city i and year j.
In the univariate model, β0 represents the intercept, while β1 denotes the coefficient for one of the following variables: per capita GDP, population density, the ratio of licensed physicians and physician assistants to the population (per 1,000 individuals), the ratio of health technical personnel to the population (per 1,000 individuals), per capita local general public expenditure (measured in 1,000 Yuan), mean annual temperature, and mean annual PM2.5 levels for city i in year j.
In the multivariate model, β0 represents the intercept, while β1, β2, β3, β4, β5, β6, β7 and 8 are the coefficients for the following variables: per capita local public expenditure (measured in 1,000 Yuan), population density, per capita GDP, physician-to-population ratio (per 1,000 individuals), mean annual temperature, mean annual PM2.5, and technical health personnel-to-population ratio (per 1,000 individuals) for city i in year j. The term uij represents the proper CAR spatiotemporal random effect, accounting for the residual spatiotemporal autocorrelation after adjusting for known covariates[17].
In this study, the model was executed for over 60,000 iterations. The initial 6000 MCMC samples were discarded during the burn-in period, and the remaining samples were subsequently thinned by a factor of 10 to reduce the autocorrelation of the Markov chain. The deviance information criterion (DIC) was used to assess the model fit. The results are presented as relative risk (RR) and 95% confidence interval (95%CI) per interquartile range (IQR).
-
To further explore the temporal and regional risks of TB transmission over multiple years, we calculated the temporal trends of TB and identified the regions with the highest risk using the ST-CAR model. This analysis was conducted according to Lee’s approach[18]. In this study, the estimated risk of TB epidemics is represented by the expected incidence of TB.
-
A series of sensitivity analyses were conducted. First, parameters in the prior distribution of spatial structure were changed into τ~ Gamma (0.1, 0.01), τ~ Gamma (0.1, 0.1), and τ~ Gamma (1, 0.01) in the STCAR model. Second, we focused on social environmental factors in the model, excluding temperature and air pollution. Moreover, we used social environment factors lagged by one and two years to test the robustness of our results. In addition, we incorporated socioeconomic factors into the model after logarithmic transformation and normalization. The covariates were normalized as $ \dfrac{X-min\left(X\right)}{max\left(X\right)-min\left(X\right)} $.
All the analyses were performed using R (version 4.2.1) with the “CARBayesST” package to implement the ST-CAR model. Statistical tests were two-sided, and statistical significance was set at P < 0.05.
-
From 2010 to 2019, 801,939 TB cases were reported in the Guangdong Province. Table 1 presents a description of TB incidence, along with demographic and economic indicators, across 21 cities in the Guangdong Province from 2010 to 2019 (Table 1). Overall, there was considerable variation in the number of TB incidence cases, socioeconomic factors, temperature, and PM2.5 levels across the 21 cities and over different years.
Table 1. Basic information on TB incidence cases, socioeconomic factors, temperature and PM2.5 in 21 cities in Guangdong Province, 2010-2019
Variables Mean ± SD Min P25 P50 P75 Max TB incidence cases (persons) 3,819 ± 2,144 1,135 2,358 3,494 4,716 13,238 Population density (persons/km2) 1,172.24 ±
1,349.97153.94 306.25 549.59 1,782.32 6,727.91 Per capita GDP (*1,000 Yuan) 53.20 ± 34.06 14.20 28.83 40.05 68.43 157.81 Licensed physicians & physician assistants (/1,000 people) 1.89 ± 0.48 1.05 1.55 1.81 2.12 3.32 health technical personnel (/1,000 people) 5.06 ± 1.47 2.08 3.98 4.96 5.82 9.18 Local general public expenditure per capita (*1,000 Yuan) 7.67 ± 5.07 1.61 4.47 6.50 9.30 28.94 Annual mean temperature (°C) 22.43 ± 0.96 19.78 21.91 22.57 23.10 25.12 Annual mean PM2.5 (ug/m3) 27.41 ± 6.18 15.47 21.91 27.35 32.20 39.82 -
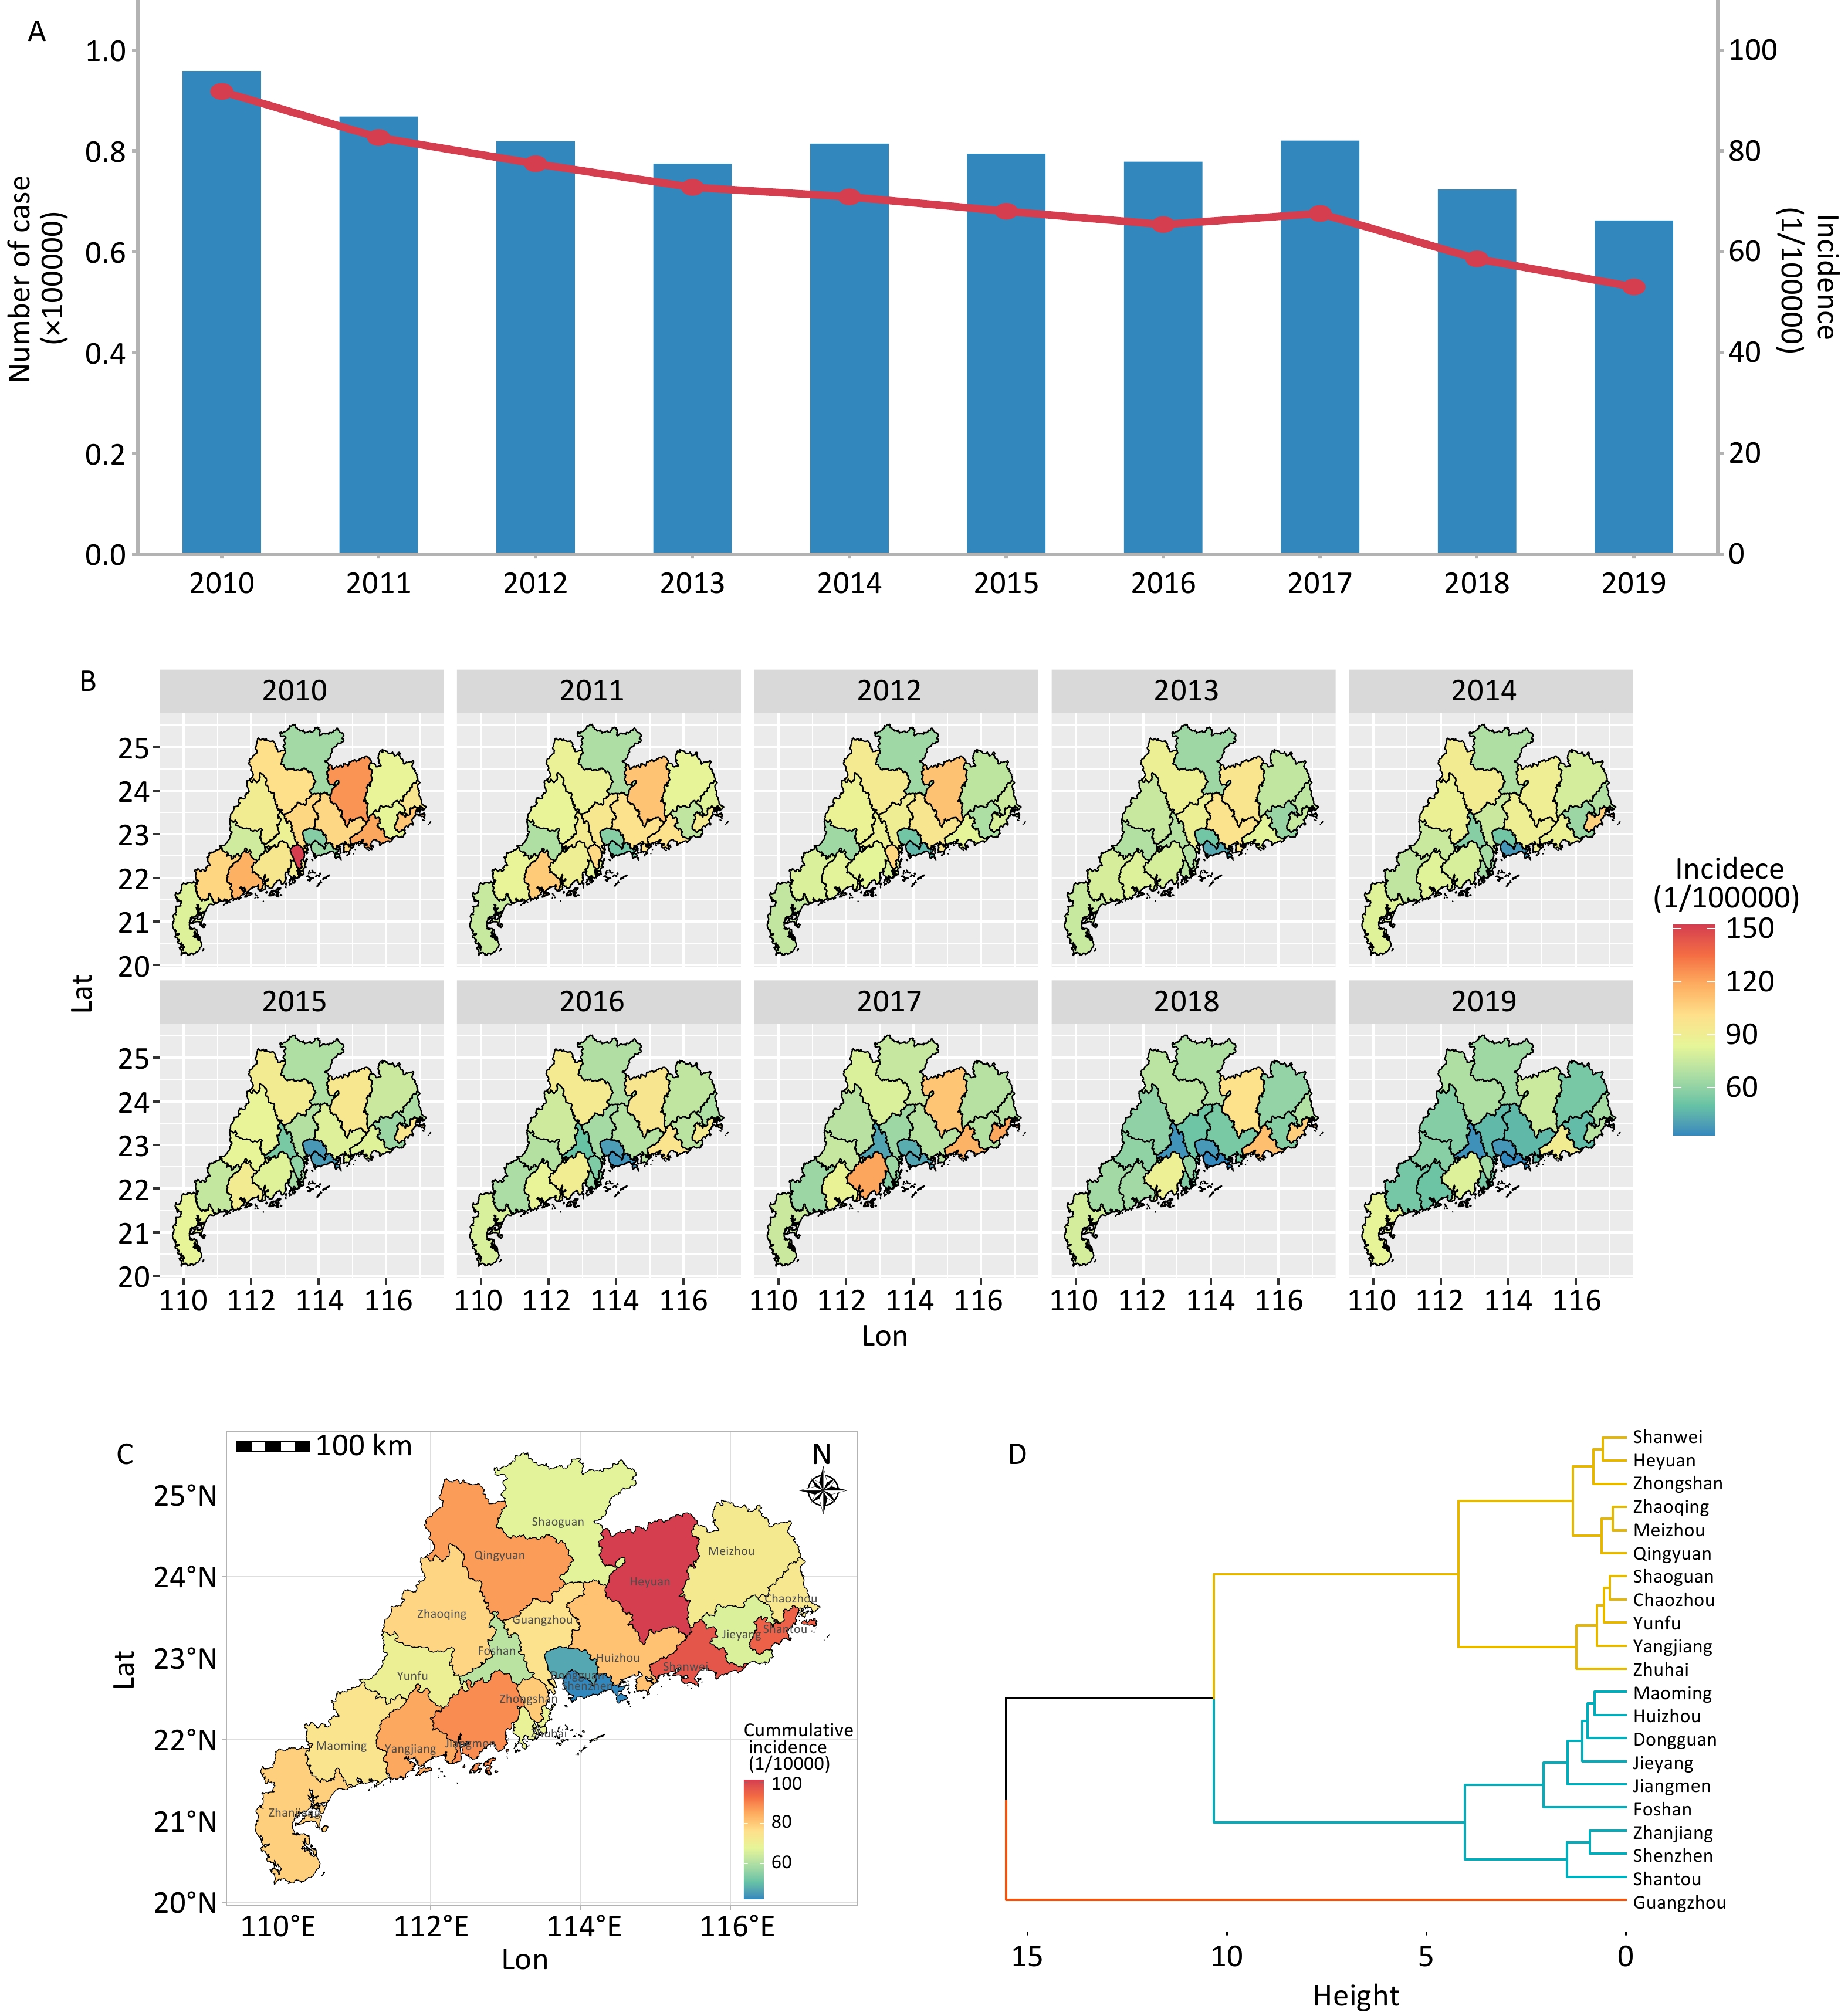
The annual incidence of TB in Guangdong decreased from 91.85 per 100,000 individuals in 2010 to 53.06 per 100,000 individuals in 2019 (Figure 1A). For each city, the annual incidence of TB also declined significantly in 2019 compared with that in 2010, particularly in Jiangmen, Heyuan, and Shantou (Figure 1B).
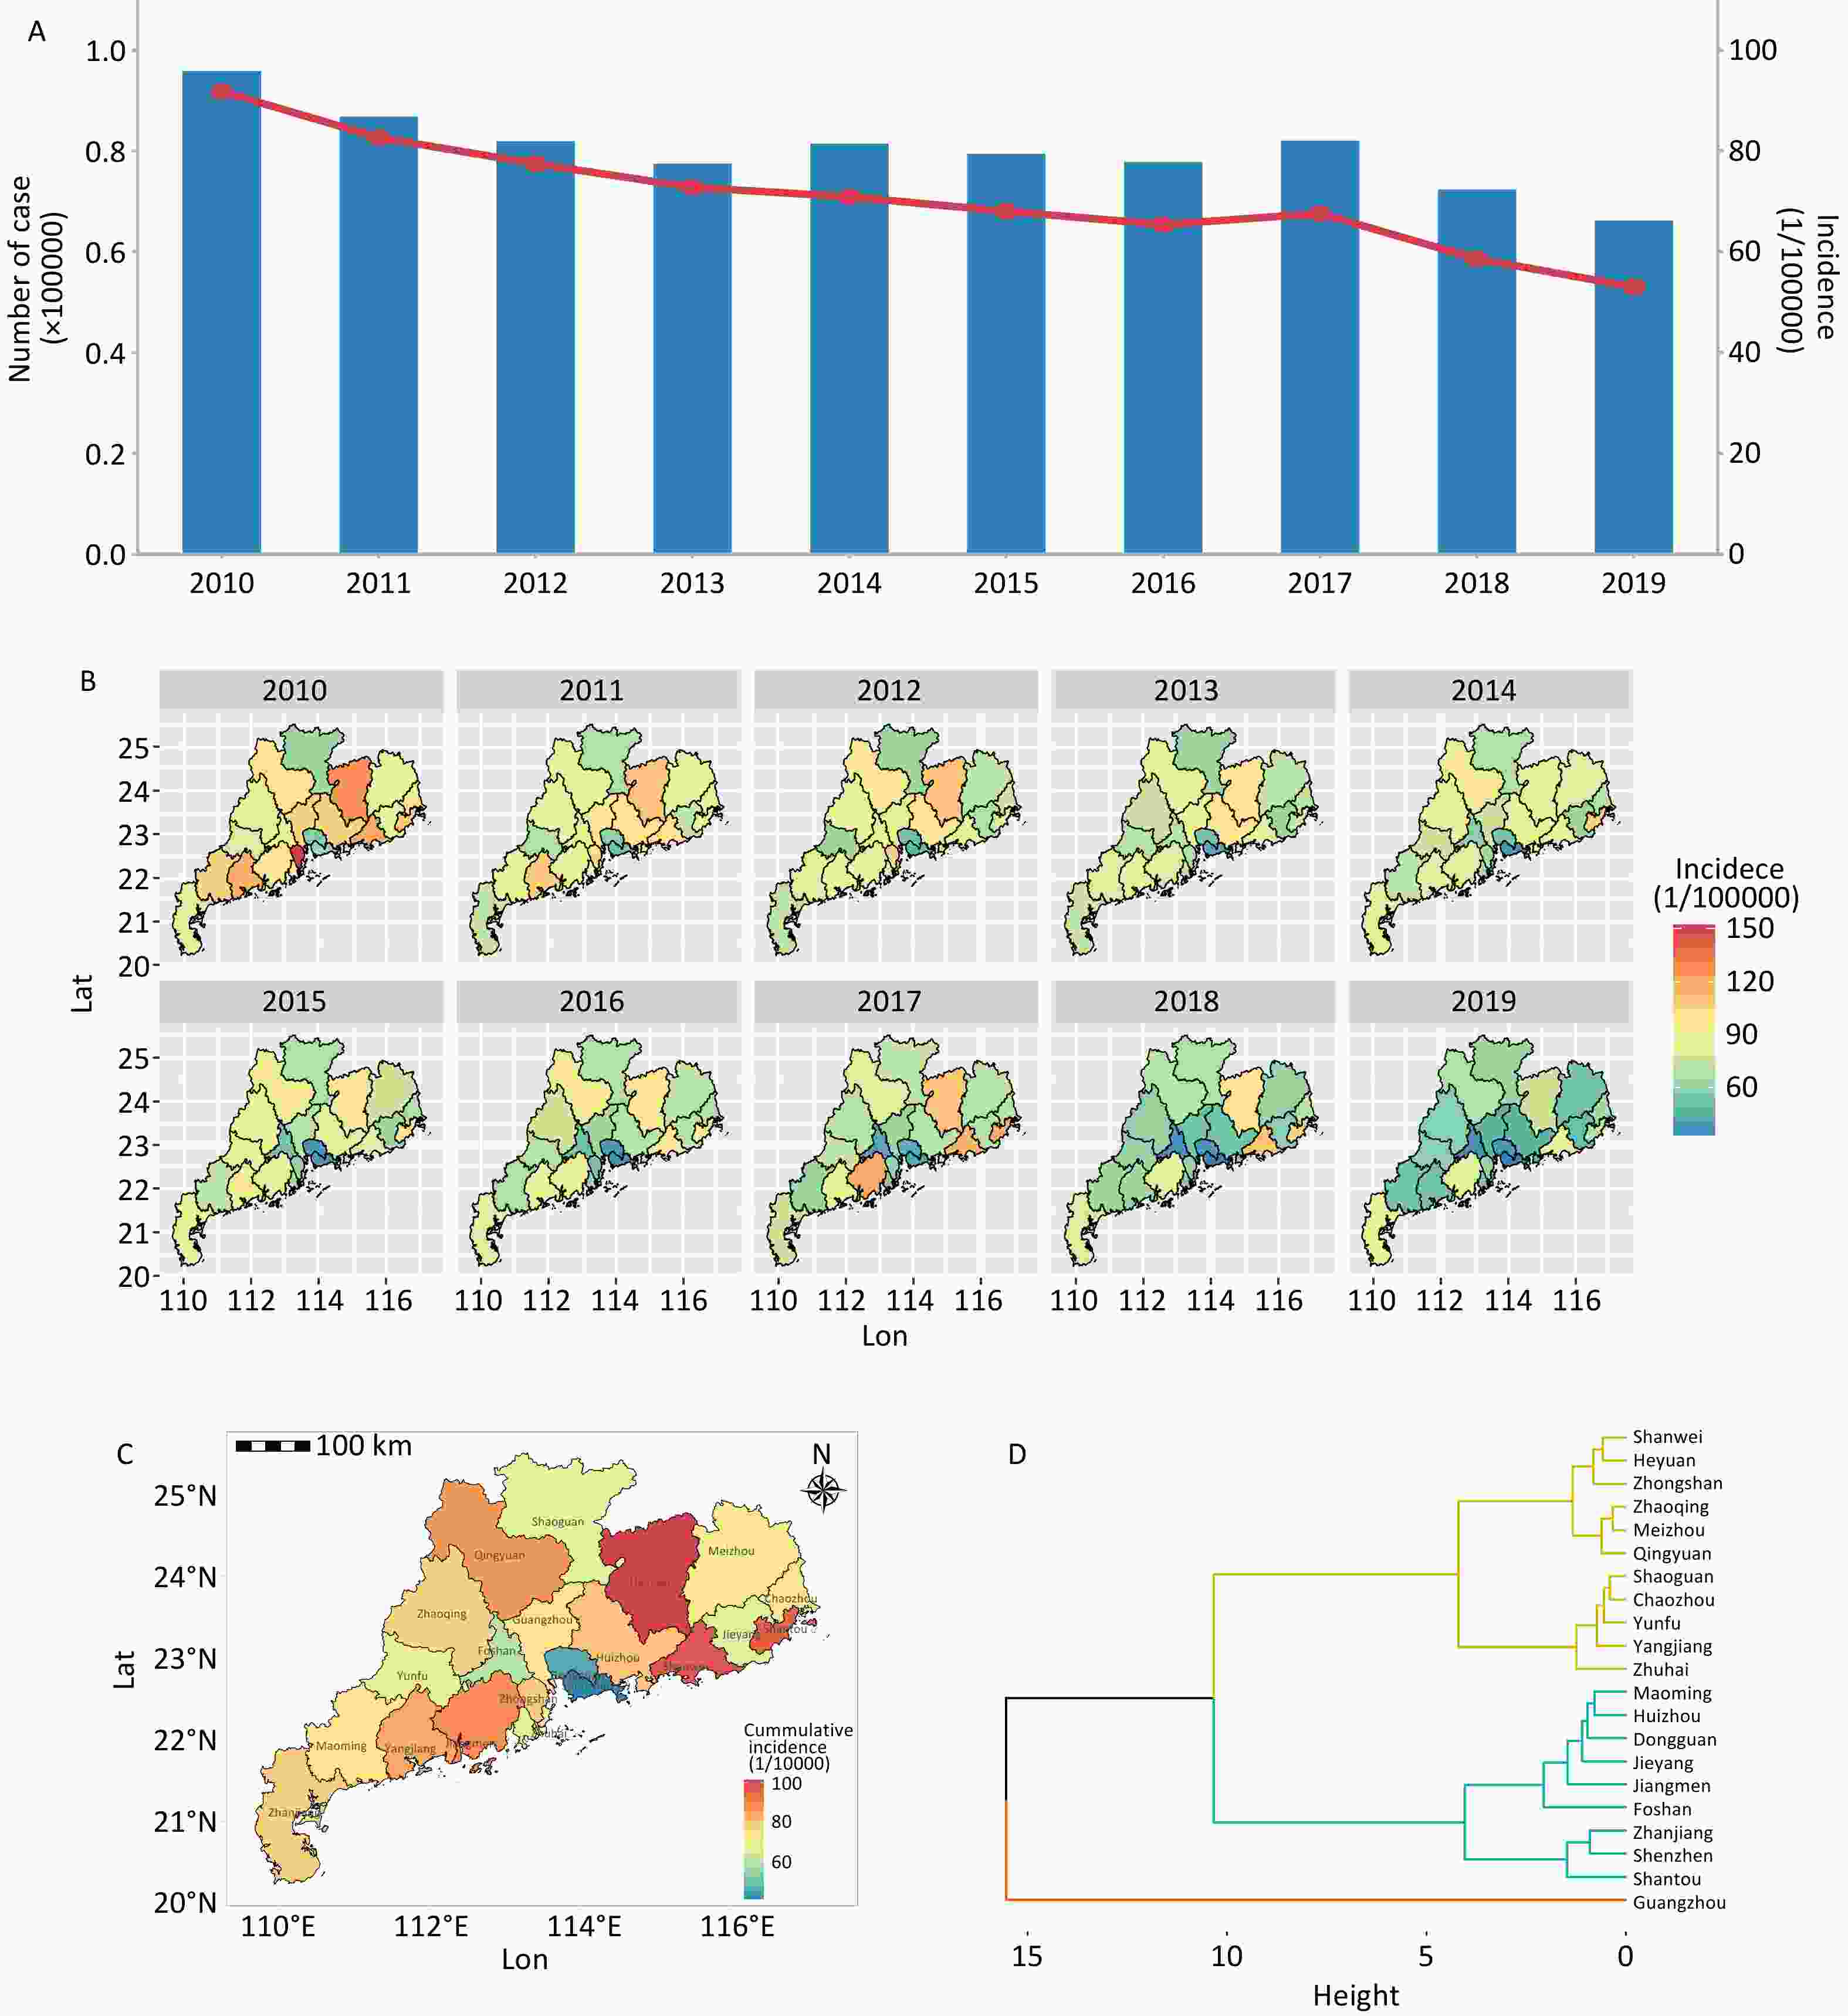
Figure 1. Characteristics of spatial and temporal distribution of TB incidence in Guangdong Province, 2010-2019. GS(2020)4619.
In terms of the spatial distribution of the cumulative incidence from 2010 to 2019, Heyuan (101.49 per 100,000 people), Shanwei (97.32 per 100,000 people), and Shantou (95.22 per 100,000 people) were the three cities with the highest cumulative incidences, clustered in the northeastern part of Guangdong Province. Shenzhen (41.22 per 100,000 people), Dongguan (46.42 per 100,000 people), and Foshan (59.33 per 100,000 people) were the three cities with the lowest cumulative incidences clustered in the Pearl River Delta region (Figure 1C).
The incidence of TB from 2010 to 2019 in each city was categorized into four clusters: (1) Shenzhen and Dongguan; (2) Zhongshan, Foshan, Yangjiang, Qingyuan, Huizhou, and Guangzhou; (3) Zhaoqing, Meizhou, Zhuhai, Maoming, Chaozhou, Zhanjiang, Yunfu, Shaoguan, and Jieyang; and (4) Shanwei, Jiangmen, Shantou, and Heyuan (Figure 1D).
-
Owing to the potential correlations among some social environment indicators, Spearman’s correlation was initially used to calculate the correlation coefficients among the variables. Variables with significant collinearity were excluded from the same model based on the significance of the correlation coefficients (Supplementary Figure S1). The correlation coefficients between the number of technical health personnel (per 1,000 people), the number of licensed physicians and physician assistants (per 1,000 people), and local general public expenditure per capita (1,000 yuan) ranged from 0.68 0.88. Therefore, these variables were excluded from multivariate analysis.
In the spatial autocorrelation analysis, Moran’s I test was significant (P < 0.05) for most of the study years. Generally, the impact of social environment on TB may be influenced by spatial autocorrelation, which should be adjusted in the ST-CAR model.
In the univariate ST-CAR model, population density was negatively associated with the TB risk (RR, 0.86; 95% CI: 0.74–0.86), similar associations were identified for per capita GDP (RR, 0.81; 95% CI: 0.77–0.85), the number of health technical personnel per 1,000 population (RR, 0.88; 95% CI: 0.84–0.92), the number of licensed physicians & physician assistants per 1,000 population (RR, 0.87; 95% CI: 0.82–0.91), local general public expenditure per capita (RR, 0.87; 95% CI, 0.84–0.91) and annual mean temperature (RR, 0.90; 95% CI: 0.86–0.94), but not annual mean PM2.5 (RR, 1.01; 95% CI: 0.94–1.10). In the multivariate model, per capita GDP (RR, 0.91; 95% CI: 0.86–0.98), the number of licensed physicians & physician assistants per 1,000 population (RR, 0.94; 95% CI: 0.90–0.98) and local general public expenditure per capita (RR, 0.94; 95% CI: 0.90–0.97) were significantly associated with the decreased TB incidence. Marginal effects were observed for population density (RR,0.86; 95% CI: 0.86–1.00). However, no significant effects were found on the number of health technical personnel, annual mean temperature, or PM2.5. The risk of TB and deviance information criterion (DIC) values derived from the social environment of the 21 cities in Guangdong Province in the ST-CAR model are presented in Table 2.
Table 2. The results of univariate and multivariate ST-CAR models on the risk of TB derived by social environment
Variables IQR RR (95%CI) DIC values Univariate
modelMultivariate
modelUnivariate
modelMultivariate
modelPopulation density 1476.07 0.86 (0.74–0.86) 0.86 (0.86–1.00)a 2510.83 2508.93a Per capita GDP (1,000 Yuan) 39.60 0.81 (0.77–0.85) 0.91 (0.86–0.98)a 2510.80 2508.93a Number of licensed physicians & physician assistants
(/1,000 people)0.58 0.87 (0.82–0.91) 0.94 (0.90–0.98)a 2510.30 2508.93a Number of health technical personnel (/1,000 people) 1.83 0.88 (0.84–0.92) 0.95 (0.88–1.02)b 2510.96 2509.96c Local general public expenditure per capita (1,000 Yuan) 4.83 0.87 (0.84–0.91) 0.94 (0.90–0.97)c 2511.40 2508.96c Annual mean temperature (°C) 1.18 0.90 (0.86–0.94) 0.99 (0.95–1.03)a 2512.77 2508.93a Annual mean PM2.5 (ug/m3)* 6.70 1.01 (0.94–1.10) 0.97 (0.92–1.04)d 1249.49 2508.93d Note. *Data on annual mean PM2.5, available from 2015-2019 to. IQR: interquartile range.a Adjusted for population density, per capita GDP, number of licensed physicians and physician assistants (/1,000 people), and annual mean temperature. b bAdjusted for population density, per capita GDP, number of health technical personnel (per 1,000 people), and annual mean temperature. c was adjusted for population density, per capita GDP, local general public expenditure per capita, annual mean temperature, and annual mean PM2.5. d Adjusted for population density, per capita GDP, number of licensed physicians and physician assistants (/1,000 people), annual mean temperature, and annual mean PM2.5. In the sensitivity analyses, the results did not change substantially after modifying the model parameters (Supplementary Table S1), excluding natural environmental factors (temperature and PM2.5) (Supplementary Table S2), using different lag periods (Supplementary Table S3), logarithmic transformation (Supplementary Table S4), and data normalization (Supplementary Table S5).
-
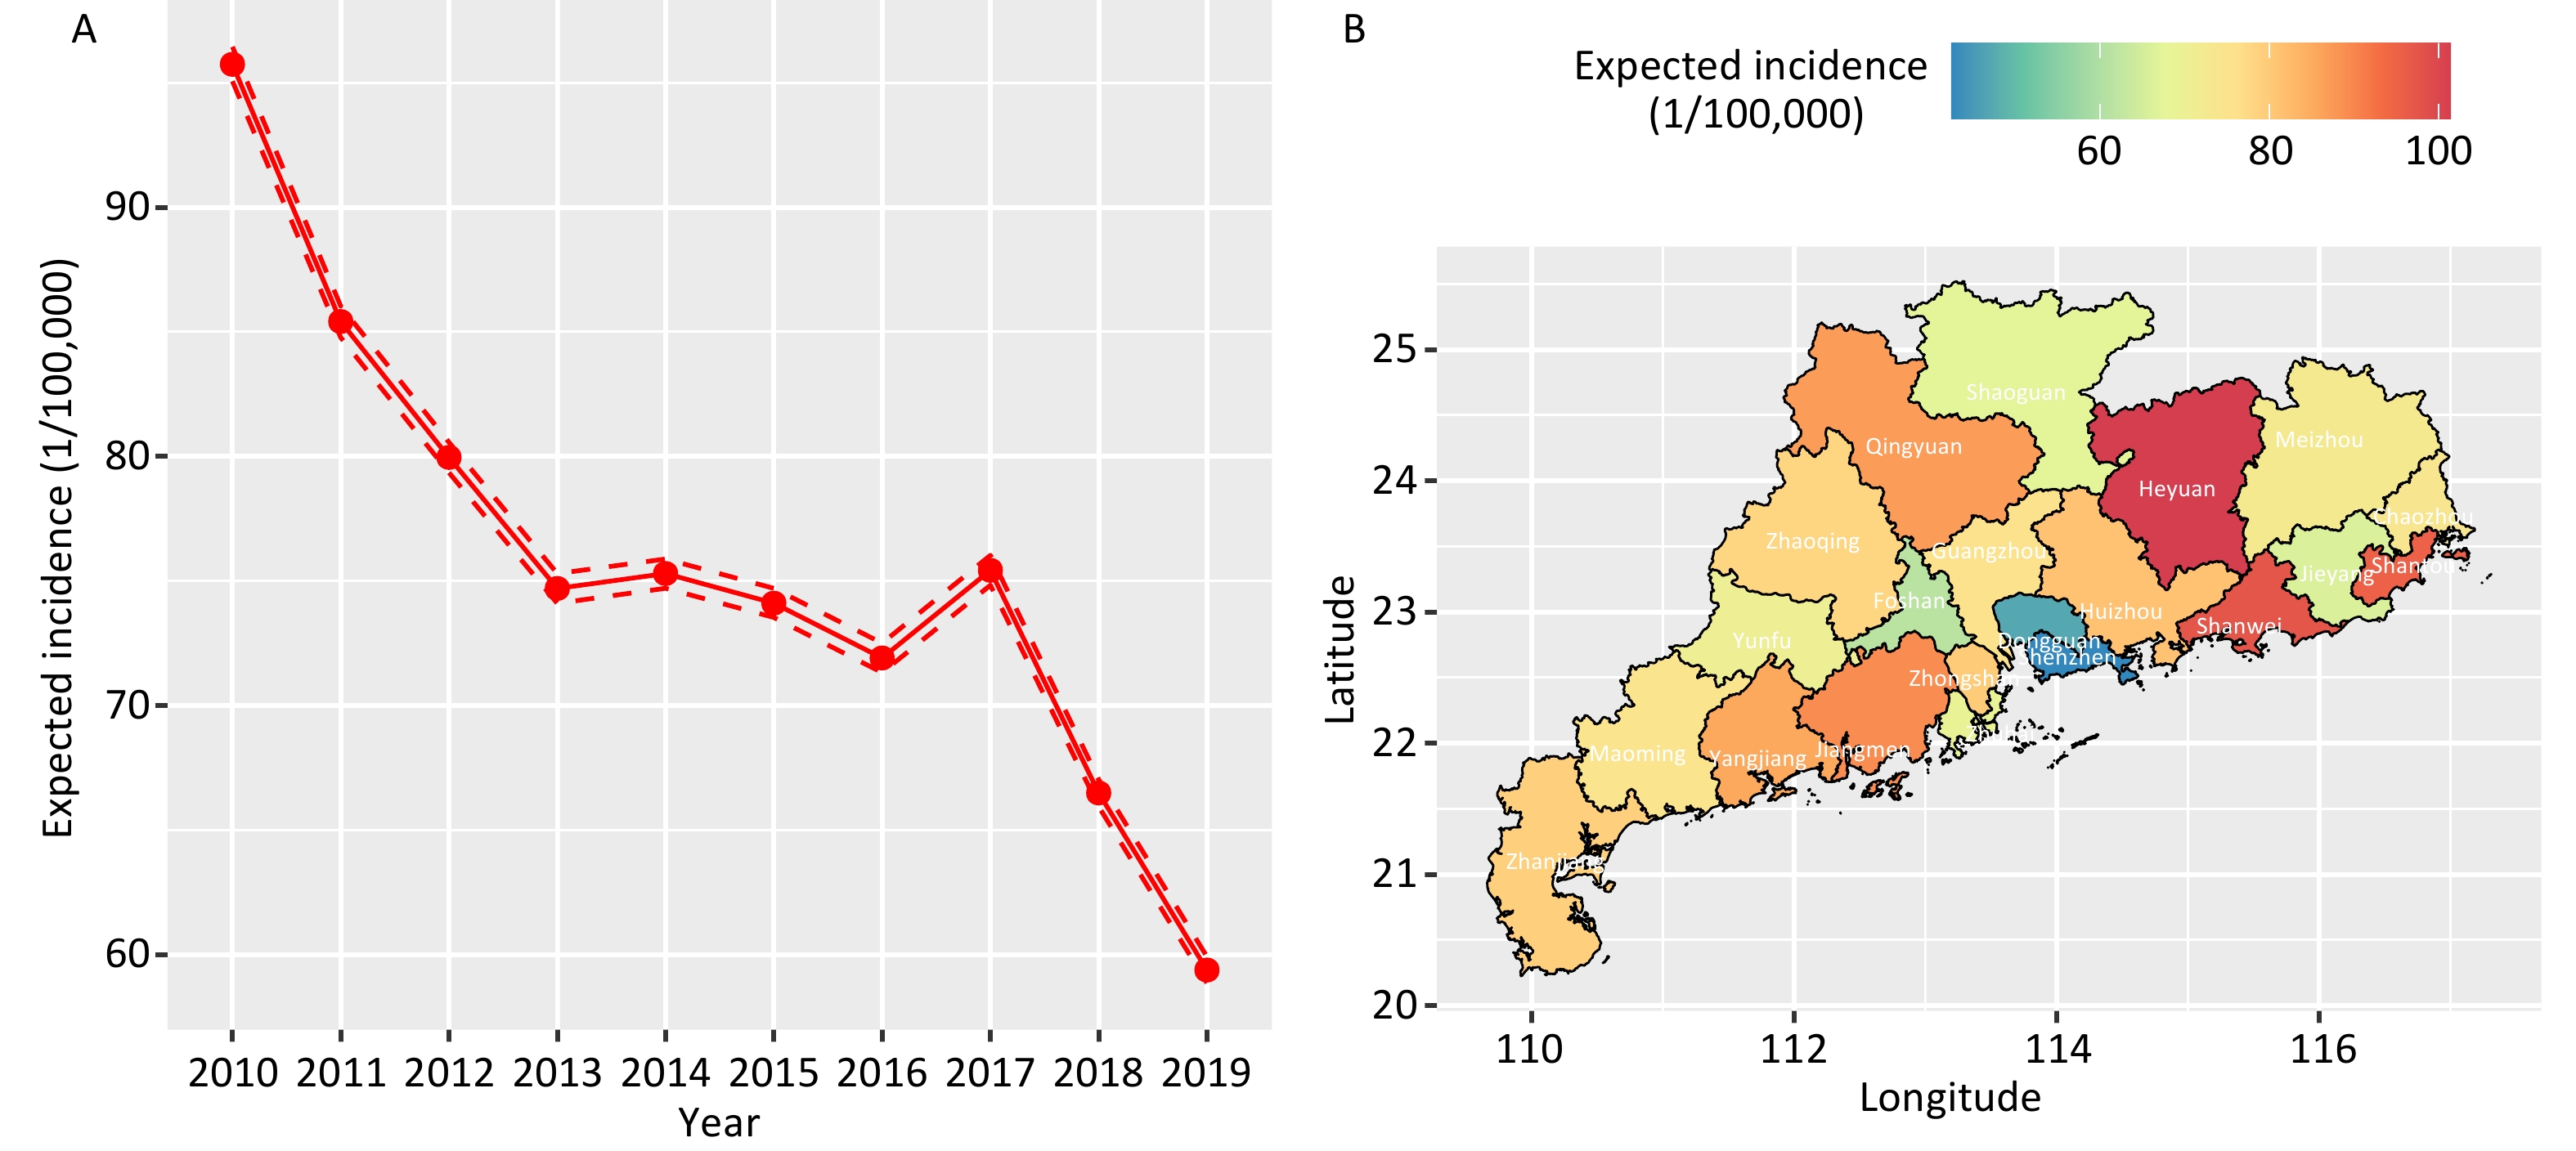
Figure 2 illustrates the temporal trend and spatial distribution of the projected incidence of TB in Guangdong Province. The estimated incidence rates were derived from the posterior median distribution and adjusted for local population. The data showed that the expected incidence of TB exhibited a downward trend from 2010 to 2019, with a stable plateau before a noticeable decrease in 2017 (Figure 2A). The region with the highest average projected incidence of TB from 2010 to 2019 was Heyuan, with a rate of 101.32 per 100,000. Shanwei and Shantou followed with rates of 97.36 and 95.18 per 100,000 people, respectively, as depicted in Figure 2B.
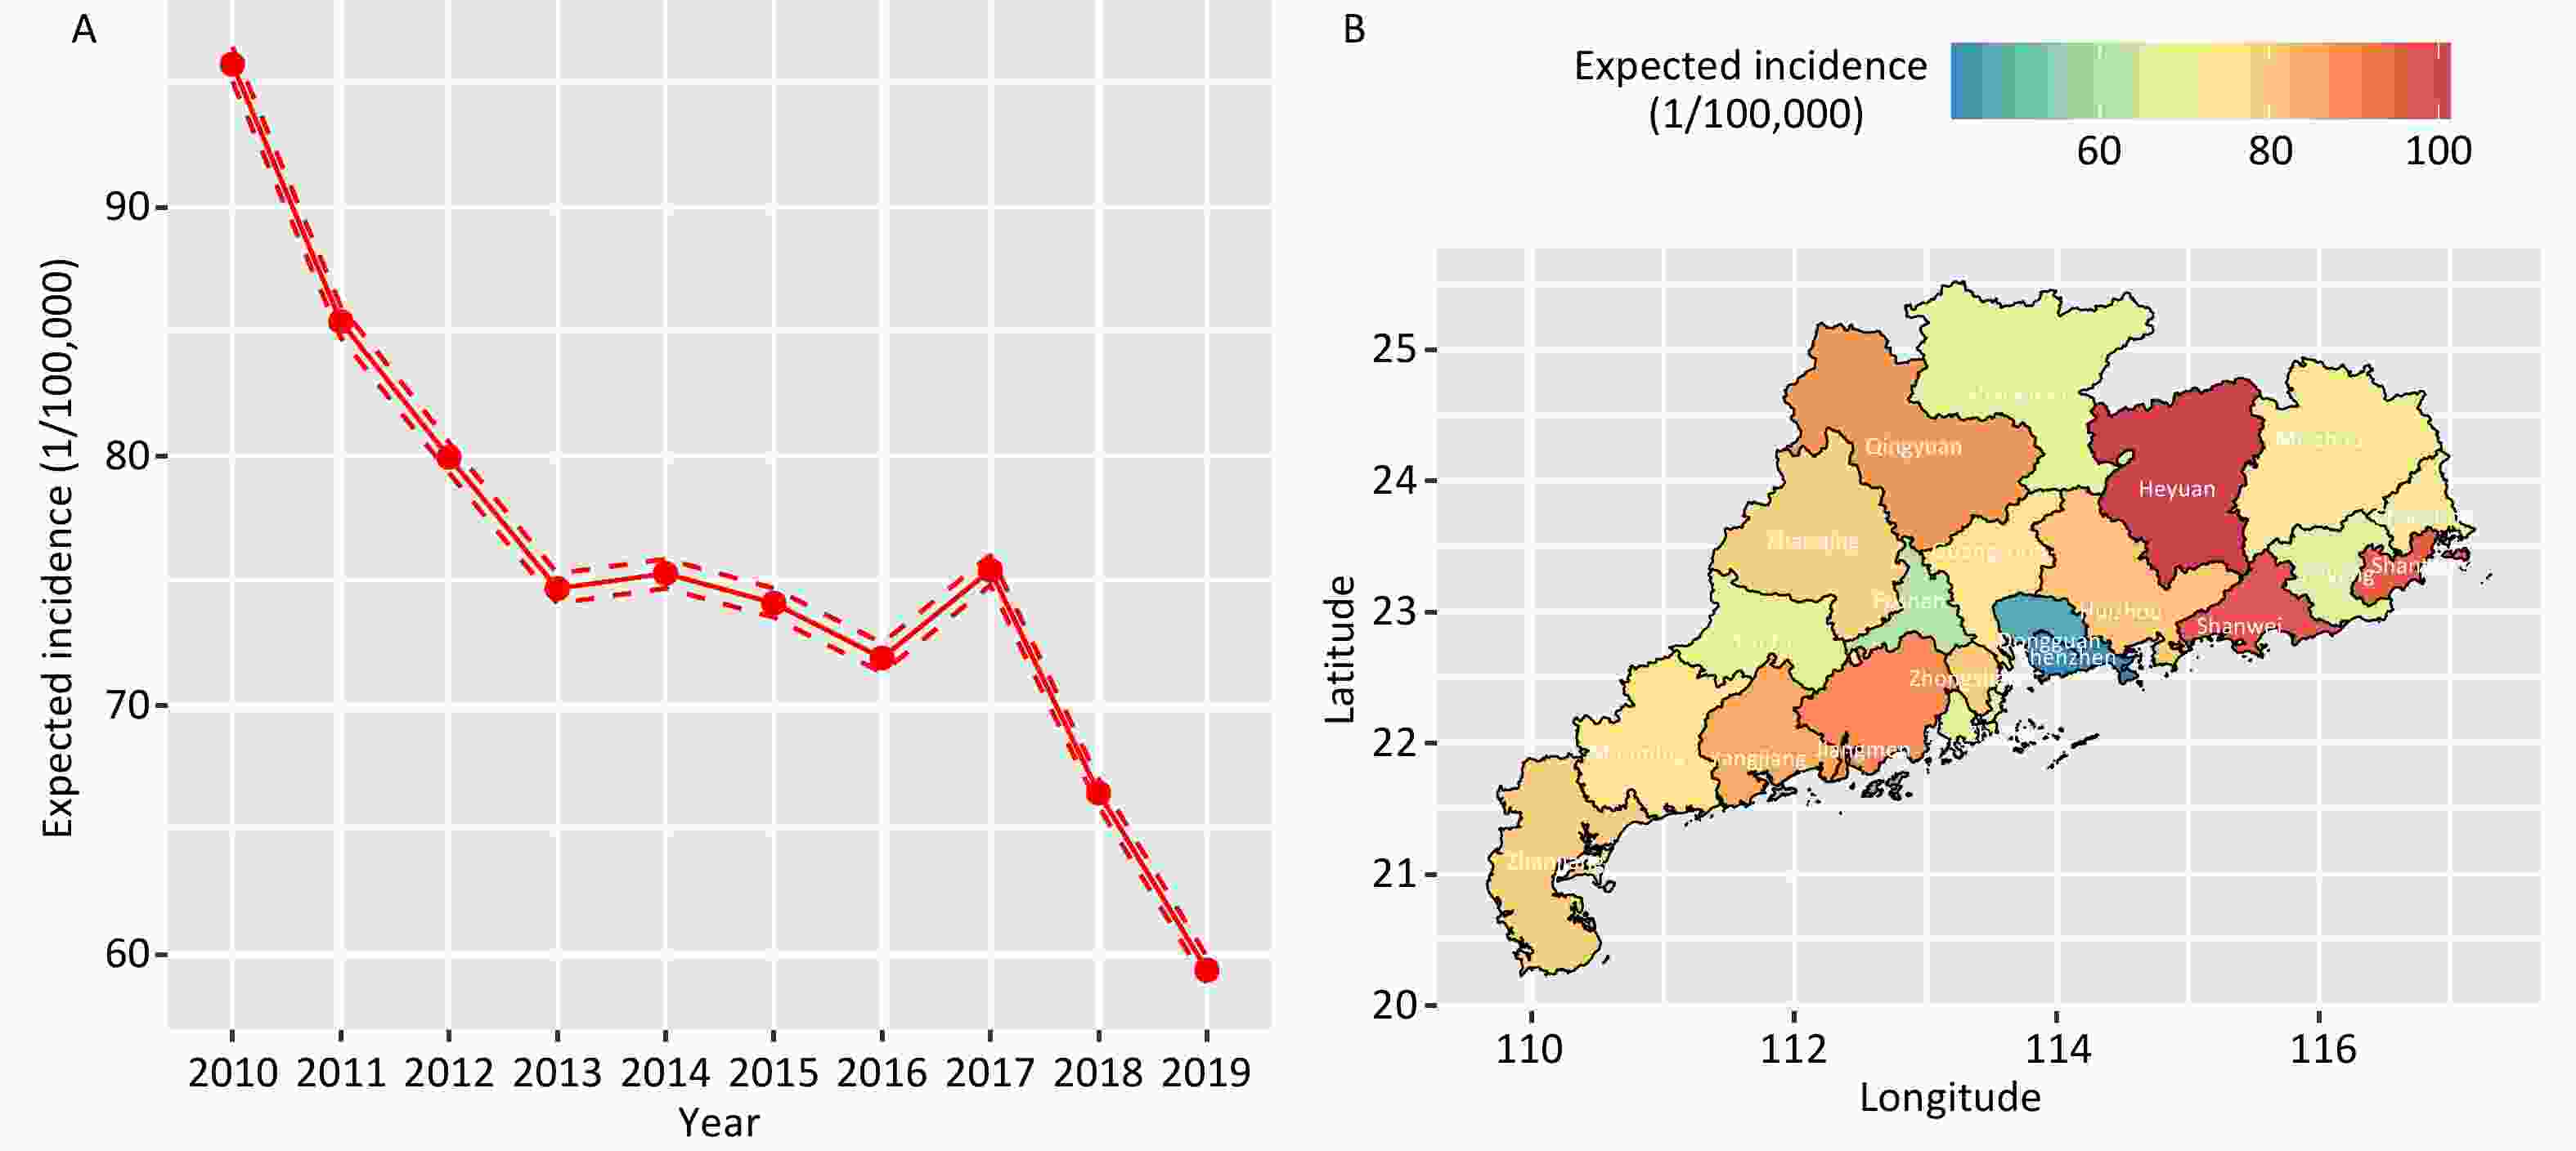
Figure 2. The expected incidence of TB in temporal trend and spatial distribution in Guangdong from 2010 to 2019. A) describes the temporal trend of TB expected incidence, and B) maps the spatial distribution of the expected incidence for TB in Guangdong from 2010 to 2019. GS(2020)4619.
-
In this study, we systematically explored the spatial and temporal distributions of TB incidence and estimated the influence of social and environmental factors in Guangdong Province from 2010 to 2019 using Bayesian spatiotemporal analysis. Temporally, we found a downward trend in the annual incidence of TB in Guangdong from 2010 to 2019, which is consistent with previous studies[10]. This reduction can be attributed to effective and intensified public health interventions as well as the consolidation and development of TB control strategies for early detection and treatment[19]. Spatially, the highest cumulative incidences were clustered in northeastern Guangdong (e.g., Heyuan, Shanwei, and Shantou), while the lowest cumulative incidences were clustered in the Pearl River Delta region (e.g., Shenzhen, Dongguan, and Foshan). The differences in TB incidence among various regions in Guangdong Province may be related to economic development, living conditions, human resources, and overall health conditions of the population.
Few studies have investigated the spatiotemporal association between socioeconomic factors and TB incidence[9]. Wang et al. applied a Bayesian space-time hierarchy model to the elderly in Beijing, Tianjin, and Hebei, China[20]. Similarly, Amsalu et al. used the Bayesian conditional autoregressive model to examine the spatial-temporal pattern of TB in the Chinese geriatric population (age≥65 years old), and suggested areas with an underprivileged economy, high population density, high rainfall, low wind speed, and low temperature have a higher risk for TB[9]. In addition, Wu et al. applied a Bayesian space-time model and found that population density was negatively correlated with the case notification rate of plumanary tuberculosis in Jiangsu, China[21].
In our study, the population density was negatively associated with the TB incidence. However, some previous studies have found a higher incidence of TB in regions with a high population density[6,22-25]. Conversely, the Bayesian space-time interaction model showed that population density was negatively correlated with TB (RR: 0.94, 95% CI: 0.92-0.96) in Jiangsu, China[21]. Similarly, Wang et al. applied a Bayesian space-time hierarchy model and observed that population density was significantly associated with TB incidence among elderly individuals in Beijing, Tianjin, and Hebei, China[20]. The present study observed a lower incidence of TB in the Pearl River Delta region, which has the highest population density in the Guangdong Province. In the correlation analysis, we found a positive association between population density and per-capita GDP, which is an indicator of the regional economic level. A higher economic status represents a higher level of medical care, better housing conditions, and a more robust welfare system. According to this study, the lower incidence of TB in the Pearl River Delta region of Guangdong Province, which has the highest population density, may be related to the following factors: (1) an increased level of healthcare resources and services. A relatively high level of healthcare resources and services in the Pearl River Delta region, including hospital facilities, medical technology, and the standard of healthcare personnel, has helped to improve the early diagnosis and treatment of TB, thereby reducing the incidence rate. (2) Prevalence of healthcare awareness: Residents in the region are likely to pay more attention to healthcare awareness, including personal hygiene habits and awareness of infectious disease prevention, which can help reduce the spread and incidence of TB. (3) Economic development and improvement of living standards: Rapid economic development and relatively high living standards of residents in the Pearl River Delta region may help improve their living environments and hygienic conditions, thereby reducing the risk of TB transmission. (4) Government health policies and control measures: Local governments may have adopted a series of effective TB prevention and control measures, including an enhanced outbreak surveillance, provision of free TB treatment, and promotion of knowledge of TB prevention, which may help reduce the incidence of TB. More efforts should be directed towards areas with low economic development for TB prevention and control in Guangdong Province.
We found that an increase in per capita GDP reduced the risk of TB incidence, which aligns with the findings of previous studies[26-30]. As an indicator of the regional economic development level, per capita GDP could shed light on the macro-level economic determinants and spatiotemporal variations in the policy effects on TB incidence, and regions with higher per capita GDP can allocate greater financial resources to TB prevention and control. Similarly, a national time-series study found regional disparities in TB notifications, with a higher rate in regions with slower economic growth[19]. Previous studies have shown that areas with slower economic growth often have limited financial resources, a scarcity of qualified healthcare professionals, and an inferior health infrastructure, which contribute to a higher TB burden[31-33]. Our study indicates that unbalanced regional economic development plays a significant role in the geographical heterogeneity of TB incidence. Therefore, economic development and increasing personal income levels, especially in rural areas, can play crucial roles in TB prevention and control.
For health services, both the number of licensed physicians and physician assistants per 1,000 people and the number of technical health personnel per 1,000 people were related to the incidence of TB. These indicators represent the coverage of medical resources, which indirectly reflect the health technicians engaged in TB prevention and control work in the local area. Wang et al. found that medical conditions were the dominant socioeconomic factors for TB among the elderly in Beijing, Tianjin, and Hebei, China[20]. With a higher number of physicians and technical health personnel, the medical resources in that region are relatively sufficient, which is generally associated with stronger treatment and management capabilities for TB, which may decrease the TB incidence[20,34].
Additionally, we found that the local general public expenditure per capita was associated with a lower incidence of TB. Similarly, Zhang et al[35] found that per capita medical expenditure negatively affected the reported incidence negatively in 17 cities in Shandong Province. A global analysis also highlighted that social protection spending is strongly associated with lower TB incidence[5]. The World Health Assembly adopted “End TB Strategy” to end the global TB epidemic by 2035, which emphasized on preventing TB through addressing social protection programs. Therefore, the government should increase spending on the general public, especially on medicine and healthcare in economically backward rural areas, to reduce TB incidence of TB.
Our study has several strengths. First, the Bayesian CAR model integrates temporal and spatial information into the same model, simultaneously considering the uncertainty and relevant factors associated with both time and space. This approach yielded more stable and reliable estimates. Our findings illuminate the spatiotemporal variation in TB incidence and the social factors associated with TB incidence in Guangdong Province, highlighting disparities in socioeconomic development.
However, this study had several limitations. First, as a multifactorial disease, TB incidence may be influenced by factors not considered in this study (such as personal hygiene habits and the floating population). Second, we used aggregate data at the city level, which may not have captured the intricate dynamics and relationships that occur at a more granular level. The coarseness of the data limits the ability to discern subtle patterns and variations, which may be critical for understanding the underlying mechanisms. For instance, city-level data might obscure disparities between different neighborhoods or districts within the same city where conditions can vary significantly. To address this limitation, future studies should incorporate more detailed data sources that allow for multilevel analyses. It is crucial for researchers to seek access to more granular data, as this would significantly enhance the accuracy and relevance of the findings.
-
The incidence of TB in Guangdong Province has been on a downward trajectory; however, it exhibits distinct epidemic features across various regions, suggesting inequality in medical resources. Economic development and allocation of medical resources are important factors that influence the incidence of TB. These insights can inform the development of targeted and effective prevention and control measures for TB.
doi: 10.3967/bes2025.071
Spatio-temporal Pattern and Socio-economic Influencing Factors of Tuberculosis Incidence in Guangdong Province: A Bayesian Spatiotemporal Analysis*
-
Abstract:
Objective To investigate the spatiotemporal patterns and socioeconomic factors influencing the incidence of tuberculosis (TB) in the Guangdong Province between 2010 and 2019. Method Spatial and temporal variations in TB incidence were mapped using heat maps and hierarchical clustering. Socioenvironmental influencing factors were evaluated using a Bayesian spatiotemporal conditional autoregressive (ST-CAR) model. Results Annual incidence of TB in Guangdong decreased from 91.85/100,000 in 2010 to 53.06/100,000 in 2019. Spatial hotspots were found in northeastern Guangdong, particularly in Heyuan, Shanwei, and Shantou, while Shenzhen, Dongguan, and Foshan had the lowest rates in the Pearl River Delta. The ST-CAR model showed that the TB risk was lower with higher per capita Gross Domestic Product (GDP) [Relative Risk (RR), 0.91; 95% Confidence Interval (CI): 0.86–0.98], more the ratio of licensed physicians and physician (RR, 0.94; 95% CI: 0.90-0.98), and higher per capita public expenditure (RR, 0.94; 95% CI: 0.90–0.97), with a marginal effect of population density (RR, 0.86; 95% CI: 0.86–1.00). Conclusion The incidence of TB in Guangdong varies spatially and temporally. Areas with poor economic conditions and insufficient healthcare resources are at an increased risk of TB infection. Strategies focusing on equitable health resource distribution and economic development are the key to TB control. -
Key words:
- Tuberculosis /
- Bayesian /
- Social-economic factor /
- Spatio-temporal model
The authors declare that there are no conflicts of interests.
注释:1) Author Contributions: 2) Conflict of Interests: -
Figure 1. Characteristics of spatial and temporal distribution of TB incidence in Guangdong Province, 2010-2019. GS(2020)4619.
Figure 2. The expected incidence of TB in temporal trend and spatial distribution in Guangdong from 2010 to 2019. A) describes the temporal trend of TB expected incidence, and B) maps the spatial distribution of the expected incidence for TB in Guangdong from 2010 to 2019. GS(2020)4619.
Table 1. Basic information on TB incidence cases, socioeconomic factors, temperature and PM2.5 in 21 cities in Guangdong Province, 2010-2019
Variables Mean ± SD Min P25 P50 P75 Max TB incidence cases (persons) 3,819 ± 2,144 1,135 2,358 3,494 4,716 13,238 Population density (persons/km2) 1,172.24 ±
1,349.97153.94 306.25 549.59 1,782.32 6,727.91 Per capita GDP (*1,000 Yuan) 53.20 ± 34.06 14.20 28.83 40.05 68.43 157.81 Licensed physicians & physician assistants (/1,000 people) 1.89 ± 0.48 1.05 1.55 1.81 2.12 3.32 health technical personnel (/1,000 people) 5.06 ± 1.47 2.08 3.98 4.96 5.82 9.18 Local general public expenditure per capita (*1,000 Yuan) 7.67 ± 5.07 1.61 4.47 6.50 9.30 28.94 Annual mean temperature (°C) 22.43 ± 0.96 19.78 21.91 22.57 23.10 25.12 Annual mean PM2.5 (ug/m3) 27.41 ± 6.18 15.47 21.91 27.35 32.20 39.82  下载: 导出CSV
Table 2. The results of univariate and multivariate ST-CAR models on the risk of TB derived by social environment
Variables IQR RR (95%CI) DIC values Univariate
modelMultivariate
modelUnivariate
modelMultivariate
modelPopulation density 1476.07 0.86 (0.74–0.86) 0.86 (0.86–1.00)a 2510.83 2508.93a Per capita GDP (1,000 Yuan) 39.60 0.81 (0.77–0.85) 0.91 (0.86–0.98)a 2510.80 2508.93a Number of licensed physicians & physician assistants
(/1,000 people)0.58 0.87 (0.82–0.91) 0.94 (0.90–0.98)a 2510.30 2508.93a Number of health technical personnel (/1,000 people) 1.83 0.88 (0.84–0.92) 0.95 (0.88–1.02)b 2510.96 2509.96c Local general public expenditure per capita (1,000 Yuan) 4.83 0.87 (0.84–0.91) 0.94 (0.90–0.97)c 2511.40 2508.96c Annual mean temperature (°C) 1.18 0.90 (0.86–0.94) 0.99 (0.95–1.03)a 2512.77 2508.93a Annual mean PM2.5 (ug/m3)* 6.70 1.01 (0.94–1.10) 0.97 (0.92–1.04)d 1249.49 2508.93d Note. *Data on annual mean PM2.5, available from 2015-2019 to. IQR: interquartile range.a Adjusted for population density, per capita GDP, number of licensed physicians and physician assistants (/1,000 people), and annual mean temperature. b bAdjusted for population density, per capita GDP, number of health technical personnel (per 1,000 people), and annual mean temperature. c was adjusted for population density, per capita GDP, local general public expenditure per capita, annual mean temperature, and annual mean PM2.5. d Adjusted for population density, per capita GDP, number of licensed physicians and physician assistants (/1,000 people), annual mean temperature, and annual mean PM2.5.
下载: 导出CSV
-
[1] Peddireddy V, Doddam SN, Ahmed N. Mycobacterial dormancy systems and host responses in tuberculosis. Front Immunol, 2017; 8, 84. [2] World Health Organization. Global tuberculosis Report 2023. https://www.who.int/publications/i/item/9789240083851. [2024-06-05] [3] Uplekar M, Weil D, Lonnroth K, et al. WHO's new end TB strategy. Lancet, 2015; 385, 1799−801. doi: 10.1016/S0140-6736(15)60570-0 [4] Dong Z, Yao HY, Yu SC, et al. Changes in notified incidence of pulmonary tuberculosis in China, 2005-2020. Biomed Environ Sci, 2023; 36, 117−26. [5] Siroka A, Ponce NA, Lönnroth K. Association between spending on social protection and tuberculosis burden: a global analysis. Lancet Infect Dis, 2016; 16, 473−9. doi: 10.1016/S1473-3099(15)00401-6 [6] Zhang Q, Ding H, Gao S, et al. Spatiotemporal changes in pulmonary tuberculosis incidence in a low-epidemic area of China in 2005-2020: retrospective spatiotemporal analysis. JMIR Public Health Surveill, 2023; 9, e42425. doi: 10.2196/42425 [7] Carter DJ, Glaziou P, Lönnroth K, et al. The impact of social protection and poverty elimination on global tuberculosis incidence: a statistical modelling analysis of Sustainable Development Goal 1. Lancet Glob Health, 2018; 6, e514−e22. doi: 10.1016/S2214-109X(18)30195-5 [8] Ma ZT, Wang N, He F, et al. Spatial-temporal analysis of tuberculosis at the community level in the Baoshan district, Shanghai 2014-2019. Biomed Environ Sci, 2022; 35, 458−62. [9] Amsalu E, Liu MY, Li QH, et al. Spatial-temporal analysis of tuberculosis in the geriatric population of China: an analysis based on the Bayesian conditional autoregressive model. Arch Gerontol Geriatr, 2019; 83, 328−37. doi: 10.1016/j.archger.2019.05.011 [10] Yin JF, Huang RW, Jiang H, et al. Spatio-temporal distribution of pulmonary tuberculosis and influencing factors in Beijing, 2008-2018. Chin J Epidemiol, 2021; 42, 1240−5. (In Chinese) [11] Beale L, Abellan JJ, Hodgson S, et al. Methodologic issues and approaches to spatial epidemiology. Environ Health Persp, 2008; 116, 1105−10. doi: 10.1289/ehp.10816 [12] Quan Y, Zhang YT, Deng H, et al. How do temperature and precipitation drive dengue transmission in nine cities, in Guangdong Province, China: a Bayesian spatio-temporal model analysis. Air Qual Atmos Health, 2023; 16, 1153−63. doi: 10.1007/s11869-023-01331-2 [13] Duan YQ, Cheng J, Liu Y, et al. Epidemiological characteristics and spatial-temporal analysis of tuberculosis at the county-level in Shandong Province, China, 2016-2020. Trop Med Infect Dis, 2022; 7, 346. doi: 10.3390/tropicalmed7110346 [14] Hu WB, Zhang WY, Huang XD, et al. Weather variability and influenza A (H7N9) transmission in Shanghai, China: a Bayesian spatial analysis. Environ Res, 2015; 136, 405−12. doi: 10.1016/j.envres.2014.07.033 [15] Alegana VA, Atkinson PM, Wright JA, et al. Estimation of malaria incidence in northern Namibia in 2009 using Bayesian conditional-autoregressive spatial-temporal models. Spat Spatio-Temporal, 2013; 7, 25−36. doi: 10.1016/j.sste.2013.09.001 [16] Bivand R, Altman M, Anselin L, et al. Package ‘spdep’. The Comprehensive R Archive Network. 2015; Available from: https://mran.microsoft.com/snapshot/2017-08-23/web/packages/spdep/spdep.pdf. [17] Rushworth A, Lee D, Mitchell R. A spatio-temporal model for estimating the long-term effects of air pollution on respiratory hospital admissions in Greater London. Spat Spatio-Temporal, 2014; 10, 29−38. doi: 10.1016/j.sste.2014.05.001 [18] Lee D. A tutorial on spatio-temporal disease risk modelling in R using Markov chain Monte Carlo simulation and the CARBayesST package. Spat Spatio-Temporal, 2020; 34, 100353. doi: 10.1016/j.sste.2020.100353 [19] Wang YS, Zhu WL, Li T, et al. Changes in newly notified cases and control of tuberculosis in China: time-series analysis of surveillance data. Infect Dis Poverty, 2021; 10, 16. doi: 10.1186/s40249-021-00806-7 [20] Wang L, Xu CD, Hu MG, et al. Spatio-temporal variation in tuberculosis incidence and risk factors for the disease in a region of unbalanced socio-economic development. BMC Public Health, 2021; 21, 1817. doi: 10.1186/s12889-021-11833-2 [21] Wu ZC, Fu GF, Wen Q, et al. Spatiotemporally comparative analysis of HIV, pulmonary tuberculosis, hiv-pulmonary tuberculosis coinfection in Jiangsu Province, China. Infect Drug Resist, 2023; 16, 4039−52. doi: 10.2147/IDR.S412870 [22] Banu S, Rahman MT, Uddin MKM, et al. Epidemiology of tuberculosis in an urban slum of Dhaka City, Bangladesh. PLoS One, 2013; 8, e77721. doi: 10.1371/journal.pone.0077721 [23] Bekker LG, Wood R. The changing natural history of tuberculosis and HIV coinfection in an urban area of hyperendemicity. Clin Infect Dis, 2010; 50 Suppl 3, S208-14. [24] Taylan M, Demir M, Yılmaz S, et al. Effect of human development index parameters on tuberculosis incidence in Turkish provinces. J Infect Dev Ctries, 2016; 10, 1183−90. doi: 10.3855/jidc.8101 [25] Sifuna PM, Ouma C, Atieli H, et al. Spatial epidemiology of tuberculosis in the high-burden counties of Kisumu and Siaya, Western Kenya, 2012-2015. Int J Tuberc Lung Dis, 2019; 23, 363−70. doi: 10.5588/ijtld.18.0245 [26] Pan L, He XX, Luo YX, et al. Exploration of tuberculosis evolution characteristics and ecological factors based on the bayes temporal-spatial theory. Chin J Health Stat, 2013; 30, 658−60,64. (In Chinese) [27] Wang Q, Guo L, Wang J, et al. Spatial distribution of tuberculosis and its socioeconomic influencing factors in mainland China 2013-2016. Trop Med Int Health, 2019; 24, 1104−13. doi: 10.1111/tmi.13289 [28] Ploubidis GB, Palmer MJ, Blackmore C, et al. Social determinants of tuberculosis in Europe: a prospective ecological study. Eur Respir J, 2012; 40(4), 925-30. [29] Dye C, Lönnroth K, Jaramillo E, et al. Trends in tuberculosis incidence and their determinants in 134 countries. Bull World Health Organ, 2009; 87, 683−91. doi: 10.2471/BLT.08.058453 [30] Wubuli A, Xue F, Jiang DB, et al. Socio-demographic predictors and distribution of pulmonary Tuberculosis (TB) in Xinjiang, China: A Spatial Analysis. PLoS One, 2015; 10(, e0144010. [31] Long Q, Qu Y, Lucas H. Drug-resistant tuberculosis control in China: progress and challenges. Infect Dis Poverty, 2016; 5, 9. doi: 10.1186/s40249-016-0103-3 [32] Jia ZW, Cheng SM, Wang LX. Tuberculosis control in China: striving for sustainability. Lancet, 2012; 379, 2149. [33] Du J, Pang Y, Liu YH, et al. Survey of tuberculosis hospitals in China: current status and challenges. PLoS One, 2014; 9, e111945. doi: 10.1371/journal.pone.0111945 [34] Sun YH, Tian MZ, Lie YW, et al. Application of spatial panel data model in the analysis of national tuberculosis surveillance data from 2015 to 2019. Chin J Prev Med, 2022; 23, 436−41. (In Chinese) [35] Zhang QY, Yang DM, Cao LQ, et al. Association between economic development level and tuberculosis registered incidence in Shandong, China. BMC Public Health, 2020; 20, 1557. doi: 10.1186/s12889-020-09627-z -

 点击查看大图
计量
- 文章访问数: 18
- HTML全文浏览量: 7
- PDF下载量: 0
- 被引次数: 0

 Quick Links