-
Although the incidence of measles, mumps, and rubella (MMR) has significantly declined since the inclusion of the combined MMR vaccine in the Expanded Program on Immunization, MMR remains a major cause of childhood morbidity and mortality worldwide[1,2]. The World Health Organization set goals to achieve and sustain regional measles and rubella elimination in all six regions by 2020[3]. However, the reemergence of measles in countries that had announced the elimination of measles and slow progress in endemic countries have thwarted international control efforts[4]. Measles is one of the most contagious diseases, with a basic reproduction number of 12 to 18[5], requiring the maintenance of high population immunity to prevent outbreaks. Rubella is an acute contagious viral infection that remains endemic in many countries, with its incidence increasing slightly worldwide in 2018 and 2019[6]. Primary rubella viral infection in early pregnancy can result in congenital rubella syndrome, which can have serious medical and public health consequences[7]. Mumps is a common childhood infection caused by the mumps virus that spreads via direct contact or airborne droplets from the upper respiratory tract of infected individuals[8]. People who are not vaccinated are at high risk of infection. Although the vaccinated population still carries the risk of contracting mumps, clinical symptoms are often milder[9]. The MMR vaccine is highly immunogenic, and two doses can confer 97% protection[10]. However, to prevent outbreaks, approximately 95% of the population needs to be vaccinated or have natural immunity from a prior disease[11]. When non-vaccinated individuals are geographically clustered, outbreaks remain possible despite national vaccination coverage targets being met or exceeded[12].
In China’s mainland, a second MMR dose was introduced in 2008. The incidence of MMR has decreased to a very low level in the past 10 years, and the incidence rate of measles was reduced by 99% from 1978 to 2018[2,13]. However, cases of mumps are not rare[9,14], and a significant upward fluctuation in rubella incidence was observed in 2019. Similar situations were also reported in other member states in the Western Pacific Region of the World Health Organization[6].
The heterogeneous epidemiological characteristics and infectiousness of MMR in populations suggest an increasing outbreak risk for vaccine-preventable diseases, which may be obscured by the reported vaccination coverage rates at the county and province levels. Studies have reported the epidemiological characteristics of MMR over a certain period or in specific areas[13-16]. However, few studies have conducted simultaneous cross-reference analyses of the three diseases. To identify the potential weakness and close the remaining gaps in the prevention and control of MMR in China’s mainland, we analyzed and compared the epidemiological characteristics of MMR at the national level, identified vulnerable populations, and sought the mechanisms by which clustering occurred.
-
The data for the reported cases of MMR from 2014 to 2021 were obtained from China’s National Notifiable Disease Reporting System, including clinically diagnosed cases and laboratory-confirmed cases, which were classified according to the National Measles Surveillance Guideline[17], National Diagnostic Criteria for Mumps (WS270-2007)[18], and National Diagnostic Criteria for Rubella (WS297-2008)[19]. Demographic data according to age and sex were obtained from the National Bureau of Statistics of China (https://www.stats.gov.cn/sj/tjgb/rkpcgb/; accessed on April 20, 2023). The standard base map of China [GS(2023)2767] was sourced from the Standard Map Service (http://bzdt.ch.mnr.gov.cn/, accessed on October 20, 2023) and the Ministry of Natural Resources of the People’s Republic of China.
-
In addition to the analysis of the data based on the administrative divisions, regional clustering characteristics were analyzed based on geographical distribution and the results of prior studies[20], including Northeast China (Heilongjiang, Jilin, and Liaoning), North China (Beijing, Tianjin, Shanxi, Hebei, and the Inner Mongolia Autonomous Region), Central China (Henan, Hubei, and Hunan), East China (Shanghai, Jiangsu, Zhejiang, Anhui, Jiangxi, Shandong, and Fujian), South China (Guangdong, Guangxi Zhuang Autonomous Region, and Hainan), Northwest China (Shaanxi, Gansu, Qinghai, Ningxia Hui Autonomous Region, and Xinjiang), and Southwest China (Chongqing, Sichuan, Guizhou, Yunnan, and Xizang).
-
Descriptive epidemiological analyses were performed using Microsoft Excel. The temporal trends of the incidence of MMR (annual percent change, APC) and the average annual change (average APC, AAPC) were calculated and analyzed at the national and regional levels using Joinpoint regression software (version 4.9.0.0, National Cancer Institute, Rockville, MD, USA)[21]. The increasing (AAPC/APC > 0) or decreasing (AAPC/APC < 0) trend was accepted when the P-value was less than 0.05.
Space-time and seasonal scanning analyses at the prefecture and monthly levels were performed using SaTScan (10.1.2) software. The maximum scanning window was set to 30% of the entire population, the maximum temporal clustering scale was set to 30% of the entire study length[22], and step size was set to 1 month. The Poisson distribution model was chosen, and log-likelihood ratio (LLR) statistics were calculated. When P ≤ 0.05, a statistically significant spatial cluster in the region was accepted. The clusters were identified and ranked according to their LLR[23]. Annual morbidity clustering at the prefecture level was presented on a map using the ArcGIS software (version 10.8.1).
Global Moran’s I statistics (spatial autocorrelations) were calculated using ArcGIS to examine the presence of spatial autocorrelations across the entire dataset. The critical distance was determined using incremental Moran’s I[24]. Anselin Local Moran’s I statistic was used to detect/map hotspot and cold spot clusters and outliers, and outliers were identified by detecting local areas where high-incidence regions bordered low-incidence regions, and vice versa[25].
-
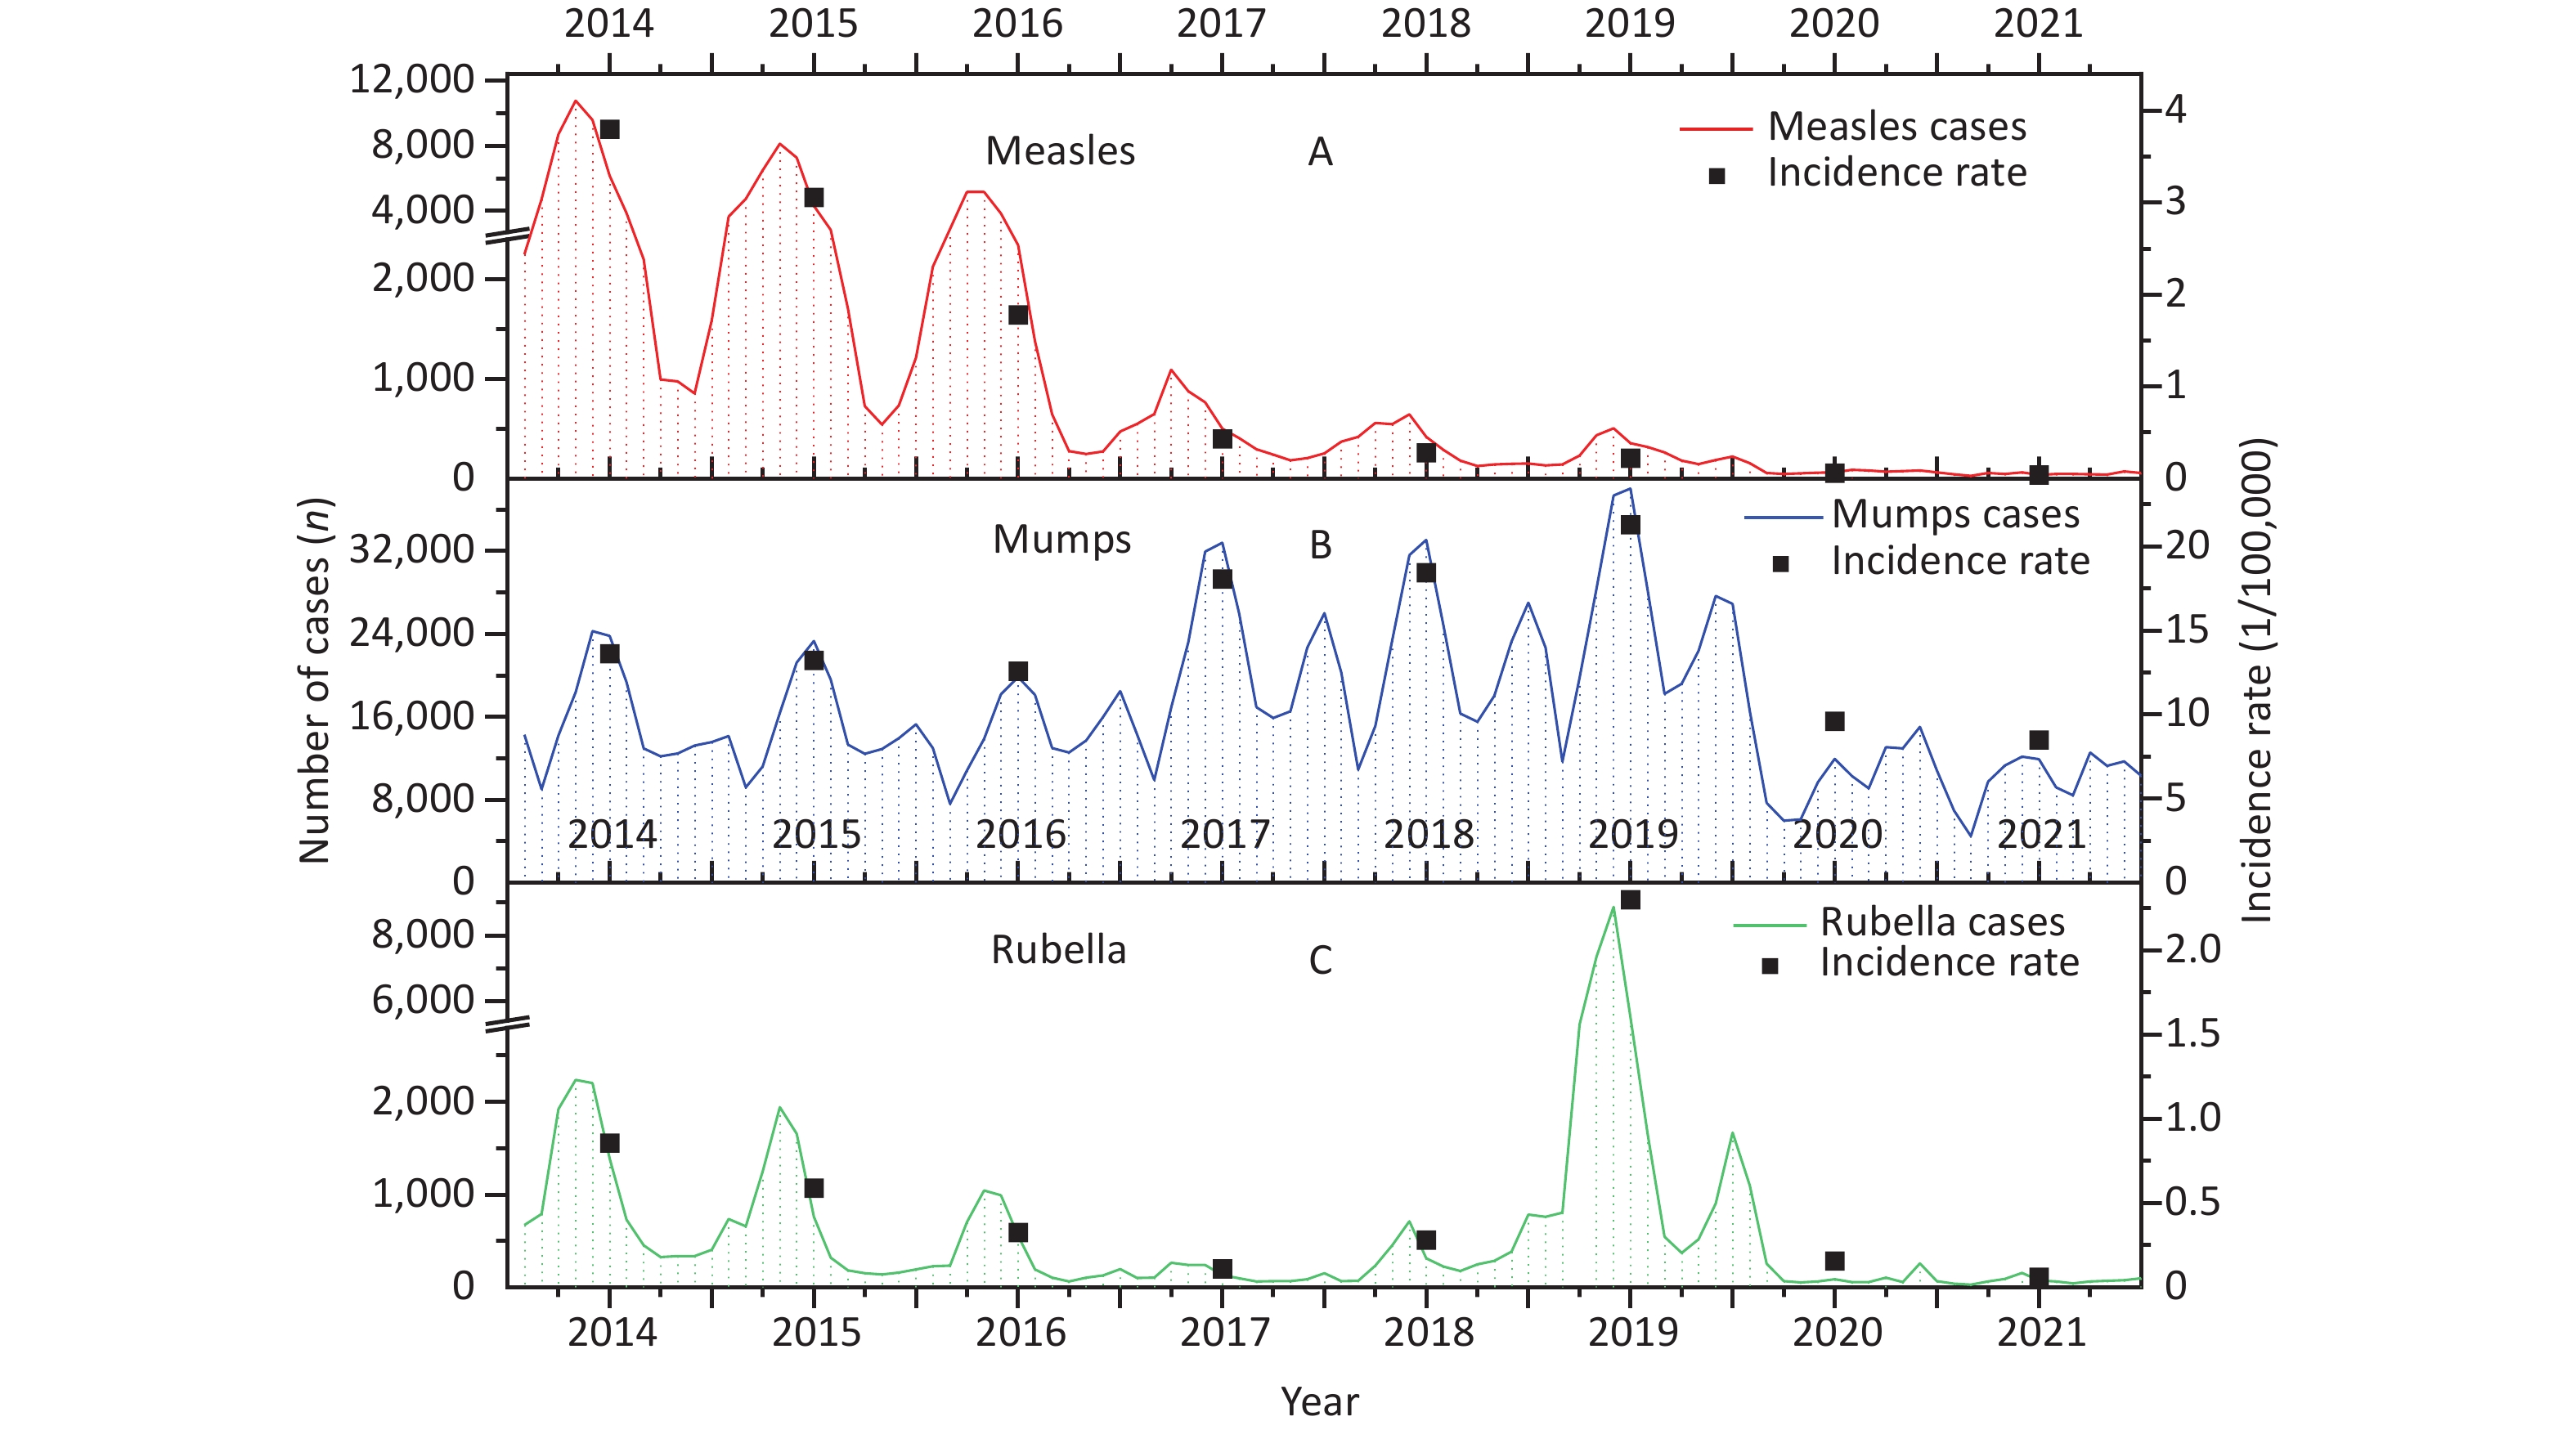
Between 2014 and 2021, 1,808,067 MMR cases were reported in China’s mainland, of which 7.43% (134,337 cases) were measles, 88.94% (1,608,029 cases) were mumps, and 3.63% (65,701 cases) were rubella. The average annual incidence of MMR was 2.02/100,000, peaking in 2019 (2.38/100,000); heterogeneous incidences were observed, and the incidence of mumps was much higher than that of measles and rubella in the study period (Table 1).
Table 1. The incidence of measles, mumps, and rubella (MMR) during 2014–2021
Year Measles Mumps Rubella MMR N (1/100,000) N (1/100,000) N (1/100,000) N (1/100,000) 2014 52,651 (3.83) 187,674 (13.63) 11,796 (0.86) 252,121 (1.83) 2015 42,373 (3.06) 183,010 (13.23) 8,138 (0.59) 233,521 (1.69) 2016 24,839 (1.78) 175,225 (12.59) 4,533 (0.33) 204,597 (1.47) 2017 5,994 (0.43) 252,986 (18.07) 1,597 (0.11) 260,577 (1.86) 2018 3,971 (0.28) 259,343 (18.45) 3,933 (0.28) 267,247 (1.90) 2019 3,092 (0.22) 300,358 (21.30) 32,653 (2.32) 336,103 (2.38) 2020 866 (0.06) 129,308 (9.16) 2,203 (0.16) 132,377 (0.94) 2021 551 (0.04) 120,125 (8.50) 848 (0.06) 121,524 (0.86) Total 134,337 (1.20) 1,608,029 (14.37) 65,701 (0.59) 1,808,067 (16.15) -
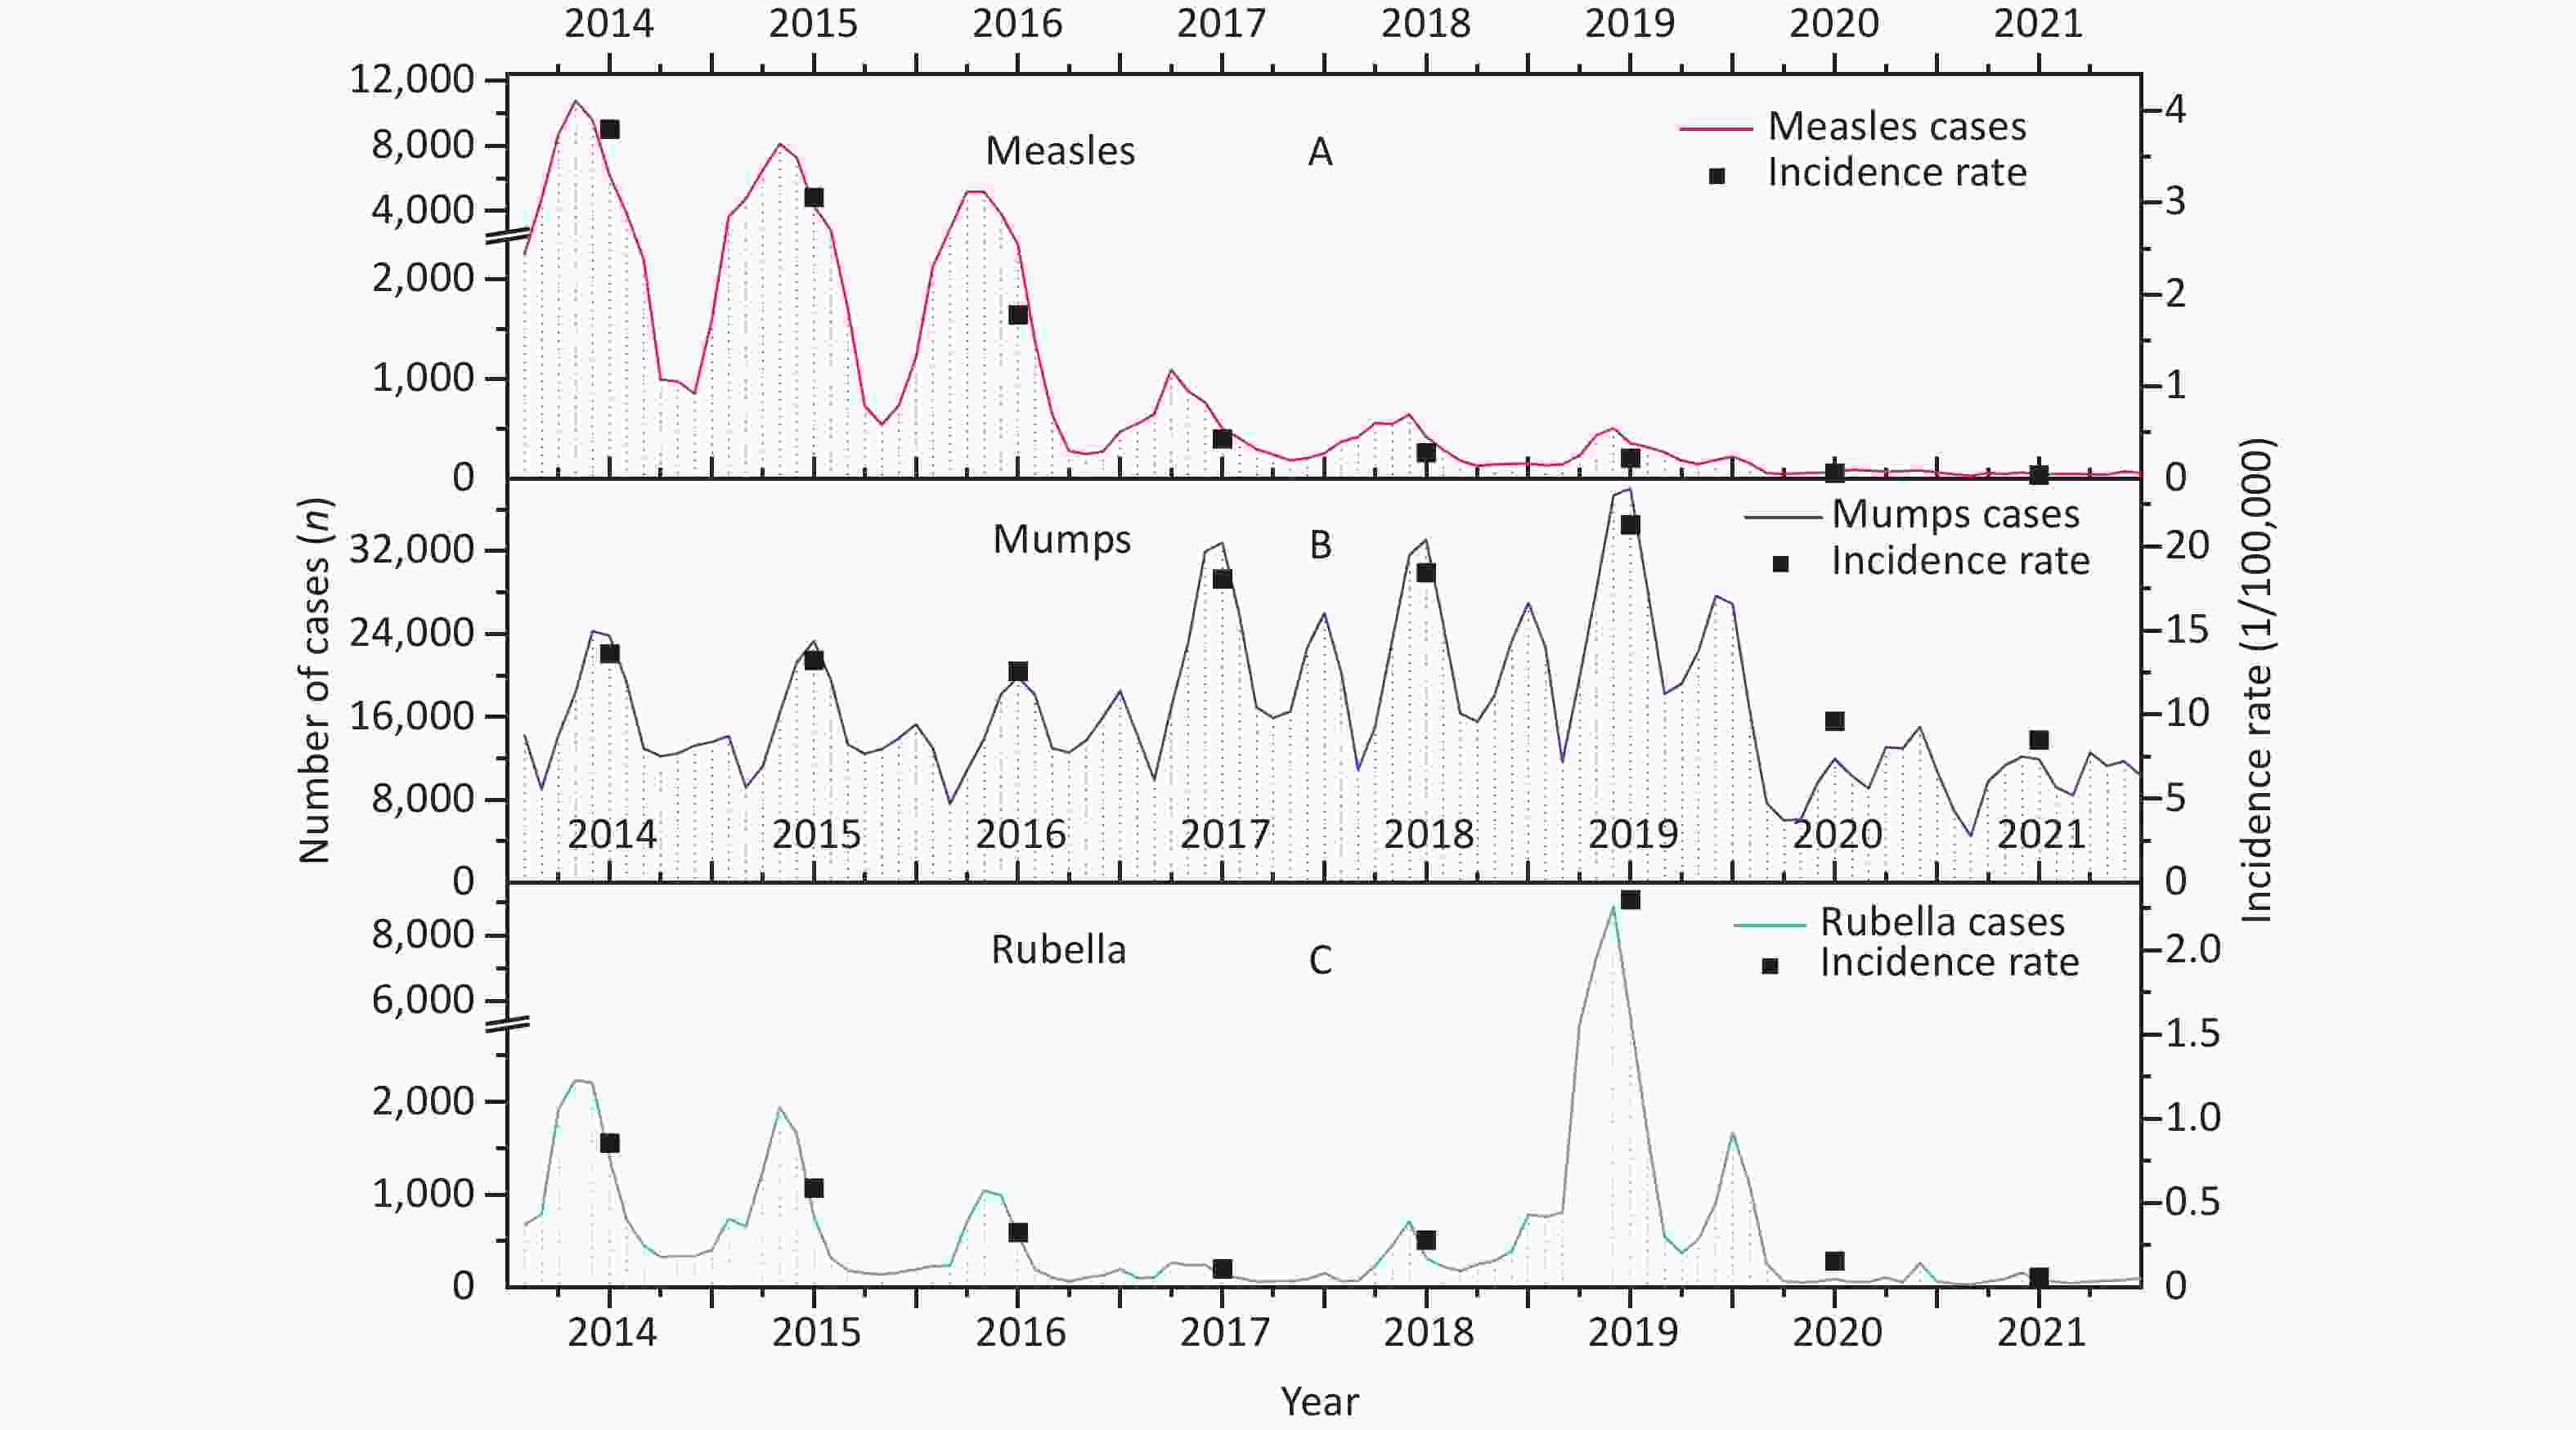
The incidence of measles decreased significantly from 2014 to 2021 (AAPC = –51.12%, 95% confidence interval [CI]: –65.78% to 47.78%, P < 0.05). Most measles cases (52.92%) were reported between March and May (RR = 3.34, LLR = 23,493.43, P < 0.01). A high incidence of measles was observed from 2014 to 2016, with an average incidence rate of 2.89/100,000, with the peak value occurring from March to May (RR = 3.54, LLR = 23,006.66, P < 0.01). During 2017–2021, the average incidence reduced to 0.21/100,000, and the peak value was observed from March to May (RR = 2.07, LLR = 874.73, P < 0.01) (Figure 1A and Table 1).
The incidence of mumps remained at a relatively high level of fluctuation during 2014–2021 (AAPC = –4.37%, 95% CI: –16.73% to 18.48%, P > 0.05). An upward trend was observed from 2014 to 2019 (APC = 17.08%, 95% CI: 4.03% to 117.64%, P < 0.05), which then significantly decreased during 2019–2021 (APC = –42.35%, 95% CI: –66.33% to 10.23%, P < 0.05). A resurgence of mumps was observed during 2017–2019, with an average incidence rate of 19.28/100,000, which was much higher than the average incidence during 2014–2016 (13.15/100,000) and 2020–2021 (8.83/100,000). The annual incidence of mumps assumed a "double peak,” with peak values appearing in May–July and September–November. The main peak appeared from May to July during 2014–2016 (RR = 1.56, LLR = 11458.05, P < 0.01) and 2017–2019 (RR = 1.59, LLR = 18900.95, P < 0.01). However, that was observed from September to November (RR = 1.34, LLR = 2213.94, P < 0.01) from 2020 to 2021 (Figure 1B and Table 1).
In general, no significant change in rubella incidence was calculated during 2014–2021 (AAPC = 16.69%, 95% CI: –13.98% to 72.69%, P > 0.05), partially due to the rebounding of rubella in 2019 (Figure 1C). Rubella incidence rates peaked from April to June (RR = 3.91, LLR = 14,769.10, P < 0.01), accounting for 56.46% of total cases (Figure 1C). From 2014 to 2016, the incidence peaked from March to May (RR = 3.94, LLR = 5,562.76, P < 0.01), whereas the peak value was observed from April to June (RR = 4.33, LLR = 10,736.80, P < 0.01) during 2017–2021 (Figure 1C and Table 1).
-
From 2014 to 2021, the incidence of measles decreased in all age groups during 2014–2021 (Figure 2A). The 0–4 age group experienced the highest incidence rate (11.08/100,000), accounting for 52.15% of all cases. The proportion of cases in the age group of 0 to 4 years showed a rising trend, except in 2019, when it decreased to 45.60%, whereas the proportion of cases in the age group of 5 to 19 years increased to 22.51%. Children under two years of age accounted for approximately 80% of the cases in the age group of 0 to 5 years. The proportion of patients aged > 25 years decreased annually from 36.88% in 2014 to 15.43% in 2021 (Figure 2A and B). Children living at home accounted for 52.11% (70,004) of all measles cases.
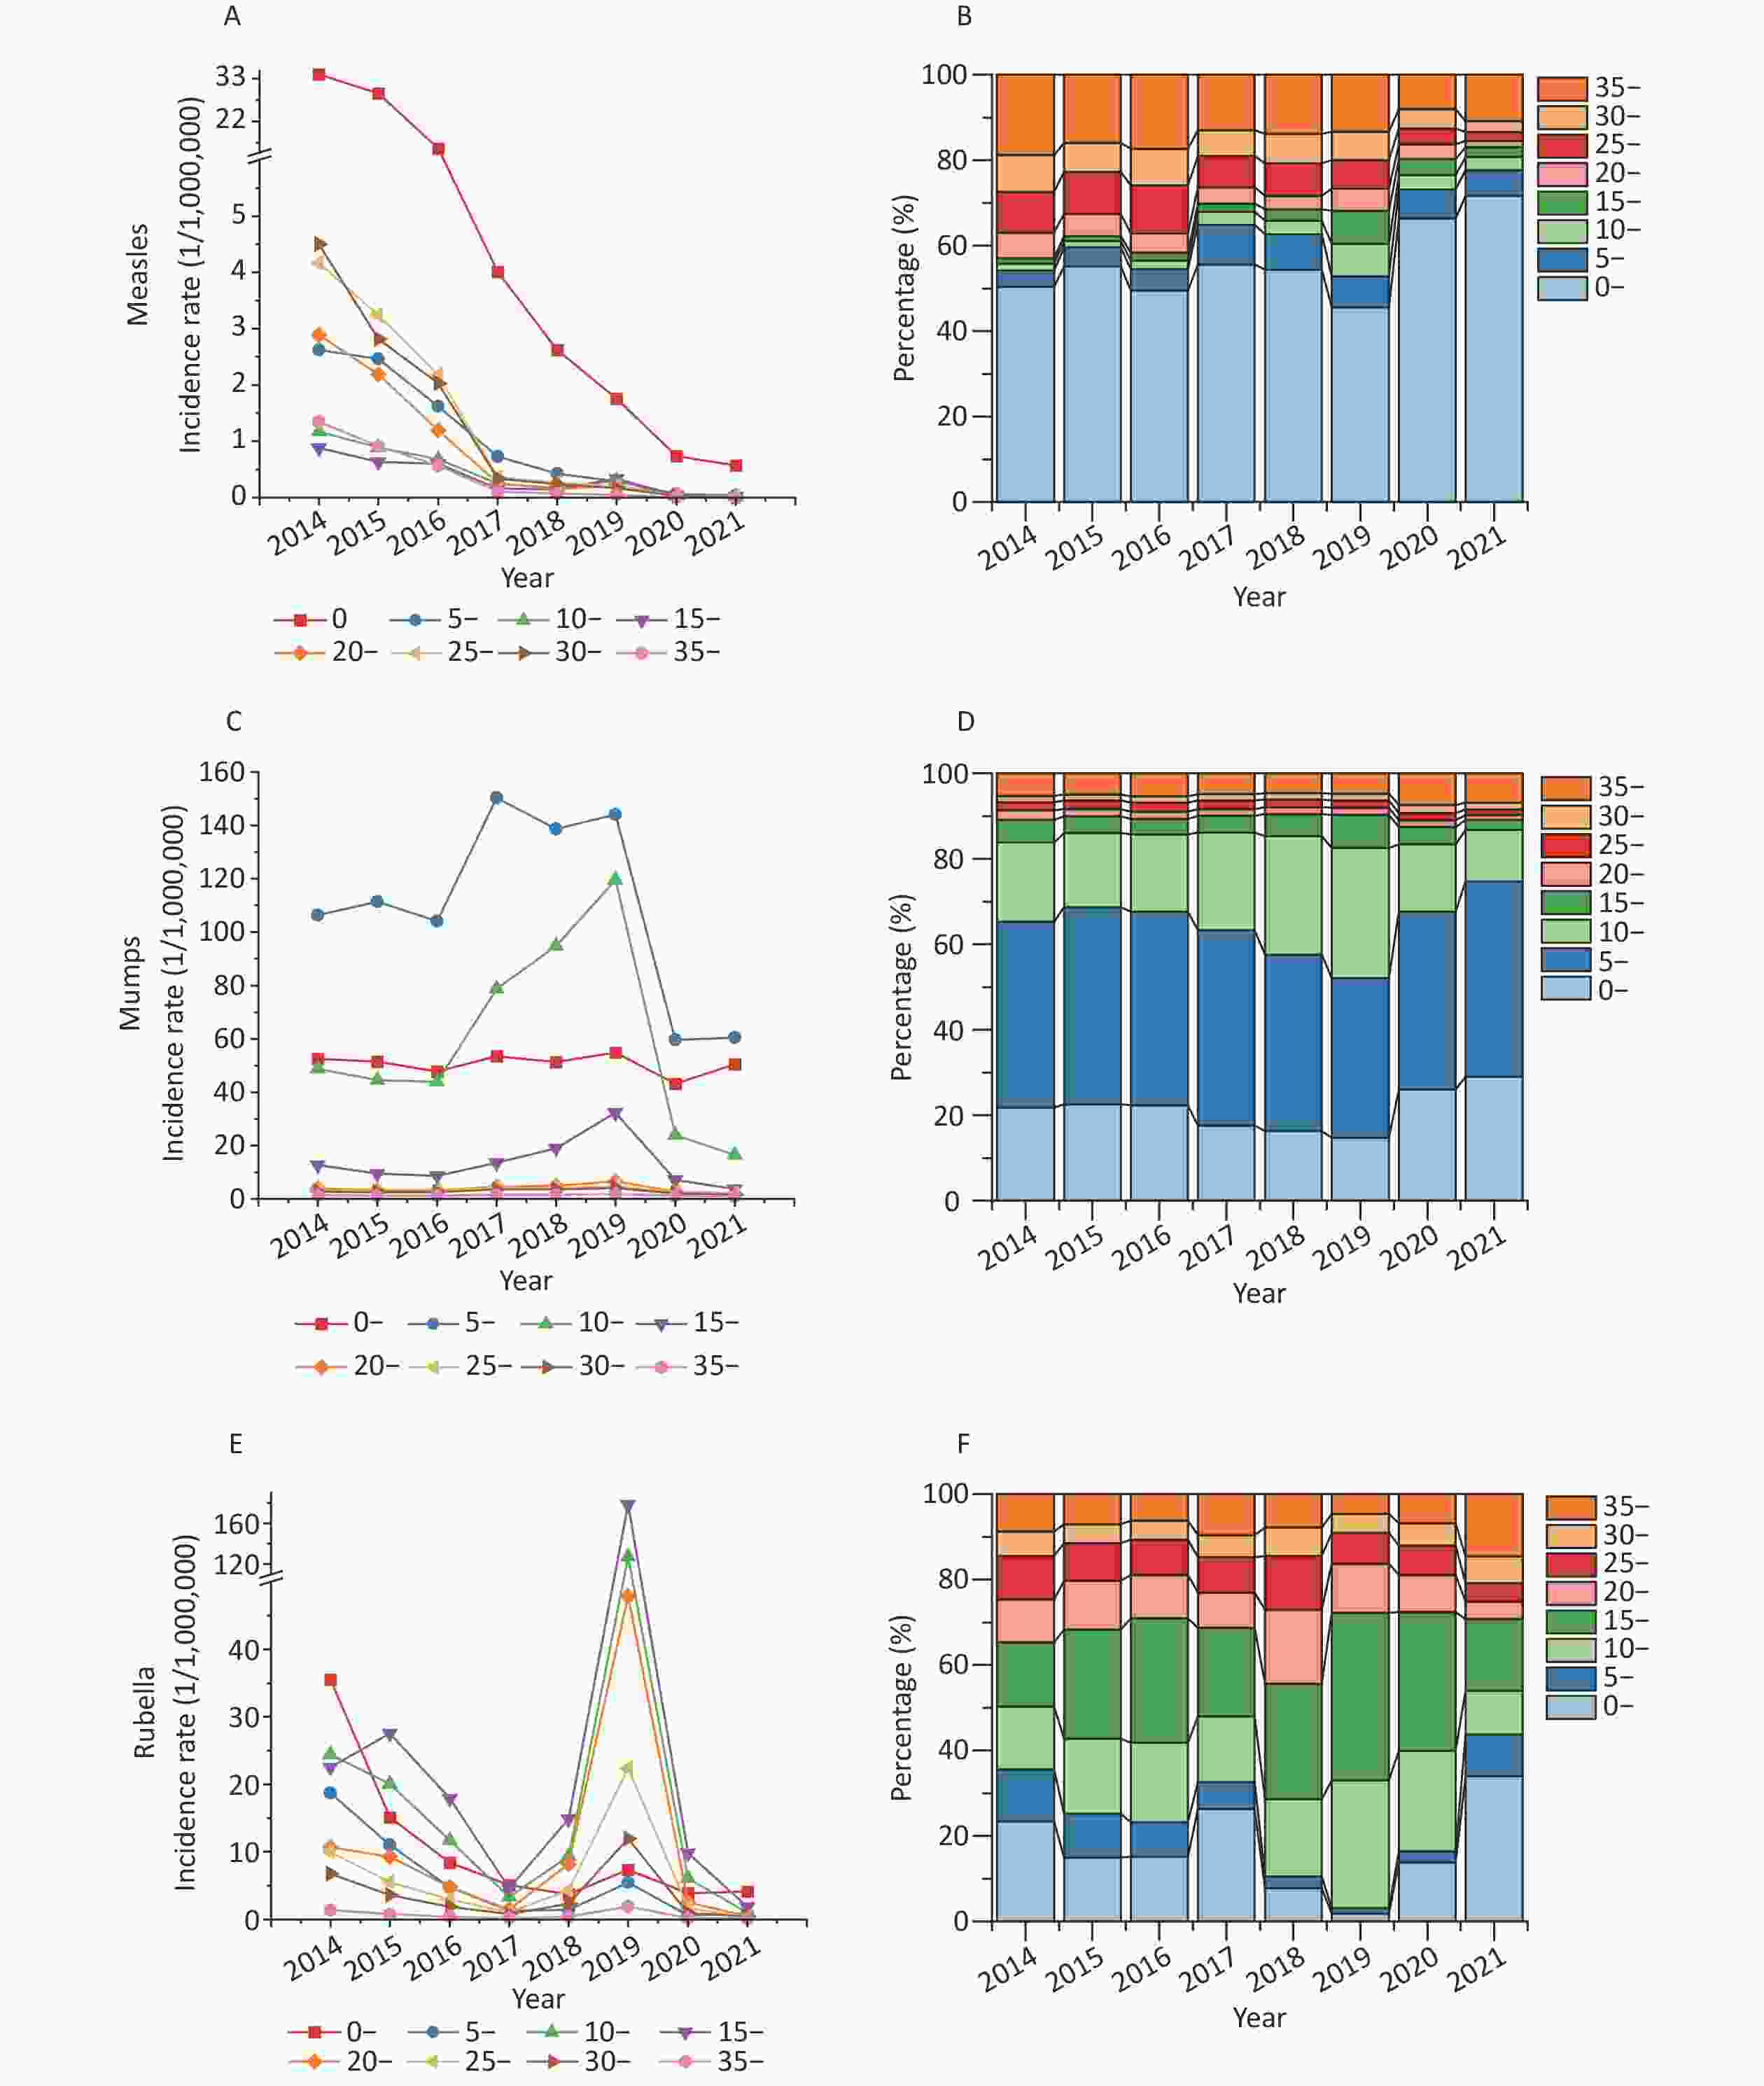
Figure 2. The incidence of measles, mumps, and rubella by age during 2014–2021. (A) Measles incidence rates by age during 2014–2021. (B) The proportion of measles cases by age during 2014–2021. (C) Mumps incidence rates by age during 2014–2021. (D) The proportion of mumps by age during 2014–2021. (E) Rubella incidence rates by age during 2014–2021. (F) The proportion of rubella by age during 2014–2021.
For mumps, children in the 5–9 age group had the highest incidence (107.37/100,000), accounting for 42.85% of all cases. In 2017–2019, the percentage of cases in the age group of 0 to 4 years decreased (14.67% in 2019), whereas that in the age group of 10 to 19 years increased significantly (38.26% in 2019) (Figure 3C and D). Students accounted for 54.96% (883,700) of cases.
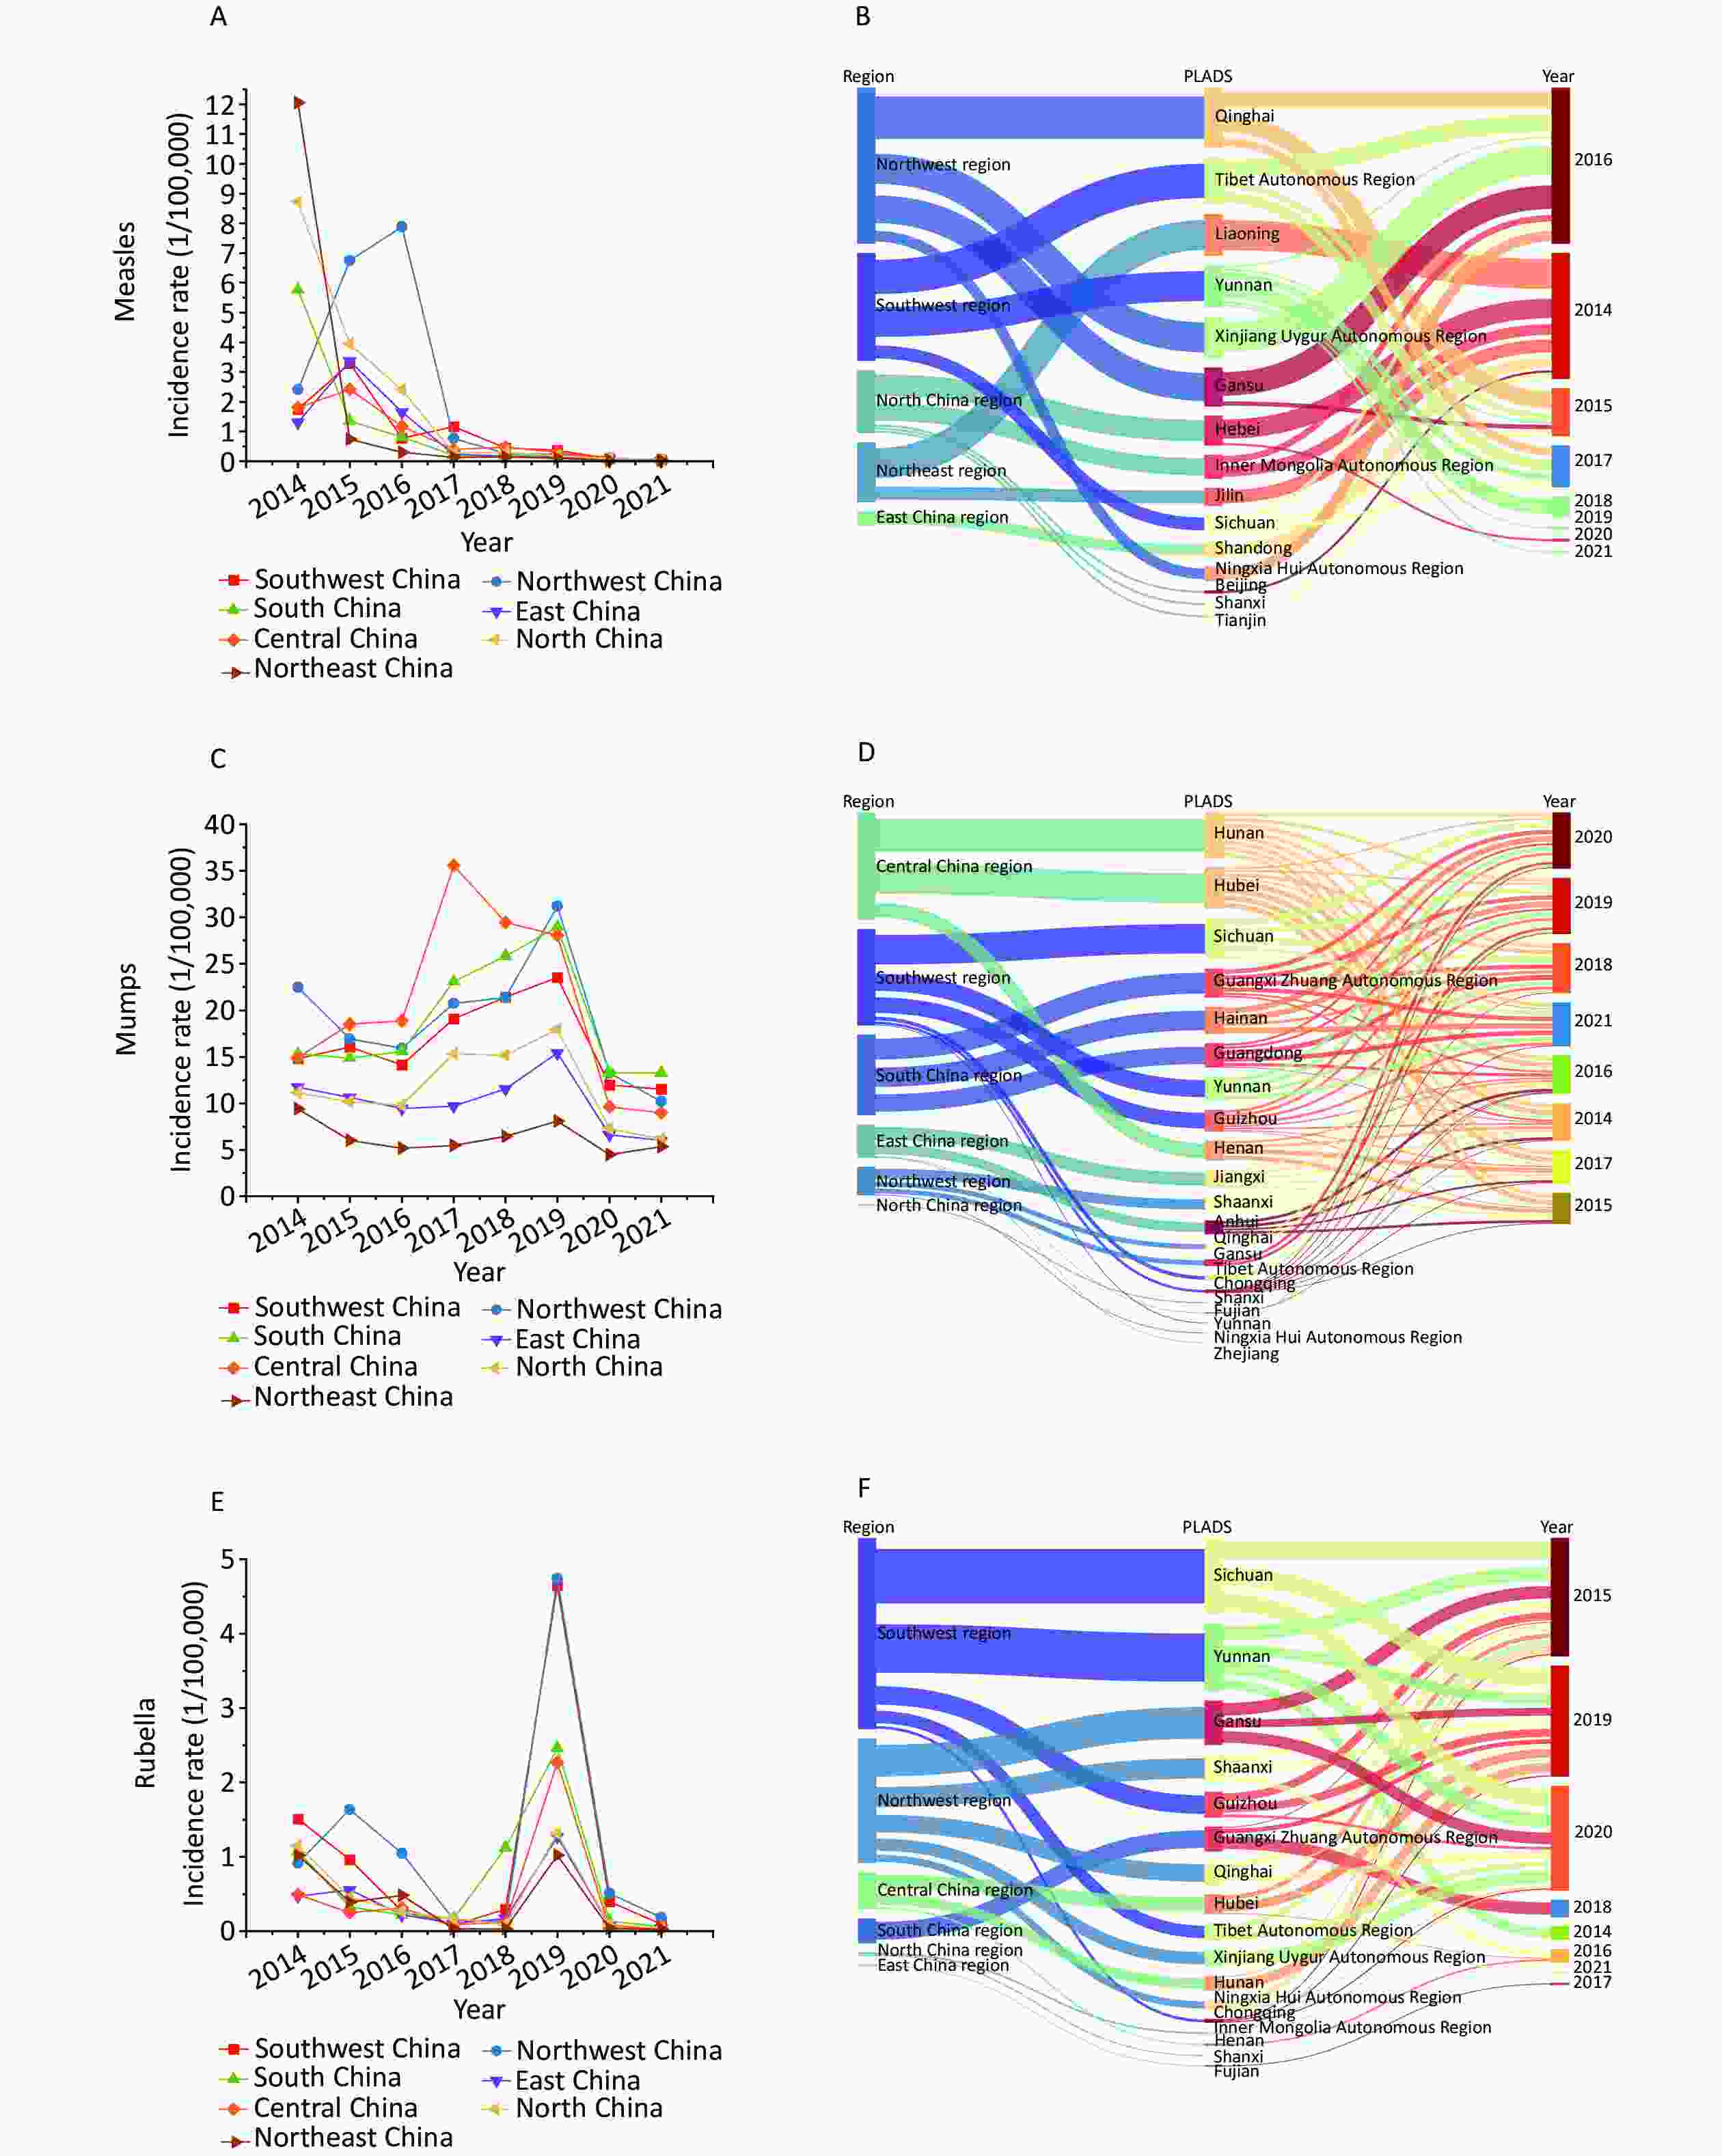
Figure 3. The incidence rates and spatial distributions of measles, mumps, and rubella (MMR) by regions during 2014–2021. (A) The incidence rates of measles by regions during 2014–2021. (B) The spatial distributions of measles by regions during 2014–2021. (C) The incidence of mumps by regions during 2014–2021. (D) The spatial distribution of mumps by regions during 2014–2021. (E) The incidence rates of rubella by regions during 2014–2021. (F) The spatial distributions of rubella by regions during 2014–2021. PLADAs, provincial-level administrative divisions.
The age distribution of rubella cases varied significantly during the eight years. The 15–19 age group experienced the highest incidence rate (3.42/100,000), accounting for 30.72% of all cases. The proportion of cases in the age group of 10 to 19 years showed a rising trend in 2019, increasing to 69.04%, whereas the proportion of cases in the age group of 0 to 9 years decreased to 3.11% (Figure 2E and F). Students accounted for 56.25% (n = 36,955) of the cases.
The sex ratio for measles was 1.28, and the ratio of 1.52 was highest in the 0–5 age group. The sex ratio for mumps was 1.50, and the ratio of 1.71 was the highest in the 10–14 age group, whereas more women cases were reported in the age group above 20 years. The sex ratio for rubella was 1.36, and the ratio of 1.55 was the highest in the 20–24 age group.
-
The spatial distribution of MMR varied between 2014 and 2021. The incidence of measles in Northwest China (2.28/100,000), North China (2.00/100,000), and Northeast China (1.76/100,000) was higher than the national average, and more cases (21.35%, 28,680 cases) were reported in East China. Qinghai (7.78/100,000), Xizang (7.37/100,000), and Xinjiang (4.20/100,000) were the top three provincial-level administrative divisions (PLADs) with the highest average incidence of measles from 2014 to 2021. The incidence of measles showed a significant downward trend in most regions, except in Northwest China, where a marked increase was observed in 2014–2016, with Shaanxi showing the highest growth rate of 6.65/100,000 (Figure 3A and B).
The incidence of mumps in Northwest China (18.99/100,000), South China (18.81/100,000), Central China (20.52/100,000), and Southwest China (16.57/100,000) was higher than the national average. Central China accounted for 22.77% (366,083) of all cases. Hainan (33.42/100,000), Hunan (28.14/100,000), and Qinghai (27.67/100,000) were the top three PLADs with the highest average incidence of mumps from 2014 to 2021. Most regions showed a similar trend in mumps incidence, increasing from 2014 to 2019, then declining from 2020 to 2021 during the COVID-19 pandemic. In Northwest China, the incidence increased significantly in 2019 (Gansu accounted for 41.19%, with a growth rate of 1.41). In Central China, a significant increase of 88.34% was observed in 2017 (35.54/100,000) compared with that in 2016 (18.87/100,000), Henan accounted for 38.87% of cases, with an increase of 94.76%, and Hunan accounted for 39.59% of cases, with an increase of 99.32% (Figure 3C and D).
The incidence of rubella in Northwest China (1.17/100,000), Southwest China (1.03/100,000), and South China (0.70/100,000) was above the national average. Most cases were reported in Southwest China, accounting for 25.49% (16,744) of all cases. Chongqing (2.78/100,000), Gansu (1.91/100,000), and Qinghai (1.42/100,000) were the top three PLADs with the highest average incidence of rubella from 2014 to 2021. Rubella rebounded in all regions in 2019, especially in Southwest and Northwest China. In Northwest China, Gansu Province accounted for 64.40% of the cases, which was approximately 130 times higher than that in 2018. In Southwest China, Chongqing accounted for 57.92% of the cases, with a growth rate of 106.96 (Figure 3E and F).
-
The Spatiotemporal distribution of MMR varied between 2014 and 2021. Spatiotemporal clusters were identified in all seven regions, with a gradual decrease over the eight years. The most likely clusters of measles occurred in five regions, including 15 PLADs and 102 prefectures (P < 0.001). From 2014 to 2021, the spatiotemporal trend of clustering gradually shifted from Northeast and Northwest to Southwest and Northwest China (Supplementary Figure S1, available in www.besjournal.com).
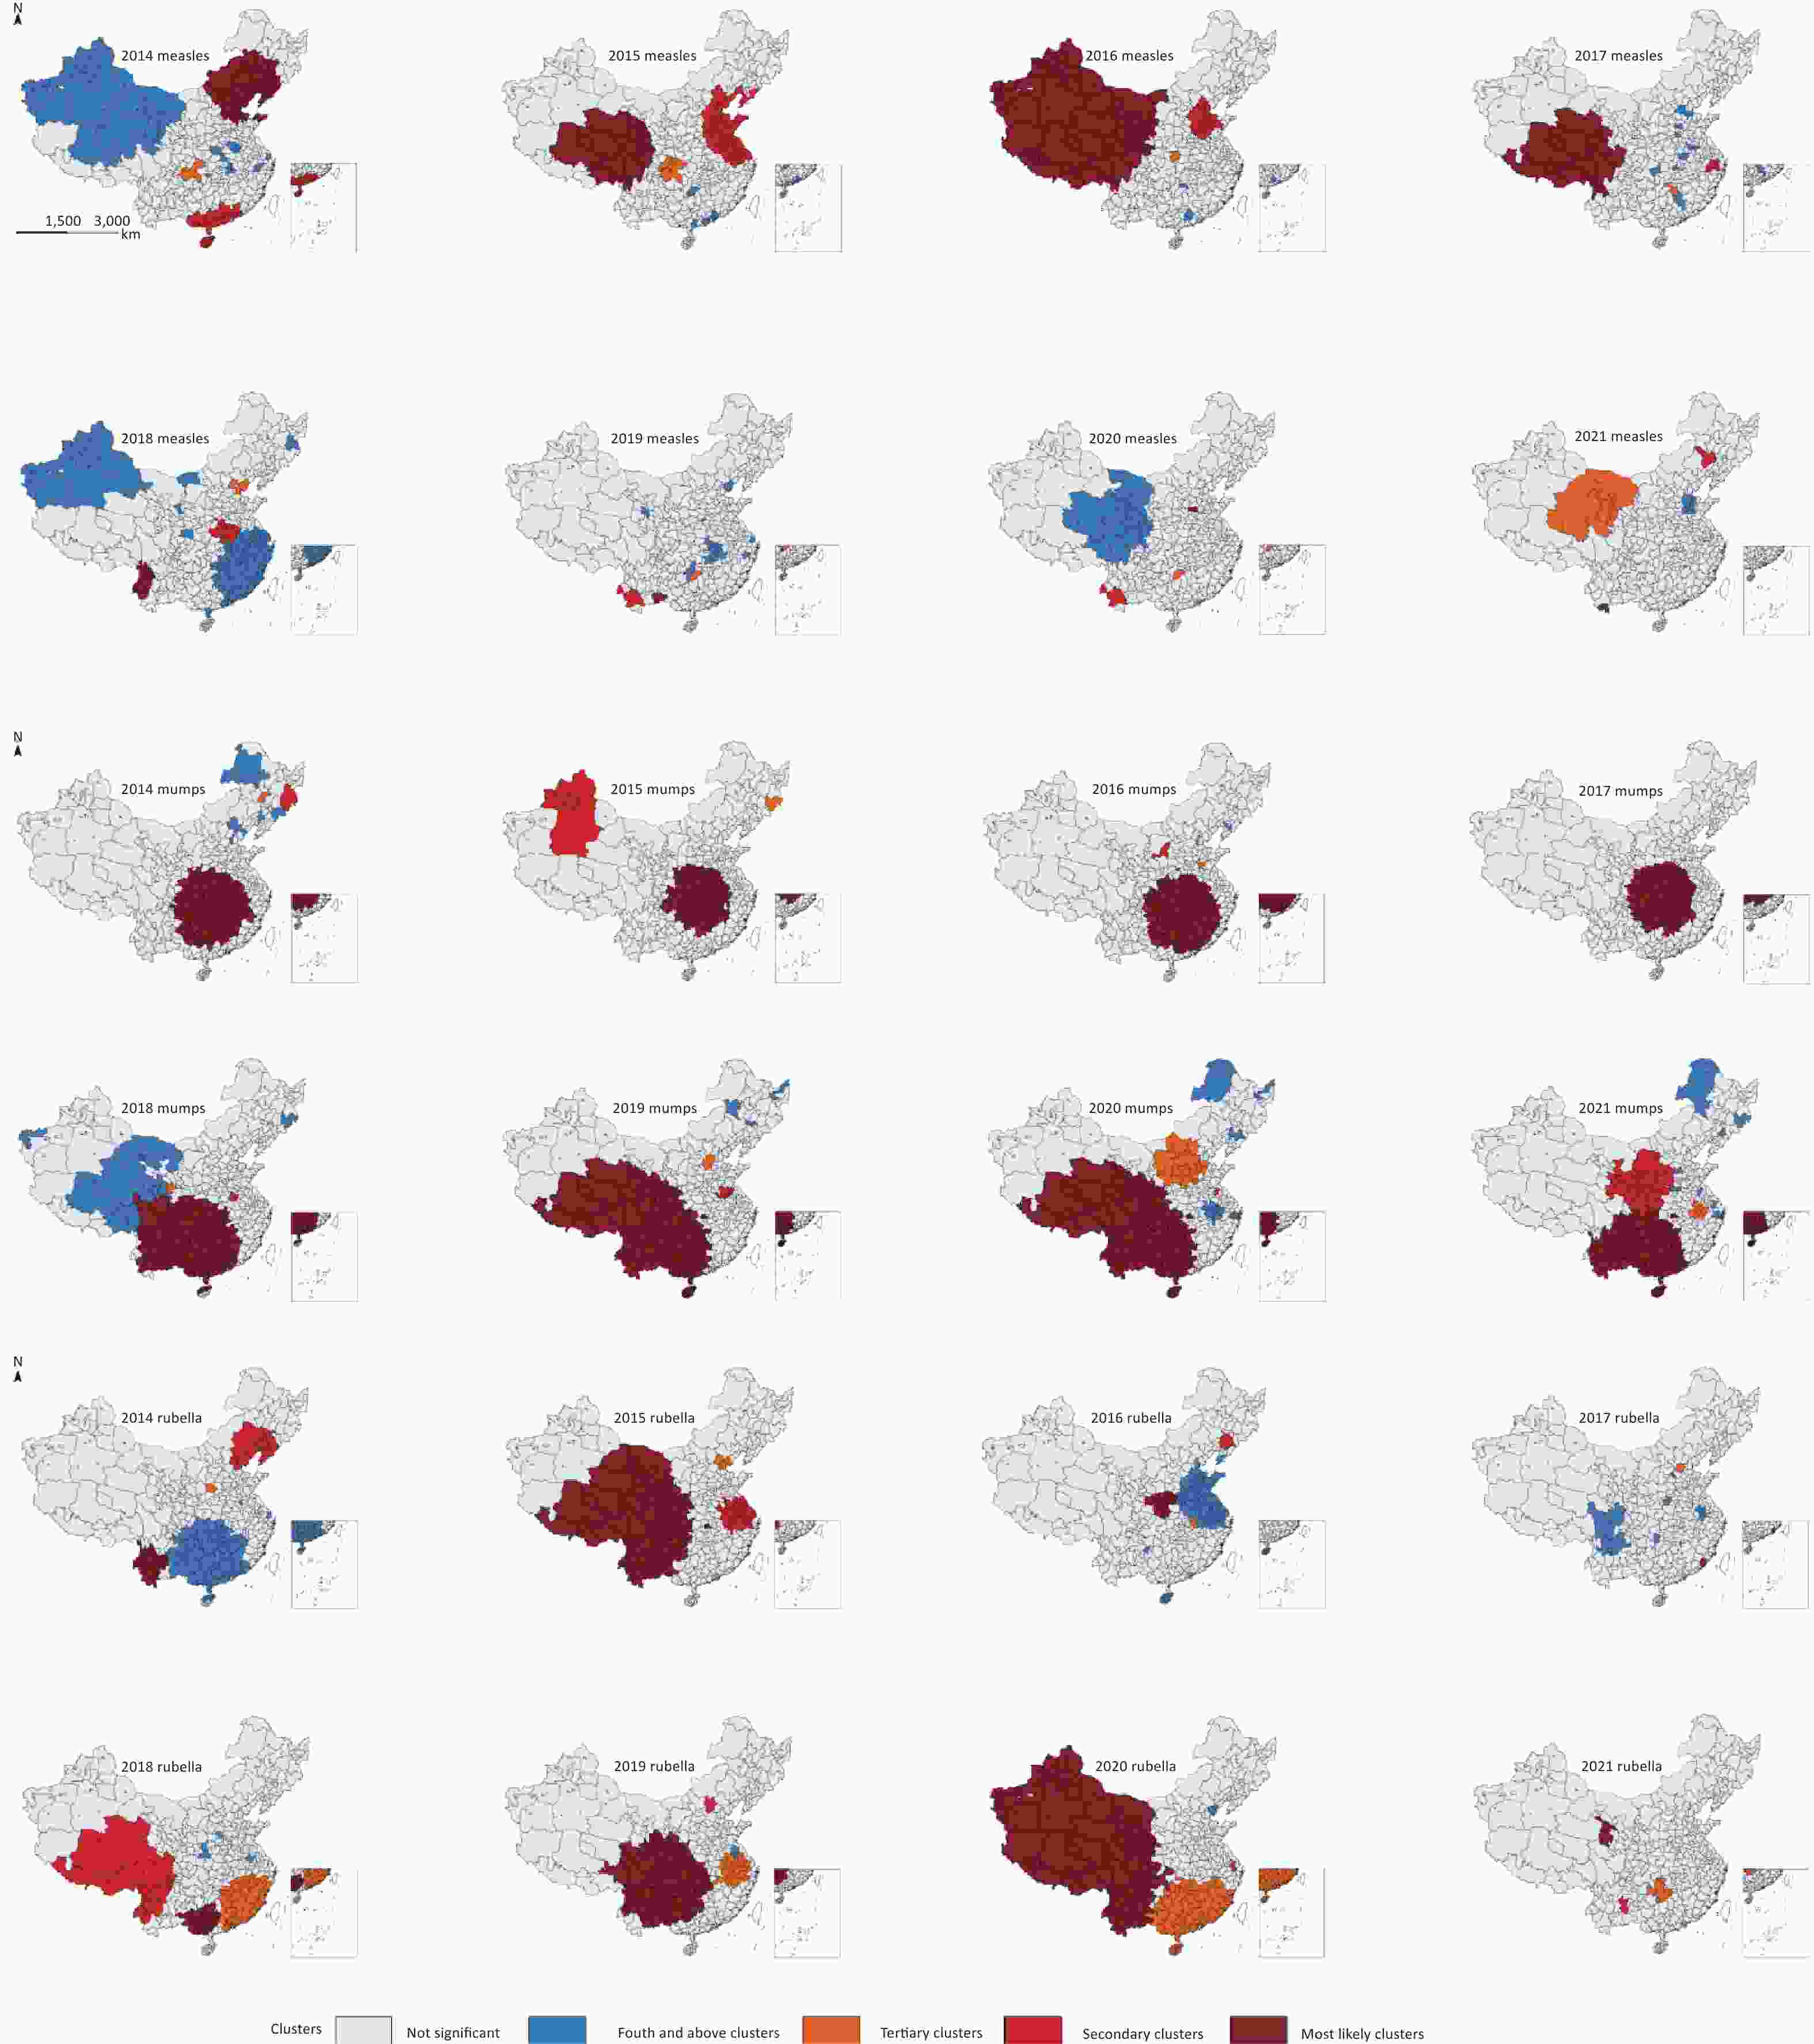
Figure S1. Spatiotemporal clustering of measles, mumps, and rubella (MMR) incidence rates in 358 prefectures from 2014 to 2021.
The most likely clusters of mumps occurred in six regions, including 20 PLADs and 201 prefectures (P < 0.001), mainly in Central, Southwest, and South China, showing a noticeable geographic expansion trend over the study period. Following a resurgence in Central China in 2017, clustering expanded from 2018 to 2019. From 2014 to 2021, the spatiotemporal clustering of mumps gradually shifted from central to southern and southwestern China (Supplementary Figure S1).
The most likely clusters of rubella occurred in six regions, including 16 PLADs and 153 prefectures (P < 0.001), and were mainly identified in the western regions in 2015 and 2020. From 2014 to 2021, the spatiotemporal clustering of rubella showed a gradual expansion trend from Southwest and Northwest China to South, Southwest, and Northwest China (Supplementary Figure S1).
-
Global spatial autocorrelation analysis of the annual incidence of MMR from 2014 to 2021 showed that the annual Moran’s I was significant (Table 2), with annual Moran’s I statistics between 0.020 and 0.254 (P < 0.05).
Table 2. The Moran’s I statistics for incidence rates of measles, mumps, and rubella during 2014–2021
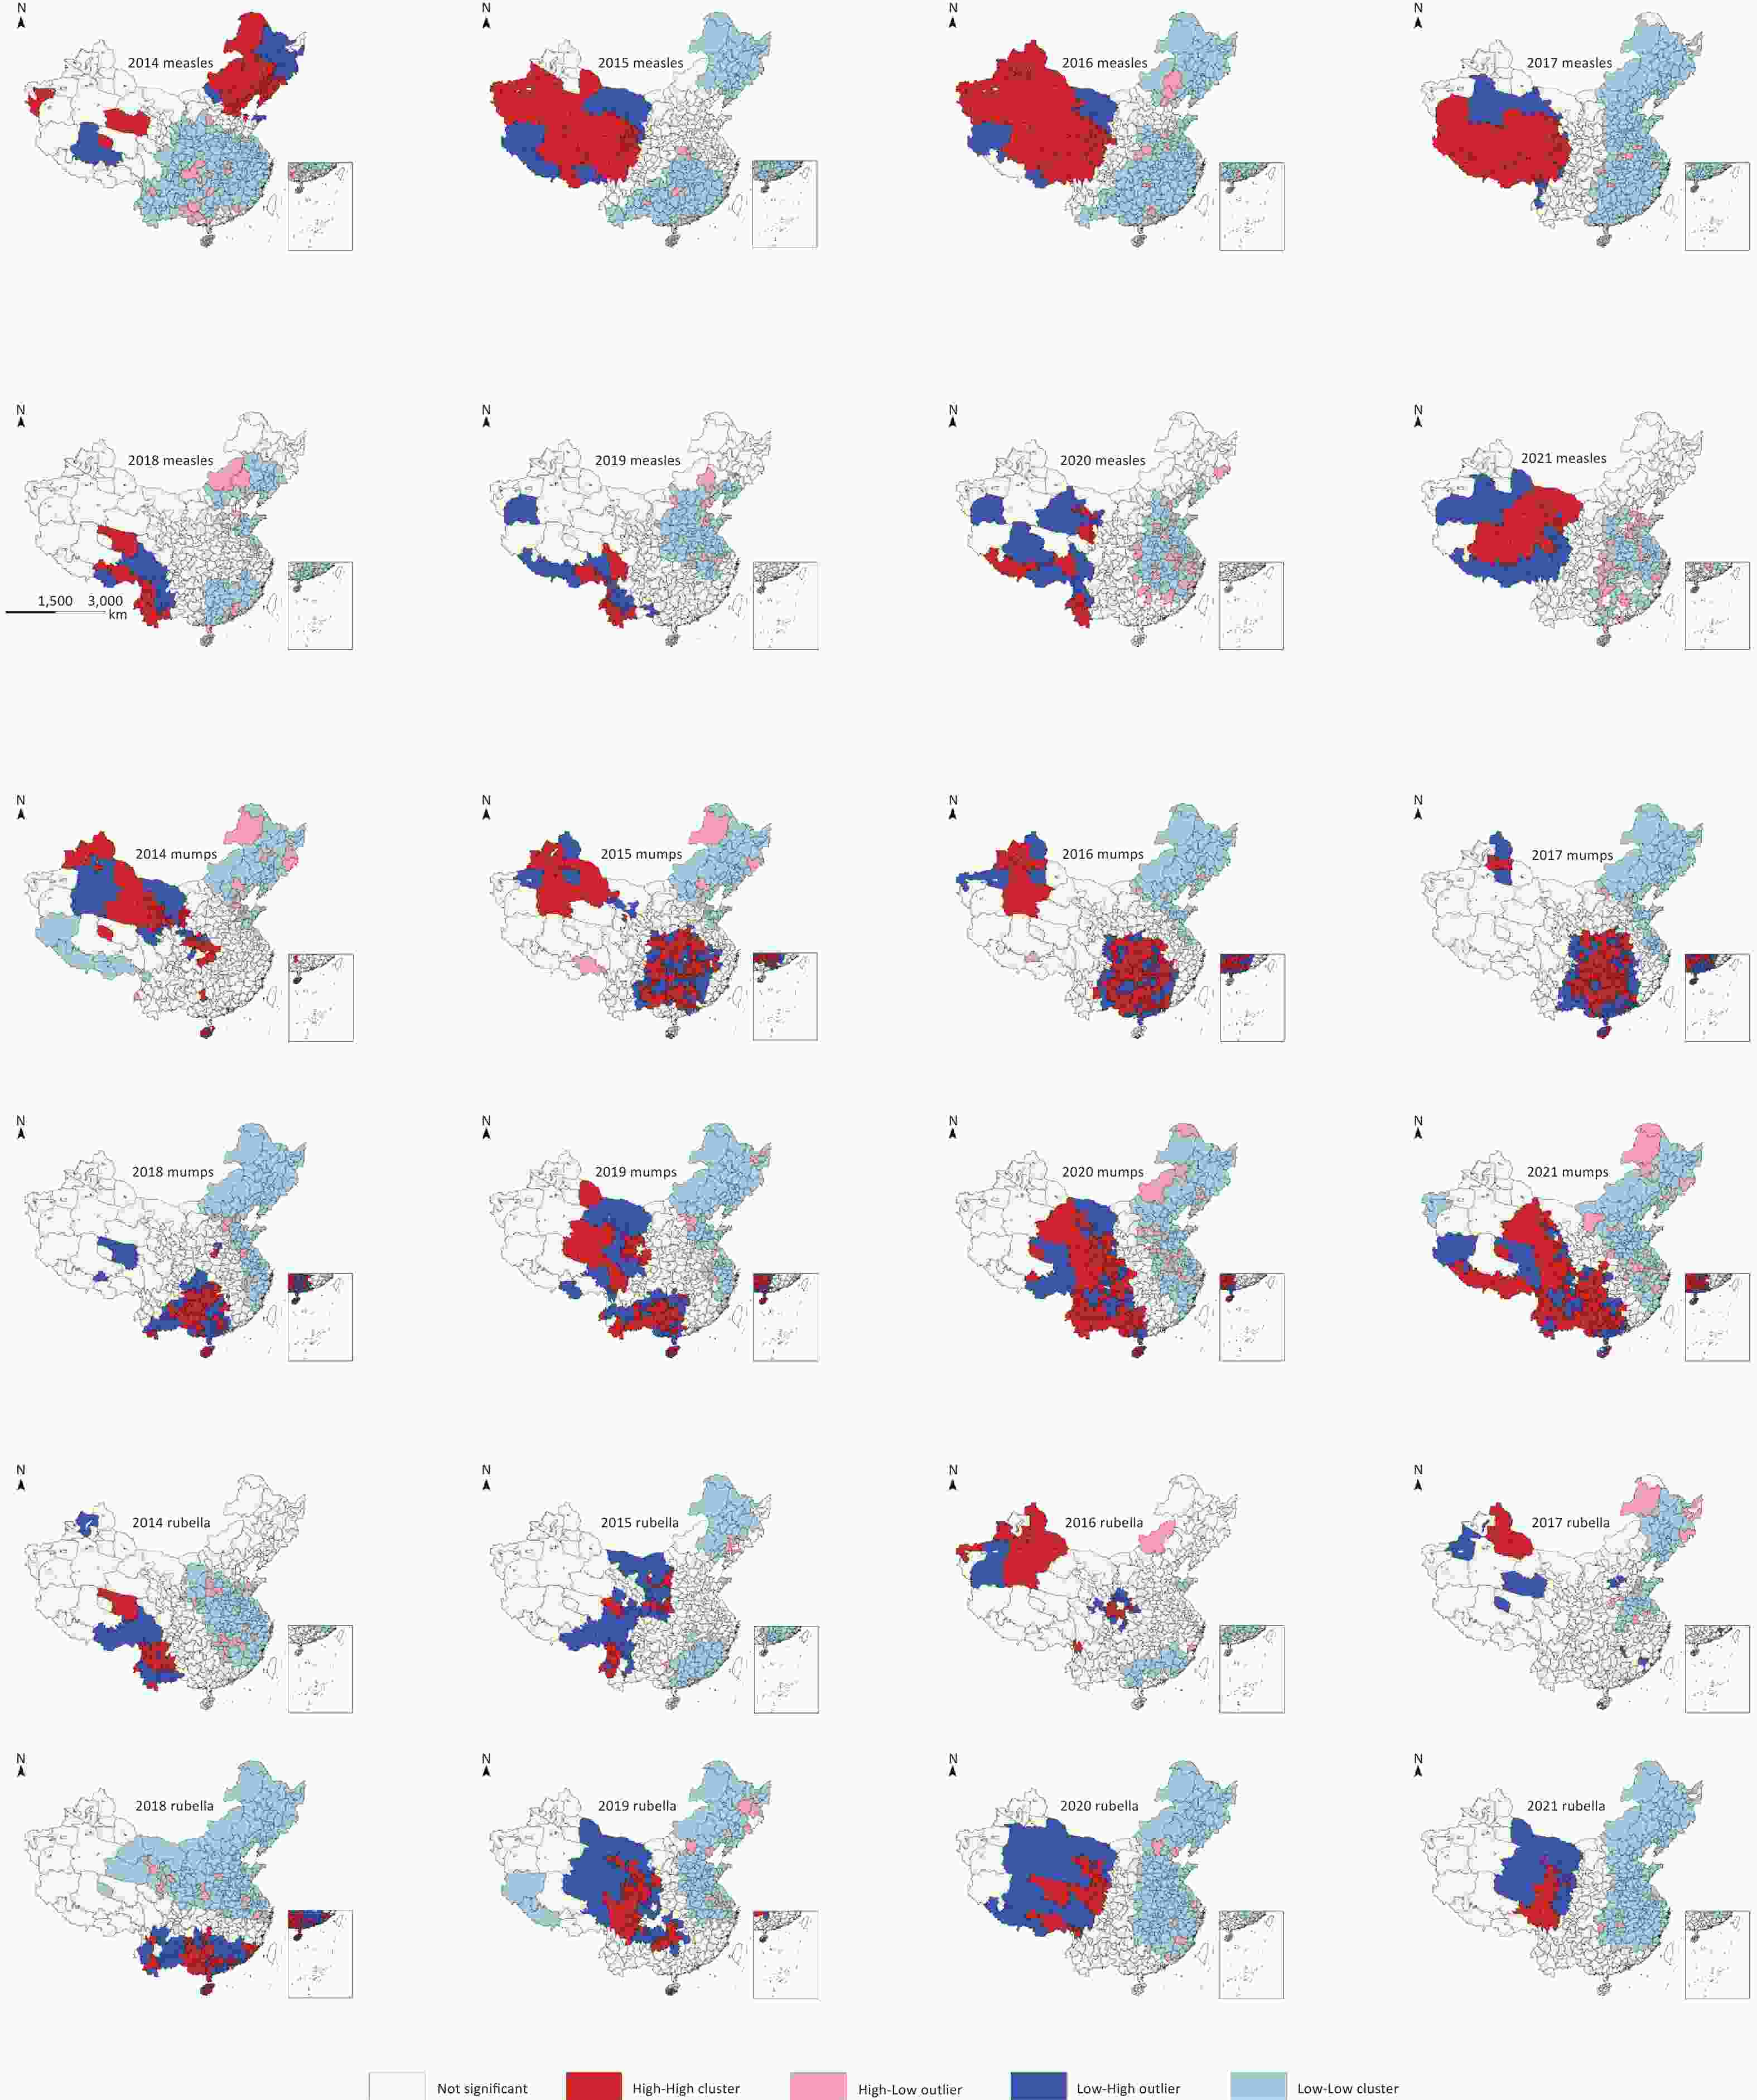
Year Moran’s I Z-score P Measles Mumps Rubella Measles Mumps Rubella Measles Mumps Rubella 2014 0.254 0.111 0.024 25.461 11.285 5.052 < 0.001 < 0.001 < 0.001 2015 0.129 0.119 0.020 15.673 11.765 2.677 < 0.001 < 0.001 0.007 2016 0.204 0.126 0.031 21.936 12.698 3.625 < 0.001 < 0.001 < 0.001 2017 0.188 0.158 0.018 20.231 2.222 15.614 < 0.001 < 0.001 0.026 2018 0.086 0.140 0.164 14.001 14.267 16.902 < 0.001 < 0.001 < 0.001 2019 0.057 0.096 0.072 7.082 9.944 9.313 < 0.001 < 0.001 < 0.001 2020 0.030 0.155 0.072 3.428 15.711 9.313 < 0.001 < 0.001 < 0.001 2021 0.065 0.112 0.045 7.017 11.501 6.565 < 0.001 < 0.001 < 0.001 Supplementary Figure S2 shows the analysis results of local spatial autocorrelation; hotspots and potential risk areas of measles increased in the west, and high-risk foci existed in the east between 2014 and 2021. Hotspots and potential risk areas of mumps increased in the southwest, and high-risk foci existed in the east between 2014 and 2021. Hotspots and potential risk areas of rubella increased in the northwest, and Low-Low (LL) areas were present in the east between 2014 and 2021.
-
The combined vaccine for MMR can stimulate an adequate immune response in children simultaneously for the three infections and has been widely used for immunizing children in China’s mainland since 2007. This has resulted in a very obvious downward trend in the incidence rate. However, MMR remains a major cause of morbidity in childhood, with hundreds of thousands of cases reported annually. In 2021, China extended the age for vaccination, allowing individuals under 18 years who had not completed the prescribed doses according to the national immunization plan at the recommended age to continue to receive vaccinations. MMR is a highly contagious disease that requires maintaining high population immunity to prevent outbreaks. Outbreaks and clusters of cases can serve as tracer indicators for identifying weaknesses and gaps in immunization programs and public health systems.
In this study, we identified hotspots and spatiotemporal clusters of MMR cases through an analysis of the cases reported from 2014 to 2021. Heterogeneous epidemiological characteristics in the incidences of MMR were revealed. Although measles exhibited a significant declining trend, cases and outbreaks continued to be reported from broad areas. Meanwhile, resurgences of mumps and rubella in different regions were reported alternatively, peaking in 2019. Similar epidemiological characteristics of these three diseases have been reported by other researchers[13-15].
The population seriously affected by MMR was primarily younger. Most reported measles cases were in children below 5 years of age, especially those under 2 years of age. Effective prevention of measles relies on extremely high population immunization rates[11], which are not equivalent to reported vaccination rates at the national or regional level and are easily influenced by external factors[12]. The number of children susceptible to measles increased globally by millions by the end of 2020 compared with that in 2019[26-29]. Therefore, a real-time and intelligent monitoring system should be established to provide timely evaluation of any immediate elevated risk of measles transmission and outbreaks for evidence-based early intervention.
Cases of mumps have been observed mainly among adolescents and young adults aged 10–19 years[30-33]. This may be due to a combination of incomplete protection offered by the two doses of the mumps component of the MMR vaccine and the increased intensity of social contact that facilitates viral transmission[34-36]. The humoral immune response to a mumps-containing vaccine in humans is lower than that following natural infection and appears to wane over time[9,30-32,37]. In addition, the genotypic variation between the vaccine strain and the circulating virus may also reduce the effectiveness of immune protection[34-36,38]. The MMR vaccine has been highly effective in reducing the overall morbidity and mortality of the three diseases it protects against[1]. Sustained high vaccination coverage lowers the likelihood of outbreaks in a population[33], and vaccination has also conferred a direct protective effect on the severity of mumps disease[1]. A significant proportion of rubella cases have been observed in adolescents and adults, which may be partially due to the vaccination policy since the nationwide vaccination of rubella-containing vaccines began in 2008[15].
Clusters of cases were identified every year during the study period. The clustering of measles and rubella was mainly in the western areas, whereas mumps was more likely to cluster in the southern areas. Weaknesses in the health system could contribute to inadequate vaccination coverage, especially for measles-containing vaccines, leading to the appearance of unimmunized children and emerging immunity gaps in older children and adults. During the COVID-19 pandemic in 2020–2021, a decrease in the number of mumps cases was observed worldwide[39]. Intervention measures, such as the reduction of social contact, implemented during the pandemic could have contributed in reducing the transmission of mumps[40]. In this study, it was suggested that the risk of MMR outbreak was underestimated and local transmission could occur when the source of infection was introduced. It is necessary to strengthen the monitoring and surveillance systems and the capacity to identify chains of transmission to prevent and interrupt outbreaks in a timely manner.
Measles outbreaks occur mostly in unvaccinated or under-vaccinated individuals[41], and measles vaccines are highly effective against circulating wild-type viruses[42]. However, it is vital to be cautious about incidence fluctuations, as observed in other countries that had already announced the elimination of measles and rubella[4,6]. Due to the implementation of intensive immunization activities in China’s mainland, the proportion of measles cases above 10 years of age has been decreasing since 2020. However, cases over 35 years of age have been increasing, which requires further understanding of the inadequate mechanisms of vaccination for catch-up vaccination to fill emerging immunity gaps in older children and adults through surveillance and epidemiological investigations. A resurgence of mumps has also been noted in several countries with high vaccine coverage in recent years. The periodicity of mumps epidemics may be due to waning humoral immunity and the antigenic variation of the circulating wild-type mumps virus[1,9,30-33,37,43].
The spatial and temporal distributions of these three diseases vary by region, and the underlying mechanisms should be investigated and evaluated to optimize strategies and measures for the prevention and control of MMR. Measles and rubella clustered predominantly in the western areas, whereas mumps clustered more frequently in the southern areas. The threat of increasing and clustering measles faced by the northwest is more noticeable than in other areas in China. This has been partially attributed to sandstorms and wind speed in several studies[16,44]. Mumps remains a public health problem that should not be ignored, especially in Henan, Hunan, and Gansu, and the affected areas showed a trend of expansion. Similar to other reports[15], rubella clustered mainly in western areas, especially in Chongqing and Gansu. In addition to environmental factors, the meteorological variables proposed in other studies[2], vaccination coverage, surveillance systems, and health service capabilities play important roles in the variability of MMR clustering and outbreak potential.
-
The incidence of MMR in China’s mainland showed a significant downward trend under the effects of comprehensive prevention and control measures, with a focus on vaccination. However, the heterogeneous epidemiological characteristics of MMR shed light on the weaknesses and gaps in surveillance and timely control of MMR transmission, which could serve as cross-reference tracer indicators for optimizing control and prevention strategies and measures. The mechanisms underlying inadequate immunization should be investigated, and real-time intelligent monitoring data should be collected for early evidence-based interventions.
-
Zhuowei Li collected and analyzed the data and drafted the manuscript. Lele Deng contributed to data analysis. Jiandong Li, Xiang Ren, and Guangxue He designed the study and revised the manuscript.
doi: 10.3967/bes2024.135
Epidemiological Characteristics of Measles-Mumps-Rubella in China’s Mainland during 2014–2021
-
Abstract:
Objective To analyze the epidemiological characteristics of measles, mumps, and rubella (MMR) between 2014 and 2021 and identify potential strategies and measures for the prevention and control of MMR in China. Methods Data on MMR was obtained from China’s National Notifiable Disease Reporting System for the period from 2014 to 2021. Spatiotemporal distributions were analyzed using SaTScan; temporal trends were analyzed using JoinPoint; and clusters were visualized using ArcGIS. Results A total of 1,808,067 cases of MMR were reported from 2014 to 2021 in China’s mainland, most of which were children and students under the age of 20. The incidence of measles declined during 2014–2021, whereas that of mumps and rubella peaked in 2019. MMR-reported cases generally peaked from March to July; however, high numbers of mumps cases were reported from September to November in 2020–2021. Measles and rubella clusters predominantly occurred in Western China, whereas clusters of mumps were generally found in the southern region. Conclusion The relatively heterogeneous epidemiological characteristics of MMR have highlighted the weaknesses and gaps in surveillance and timely control of MMR transmission in China’s mainland. Real-time and intelligent monitoring data should be collected for evidence-based early interventions. -
Key words:
- Measles /
- Mumps /
- Rubella /
- Epidemiological characteristics /
- Spatiotemporal analysis
注释:1) CONFLICTS OF INTEREST: -
Figure 2. The incidence of measles, mumps, and rubella by age during 2014–2021. (A) Measles incidence rates by age during 2014–2021. (B) The proportion of measles cases by age during 2014–2021. (C) Mumps incidence rates by age during 2014–2021. (D) The proportion of mumps by age during 2014–2021. (E) Rubella incidence rates by age during 2014–2021. (F) The proportion of rubella by age during 2014–2021.
Figure 3. The incidence rates and spatial distributions of measles, mumps, and rubella (MMR) by regions during 2014–2021. (A) The incidence rates of measles by regions during 2014–2021. (B) The spatial distributions of measles by regions during 2014–2021. (C) The incidence of mumps by regions during 2014–2021. (D) The spatial distribution of mumps by regions during 2014–2021. (E) The incidence rates of rubella by regions during 2014–2021. (F) The spatial distributions of rubella by regions during 2014–2021. PLADAs, provincial-level administrative divisions.
Table 1. The incidence of measles, mumps, and rubella (MMR) during 2014–2021
Year Measles Mumps Rubella MMR N (1/100,000) N (1/100,000) N (1/100,000) N (1/100,000) 2014 52,651 (3.83) 187,674 (13.63) 11,796 (0.86) 252,121 (1.83) 2015 42,373 (3.06) 183,010 (13.23) 8,138 (0.59) 233,521 (1.69) 2016 24,839 (1.78) 175,225 (12.59) 4,533 (0.33) 204,597 (1.47) 2017 5,994 (0.43) 252,986 (18.07) 1,597 (0.11) 260,577 (1.86) 2018 3,971 (0.28) 259,343 (18.45) 3,933 (0.28) 267,247 (1.90) 2019 3,092 (0.22) 300,358 (21.30) 32,653 (2.32) 336,103 (2.38) 2020 866 (0.06) 129,308 (9.16) 2,203 (0.16) 132,377 (0.94) 2021 551 (0.04) 120,125 (8.50) 848 (0.06) 121,524 (0.86) Total 134,337 (1.20) 1,608,029 (14.37) 65,701 (0.59) 1,808,067 (16.15) Table 2. The Moran’s I statistics for incidence rates of measles, mumps, and rubella during 2014–2021
Year Moran’s I Z-score P Measles Mumps Rubella Measles Mumps Rubella Measles Mumps Rubella 2014 0.254 0.111 0.024 25.461 11.285 5.052 < 0.001 < 0.001 < 0.001 2015 0.129 0.119 0.020 15.673 11.765 2.677 < 0.001 < 0.001 0.007 2016 0.204 0.126 0.031 21.936 12.698 3.625 < 0.001 < 0.001 < 0.001 2017 0.188 0.158 0.018 20.231 2.222 15.614 < 0.001 < 0.001 0.026 2018 0.086 0.140 0.164 14.001 14.267 16.902 < 0.001 < 0.001 < 0.001 2019 0.057 0.096 0.072 7.082 9.944 9.313 < 0.001 < 0.001 < 0.001 2020 0.030 0.155 0.072 3.428 15.711 9.313 < 0.001 < 0.001 < 0.001 2021 0.065 0.112 0.045 7.017 11.501 6.565 < 0.001 < 0.001 < 0.001 -
[1] Bankamp B, Hickman C, Icenogle JP, et al. Successes and challenges for preventing measles, mumps and rubella by vaccination. Curr Opin Virol, 2019; 34, 110−6. doi: 10.1016/j.coviro.2019.01.002 [2] Pan JH, Wang YS, Cao LS, et al. Impact of immunization programs on 11 childhood vaccine-preventable diseases in China: 1950-2018. Innovation (Camb), 2021; 2, 100113. [3] World Health Organization. “Global measles and rubella strategic plan: 2021-2030” in Tech. Report No. ISBN 978-92-4-001561-6 (electronic version), (World Health Organization, Geneva, Switzerland, 2020). [4] World Health Organization. Measles reported cases and incidence. https://immunizationdata.who.int/pages/incidence/MEASLES.html?CODE=Global&YEAR=. [2023-10-17]. [5] Guerra FM, Bolotin S, Lim G, et al. The basic reproduction number (R0) of measles: a systematic review. Lancet Infect Dis, 2017; 17, e420−e428. doi: 10.1016/S1473-3099(17)30307-9 [6] World Health Organization. Rubella reported cases and incidence. https://immunizationdata.who.int/pages/incidence/RUBELLA.html?CODE=Global&YEAR=. [2023-10-17] [7] Winter AK, Moss WJ. Rubella. Lancet, 2022; 399, 1336−46. doi: 10.1016/S0140-6736(21)02691-X [8] Hviid A, Rubin S, Mühlemann K. Mumps. Lancet, 2008; 371, 932−44. doi: 10.1016/S0140-6736(08)60419-5 [9] Su SB, Chang HL, Chen AKT. Current status of mumps virus infection: epidemiology, pathogenesis, and vaccine. Int J Environ Res Public Health, 2020; 17, 1686. doi: 10.3390/ijerph17051686 [10] Centers for Disease Control and Prevention. Measles Cases and Outbreaks. https://www.cdc.gov/measles/data-research/index.html. [2024-11-17]. [11] Majumder MS, Cohn EL, Mekaru SR, et al. Substandard vaccination compliance and the 2015 measles outbreak. JAMA Pediatr, 2015; 169, 494−5. doi: 10.1001/jamapediatrics.2015.0384 [12] Truelove SA, Graham M, Moss WJ, et al. Characterizing the impact of spatial clustering of susceptibility for measles elimination. Vaccine, 2019; 37, 732−41. doi: 10.1016/j.vaccine.2018.12.012 [13] Song QW, Ma C, Hao LX, et al. Healthy China: effects of Three Major Immunization Interventions on Measles Control - China, 1952-2021. China CDC Wkly, 2023; 5, 385−90. doi: 10.46234/ccdcw2023.073 [14] Fu XF, Ge MJ, Xu WC, et al. Epidemiological features and sociodemographic factors associated with mumps in mainland of China from 2004 to 2018. J Med Virol, 2022; 94, 4850−9. doi: 10.1002/jmv.27955 [15] Su QR, Ma C, Wen N, et al. Epidemiological profile and progress toward rubella elimination in China. 10 years after nationwide introduction of rubella vaccine. Vaccine, 2018; 36, 2079−85. doi: 10.1016/j.vaccine.2018.03.013 [16] Ma YX, Zhou JD, Yang SX, et al. Assessment for the impact of dust events on measles incidence in western China. Atmos Environ, 2017; 157, 1−9. doi: 10.1016/j.atmosenv.2017.03.010 [17] Chinese Center for Disease Control and Prevention. National Measles Surveillance Programme. https://www.chinacdc.cn/jkzt/crb/zl/mz/jszl_2205/200904/t20090413_24216.html. (In Chinese). [2023-10-17]. [18] Chinese Center for Disease Control and Prevention. Diagnostic Criteria for Mumps (WS270-2007). https://icdc.chinacdc.cn/zcfgybz/bz/202112/t20211202_253350.html. (In Chinese). [2023-10-17]. [19] Chinese Center for Disease Control and Prevention. Diagnostic Criteria for Rubella (WS297-2008). https://icdc.chinacdc.cn/zcfgybz/bz/202112/t20211202_253326.html. (In Chinese) [20] Zheng JY, Zhang N, Shen GQ, et al. Spatiotemporal and seasonal trends of class A and B notifiable infectious diseases in China: retrospective analysis. JMIR Public Health Surveill, 2023; 9, e42820. doi: 10.2196/42820 [21] Kim HJ, Fay MP, Feuer EJ, et al. Permutation tests for joinpoint regression with applications to cancer rates. Stat Med, 2000; 19, 335−51. doi: 10.1002/(SICI)1097-0258(20000215)19:3<335::AID-SIM336>3.0.CO;2-Z [22] Lee S, Moon J, Jung I. Optimizing the maximum reported cluster size in the spatial scan statistic for survival data. Int J Health Geogr, 2021; 20, 33. doi: 10.1186/s12942-021-00286-w [23] Yiannakoulias N. Using population attributable risk to understand geographic disease clusters. Health Place, 2009; 15, 1142−8. doi: 10.1016/j.healthplace.2009.07.001 [24] Anselin L, Syabri I, Kho Y. GeoDa: An introduction to spatial data analysis. Geogr Anal, 2006; 38, 5−22. doi: 10.1111/j.0016-7363.2005.00671.x [25] Anselin L, Sridharan S, Gholston S. Using exploratory spatial data analysis to leverage social indicator databases: the discovery of interesting patterns. Soc Indic Res, 2007; 82, 287−309. doi: 10.1007/s11205-006-9034-x [26] Dixon MG, Ferrari M, Antoni S, et al. Progress toward regional measles elimination - worldwide, 2000-2020. Morb Mortal Wkly Rep, 2021; 70, 1563−9. doi: 10.15585/mmwr.mm7045a1 [27] Kim S, Headley TY, Tozan Y. Universal healthcare coverage and health service delivery before and during the COVID-19 pandemic: a difference-in-difference study of childhood immunization coverage from 195 countries. PLoS Med, 2022; 19, e1004060. doi: 10.1371/journal.pmed.1004060 [28] Shet A, Carr K, Danovaro-Holliday MC, et al. Impact of the SARS-CoV-2 pandemic on routine immunisation services: evidence of disruption and recovery from 170 countries and territories. Lancet Glob Health, 2022; 10, e186−94. doi: 10.1016/S2214-109X(21)00512-X [29] Ho LL, Gurung S, Mirza I, et al. Impact of the SARS-CoV-2 pandemic on vaccine-preventable disease campaigns. Int J Infect Dis, 2022; 119, 201−9. doi: 10.1016/j.ijid.2022.04.005 [30] Marshall HS, Plotkin S. The changing epidemiology of mumps in a high vaccination era. Lancet Infect Dis, 2019; 19, 118−9. doi: 10.1016/S1473-3099(18)30541-3 [31] Westphal DW, Eastwood A, Levy A, et al. A protracted mumps outbreak in Western Australia despite high vaccine coverage: a population-based surveillance study. Lancet Infect Dis, 2019; 19, 177−84. doi: 10.1016/S1473-3099(18)30498-5 [32] Lewnard JA, Grad YH. Vaccine waning and mumps re-emergence in the United States. Sci Transl Med, 2018; 10, eaao5945. doi: 10.1126/scitranslmed.aao5945 [33] Connell AR, Connell J, Leahy TR, et al. Mumps outbreaks in vaccinated populations-is it time to re-assess the clinical efficacy of vaccines? Front Immunol, 2020; 11, 2089. [34] Barskey AE, Schulte C, Rosen JB, et al. Mumps outbreak in orthodox Jewish communities in the United States. N Engl J Med, 2012; 367, 1704−13. doi: 10.1056/NEJMoa1202865 [35] Smetana J, Chlibek R, Hanovcova I, et al. Serological survey of mumps antibodies in adults in the Czech Republic and the need for changes to the vaccination strategy. Hum Vaccin Immunother, 2018; 14, 887−93. doi: 10.1080/21645515.2017.1412021 [36] Braeye T, Linina I, De Roy R, et al. Mumps increase in Flanders, Belgium, 2012-2013: results from temporary mandatory notification and a cohort study among university students. Vaccine, 2014; 32, 4393−8. doi: 10.1016/j.vaccine.2014.06.069 [37] Deal A, Halliday R, Crawshaw AF, et al. Migration and outbreaks of vaccine-preventable disease in Europe: a systematic review. Lancet Infect Dis, 2021; 21, e387−98. doi: 10.1016/S1473-3099(21)00193-6 [38] Hiebert J, Saboui M, Frost J R, et al. Mumps resurgence in a highly vaccinated population: insights gained from surveillance in Canada, 2002-2020. Vaccine, 2023; 41, 3728−39. doi: 10.1016/j.vaccine.2023.04.078 [39] Principi N, Autore G, Ramundo G, et al. Epidemiology of respiratory infections during the COVID-19 pandemic. Viruses, 2023; 15, 1160. doi: 10.3390/v15051160 [40] Wang Y, Cui AL, Xu WB, et al. Analysis on the reported mumps public health emergencies and its influencing factors in China from 2004 to 2020. Chin J Exp Clin Virol, 2021; 35, 176. (In Chinese) [41] Javelle E, Colson P, Parola P, et al. Measles, the need for a paradigm shift. Eur J Epidemiol, 2019; 34, 897−915. doi: 10.1007/s10654-019-00569-4 [42] Beaty SM, Lee B. Constraints on the genetic and antigenic variability of measles virus. Viruses, 2016; 8, 109. doi: 10.3390/v8040109 [43] Won H, Kim AR, Yoo JS, et al. Cross-neutralization between vaccine and circulating wild-type mumps viruses in Korea. Vaccine, 2021; 39, 1870−6. doi: 10.1016/j.vaccine.2021.01.039 [44] Peng L, Zhao XG, Tao Y, et al. The effects of air pollution and meteorological factors on measles cases in Lanzhou, China. Environ Sci Pollut Res Int, 2020; 27, 13524−33. doi: 10.1007/s11356-020-07903-4 -
 24051+Supplementary Materials.pdf

-


 下载:
下载:



 Quick Links