

 下载:
下载:


-
Chest pain is one of the most frequent presenting symptoms for admitting patients to the emergency department (ED)[1], which is usually caused by acute coronary syndrome (ACS), other cardiac and noncardiac diseases (more than 80%). In the ED, ACS should be rapidly distinguished from a variety of other cardiac and noncardiac diseases causing chest pain[2]. Furthermore, ACS ranges from unstable angina and non-ST elevation ACS (NSTE-ACS) to the more severe transmural ST elevation ACS (STE-ACS), which may result in sudden cardiac death. NSTE-ACS has lower morbidity and mortality but relates to the development of a subsequent, larger myocardial infarction complicated by mechanical or arrhythmogenic complications, revascularization and/or death [major adverse cardiovascular events (MACEs)][3]. Different from chest pain patients with STE-ACS who need rapid clinical intervention[4], early and accurate risk stratification is necessary to the chest pain patients with NSTE-ACS in the ED, in order to determine optimal clinical management and further treatment strategies after discharge[5].
It is very beneficial for chest pain patients with NSTE-ACS to find suitable risk scores systems for risk stratification. Generally, GRACE (Global Registry of Acute Coronary Events), CRUSADE (Can Rapid risk stratification of Unstable angina patients Suppress ADverse outcomes with Early implementation of the ACC/AHA guidelines), HEART (History, ECG, Age, Risk factors, & Troponin) and TIMI (Thrombolysis in Myocardial Infarction) risk scores systems[6] are employed to predict MACEs. However, these scores system lack the ability to track missing data and can only predict limited risk factors associated with MACEs. For example, HEART risk score as a classical method to predict MACEs, only takes 5 indicators into consideration, including History of chest pain with suspected ACS, Electrocardiograph (ECG), Age, Risk factors and Troponin (Each of indicator can be scored with zero, one or two points according to the extent of the abnormality)[2]. TIMI risk score evaluates 7 risk factors as another simple prognostication scheme that categorizes a patient's risk of death and ischemic events and provides a basis for therapeutic decision making[7].
During the past decades, machine learning (ML) techniques[8] has presented itself with impressive performance in clinical application regarding diagnosis[9], risk stratification[10,11], and treatment reaction prediction[12] due to its capability of processing large amounts of complex data by different classifier algorithms[13,14]. Moreover, ML approach as the data-driven prediction model is easier to include more potential risk factors into model, not restricted by inclusion and exclusion criteria, and capable of dealing with missing data by applying computer algorithms to large datasets with numerous, multidimensional variables, capturing high dimensional, nonlinear relationships among clinical variables[15]. In recent year, ML approach has been used for MACEs prediction of ACS patients[16,17], coronary type 2 diabetic patients[18] and geriatric patients[19], and the studies concluded that ML methods can improve both the identification of MACE risk patients and the prediction compared with traditional statistical techniques even in a small sample size. However, it rarely be applied to chest pain patients with non-ST-segment elevation acute coronary syndrome (NSTE-ACS) to predict MACEs and our study try to fill this gap.
Therefore, our study established ML by different classifier algorithms and proved its superiority over HEART risk score to predict MACEs within 3 months in chest pain patients with suspected NSTE-ACS. Ultimately, ML model constructed by Naïve Bayes predicted risk factors of MACEs from 14 categorical variables.
-
In this retrospective study based on a prospectively acquired database, chest pain patients who were treated at Beijing Anzhen Emergency Chest Pain Center, Capital Medical University from September 2014 to February 2015 and at Beijing Bo’ai Hospital, China Rehabilitation Research Center from September 2014 to May 2018, were consecutively enrolled. Beijing Anzhen Hospital and Beijing Bo’ai Hospital, as two of the best cardiovascular hospitals in China, have more concentrated patients with chest pain, more accurate diagnosis of non-ST-ASC with less bias, therefore the chest pain patients with non-ST-ACT are more representative. The patients who were 18 years or older, presented to ED as a result of chest pain with from onset to arrival at the emergency room greater than 2 hours, were included. Patients were excluded if their chest pain caused by with STE-ACS, aortic dissection, pulmonary embolism, trauma or arrhythmia, or they were in end-stage disease, or they were pregnant women or unable or unwilling to provide informed consent. A 3-month follow up was carried out by telephone interview to collect data. Patients were also excluded if their data were incomplete. The study was approved by the Hospital Ethics Committee. All patients had signed informed consent. All procedures performed in studies involving human participants followed the ethical standards of the institutional or national research committee and the 1964 Helsinki declaration and its later amendments or comparable ethical standards.
-
Patients’ data were collected once they arrived at the ED, including sex, age, medical history, risk factors (any risk factor, including but not limited to hypertension, hypercholesterolemia, diabetes, family history of coronary artery disease, smoking and obesity, body mass index, atherosclerotic disease) and electrocardiogram. As shown in Table 1, the 14 categorical variables were selected for further constructing radar plots and ML models.
Table 1. The 14 features selected in classification
Variables Features Sex [1.2], (Female = 1, Male = 2) Coronary artery disease (CAD) CAD history [0, 1], (Y = 1, N = 0) Ischemic stroke [0, 1], (Y = 1, N = 0) Peripheral arterial disease [0, 1], (Y = 1, N = 0) Hypertension [0, 1], (Y = 1, N = 0) Hypercholesterolemia [0, 1], (Y = 1, N = 0) Diabetes mellitus [0, 1], (Y = 1, N = 0) Current Smoking [0, 1], (Y = 1, N = 0) Obesity [0, 1], (Y = 1, N = 0) Family History of Premature CAD [0, 1], (Y = 1, N = 0) History of Chest Pain with suspected ACS (H) [0, 1, 2] ECG (E) [0, 1, 2] Age (A) [0, 1, 2] Troponin levels (T) [0, 1, 2] -
Endpoint The endpoint was the occurrence of any MACE including acute myocardial infarction (AMI), percutaneous coronary intervention (PCI), coronary artery bypass grafting (CABG) or all-cause death within 3 months.
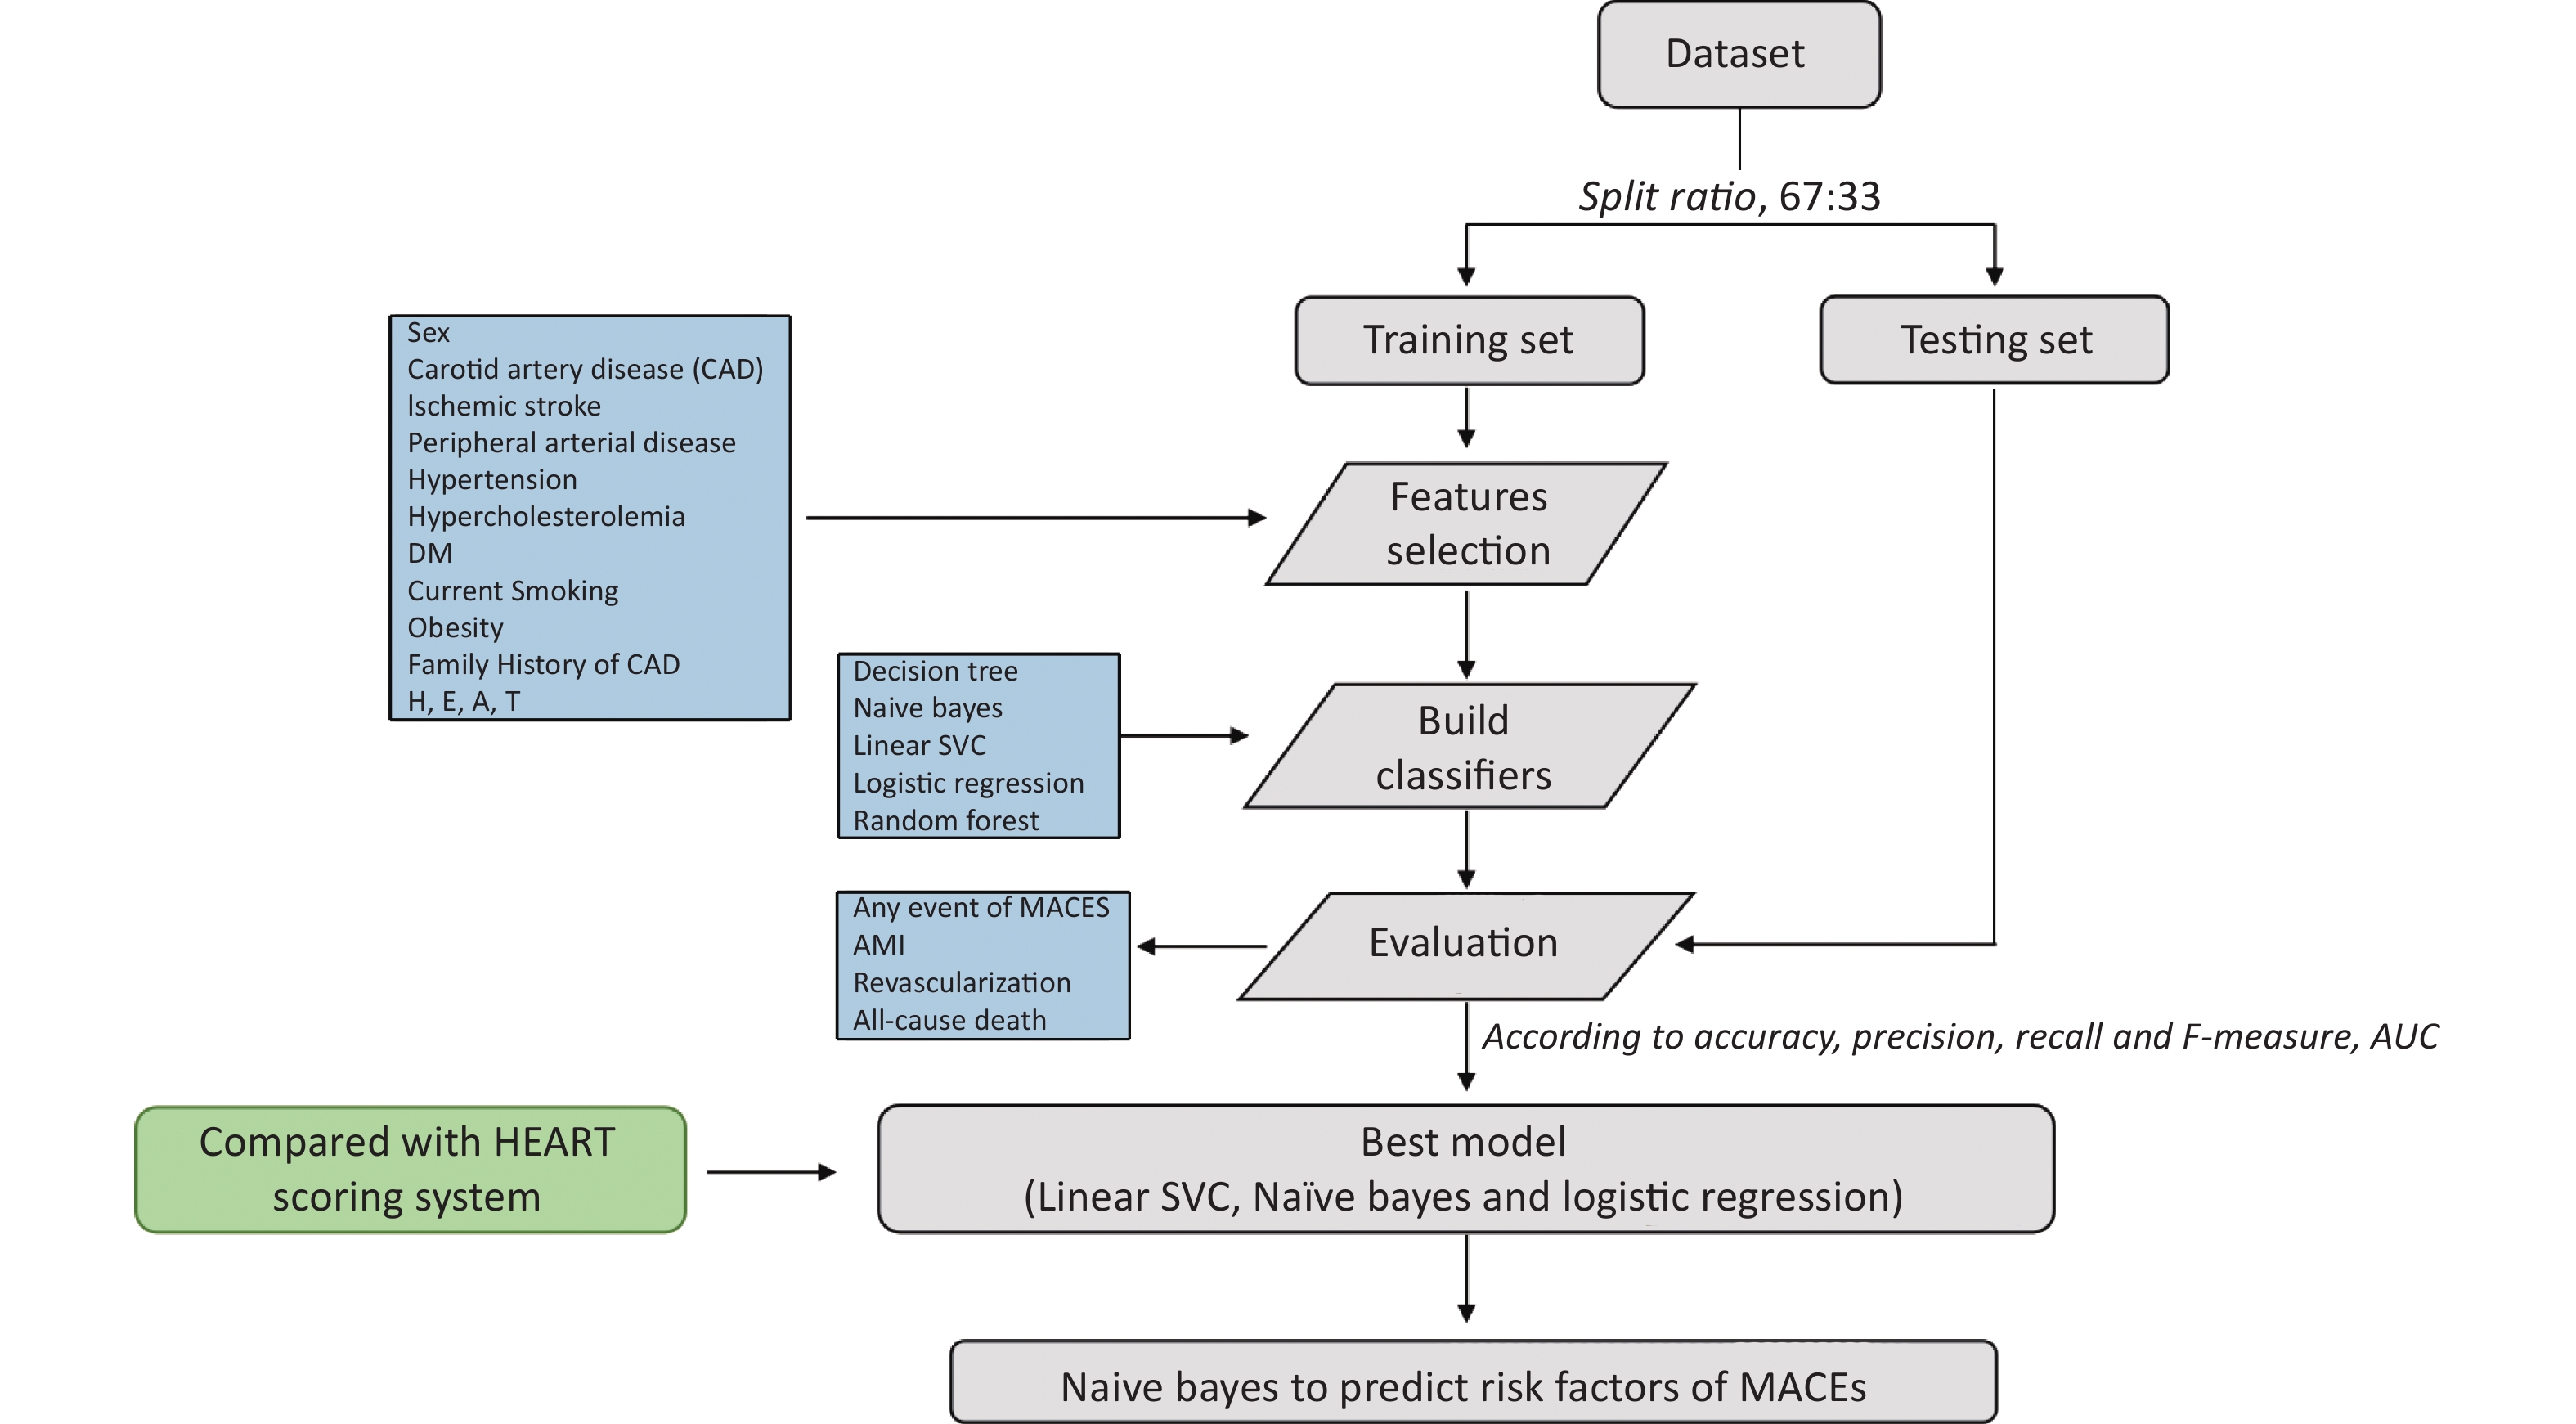
Complete Approach As shown in Supplementary Figures S1–S2 (available in www.besjournal.com), the study cohort was randomly split into 2 datasets, 67% of data was used to train ML models and 33% of data was used to test the developed ML models. A total of 14 features were selected. Five ML models developed by Decision tree, Naïve Bayes, Linear SVC, Logistic Regression and Random Forest predicted the occurrence of MACEs of chest patients with suspected NSTE-ACS. The prediction for MACEs included any event of MACEs, AMI, revascularization and all-cause death in our study. The learning metrics, including Accuracy, Precision, Recall, F-Measure and AUC were used to assess performance of each model. The prediction effect of the ML models and HEART risk scoring system was compared. Ultimately, Naïve Bayes was selected to predict risk factors of occurrence of MACEs (any event, AMI, Revascularization, and all-cause death).
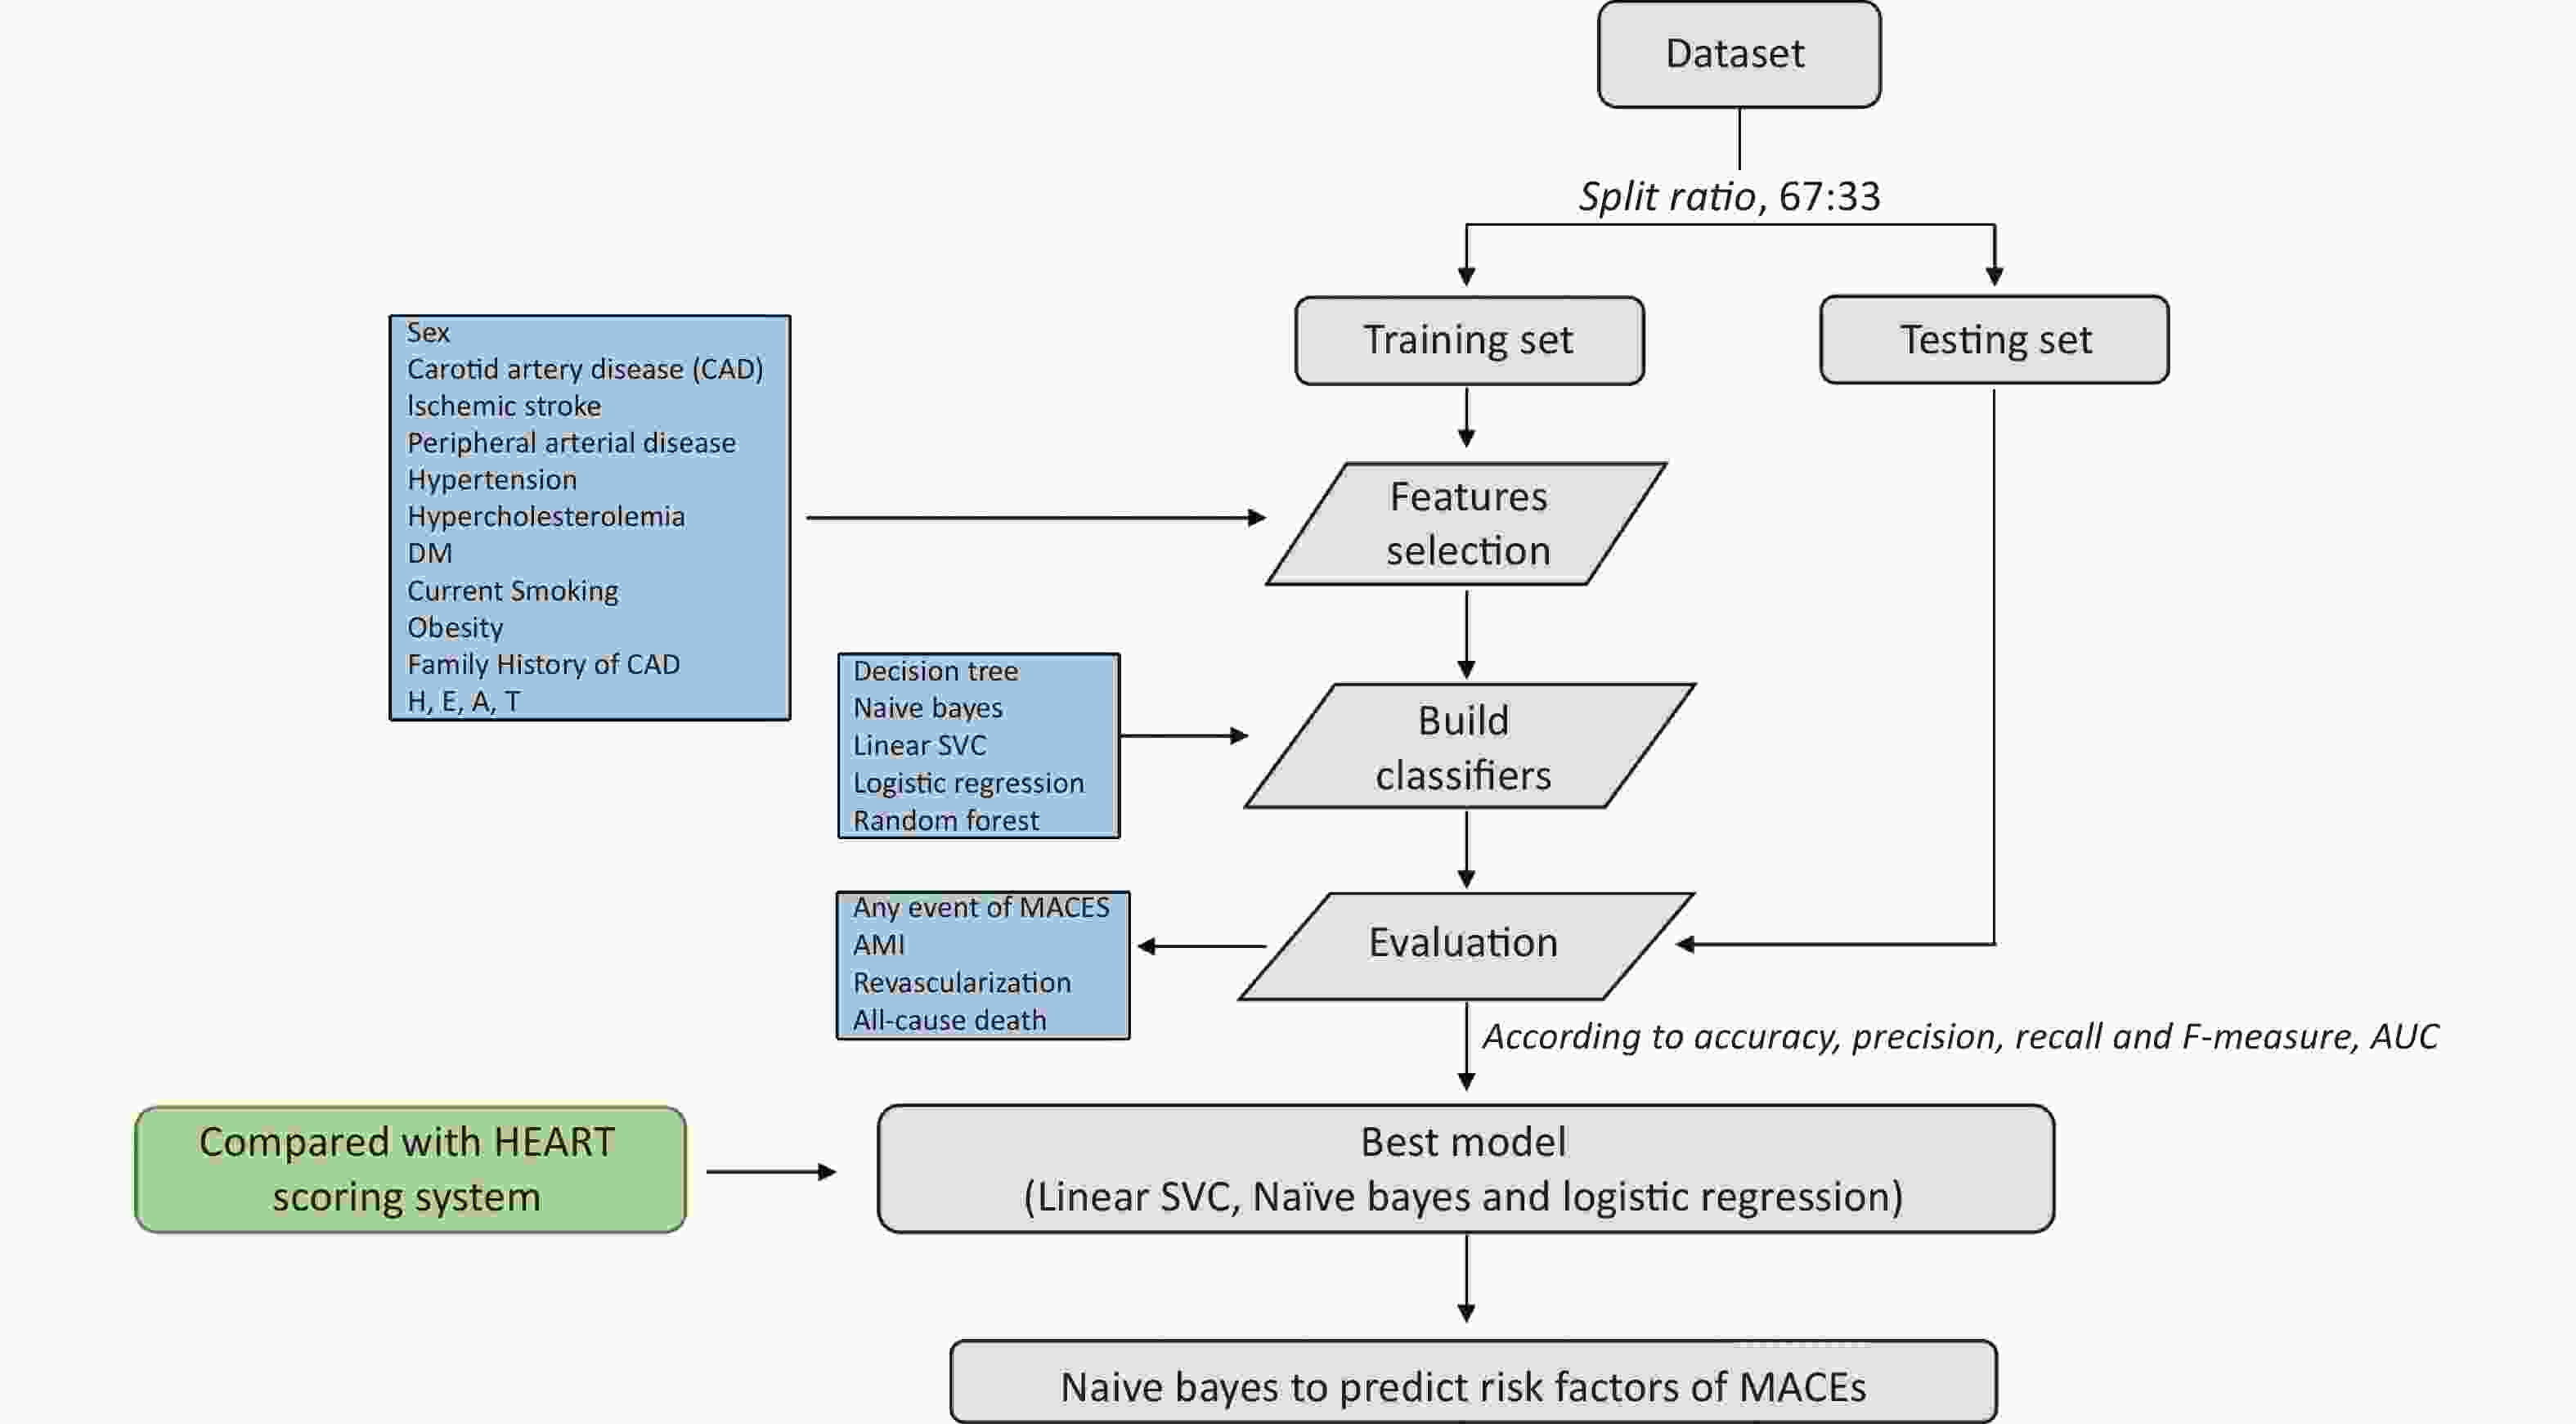
Figure S1. The flowchart of completed approach.
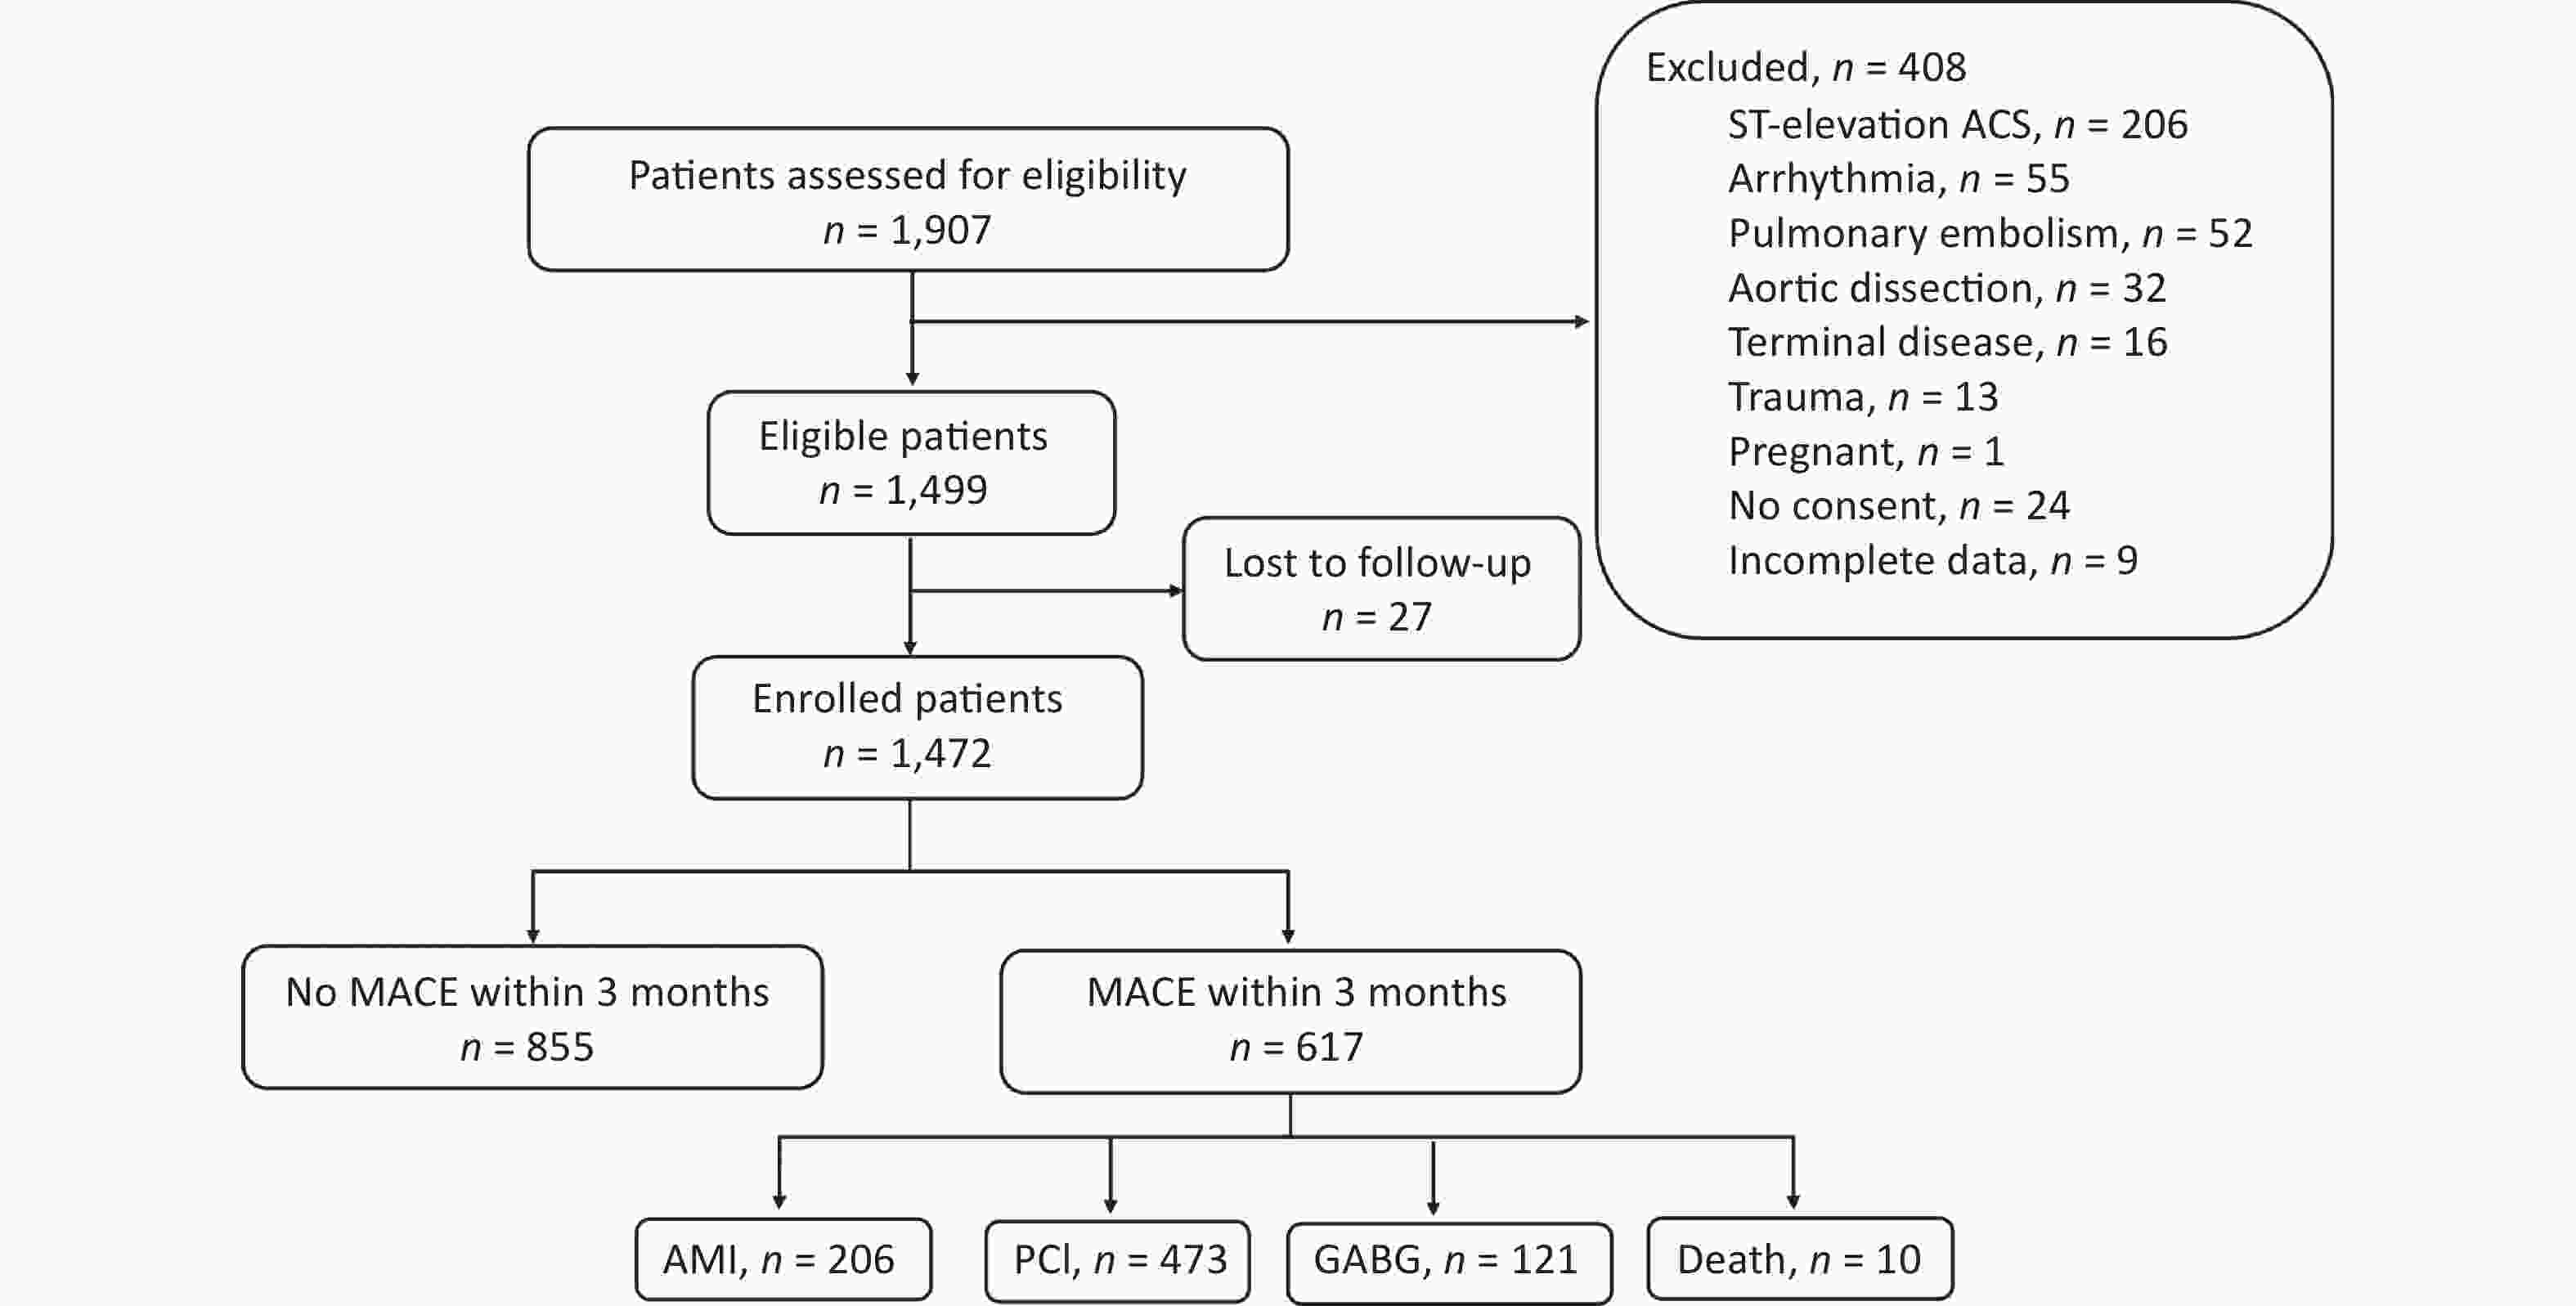
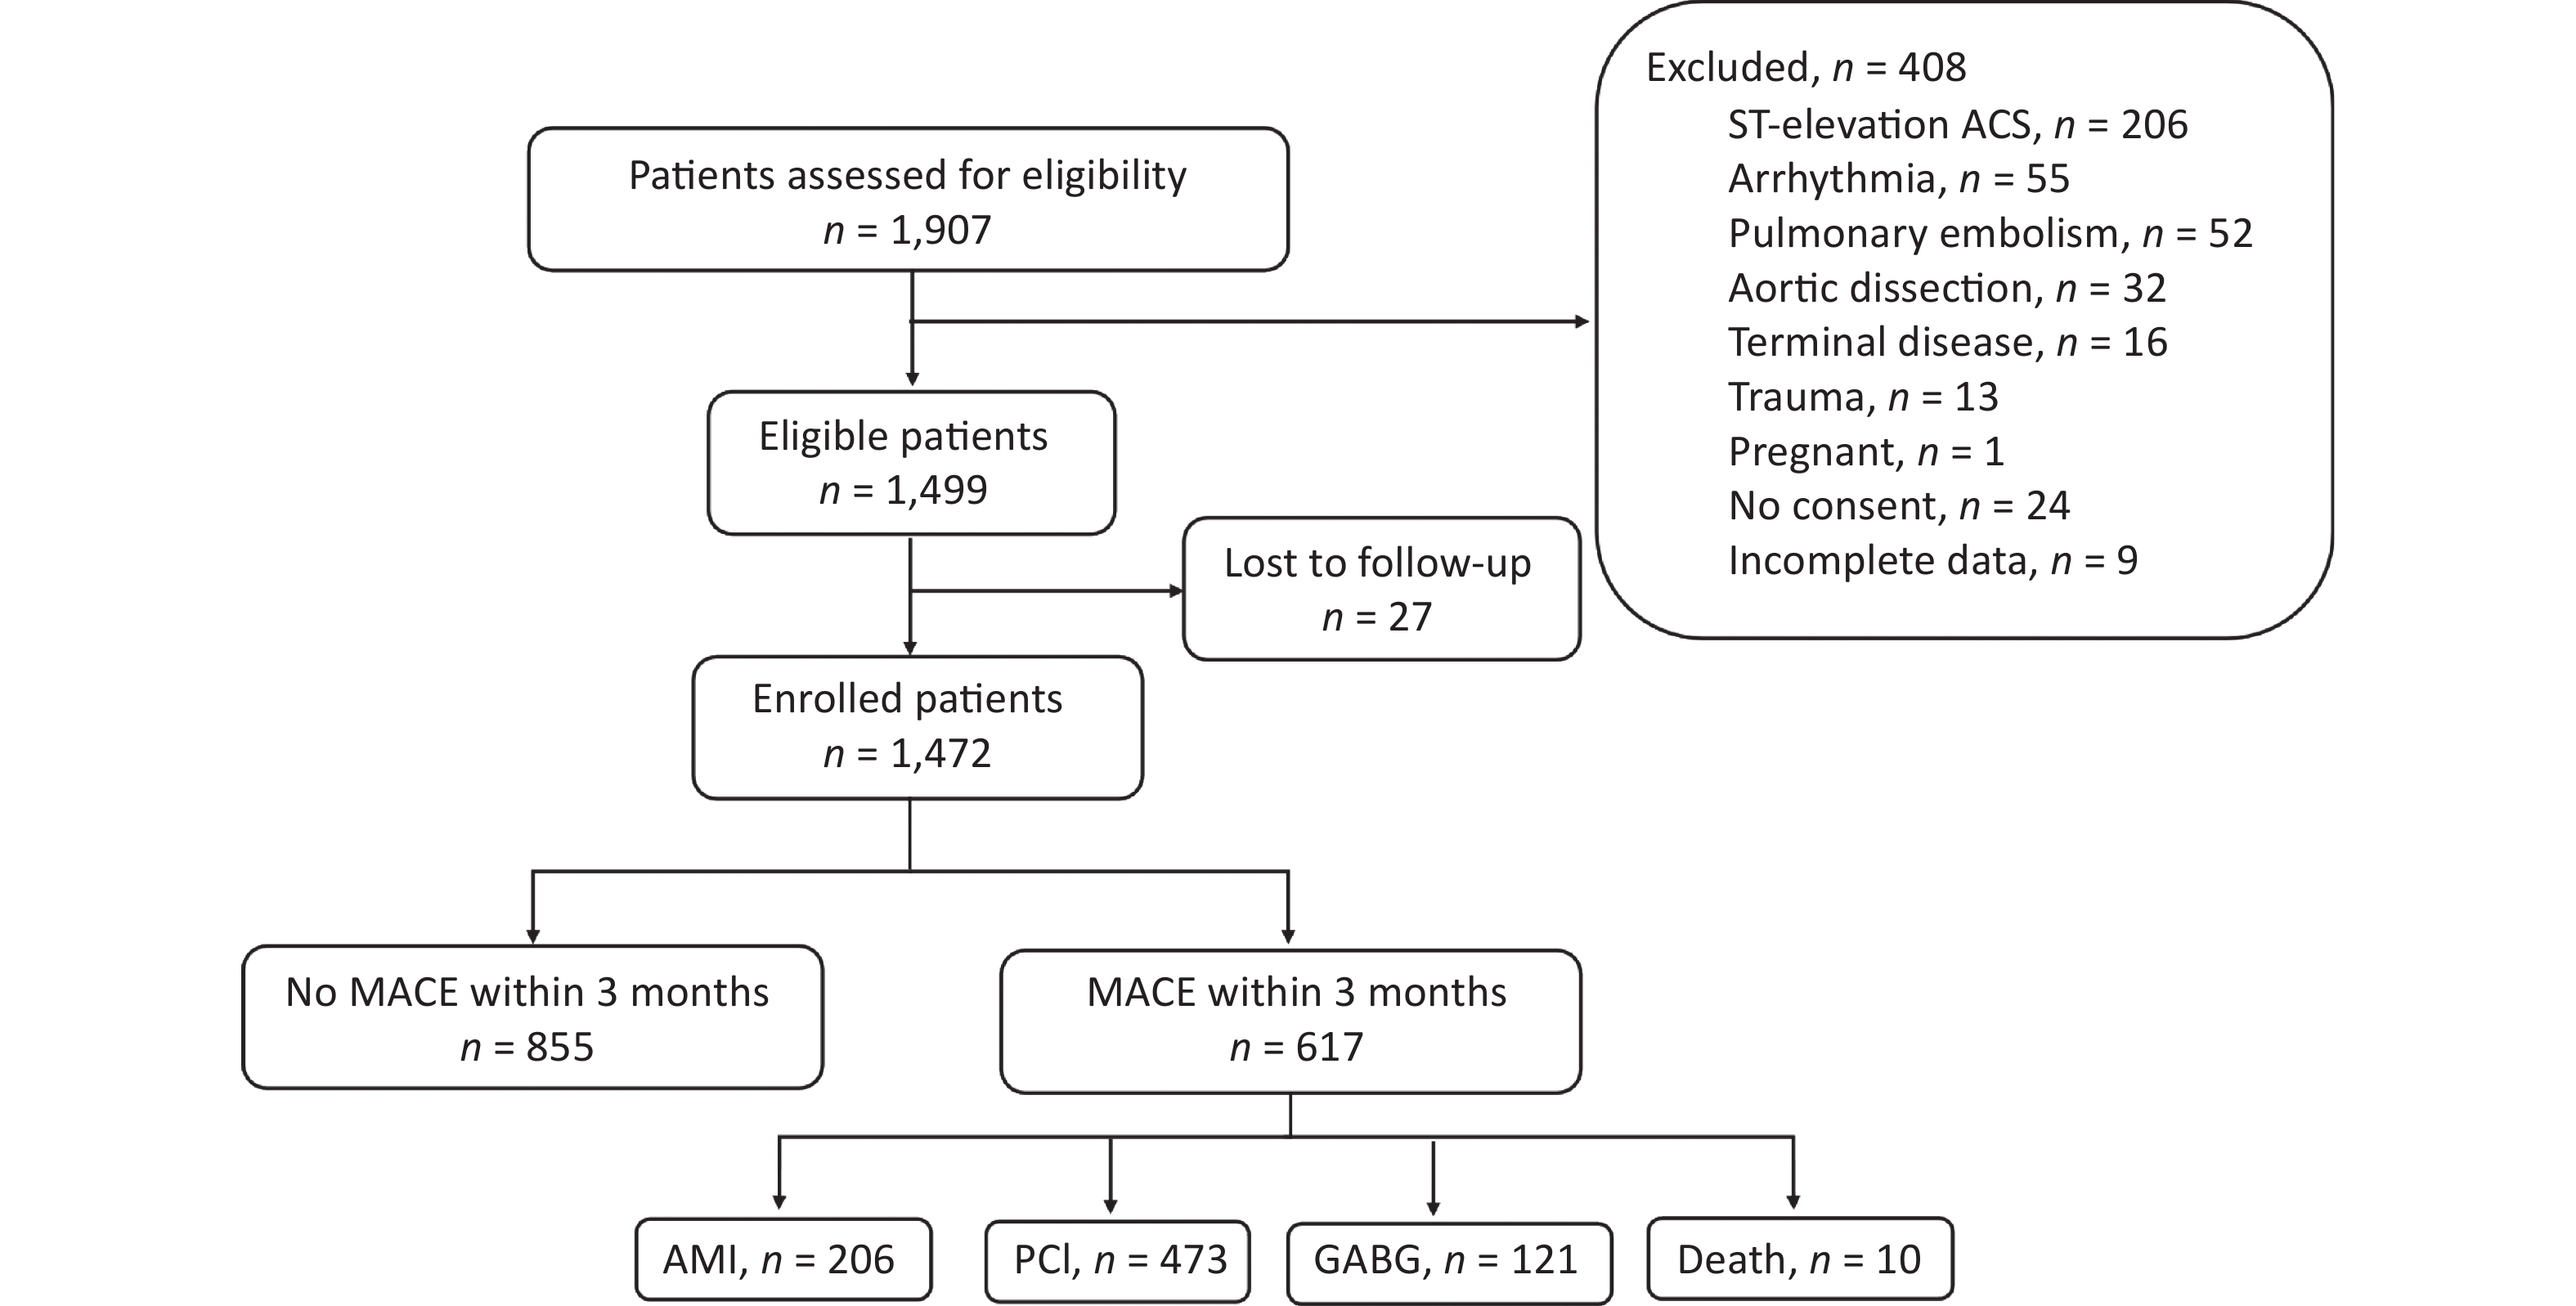
Figure S2. Flow chart of study participants.
Classification Methods The classification was conducted by using the standard classifiers in ML including Decision Tree, Naïve Bayes, Linear SVC, Logistic regression and Radom Forest. The development of ML models consisted of two stages: training and testing. Prior to the training, the preprocessed dataset was split into training set (67% of the data) and testing set (33% of the data). In the training stage, the labels and features were used to define feature vectors. After that, classifiers were trained on the feature vectors extracted from the training set. In the testing stage, the previously trained classifiers predicted the label of each feature in the testing set. Each classifier was implemented to analyze the testing dataset, and the corresponding scores of the 14 features was obtained.
ML Models Validation The performances of ML models constructed by those five classifiers were evaluated by calculating standard metrics, which were Accuracy, Precision, Recall and F-measure. Accuracy is the ratio of the number of correct predictions to total number of predictions. Precision is the ratio of correctly predicted positive observations to the total predicted positive observations. Recall is the ratio of correctly predicted positive observations to the all observations in actual class. F-measure is the weighted average of Precision and Recall. The standard metrics were calculated by following equations:
$$ \text{Accuracy}=\frac{\left({{\rm{TP}}+{\rm{TN}}}\right)}{{{\rm{TP}}+{\rm{TN}}+{\rm{FP}}+{\rm{FN}}}} $$ (1) $$ \text{Precision}=\frac{\text{TP}}{{{\rm{TP}}+{\rm{FP}}}} $$ (2) $$ \text{Recall}=\frac{\text{TP}}{{{\rm{TP}}+{\rm{FN}}}} $$ (3) $$ \text{F-measure}=2\times \frac{{\text{Recall}} \times {\rm{Precision}}}{{\text{Recall}}+{\rm{Precision}}} $$ (4) where TP is true positive, TN is true negative, FP is false positive and FN is false negative.
Both precision and recall were based on a consideration and measure of weighting function. F-measure was the harmonic mean of precision and recall, and balances in between, in the range of 0 to 1. The ML techniques were implemented in the open-source Python 3.6 environment in Anaconda 3.0 platform with Jupyter Notebook.
Statistical Analysis The continuous variables were described as mean ± SD or as Medians (Interquartile Range). The categorical variables were reported as counts and percentages. Parametric continuous variables were compared between groups using Student’s t test and Man-Whitney U-test for non-parametric variables. Categorical data were compared using the χ2 test for 2 × 2 tables. All statistical tests were two-tailed with P < 0.05 considered as statistically significant. The performances of the models were evaluated by Accuracy, Precision, Recall and F-measure. The comparisons between HEART prediction model and the ML prediction model above were performed in the aspects of those standard metrics.
-
Creening process for the study population was shown in Supplementary Figure S2. A total of 1,499 patients were enrolled in this study via screening 1,907 patients with chest pain presenting to the emergency clinic according to exclusion and inclusion criteria. In addition, 27 patients were lost to follow-up. Ultimately, 1,472 patients were enrolled. Most of the participants were male and has underlying diseases. There were 617 patients (41.9%) experiencing at least one MACE (including AMI, PCI, GABG and death) during the 3 months follow-up. PCI was the most common MACE which occurred in 473 patients (32.1%). AMI was ranked second in MACEs, with 206 patients (14.0%). CABG was needed for 121 patients (8.2%). There were only 10 deaths (0.7%). In addition, some chest pain patients experienced more than one MACEs. Specifically, 150 patients concurrently experienced PCI and AMI, 33 patients concurrently experienced AMI and CABG, 2 patients experienced PCI and CABG. Of the 10-death case, AMI, CABG and PCI concurrently occurred in 6, 4 and 3 patients, respectively. Few patients concurrently experienced 3 or 4 MACEs. In general, 617 patients underwent 810 events, an average of 1.31 events per patient.
Detailed baseline characteristics of the study population were shown in Table 2. Most of subjects were elderly, with an average age of 59.1 years. Males and females accounted for 64.8% and 35.2% of the population, respectively. Most of enrolled patients were accompanied by hypertension, with a proportion of 63.9%, while some were accompanied by hypercholesterolemia, diabetes, family history of premature CAD, MI, CABG, ischemic stroke, peripheral artery disease, carotid artery disease, elevated hs-cTn I, but all less than 35.0%. In addition, 13.3% and 29.6% of enrolled patients were suffering from obesity and current smoking, respectively.
Table 2. Baseline characteristics of the study cohort
Characteristics Values P Age, years 59.1 ± 10.20 / Sex Male 953 (64.8) < 0.001 Female 519 (35.2) Hypertension No 531 (36.1) < 0.001 Yes 941 (63.9) Hypercholesterolemia No 1,103 (74.9) < 0.001 Yes 369 (25.1) DM No 1,051 (71.4) < 0.001 Yes 421 (28.6) Family history of premature CAD No 1,269 (86.2) < 0.001 Yes 203 (13.8) Smoke No 1,036 (70.4) < 0.001 Yes 436 (29.6) Obesity No 1,276 (86.7) < 0.001 Yes 196 (13.3) AMI No 1,265 (85.9) < 0.001 Yes 207 (14.1) PCI No 998 (67.8) < 0.001 Yes 474 (32.2) CABG No 1,351 (91.8) < 0.001 Yes 121 (8.2) Ischemic stroke No 1,324 (89.9) < 0.001 Yes 148 (10.1) PAD No 1,392 (94.6) < 0.001 Yes 80 (5.4) CAD No 1,025 (69.6) < 0.001 Yes 447 (30.4) History of chest pain with suspected ACS Slightly 152 (10.3) < 0.001 Moderately 841 (57.1) Highly 479 (32.6) ECG Normal 518 (35.2) < 0.001 Non-specific repolarization disturbance 667 (45.3) Significant ST deviation 287 (19.5) Age group (years) ≤ 45 132 (8.9) < 0.001 45– 891 (60.5) ≥ 65 449 (30.6) Troponin ≤ normal limit 1,174 (79.8) < 0.001 1–3× normal limit 103 (7.0) > 3× normal limit 195 (13.2) Note. Data are mean ± SD or n (%). CABG: coronary artery bypass graft; CAD: coronary artery disease; ECG: electrocardiogram; PAD: peripherial arterial disease; DM: diabetes mellitus; hs-cTn I: high-sensitivity cardiac troponin I; AMI: acute myocardial infarction; PCI: percutaneous coronary intervention. -
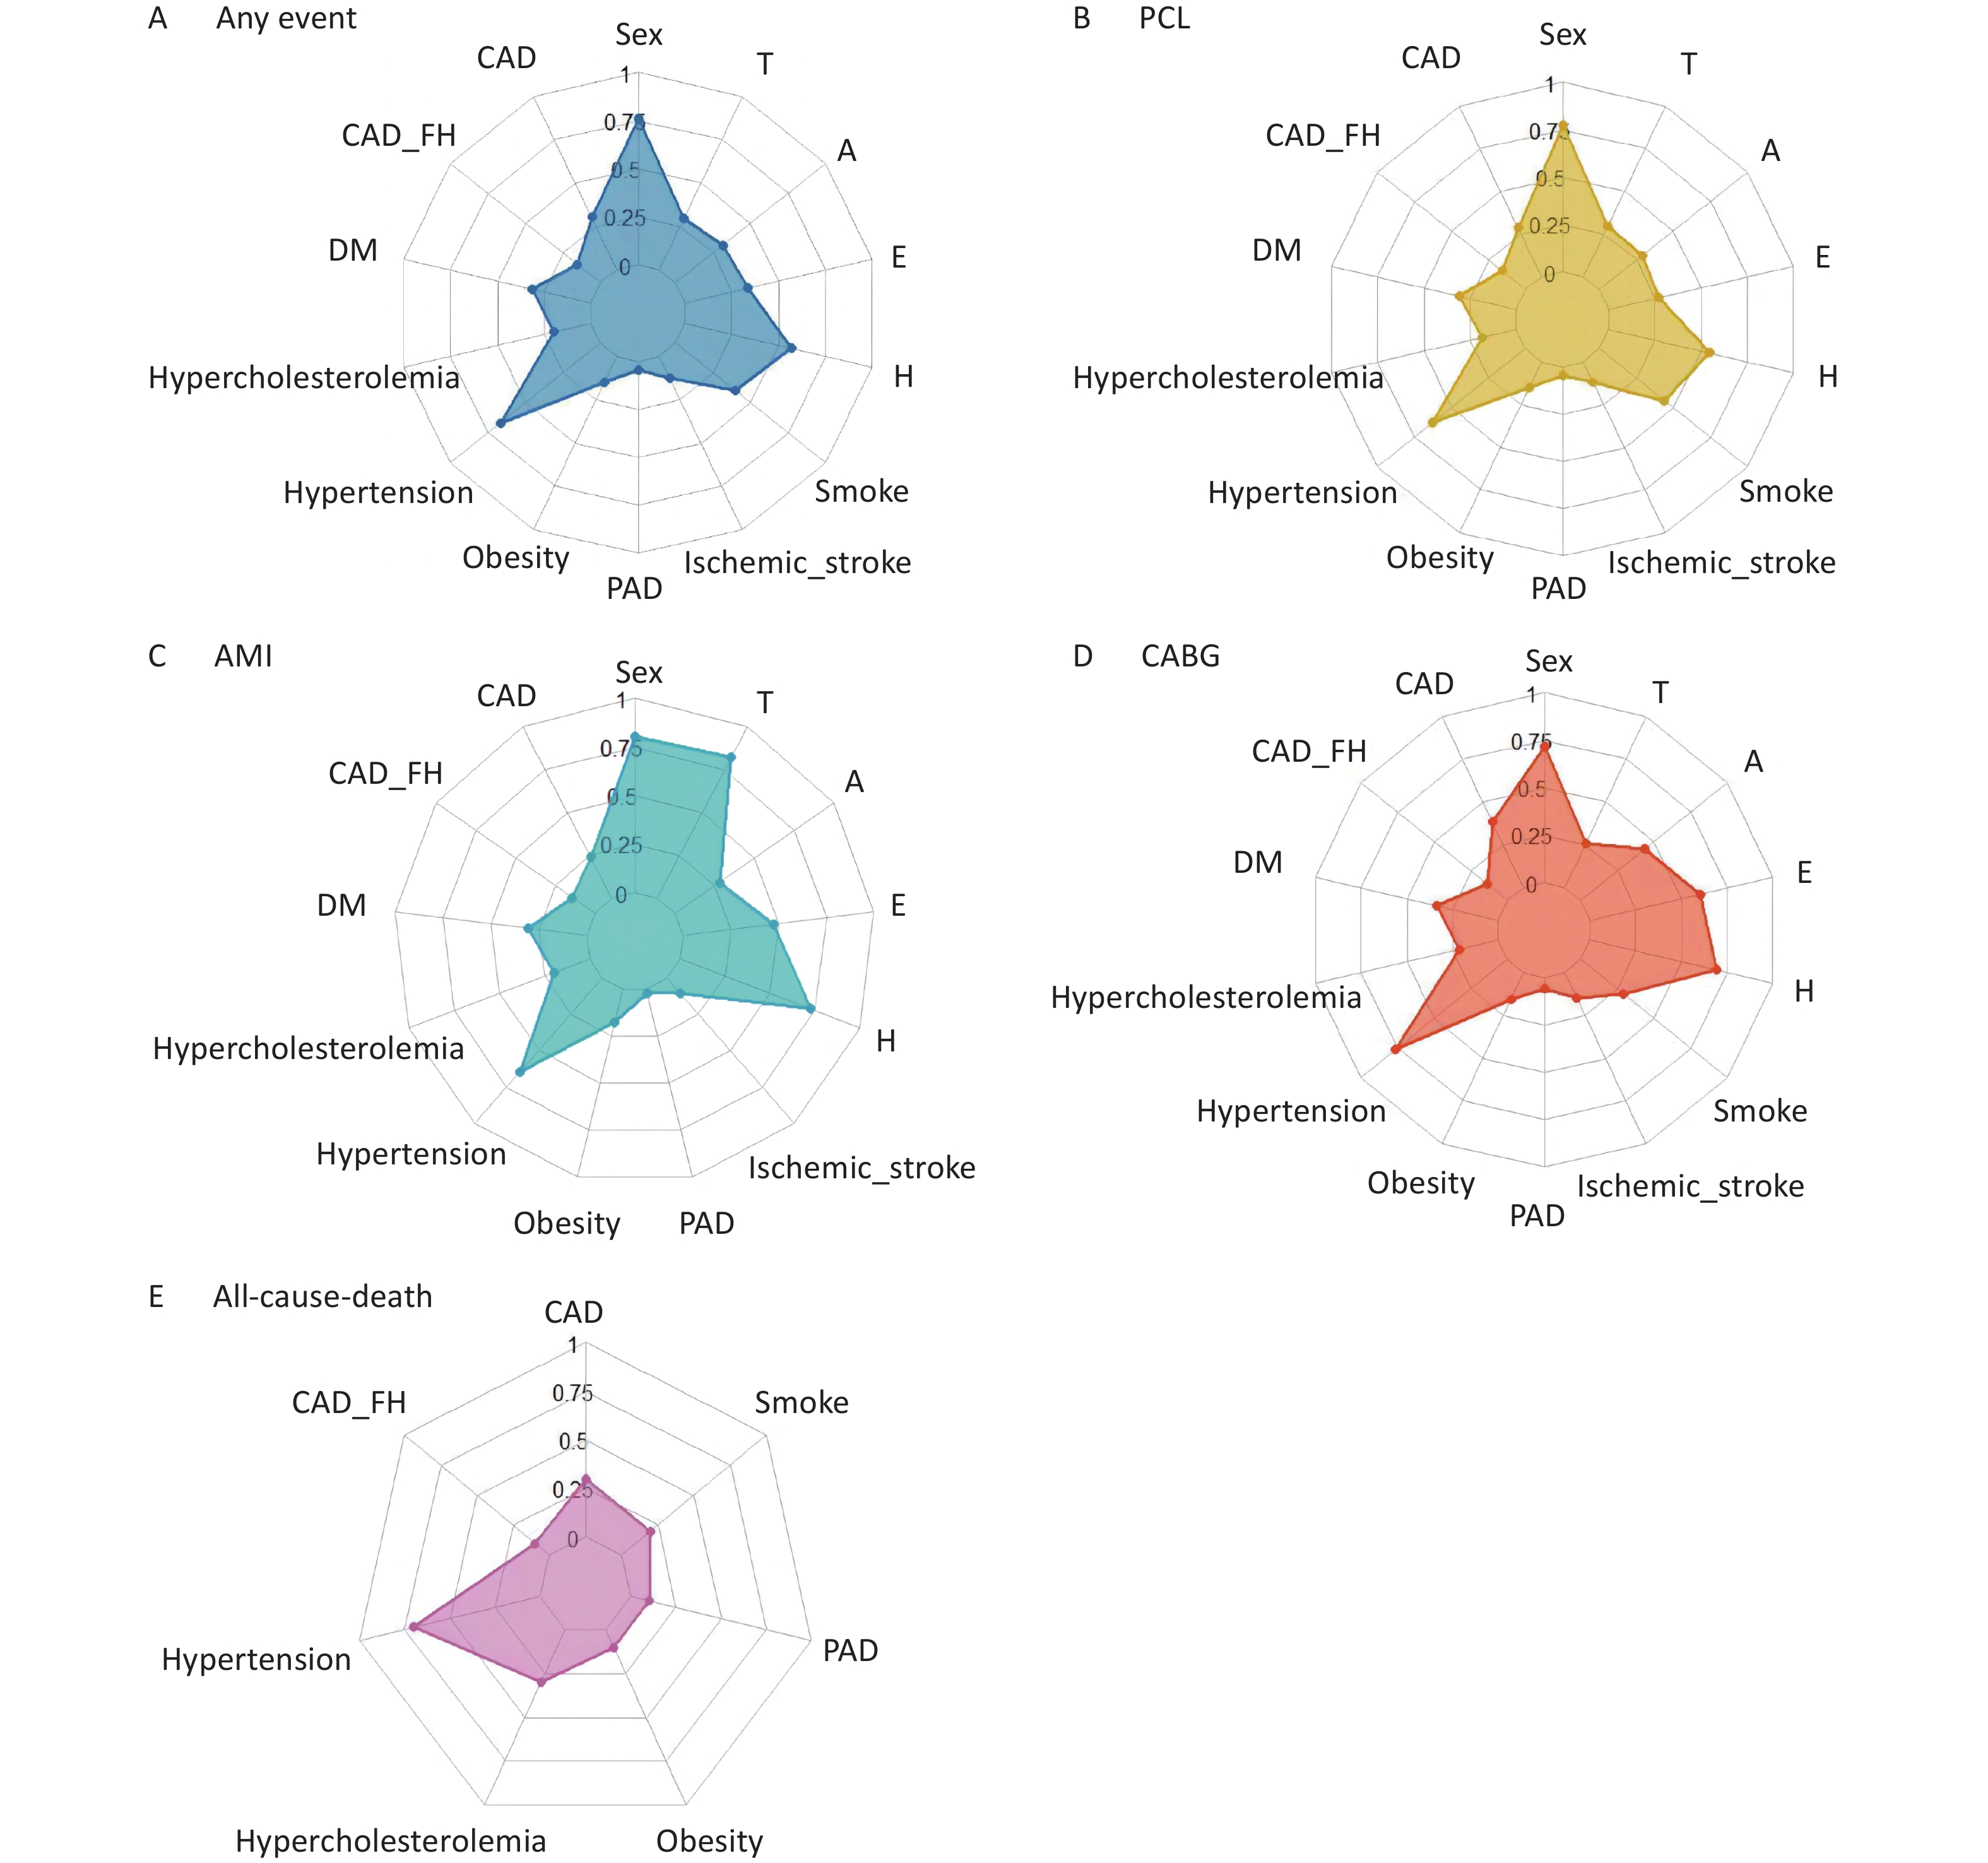
As shown in Figure 1, the radar plot illustrated the features of patients with any one of MACEs, PCI, AMI, CABG or all-cause death, and identified important predictors of MACEs. Most patients with MACE(s) had history of chest pain with suspected ACS, and underlying diseases, especially hypertension and DM. Compared with the incidence of other MACEs, AMI could be more associated with history of chest pain with suspected ACS and higher troponin levels. Patients undergoing PCI had similar characteristics of AMI, but had lower troponin levels. Patients who experienced CABG were much older (data not shown here). Additionally, CABG were more correlated with hypertension and abnormal electrocardiogram results than other MACEs. Hypertension and hypercholesterolemia could more contribute to all-cause death. Compared with other features, hypertension, history of chest pain with suspected ACS, and smoking were more associated with any one of MACEs.
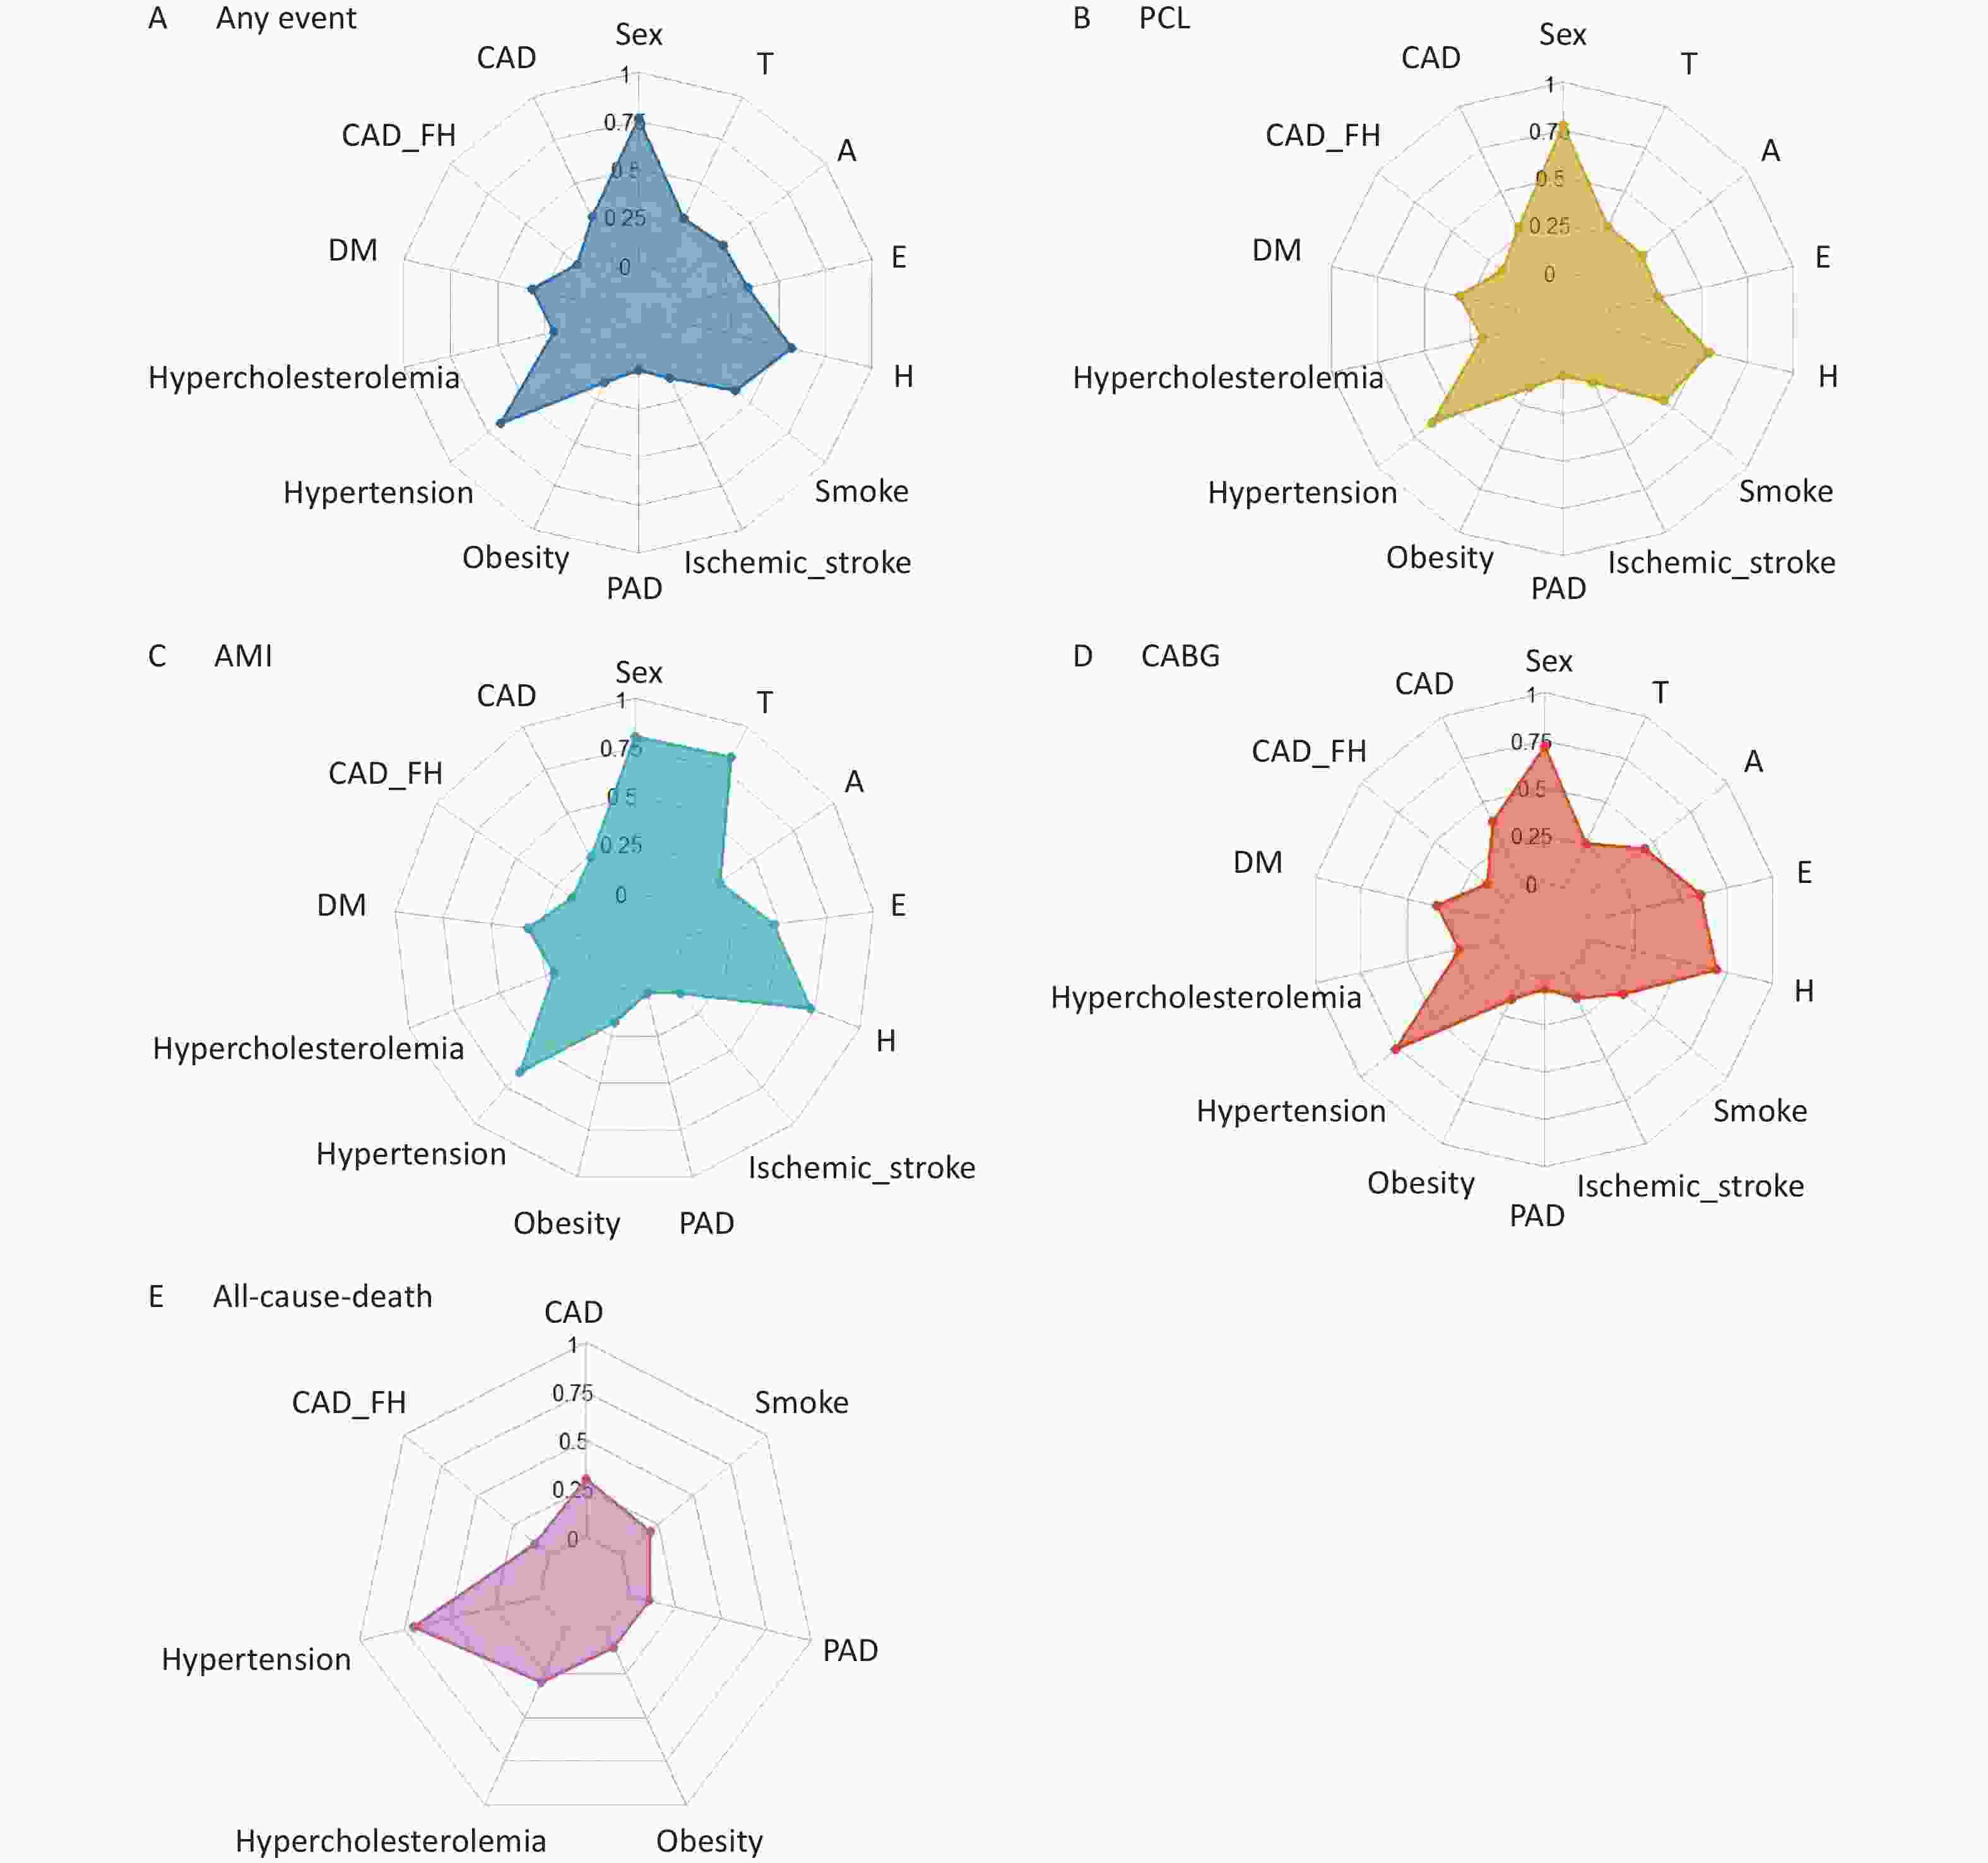
Figure 1. (A) Radar plot for the 14 most important predictors of any MACE event; (B) Radar plot for the 14 most important predictors of PCI; (C) Radar plot for the 13 most important predictors of AMI; (D) Radar plot for the 14 most important predictors of CABG; (E) Radar plot for the 7 most important predictors of all-cause-death.
-
As shown in Table 3, from the perspective of these learning metrics, Linear SVC, Naïve Bayes and Logistic performed better than HEART scoring system in prediction for each of MACEs. Precision is the most important indicator to assess performance of ML models. The Precision scores in each MACE with classifiers of Linear SVC, Naïve Bayes and Logistic were higher than those with HEART scoring system. Especially, the Precision scores were equal or greater than 0.95 in AMI and all-cause death, while those scores were around 0.77 with HEART scoring system.
Table 3. ML prediction for any event, AMI, revascularization and all-cause death
Classifier Any event AMI Revascularization All-cause death A P R F A P R F A P R F A P R F Linear SVC 0.80 0.80 0.80 0.80 0.95 0.95 0.95 0.95 0.80 0.80 0.80 0.80 1.00 0.99 1.00 0.99 Decision Tree 0.75 0.75 0.75 0.75 0.96 0.96 0.96 0.96 0.74 0.74 0.74 0.73 0.99 0.99 0.99 0.99 Naive Bayes 0.80 0.81 0.80 0.80 0.96 0.97 0.96 0.96 0.80 0.80 0.80 0.80 0.99 0.99 0.99 0.99 Logistic 0.80 0.80 0.80 0.80 0.95 0.95 0.95 0.95 0.80 0.80 0.80 0.80 1.00 0.99 1.00 0.99 Random Forest 0.74 0.74 0.74 0.74 0.95 0.96 0.95 0.96 0.71 0.71 0.71 0.71 1.00 0.99 1.00 0.99 HEART 0.77 0.78 0.77 0.77 0.77 0.78 0.77 0.77 0.77 0.78 0.77 0.77 0.77 0.78 0.77 0.77 Note. A, Accuracy; P, Precision; R: Recall; F, F-measure; AMI, acute myocardial infarction cute myocardial infarction. Linear SVC, Naïve Bayes and Logistic prediction models outperformed the other two models. The performance of Decision Tree and Random Forest Classifiers were worse than HEART scoring system when predict any event of MACEs and revascularization owing to all learning metrics by decision tree and random forest classifiers ≤ 0.75. However, decision tree and random forest classifiers performed greater in terms of predicting AMI (all learning metrics ≥ 0.95) and All-cause death (all learning metrics ≥ 0.99). On the whole, machine learning models constructed by any classifier improved the performance compared with HEART scoring system for AMI and all cause death prediction, based on that the Accuracy, Precision, Recall and F-Measure of all classifiers were ≥ 0.95.
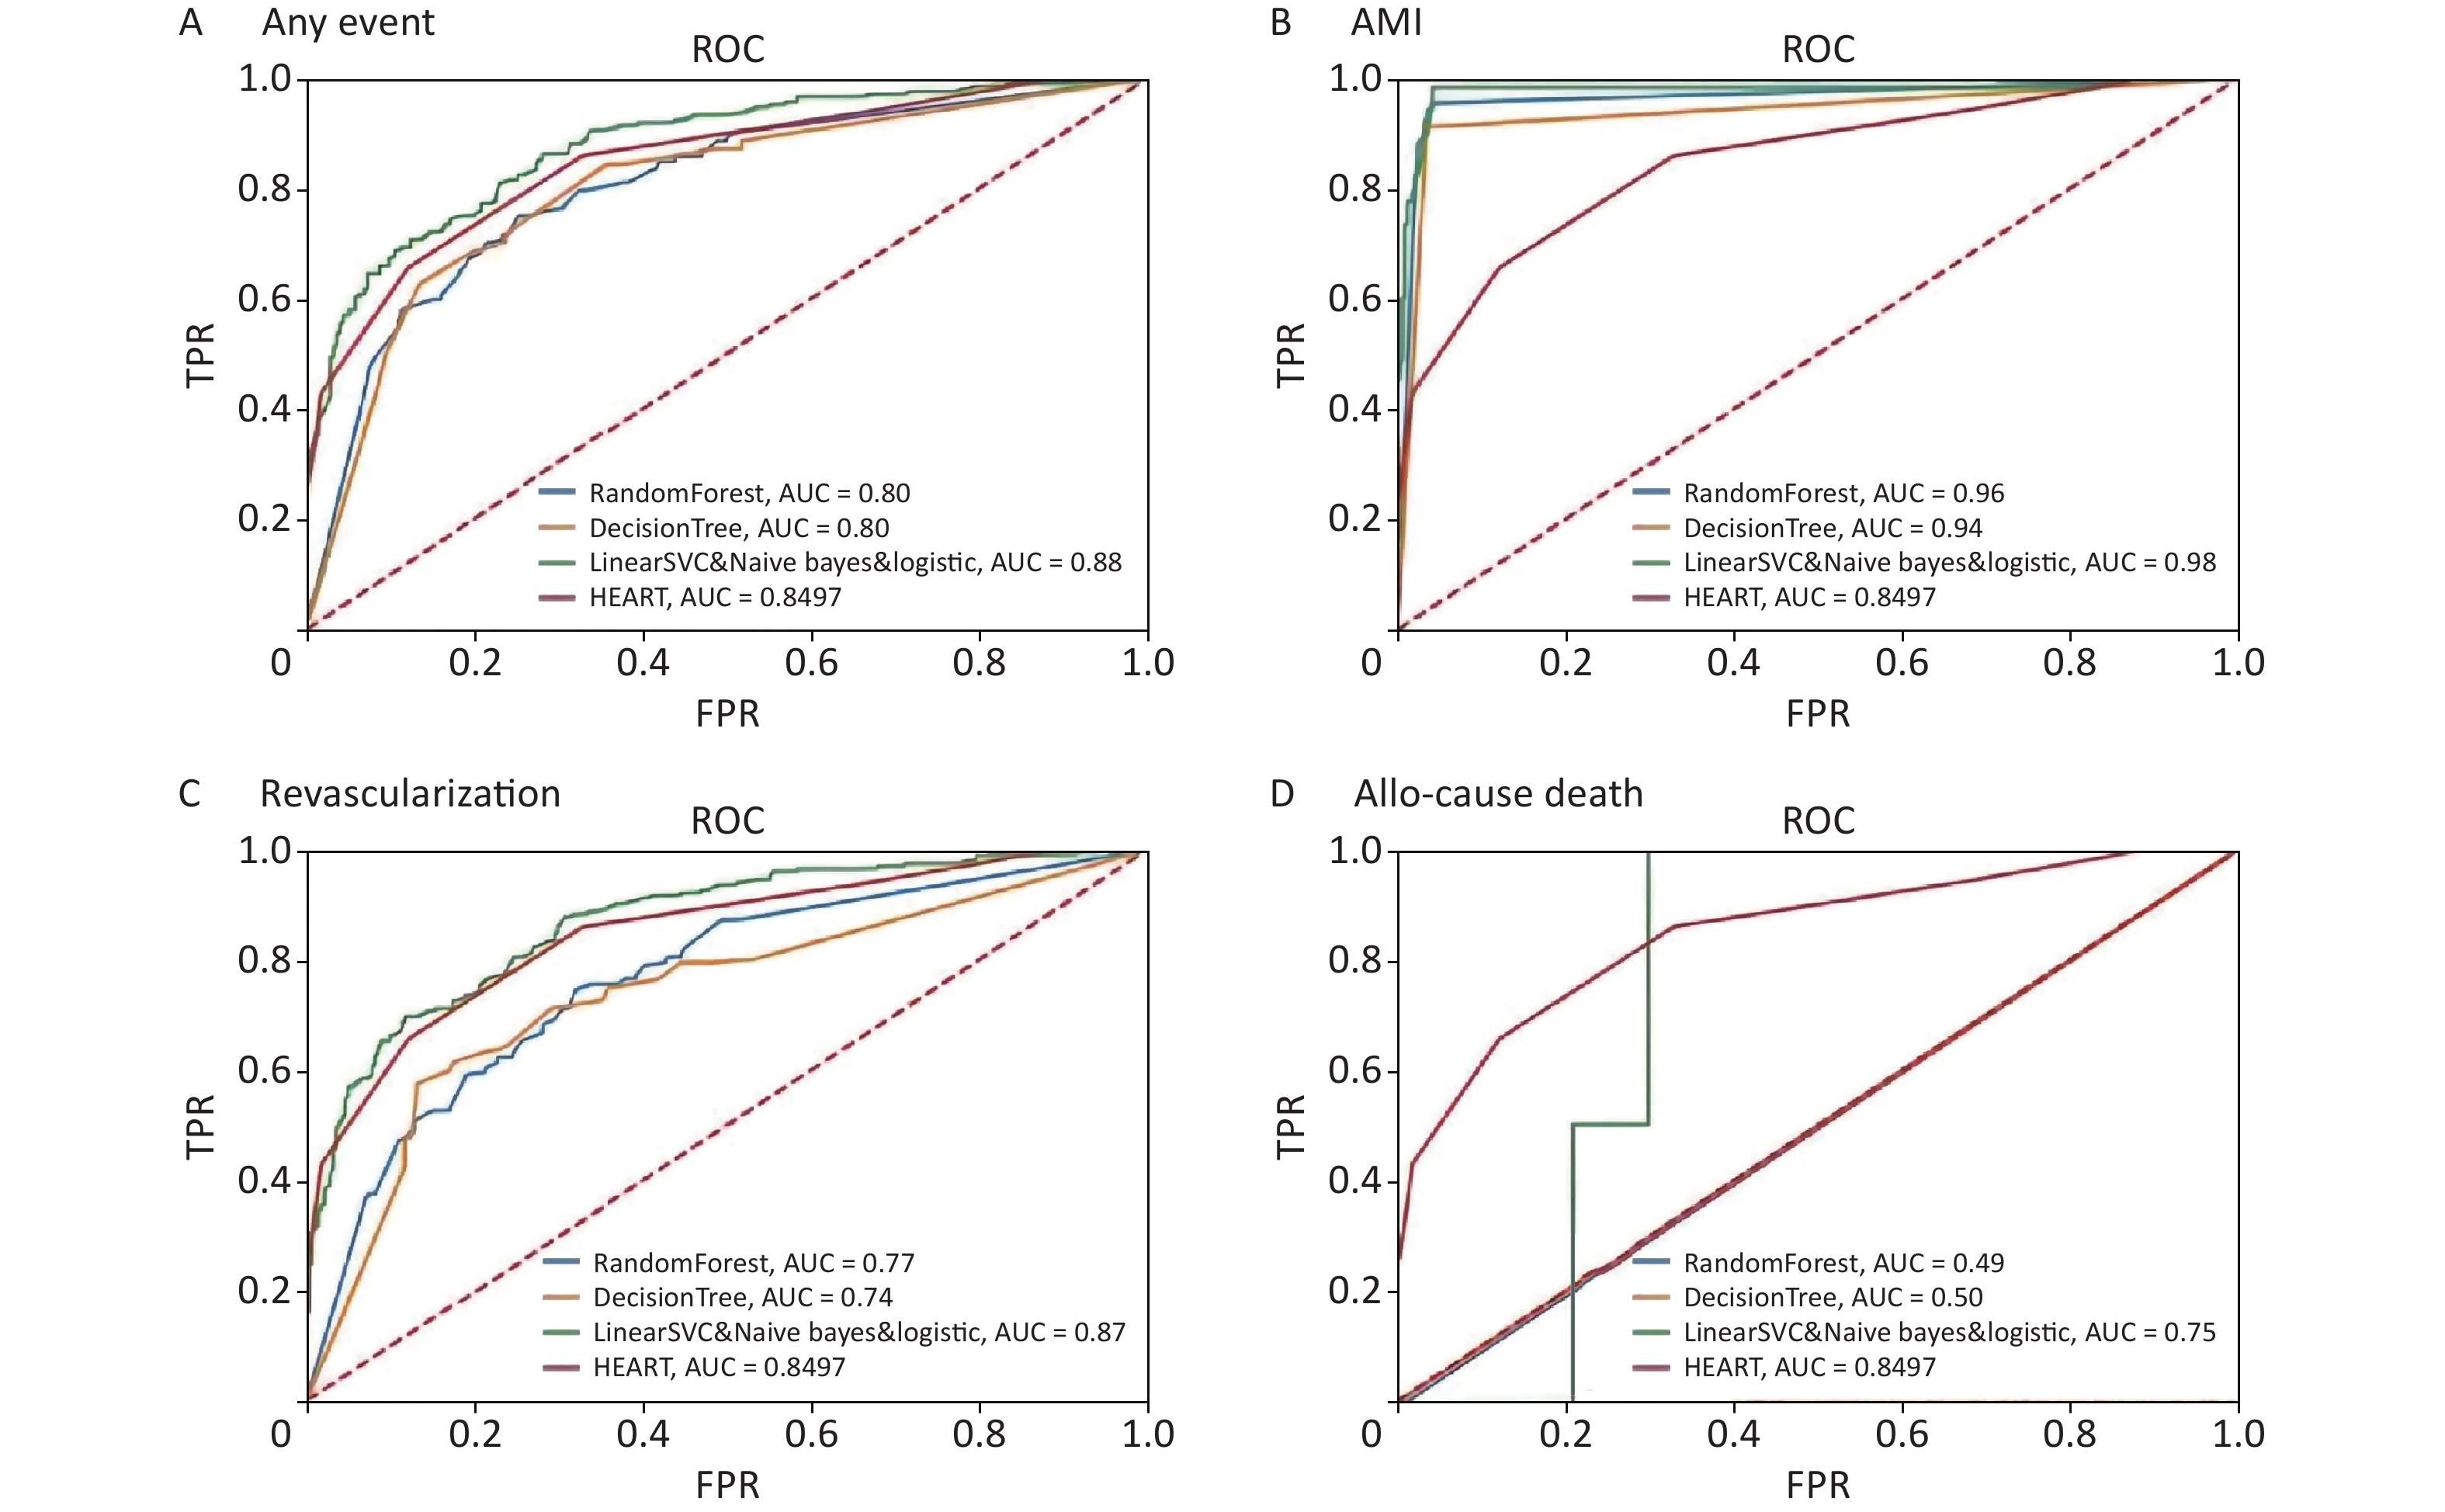
However, the ROC curves and AUC in Figure 2 presented not exactly the same trend as the other 4 metrics in Table 3. For AMI prediction, the AUC by Random Forest was 0.96, the AUC by Decision Tree was 0.94, the AUCs by Linear SVC classifier, Naïve Bayes and Logistic were 0.98, while the AUC by HEART scoring system only was 0.85. Therefore, according to ROC curves and AUC, the ML models constructed by different classifiers performed better than HEART scoring system when predicting AMI. Linear SVC classifier, Naïve Bayes and Logistic performed better than HEART scoring system when predicted any event of MACEs, AMI and revascularization. However, the AUC of the ML model constructed by Linear SVC classifier, Naïve Bayes and Logistic was 0.75, lower than HEART (0.85) in prediction for all-cause death. The too low AUC of ML employing different classifiers could be associated with too small of sample size, only 10 death cases. In addition, the AUCs by Random Forest and Decision Tree were ≤ 0.80 to predict any event of MACEs and revascularization, while the AUC by HEART scoring system. Therefore, the performacne of ML models constructed by Random Forest and Decision Tree was worsen than HEART scoring system. Evaluating learning metrics and ROC curves comprehensively, Linear SVC classifier, Naïve Bayes and Logistic performed better than the other 2 classifiers, which was agreenment with the results by learning metric evaluation.
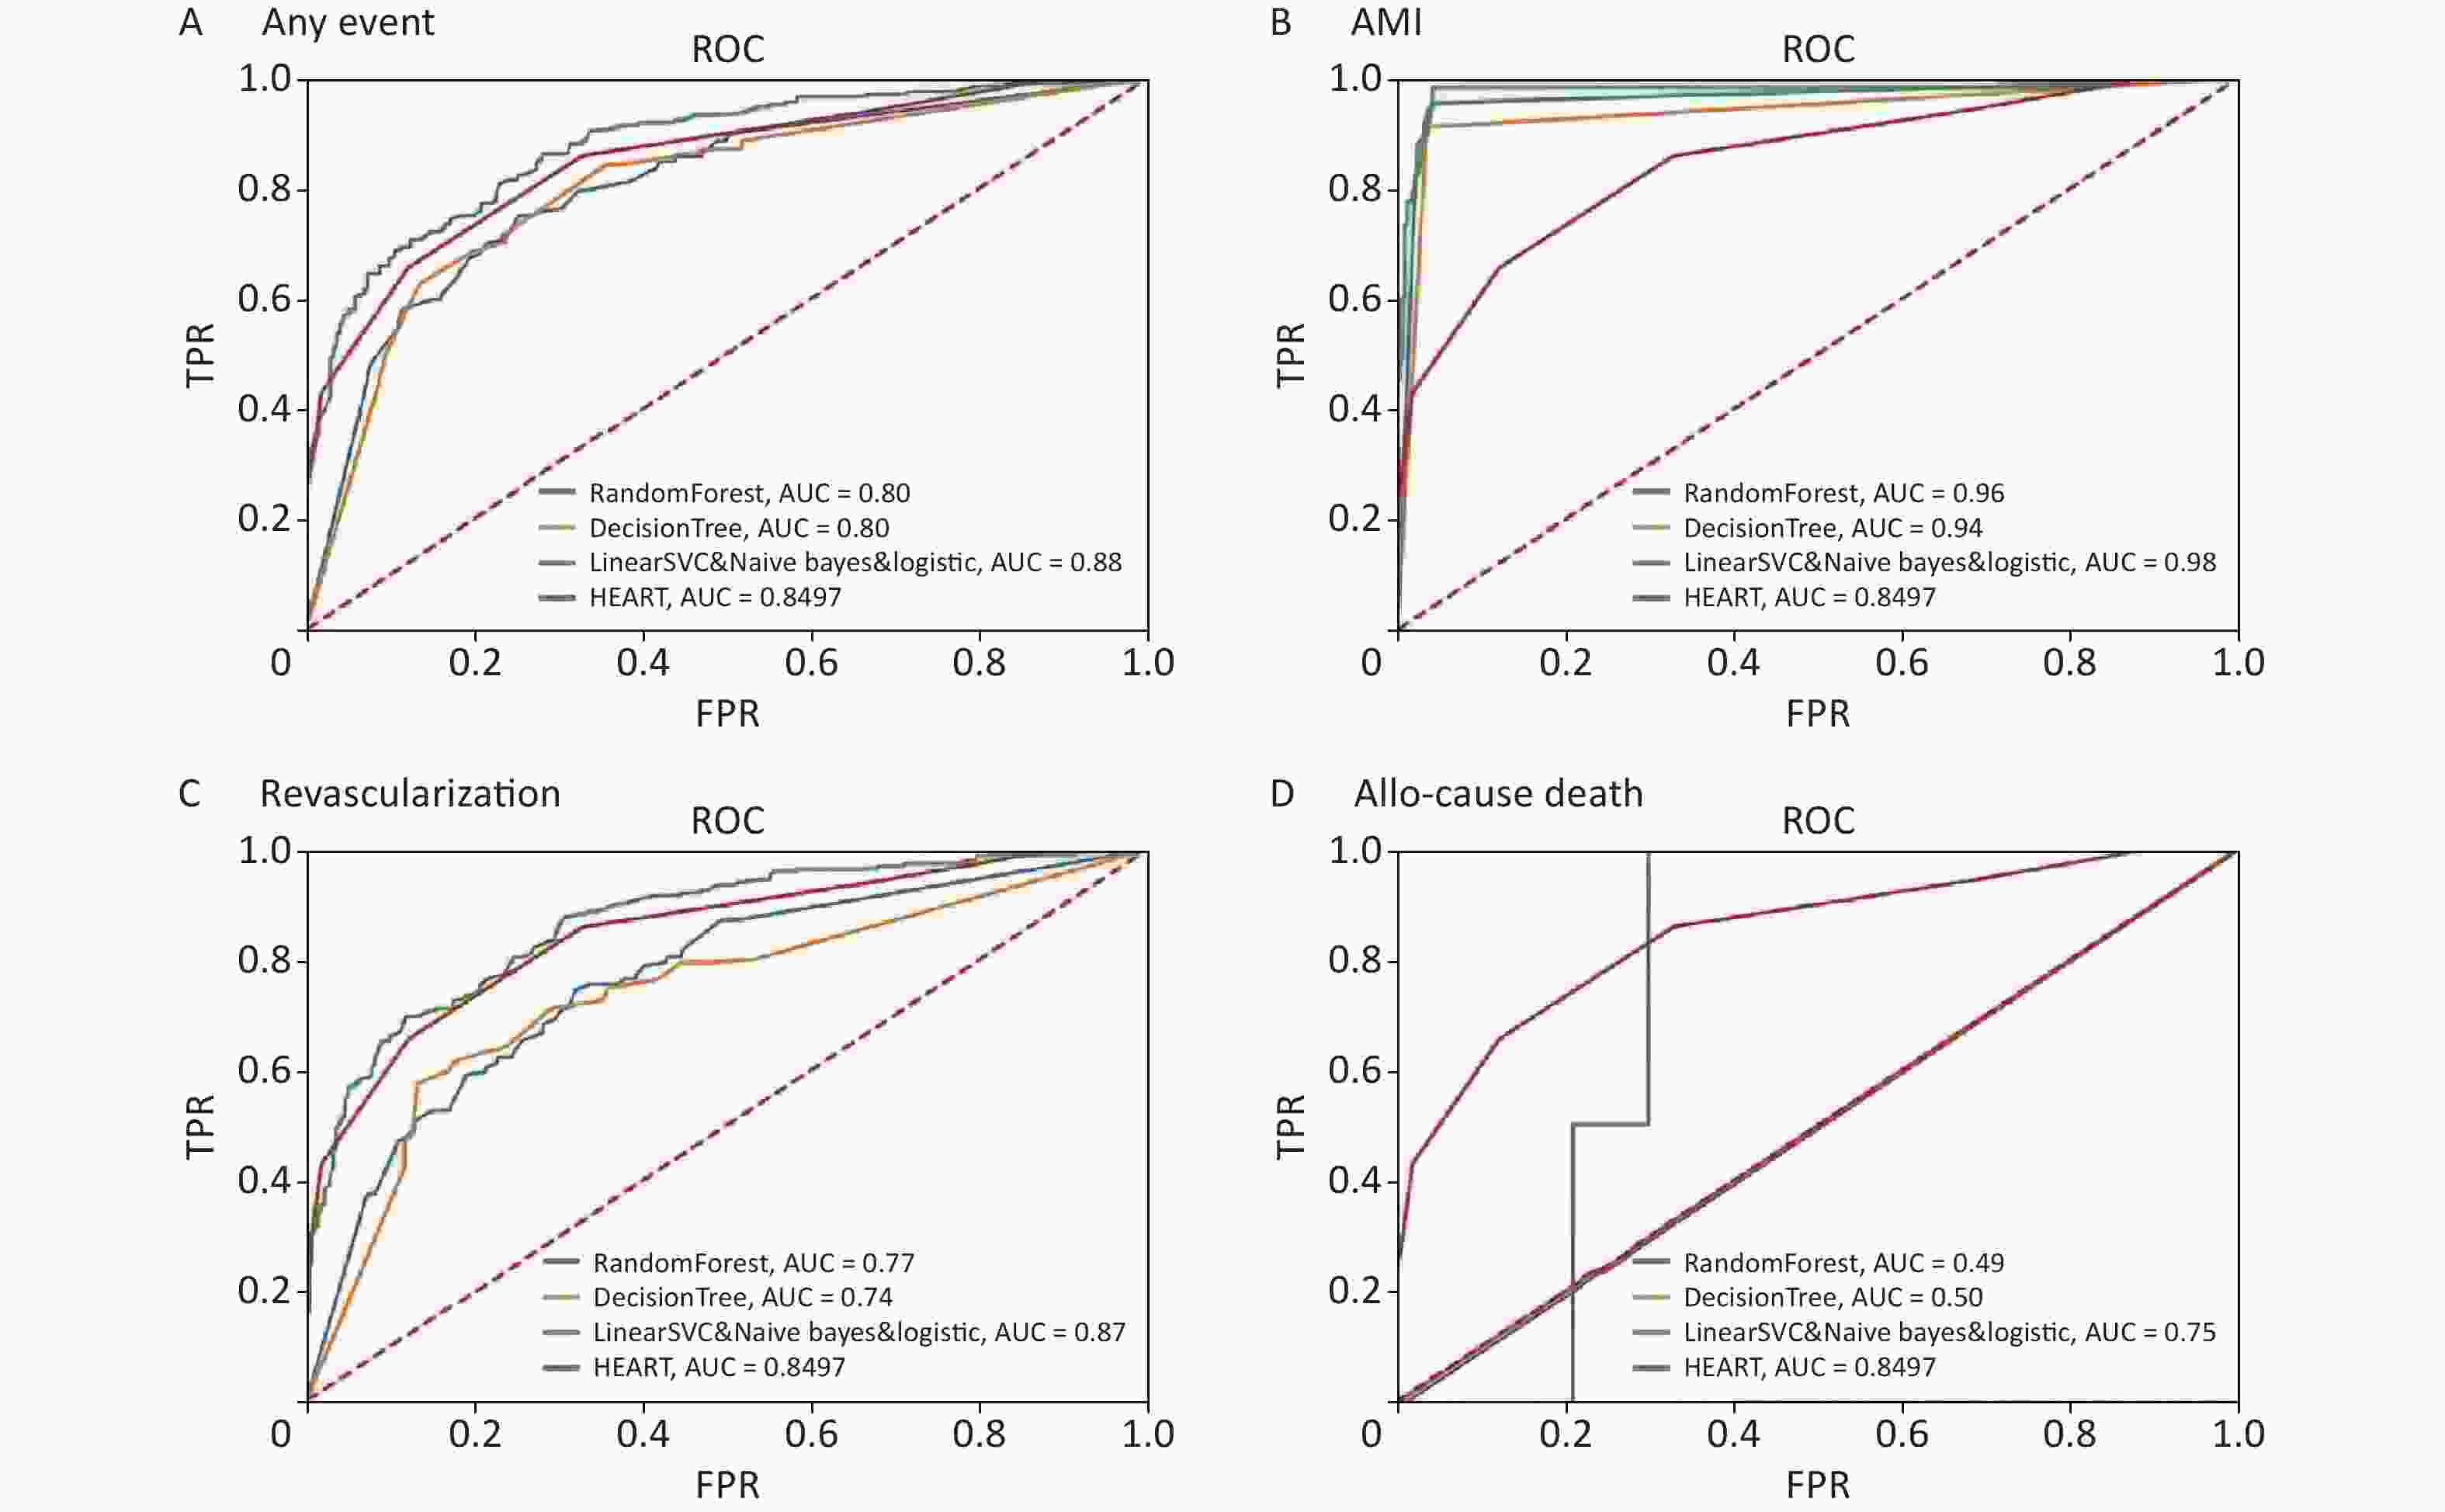
Figure 2. ROC curves for (A) any event, (B) AMI, (C) revascularization and (D) all-cause death of machine learning and HEART. TPR: true positive rate; AMI: acute myocardial infarction.
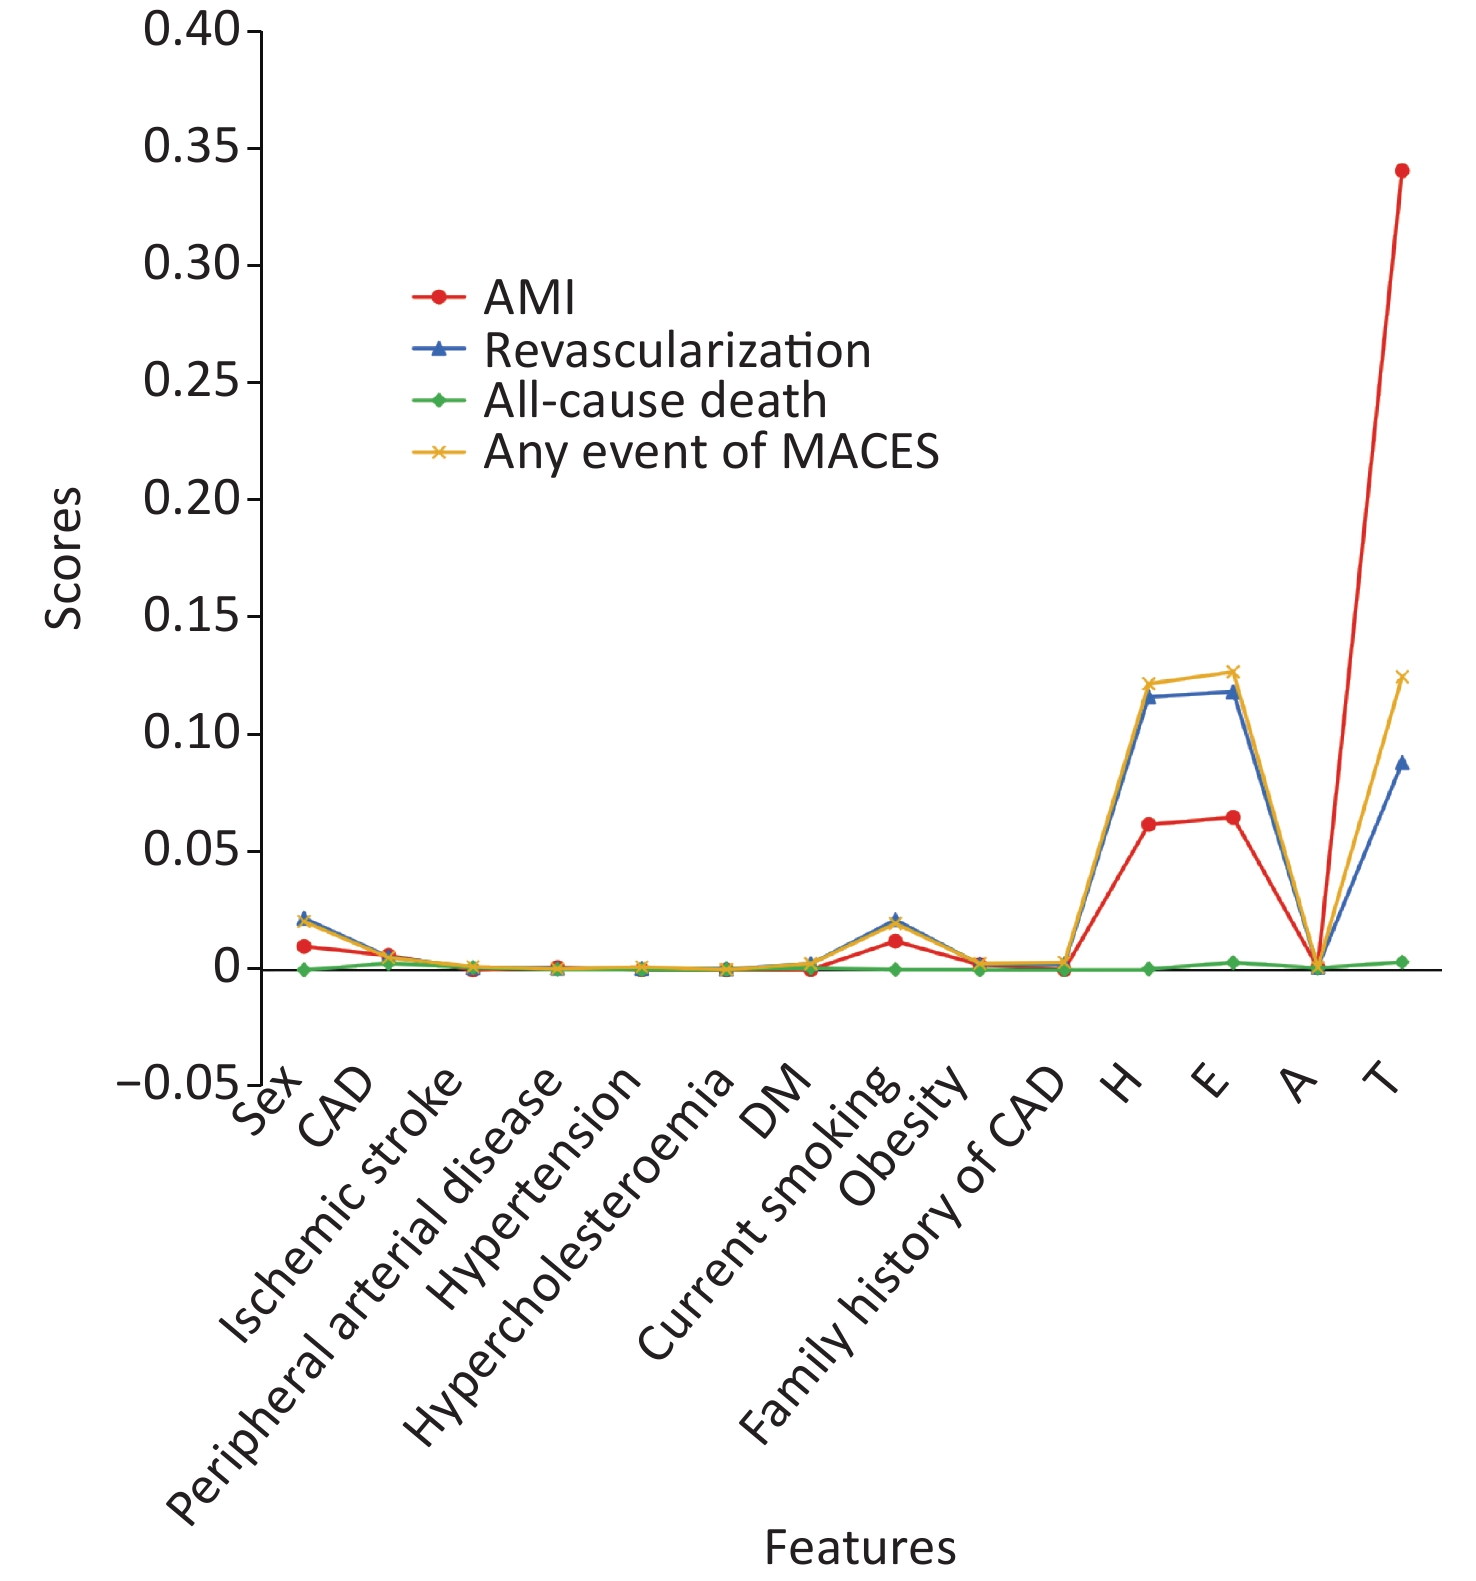
Ultimately, considering great learning metrics (over 0.8 for Accuracy, Precision, Recall and F-Measure) and high AUC (0.88 for any event, 0.98 for AMI, 0.87 for revascularization), ML model developed by Naïve Bayes was used for predicting the occurrence of MACEs from 14 features. As shown in Figure 3, the history of chest pain with suspected ACS, abnormal ECG and elevated hs-cTn I were risk factors for any event of MACEs, revascularization and AMI, and the 3 risk factors also were taken into consideration for HEART scoring system. In particular, we observed that elevated hs-cTn I remarkably increased the incidence of AMI. Moreover, ML model also predicted that sex and smoking were also risk factors for any event of MACEs, revascularization and AMI, presenting the advantages of ML model when predicting MACEs[20]. This finding couldn’t be achieved by HEART scoring system, which only takes 5 factors into consideration[6]. We didn’t find any correlation between all-cause death and 14 features, which could be explained by that enough sample size is the basis of good performance for prediction.
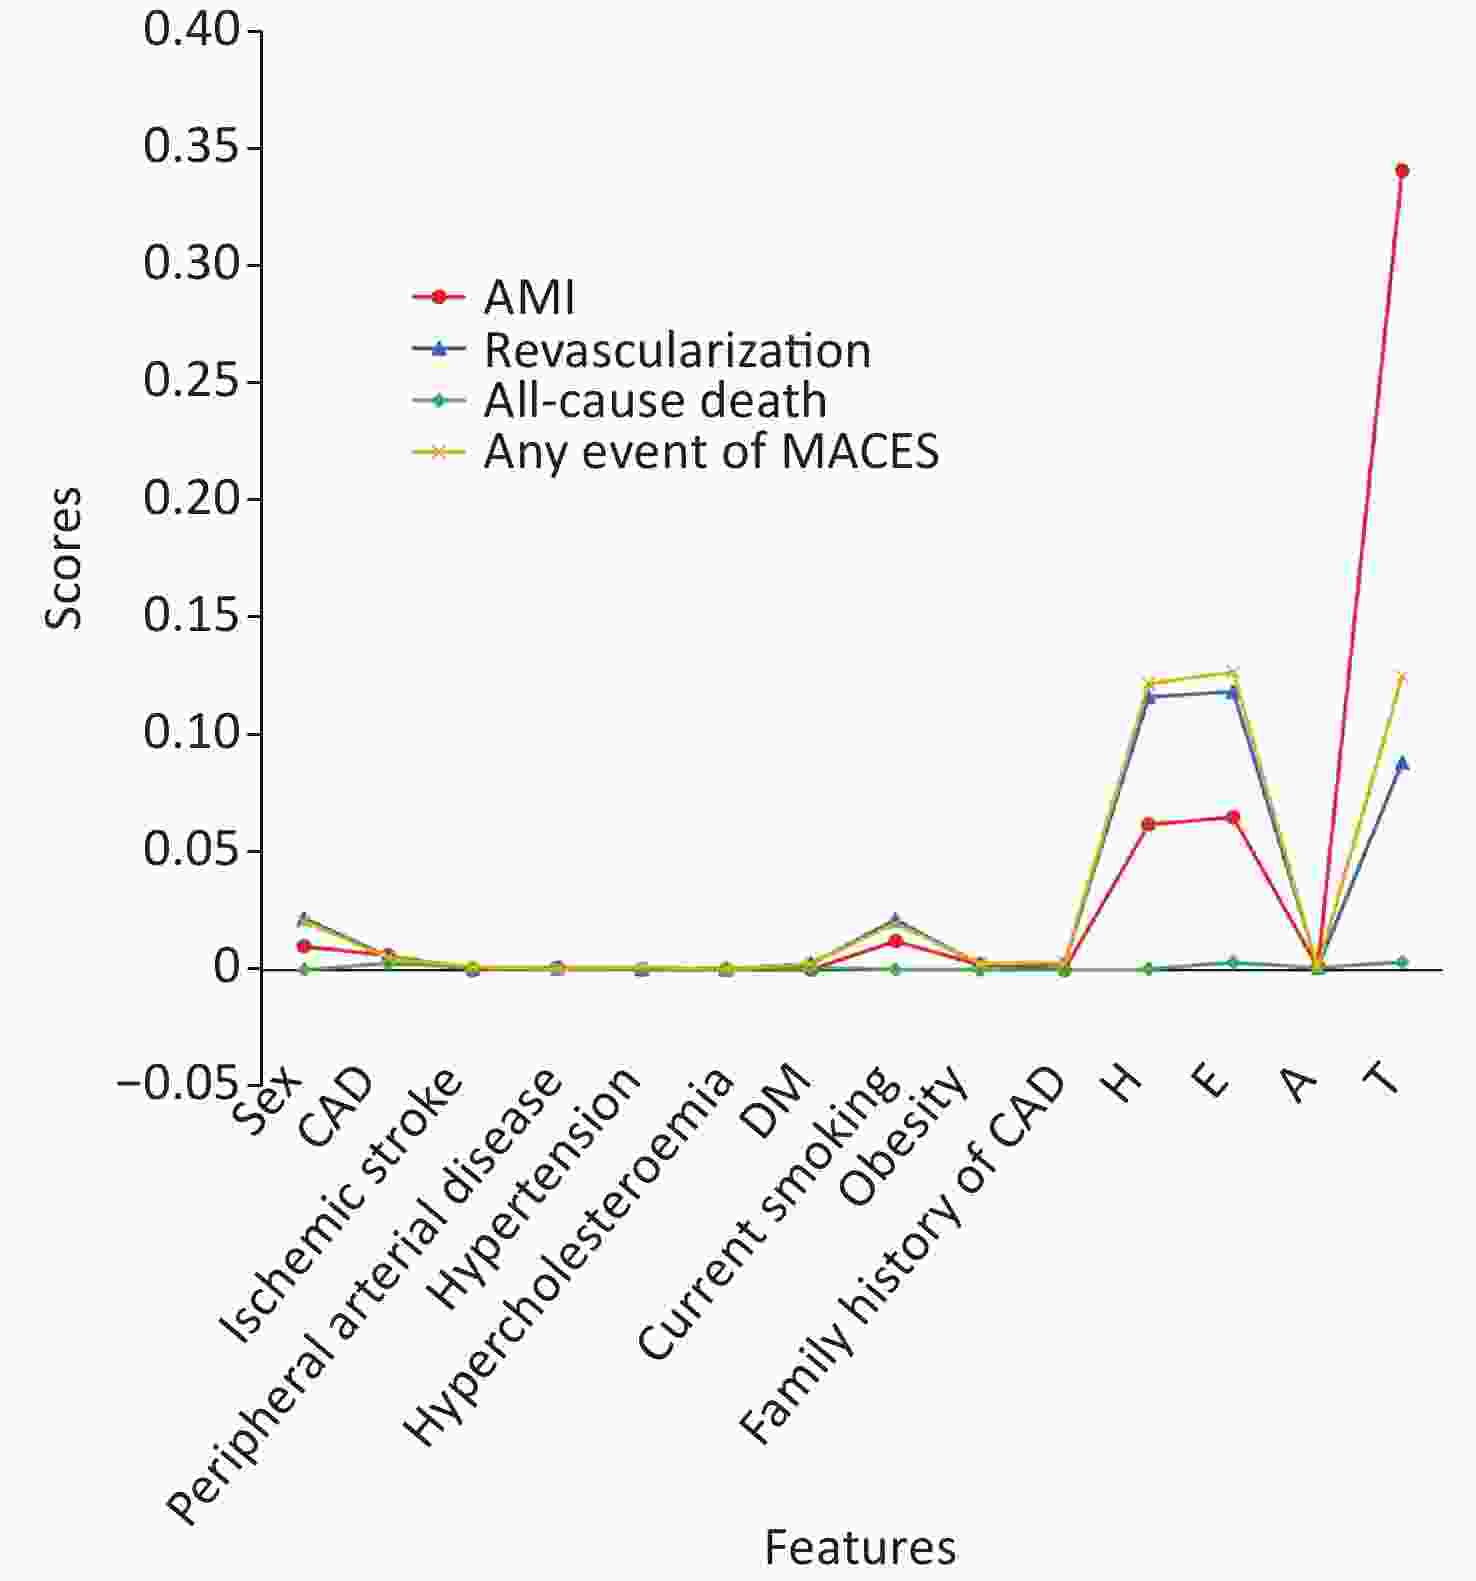
Figure 3. Prediction for the occurrence of MACEs (Any event, AMI, Revascularization, and all-cause death) from 14 features by ML model constructed by Naïve Bayes.
-
In this study, we analyzed important predictors of MACEs by radar plots and found that most of NSTE-ACS patients with MACEs had history of chest pain with suspected ACS, and underlying diseases, especially hypertension and DM. Furthermore, the radar plots accurately depicted the characteristics of each type of MACE for chest pain patients with NSTE-ACS, which provided effective patient profile for future prediction.
There were two reasons contributing to the performance improvement by ML models. Firstly, machine learning is capable of processing large amounts of complex data by different classifier algorithms. The machine learning model constructed by Naive Bayes in our study has a great learning metrics, with all Accuracy, Precision, Recall and F-Measure over 0.80 for predicting any event, AMI, revascularization and all-cause death. AUC ≥ 0.87 for predicting any event, AMI, revascularization. Secondly, the HEART scoring system can only predict the occurrence of MACE from 5 aspects of patients[4,21]. However, ML method can integrate various characteristics of patients and more accurately predict type of MACE(s), so that prognosis of patients can be accurately predict and a better diagnosis and treatment can be provided to patients. Our study predicted the association between 14 features of patients and MACEs by ML. Nine of these features are irrelevant to any of MACEs, while three of these features, the history of chest pain with suspected ACS, abnormal ECG and elevated hs-cTn I, corresponding to “H” “E” “T” in HERAT scoring system, were risk factors of MACE. This indirectly demonstrated the rational of design of HEART scoring system and accuracy of prediction of ML. Moreover, although the evidence was not strong and significant compared with ECG, History of chest pain with suspected ACS and Troponin, ML model constructed by Naïve Bayes also revealed sex and smoking history could be risk factors of MACEs. This finding would never be mentioned in other scoring system, indicating ML can capture more risk factors. This finding also reminds us that the chest pain patients with NSTE-ACS who is accompanied with smoking history also should alter the occurrence of MACEs. As we observed no strong evidence, future more patients should be included to analyze the risk factors by machine learning. In addition, this ML model can also be applied to other disciplines and other diseases, not limited to this research[22]. Feasibility and effectiveness of ML approach for the identification of predictors of events after an acute coronary syndrome has been proved by B, Fabrizio et al.[23]. As for clinical prognosis of young patients with hypertension, Xueyi Wu et al. demonstrated that the ML approach was comparable with Cox regression and was better than recalibrated Framingham Risk Score model[24]. In our study, although ML models constructed by Random Forest and Decision didn’t not always outperform HEART scoring and the results obtained by ROC and AUC were not identical with results obtained by the 4-learning metrics, the most encouraging result was that ML model constructed by every classifier presented the better performance than HEART scoring systems when predicted AMI, and the ML model constructed by Linear SVC, Naïve Bayes and Logistic could be considered superior over HEART scoring system in prediction for MACEs, especially for AMI and all-cause death.
However, there were still several limitations in our study. It was retrospective analysis in two centers, but ML need more prospective validation in multiple centers. The study population consisted of Chinese patients with chest pain from the ED who had a higher rate of MACE(s) than the rest of the population. Therefore, the high-latitude characteristics of ML are not fully reflected, and whether it can be applied to other populations needs further research. The sample size was not large enough in each MACE and it might be one of the potential negative factors for the performance of ML model.
-
In this study, ML models for risk prediction for MACEs in chest pain patients with NSTE ACS during 3 months after the first emergency were constructed and validated successfully. Compared with HEART risk scoring system, ML method presented apparently advantage when predicting AMI and still had a better performance when Linear SVC classifier, Naïve Bayes and Logistic classifiers were chosen. ML model developed by Naïve Bayes successfully predicted the correlation between incidence of MACEs and 14 features and revealed that history of chest pain with suspected ACS, abnormal ECG and elevated hs-cTn I, sex and smoking history could be risk factors of MACEs. Overall, this study demonstrated feasibility and superiority of ML method to predict the MACEs in chest pain patients with NSTE-ACS. This finding also reminds us that the chest pain patients with NSTE-ACS who is accompanied with smoking history also should alter the occurrence of MACEs.
-
The authors acknowledge the physicians at Emergency & Critical Care Center in Beijing Anzhen Hospital affiliated of Capital Medical University for their assistance in subject recruitment (with special thanks to Prof. WANG Mei, WANG Chun Mei, and LI Qing Xiang).
-
NIE Shao Ping, WANG Xiao and ZHENG Zhi Chang contributed to study design. WANG Nian and ZHENG Zhi Chang analyzed and interpreted the data. MA Chun Peng and AI Hui provided their technical expertise for coronary angiography. ZHENG Zhi Chang drafted the initial manuscript, ZHENG Zhi Chang and YUAN Wei worked together on the revision and writing of the final manuscript. WANG Xiao and JIANG Bo provided critical advice in the data analysis, interpretation and critically assessed the manuscript. All authors read and approved the final manuscript.
-
No additional data are available.
doi: 10.3967/bes2023.089
Exploring the Feasibility of Machine Learning to Predict Risk Stratification Within 3 Months in Chest Pain Patients with Suspected NSTE-ACS
-
Abstract:
Objective We aimed to assess the feasibility and superiority of machine learning (ML) methods to predict the risk of Major Adverse Cardiovascular Events (MACEs) in chest pain patients with NSTE-ACS. Methods Enrolled chest pain patients were from two centers, Beijing Anzhen Emergency Chest Pain Center Beijing Bo’ai Hospital, China Rehabilitation Research Center. Five classifiers were used to develop ML models. Accuracy, Precision, Recall, F-Measure and AUC were used to assess the model performance and prediction effect compared with HEART risk scoring system. Ultimately, ML model constructed by Naïve Bayes was employed to predict the occurrence of MACEs. Results According to learning metrics, ML models constructed by different classifiers were superior over HEART (History, ECG, Age, Risk factors, & Troponin) scoring system when predicting acute myocardial infarction (AMI) and all-cause death. However, according to ROC curves and AUC, ML model constructed by different classifiers performed better than HEART scoring system only in prediction for AMI. Among the five ML algorithms, Linear support vector machine (SVC), Naïve Bayes and Logistic regression classifiers stood out with all Accuracy, Precision, Recall and F-Measure from 0.8 to 1.0 for predicting any event, AMI, revascularization and all-cause death (vs. HEART ≤ 0.78), with AUC from 0.88 to 0.98 for predicting any event, AMI and revascularization (vs. HEART ≤ 0.85). ML model developed by Naïve Bayes predicted that suspected acute coronary syndrome (ACS), abnormal electrocardiogram (ECG), elevated hs-cTn I, sex and smoking were risk factors of MACEs. Conclusion Compared with HEART risk scoring system, the superiority of ML method was demonstrated when employing Linear SVC classifier, Naïve Bayes and Logistic. ML method could be a promising method to predict MACEs in chest pain patients with NSTE-ACS. -
Key words:
- Machine learning /
- MACEs /
- Chest pain /
- Suspected NSTE-ACS
This study was reviewed and approved by the Ethics Committee of Beijing Anzhen Hospital affiliated of Capital Medical University; approval number was 2018055X. Written informed consent was obtained from all individual participants included in the study. All procedures performed in studies involving human participants followed the ethical standards of the institutional or national research committee and the 1964 Helsinki declaration and its later amendments or comparable ethical standards.
&These authors contributed equally to this work.
注释:1) COMPETING INTERESTS: 2) ETHICS APPROVAL AND CONSENT TO PARTICIPATE: -
Figure 1. (A) Radar plot for the 14 most important predictors of any MACE event; (B) Radar plot for the 14 most important predictors of PCI; (C) Radar plot for the 13 most important predictors of AMI; (D) Radar plot for the 14 most important predictors of CABG; (E) Radar plot for the 7 most important predictors of all-cause-death.
T: Elevated hs-cTn I, A: age, E: abnormal ECG, H: History of chest pain with suspected ACS. PCI: percutaneous coronary intervention; AMI: acute myocardial infarction; CAGB: coronary artery bypass grafting; PAD: peripherial arterial disease; CAD: coronary artery disease; ECG: electrocardiogram; ACS: acute coronary syndrome.
Figure 2. ROC curves for (A) any event, (B) AMI, (C) revascularization and (D) all-cause death of machine learning and HEART. TPR: true positive rate; AMI: acute myocardial infarction.
Figure 3. Prediction for the occurrence of MACEs (Any event, AMI, Revascularization, and all-cause death) from 14 features by ML model constructed by Naïve Bayes.
H, history of chest pain with suspected ACS; E, abnormal ECG; A, age; T, elevated hs-cTn I. AMI: acute myocardial infarction; ACS: acute coronary syndrome; ECG: electrocardiogram.
Table 1. The 14 features selected in classification
Variables Features Sex [1.2], (Female = 1, Male = 2) Coronary artery disease (CAD) CAD history [0, 1], (Y = 1, N = 0) Ischemic stroke [0, 1], (Y = 1, N = 0) Peripheral arterial disease [0, 1], (Y = 1, N = 0) Hypertension [0, 1], (Y = 1, N = 0) Hypercholesterolemia [0, 1], (Y = 1, N = 0) Diabetes mellitus [0, 1], (Y = 1, N = 0) Current Smoking [0, 1], (Y = 1, N = 0) Obesity [0, 1], (Y = 1, N = 0) Family History of Premature CAD [0, 1], (Y = 1, N = 0) History of Chest Pain with suspected ACS (H) [0, 1, 2] ECG (E) [0, 1, 2] Age (A) [0, 1, 2] Troponin levels (T) [0, 1, 2]  下载: 导出CSV
Table 2. Baseline characteristics of the study cohort
Characteristics Values P Age, years 59.1 ± 10.20 / Sex Male 953 (64.8) < 0.001 Female 519 (35.2) Hypertension No 531 (36.1) < 0.001 Yes 941 (63.9) Hypercholesterolemia No 1,103 (74.9) < 0.001 Yes 369 (25.1) DM No 1,051 (71.4) < 0.001 Yes 421 (28.6) Family history of premature CAD No 1,269 (86.2) < 0.001 Yes 203 (13.8) Smoke No 1,036 (70.4) < 0.001 Yes 436 (29.6) Obesity No 1,276 (86.7) < 0.001 Yes 196 (13.3) AMI No 1,265 (85.9) < 0.001 Yes 207 (14.1) PCI No 998 (67.8) < 0.001 Yes 474 (32.2) CABG No 1,351 (91.8) < 0.001 Yes 121 (8.2) Ischemic stroke No 1,324 (89.9) < 0.001 Yes 148 (10.1) PAD No 1,392 (94.6) < 0.001 Yes 80 (5.4) CAD No 1,025 (69.6) < 0.001 Yes 447 (30.4) History of chest pain with suspected ACS Slightly 152 (10.3) < 0.001 Moderately 841 (57.1) Highly 479 (32.6) ECG Normal 518 (35.2) < 0.001 Non-specific repolarization disturbance 667 (45.3) Significant ST deviation 287 (19.5) Age group (years) ≤ 45 132 (8.9) < 0.001 45– 891 (60.5) ≥ 65 449 (30.6) Troponin ≤ normal limit 1,174 (79.8) < 0.001 1–3× normal limit 103 (7.0) > 3× normal limit 195 (13.2) Note. Data are mean ± SD or n (%). CABG: coronary artery bypass graft; CAD: coronary artery disease; ECG: electrocardiogram; PAD: peripherial arterial disease; DM: diabetes mellitus; hs-cTn I: high-sensitivity cardiac troponin I; AMI: acute myocardial infarction; PCI: percutaneous coronary intervention.
下载: 导出CSV
Table 3. ML prediction for any event, AMI, revascularization and all-cause death
Classifier Any event AMI Revascularization All-cause death A P R F A P R F A P R F A P R F Linear SVC 0.80 0.80 0.80 0.80 0.95 0.95 0.95 0.95 0.80 0.80 0.80 0.80 1.00 0.99 1.00 0.99 Decision Tree 0.75 0.75 0.75 0.75 0.96 0.96 0.96 0.96 0.74 0.74 0.74 0.73 0.99 0.99 0.99 0.99 Naive Bayes 0.80 0.81 0.80 0.80 0.96 0.97 0.96 0.96 0.80 0.80 0.80 0.80 0.99 0.99 0.99 0.99 Logistic 0.80 0.80 0.80 0.80 0.95 0.95 0.95 0.95 0.80 0.80 0.80 0.80 1.00 0.99 1.00 0.99 Random Forest 0.74 0.74 0.74 0.74 0.95 0.96 0.95 0.96 0.71 0.71 0.71 0.71 1.00 0.99 1.00 0.99 HEART 0.77 0.78 0.77 0.77 0.77 0.78 0.77 0.77 0.77 0.78 0.77 0.77 0.77 0.78 0.77 0.77 Note. A, Accuracy; P, Precision; R: Recall; F, F-measure; AMI, acute myocardial infarction cute myocardial infarction.
下载: 导出CSV
-
[1] Gulati M, Levy PD, Mukherjee D, et al. 2021 AHA/ACC/ASE/CHEST/SAEM/SCCT/SCMR Guideline for the Evaluation and Diagnosis of Chest Pain: A Report of the American College of Cardiology/American Heart Association Joint Committee on Clinical Practice Guidelines. Circulation, 2021; 144, e368−454. [2] Six AJ, Backus BE, Kelder JC. Chest pain in the emergency room: value of the HEART score. Neth Heart J, 2008; 16, 191−6. doi: 10.1007/BF03086144 [3] Pollack CV Jr. , Sites FD, Shofer FS, et al. Application of the TIMI risk score for unstable angina and non-ST elevation acute coronary syndrome to an unselected emergency department chest pain population. Acad Emerg Med, 2006; 13, 13−8. doi: 10.1197/j.aem.2005.06.031 [4] Aarts GWA, Camaro C, van Geuns RJ, et al. Acute rule-out of non-ST-segment elevation acute coronary syndrome in the (pre)hospital setting by HEART score assessment and a single point-of-care troponin: rationale and design of the ARTICA randomised trial. BMJ Open, 2020; 10, e034403. doi: 10.1136/bmjopen-2019-034403 [5] Gibbs J, McCord J. Chest Pain Evaluation in the Emergency Department: Risk Scores and High-Sensitivity Cardiac Troponin. Curr Cardiol Rep, 2020; 22, 49. doi: 10.1007/s11886-020-01294-1 [6] Ma CP, Wang X, Wang QS, et al. A modified HEART risk score in chest pain patients with suspected non-ST-segment elevation acute coronary syndrome. J Geriatr Cardiol, 2016; 13, 64−9. [7] Atwood J. Management of Acute Coronary Syndrome. Emerg Med Clin North Am, 2022; 40, 693−706. doi: 10.1016/j.emc.2022.06.008 [8] Schwalbe N, Wahl B. Artificial intelligence and the future of global health. Lancet, 2020; 395, 1579−86. doi: 10.1016/S0140-6736(20)30226-9 [9] Ross EG, Shah NH, Dalman RL, et al. The use of machine learning for the identification of peripheral artery disease and future mortality risk. J Vasc Surg, 2016; 64, 1515-22. e3. doi: 10.1016/j.jvs.2016.04.026 [10] Ng ACT, Delgado V, Bax JJ. Individualized Patient Risk Stratification Using Machine Learning and Topological Data Analysis. JACC Cardiovasc Imaging, 2020; 13, 1133−4. doi: 10.1016/j.jcmg.2020.02.003 [11] Assaf D, Gutman Y, Neuman Y, et al. Utilization of machine-learning models to accurately predict the risk for critical COVID-19. Intern Emerg Med, 2020; 15, 1435−43. doi: 10.1007/s11739-020-02475-0 [12] Stark GF, Hart GR, Nartowt BJ, et al. Predicting breast cancer risk using personal health data and machine learning models. PloS one, 2019; 14, e0226765. doi: 10.1371/journal.pone.0226765 [13] Alizadehsani R, Abdar M, Roshanzamir M, et al. Machine learning-based coronary artery disease diagnosis: A comprehensive review. Comput Biol Med, 2019; 111, 103346. doi: 10.1016/j.compbiomed.2019.103346 [14] Noh YK, Park JY, Choi BG, et al. A Machine Learning-Based Approach for the Prediction of Acute Coronary Syndrome Requiring Revascularization. J Med Syst, 2019; 43, 253. doi: 10.1007/s10916-019-1359-5 [15] Motwani M, Dey D, Berman DS, et al. Machine learning for prediction of all-cause mortality in patients with suspected coronary artery disease: a 5-year multicentre prospective registry analysis. Eur Heart J, 2017; 38, 500−7. [16] Sherazi SWA, Jeong YJ, Jae MH, Bae JW, Lee JY. A machine learning-based 1-year mortality prediction model after hospital discharge for clinical patients with acute coronary syndrome. Health Informatics J, 2020; 26, 1289−304. doi: 10.1177/1460458219871780 [17] Juan-Salvadores P, Veiga C, Díaz VAJ, et al. Using Machine Learning Techniques to Predict MACE in Very Young Acute Coronary Syndrome Patients. Diagnostics (Basel), 2022; 12, 422. doi: 10.3390/diagnostics12020422 [18] González-Juanatey C, Anguita-Sánchez M, Barrios V, et al. Major Adverse Cardiovascular Events in Coronary Type 2 Diabetic Patients: Identification of Associated Factors Using Electronic Health Records and Natural Language Processing. J Clin Med, 2022; 11, 6004. doi: 10.3390/jcm11206004 [19] Peng XR, Zhu T, Wang T, et al. Machine learning prediction of postoperative major adverse cardiovascular events in geriatric patients: a prospective cohort study. BMC Anesthesiol, 2022; 22, 284. doi: 10.1186/s12871-022-01827-x [20] Connor CW. Artificial Intelligence and Machine Learning in Anesthesiology. Anesthesiology, 2019;131, 1346−59. doi: 10.1097/ALN.0000000000002694 [21] Backus BE, Six AJ, Kelder JC, et al. A prospective validation of the HEART score for chest pain patients at the emergency department. Int J Cardiol, 2013; 168, 2153−8. doi: 10.1016/j.ijcard.2013.01.255 [22] Al'Aref SJ, Anchouche K, Singh G, et al. Clinical applications of machine learning in cardiovascular disease and its relevance to cardiac imaging. Eur Heart J, 2019; 40, 1975−86. doi: 10.1093/eurheartj/ehy404 [23] D'Ascenzo F, De Filippo O, Gallone G, et al. Machine learning-based prediction of adverse events following an acute coronary syndrome (PRAISE): a modelling study of pooled datasets. Lanc et, 2021; 397, 199−207. doi: 10.1016/S0140-6736(20)32519-8 [24] Wu X, Yuan X, Wang W, et al. Value of a Machine Learning Approach for Predicting Clinical Outcomes in Young Patients With Hypertension. Hypertension, 2020; 75, 1271−8. doi: 10.1161/HYPERTENSIONAHA.119.13404 -
 22424+Supplementary Materials.pdf

-

 点击查看大图
计量
- 文章访问数: 663
- HTML全文浏览量: 325
- PDF下载量: 215
- 被引次数: 0


 Quick Links