

 下载:
下载:


-
Diabetic retinopathy (DR) is a major cause of blindness in adults[1]. The global diabetic patients’ number was estimated to be 536.6 million in 2021, and is expected to rise to be 783.2 million in 2045[2]. Approximately one-third of patients develop DR[3]. Therefore, developing a reliable risk assessment method for the development of DR to facilitate early intervention and prevention of the disease is necessary.
Previous development of risk assessment models for DR relied on classical statistical methods to integrate multiple risk factors associated with the condition[4,5]. However, these risk-prediction methods for DR exhibit limited efficacy due to their suboptimal predictive performance. In recent years, machine learning (ML) methods have demonstrated powerful self-learning abilities and improved disease prediction accuracy[6]. Previously reported ML prediction models primarily include demographic factors[7,8].
Genetic factors are widely recognized as important contributors to the progression of DR[9-11]. However, only a few studies have employed ML methods that incorporate identified genetic risk factors. In the case of age-related macular degeneration, the inclusion of genetic factors enhances the accuracy of predictive models[12,13].
Thus, the present study aimed to investigate the effect of an ML prediction model for DR while including the genetic risk factors identified in a DR pedigree using whole-exome sequencing (WES).
-
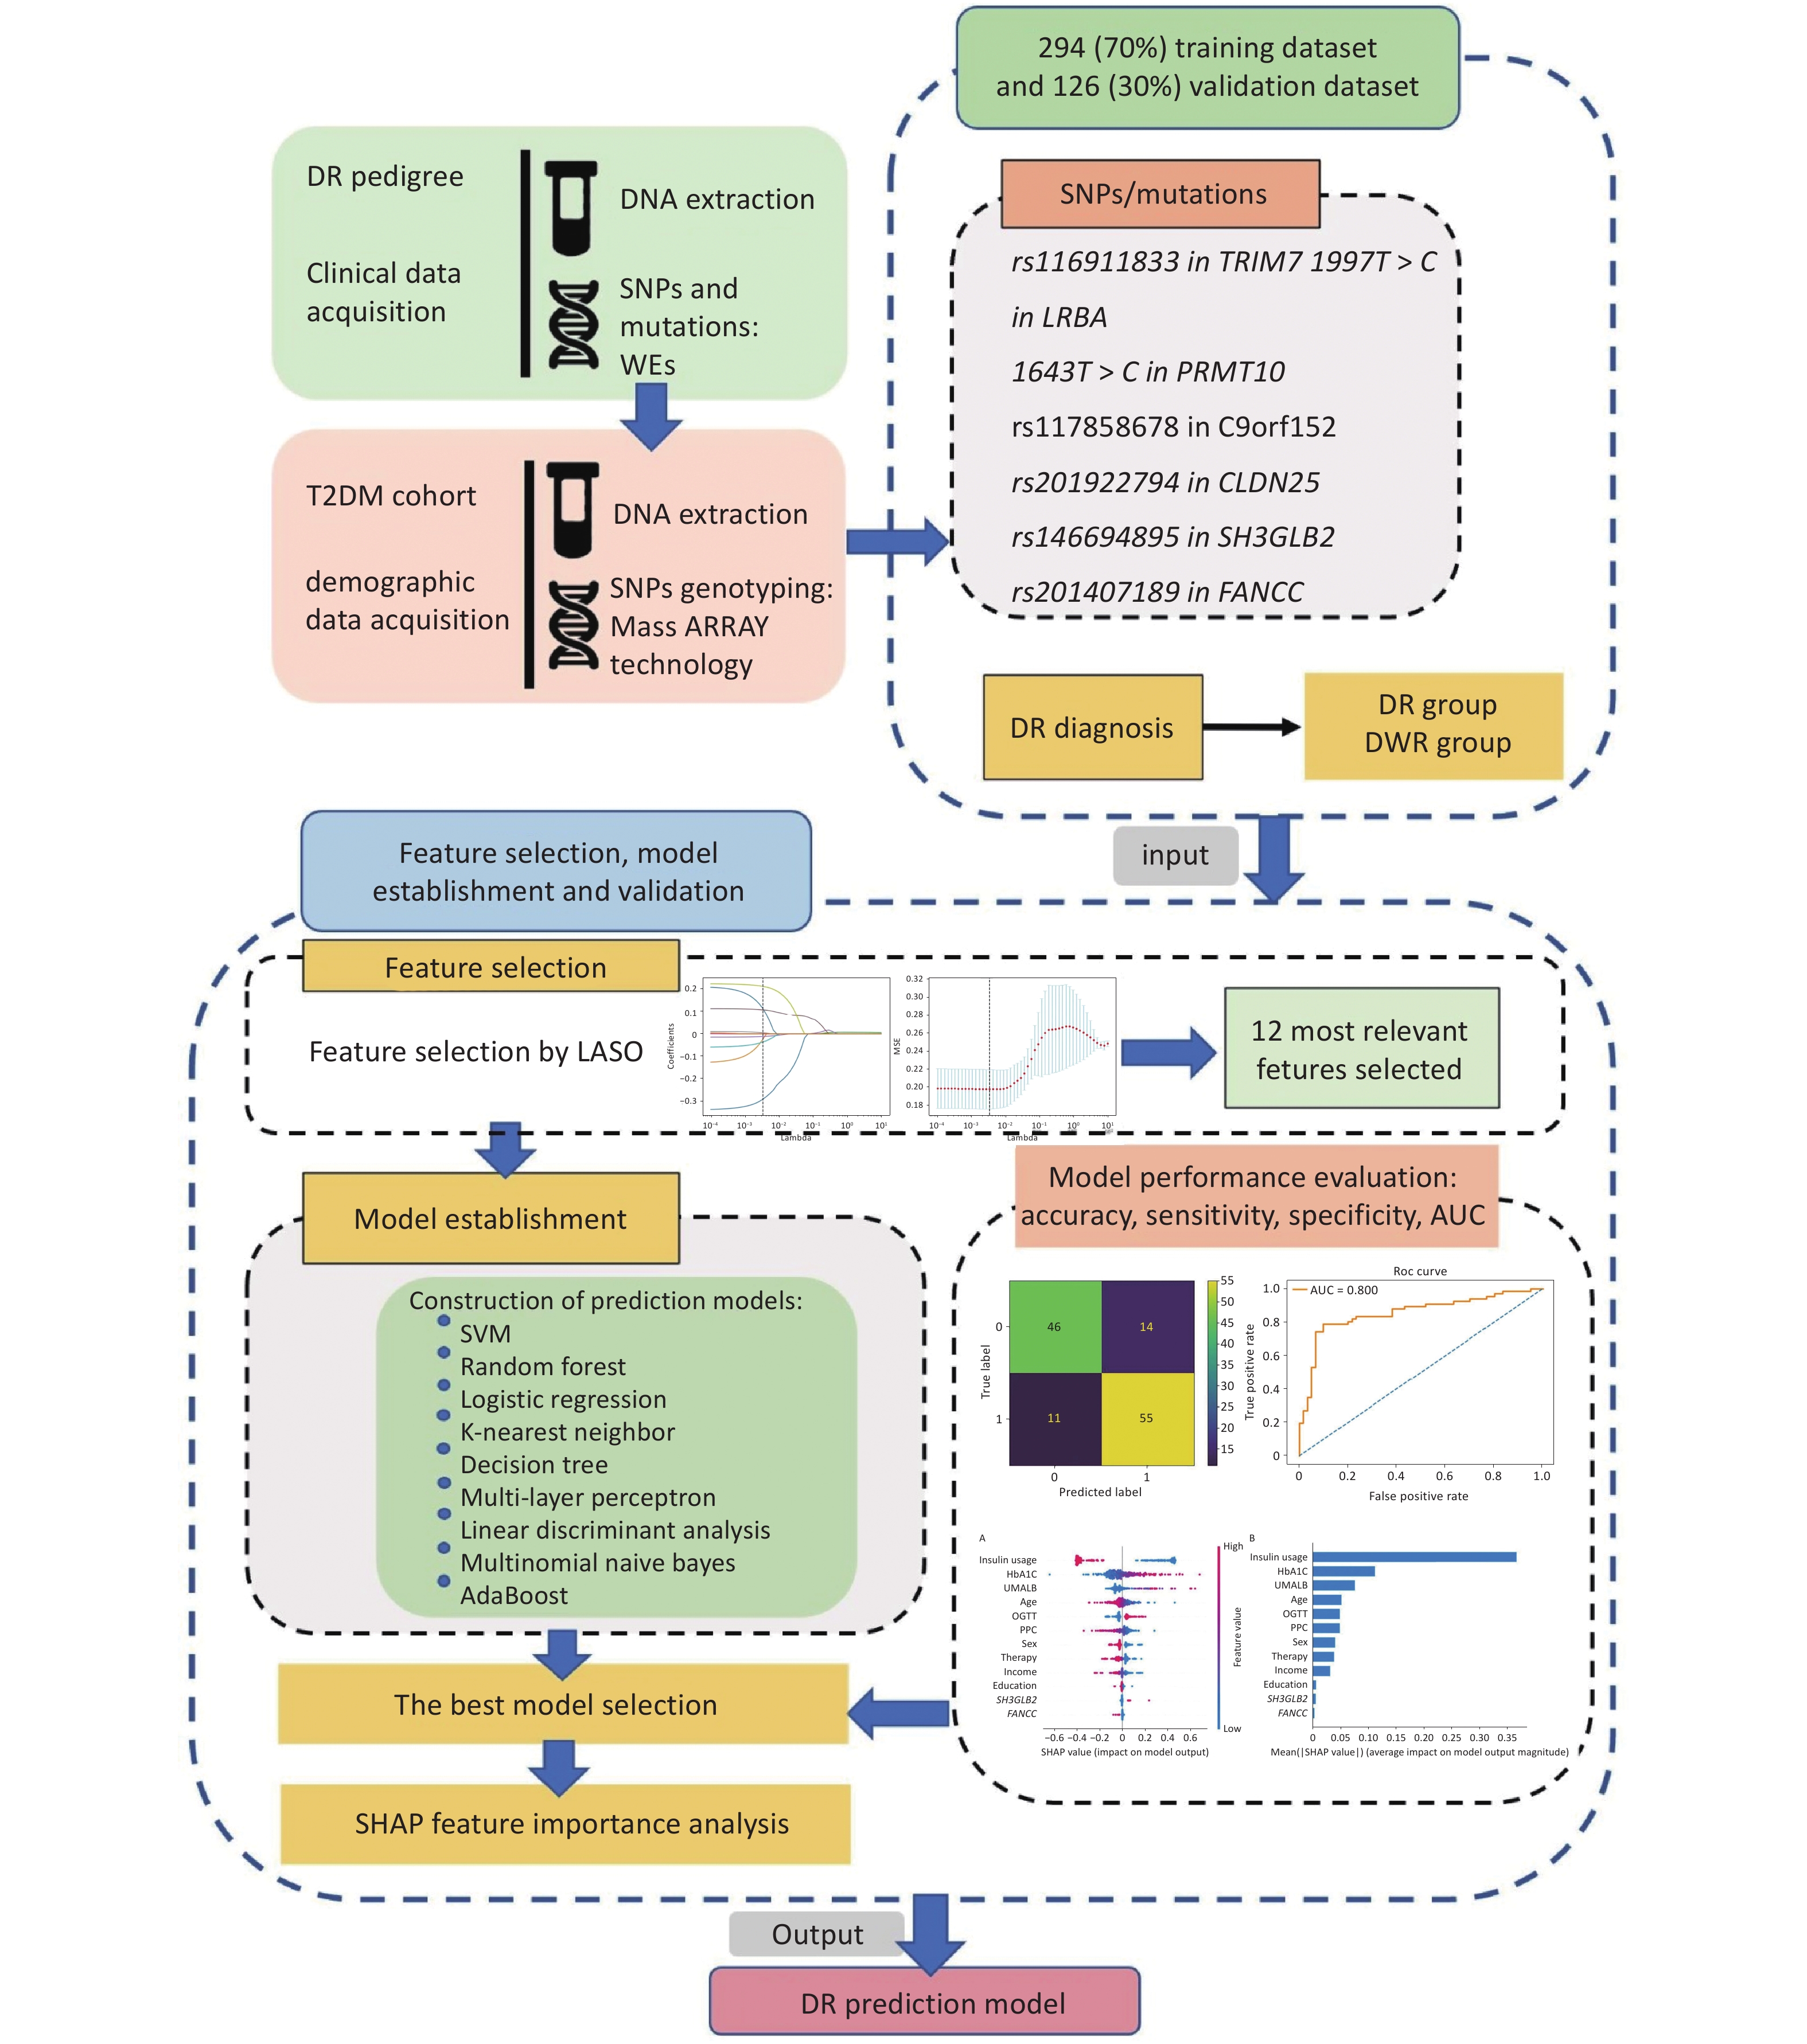
The DR pedigree, including probands and the type 2 diabetes mellitus (T2DM) cohort, was selected from the Desheng Diabetic Eye Study, the details of which have been previously described[14]. The study protocol was approved by the Ethics Committees of Beijing Chao-Yang Hospital and Beijing Tongren Hospital and adhered to the tenets of the Declaration of Helsinki. Written informed consent was obtained from all participants before enrolment in the study. Diabetes was defined as a self-reported history of physician-diagnosed T2DM treated with insulin, oral hypoglycemic agents, or diet only; or by a fasting plasma glucose (FPG) concentration of 7.0 mmol/L (126 mg/dL) or more in at least two previous examinations; or a random plasma glucose concentration of ≥ 11.1 mmol/L (200 mg/dL). An overview of the study design is shown in Figure 1.
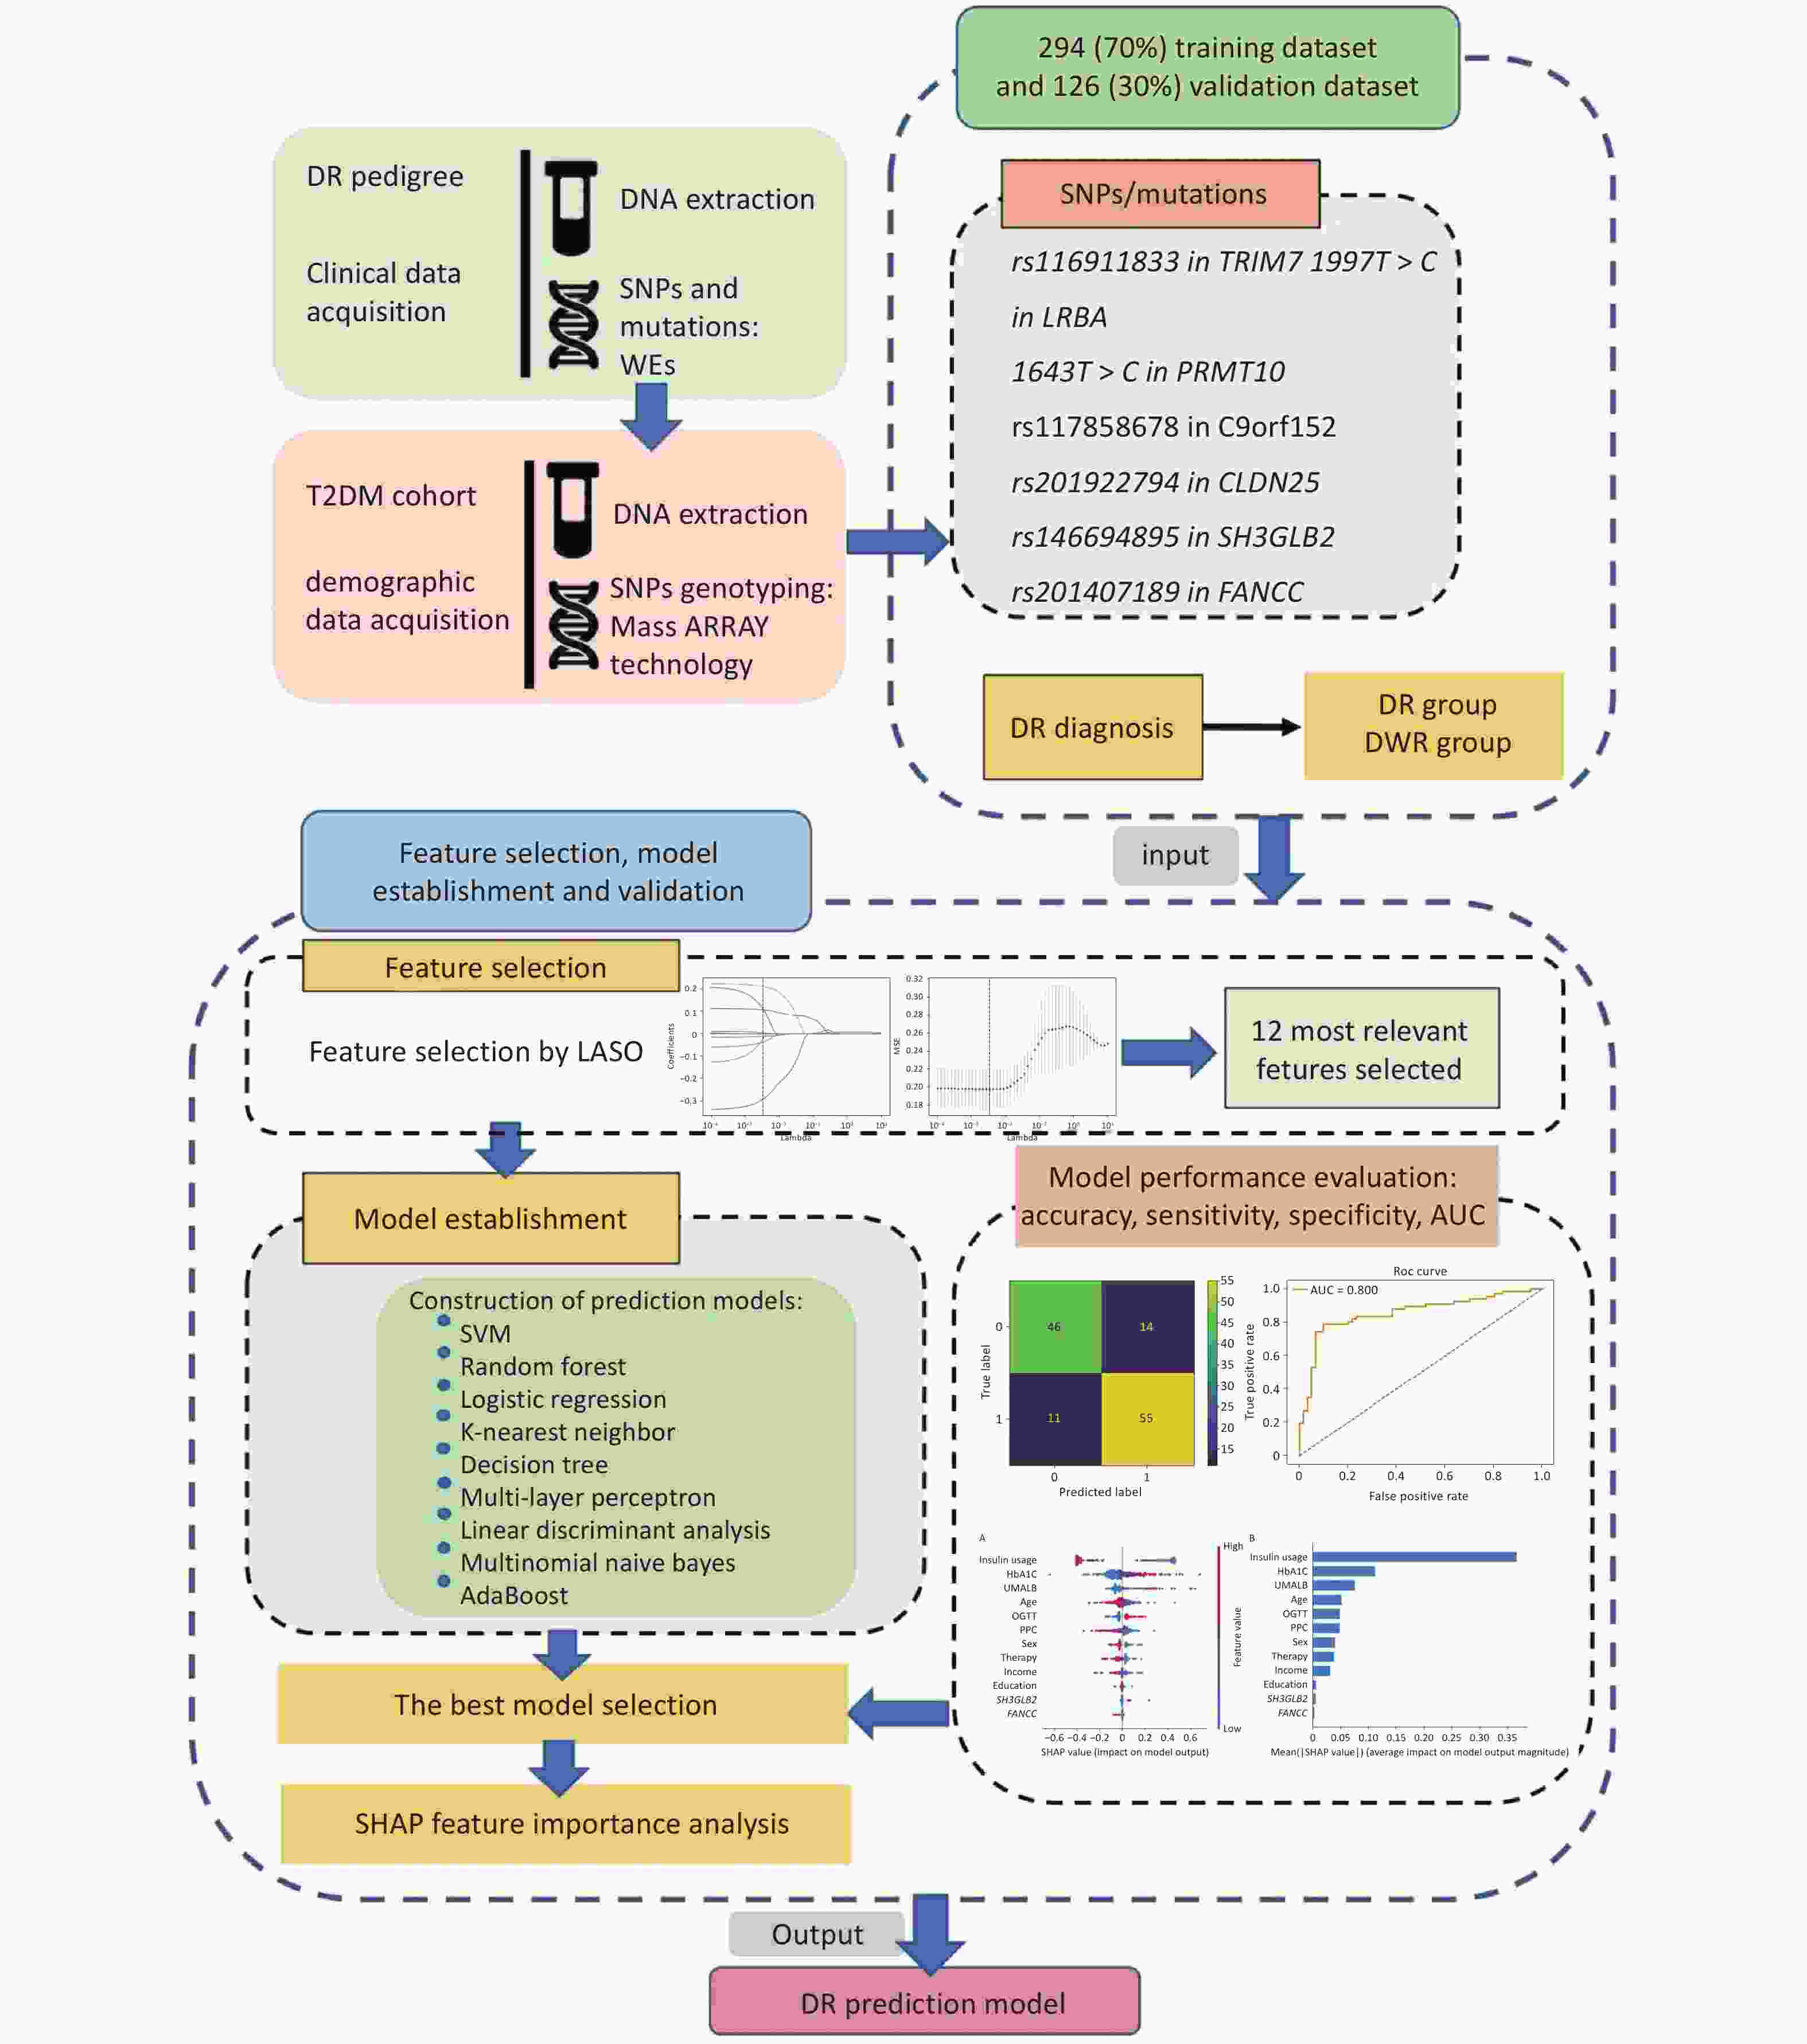
Figure 1. Overview of the study design. The probands in the diabetic retinopathy (DR) pedigree and the type 2 diabetes mellitus (T2DM) cohort were derived from the Desheng Diabetic Eye Study. We collected clinical data through questionnaires and obtained venous blood samples from all participants. Genomic DNA was extracted from leukocytes. We identified seven single nucleotide polymorphisms (SNPs) and mutations associated with DR in the pedigree using whole-exome sequencing (WES). The dataset’s participants were genotyped for these SNPs employing Sequenom MassARRAY technology (Bioyong Technologies, Beijing, China). For the T2DM cohort, 70% of the data was allocated for training and 30% for validation. We assessed various machine learning algorithms, including the linear support vector machine (SVM), random forest, logistic regression, K-nearest neighbor, decision tree, multi-layer perceptron, linear discriminant analysis, multinomial naive Bayes, and AdaBoost. Model efficacy was evaluated by accuracy, sensitivity, specificity, the area under the receiver operating characteristic curve (AUC), and the kappa statistic.
All the participants underwent a standardized evaluation consisting of a questionnaire, ocular and anthropometric examinations, and laboratory tests. Laboratory tests, including fasting plasma glucose (FPG), glycosylated hemoglobin A1c (HbA1c), creatinine, uric acid, lipid profile (levels of total cholesterol, triglycerides, and high-density and low-density lipoprotein cholesterol), and urine albuminuria (UMALB) were conducted for all 420 participants. Venous blood samples were obtained from all participants, stored at −80 °C until DNA extraction.
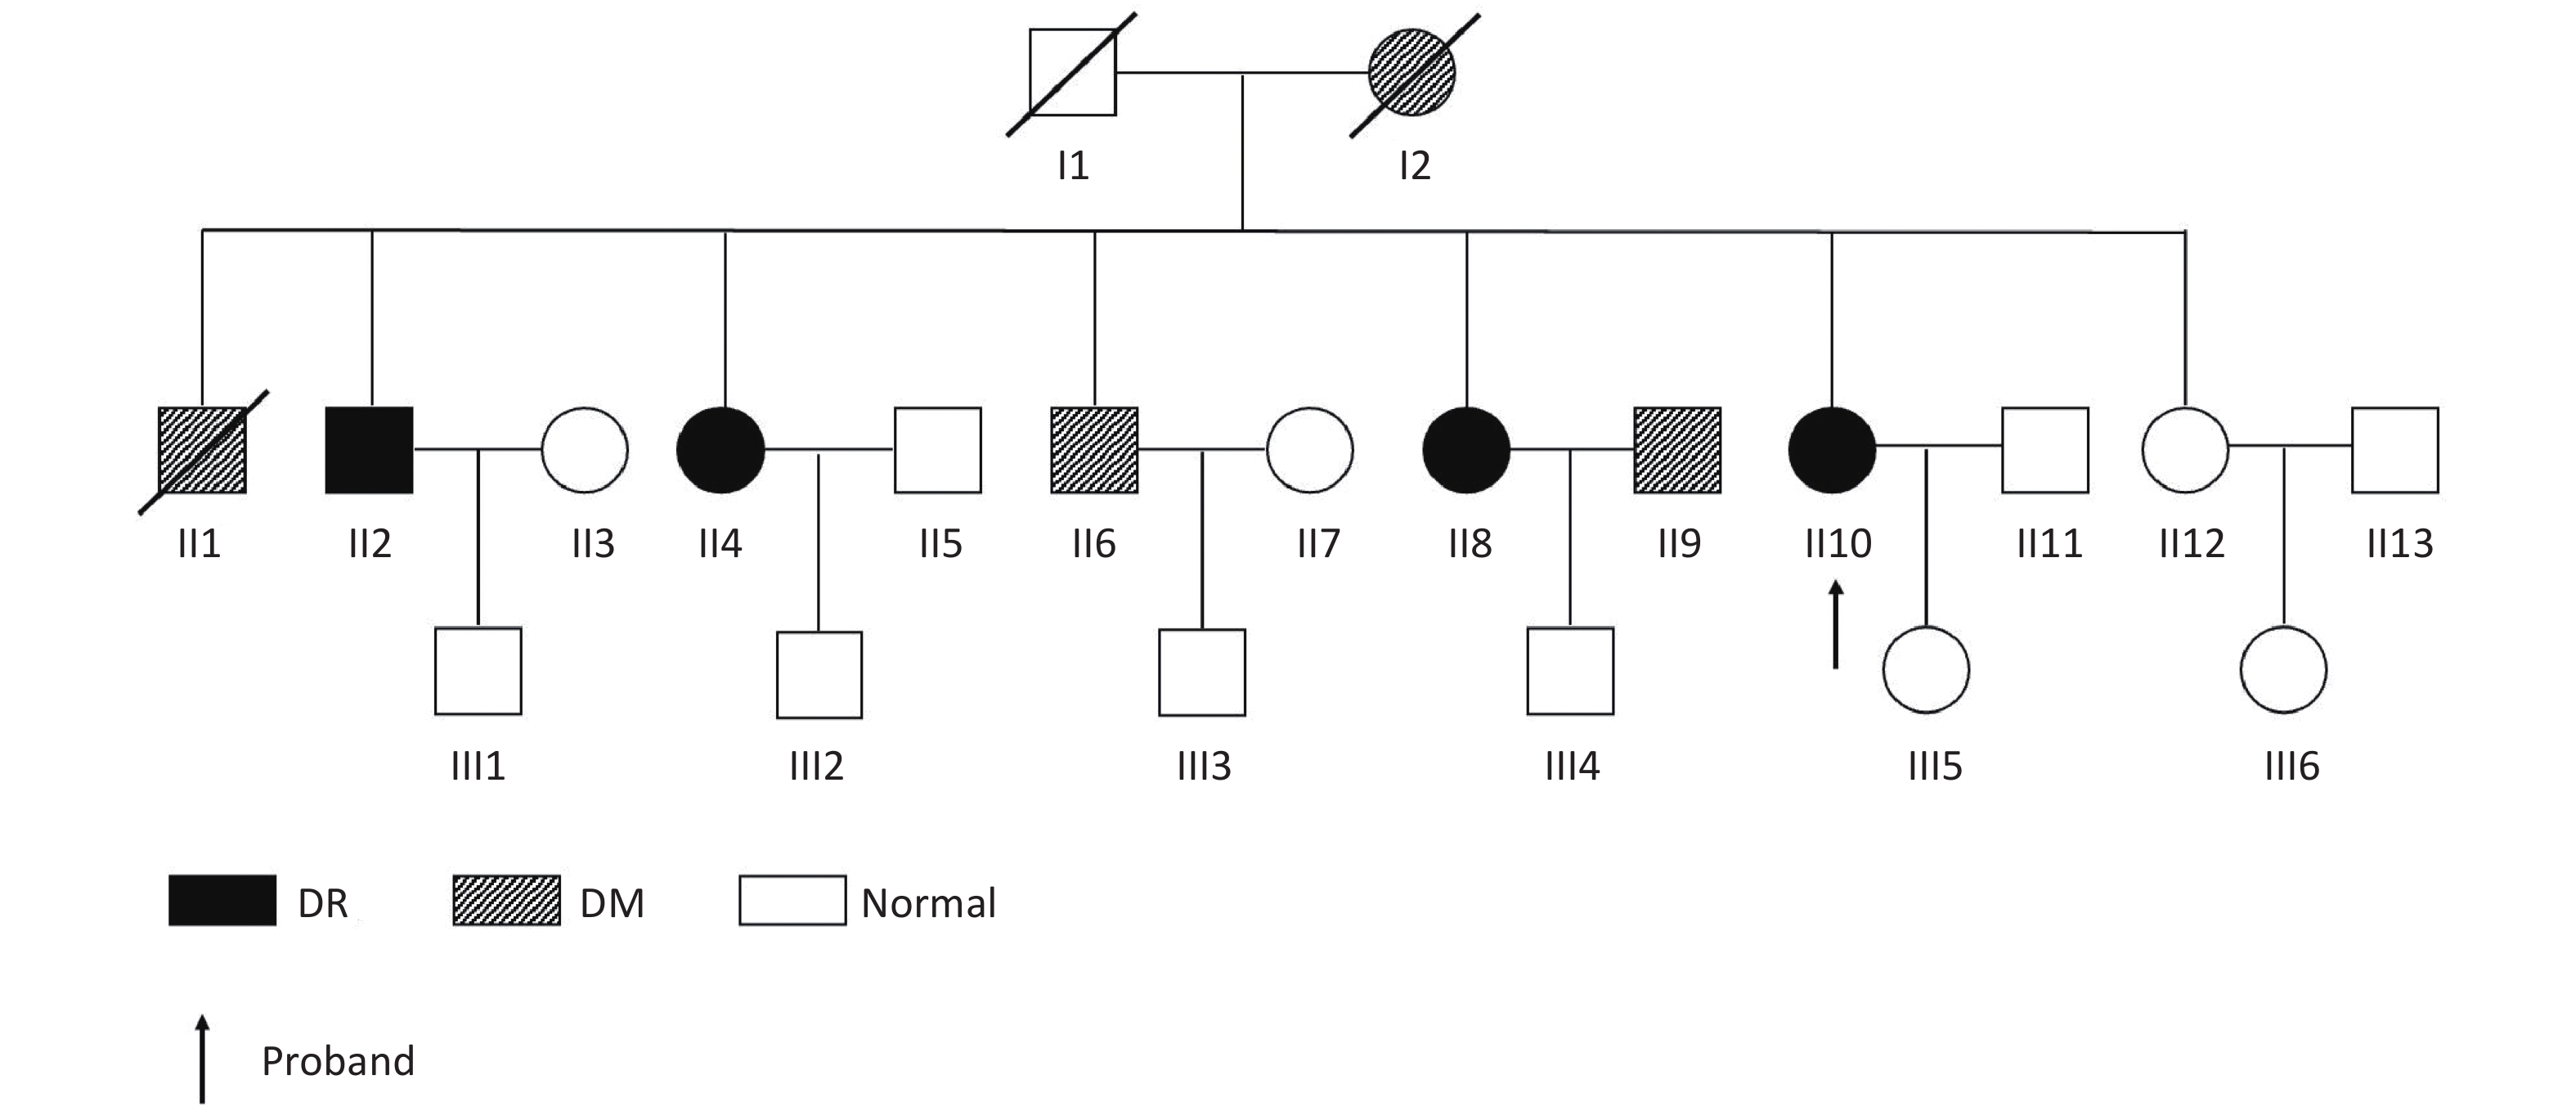
The DR family was selected based on the following criteria: (1) more than two generations with T2DM members, (2) three or more DR members, (3) inclusion of at least one diabetic-without retinopathy (DWR) patient who had T2DM for more than four years, (4) healthy members older than 45 years, and (5) the fundus photograph of all included family members should be graded. Sixty Chinese families with DR were recruited for the study. One family was selected for further analysis (Table 1). The family pedigree is shown in Figure 2. Patients with one non-T2DM, one DWR, and four DR of the second-generation DR pedigree were selected for whole exome sequencing (WES).
Table 1. Clinical features of the index patient and other family members
Family individual Age (years) Sex DM disease Age onset (years) DM duration (years) HbA1c (%) DR disease II2 64 Male DM 40 24 7.1 NPDR II4 61 Female DM 49 12 9.3 NPDR II6 60 Male DM 56 4 6.7 DWR II8 57 Female DM 41 16 7.8 NPDR II9 60 Male DM 44 16 6.1 DWR II10 54 Female DM 36 18 7.9 PDR II12 52 Female NDM — — 5.1 — II13 54 Male NDM — — 5.2 — III2 33 Male NDM — — 4.8 — III5 16 Female NDM — — 4.6 — Note. DM, diabetes mellitus; NDM, non-diabetes; HbA1c, glycosylated hemoglobin; DR, diabetic retinopathy; NPDR, non-proliferative diabetic retinopathy; DWR, diabetes without retinopathy; PDR, proliferative diabetic retinopathy. 
Figure 2. Pedigree of the family showing diabetes status of each member. Circles represent female participants and squares male participants. A slash through the symbol indicates that the family member is deceased. Black symbols indicate patients with diabetic retinopathy (DR). Dashed symbol represented individuals with diabetes mellitus (DM) but without DR.
The ML dataset was collected from the Desheng Diabetic Eye Study cohort. Based on the duration of diabetes and the grading of fundus photographs, patients from the cohort were assigned to the DWR group if they had more than 10 years of T2DM with no signs of DR (microaneurysms, hemorrhages, and exudates) or if they had more than 15 years of T2DM with fewer than five microaneurysms. Patients with five or more microaneurysms in at least one eye were assigned to the DR group. Patients who did not meet the DWR or DR criteria were excluded from the study. The duration of diabetes was defined as the interval between the first diagnosis of diabetes and the time of enrollment in the present study. One hundred ninety-eight patients with DWR and 222 patients with DR were randomly recruited.
-
Genomic DNA was isolated from the leukocytes using a TIANamp Blood DNA Kit (Tiangen Biotech, Beijing, China). DNA concentration was measured using a NanoDrop 2000 spectrophotometer (Thermo Scientific, Wilmington, DE, United States). All DNA samples passing initial quality checks at a concentration of ≥ 50 ng/μL were collected for further sequencing.
-
Genomic DNA from six selected individuals from the DR pedigree was subjected to WES using a commercial service provided by the Beijing Genomics Institute, Shenzhen, China.
Exonic DNA libraries were enriched by hybridizing genomic DNA samples with the NimbleGen 2.1 M-probe sequence capture array[15]. The libraries were sequenced on an Illumina HiSeq 2000 platform, generating 90-bp reads for each sample. Sequence reads were aligned to the human genome using the SOAP Aligner (v2.21) software. SOAPsnp software generated genotypes for each position in the target region. High confidence single nucleotide polymorphism (SNP) sites (quality ≥ 20 and depth ≥ 8X) were selected for further analysis.
-
SNP sites, coding DNA sequences, and indels were identified using SAMtools and BCF tools. Variants with a minor allele frequency (MAF) lower than 1% or absent in the East Asian population from gnomAD and EXAC databases were retained.
The Polyphen2 uses sequence- and structure-based predictive algorithms, and predicts if a change is damaging (> 0.85), possibly damaging (0.85–0.15) or benign (< 0.15). The SIFT tool mainly assesses a change being damaging (≥ 0.95) or tolerated (< 0.95), through analyzing the conserved sequence in different species. Variants identified by WES in the Chinese family with DR were validated by polymerase chain reaction (PCR) and Sanger sequencing using specific primers. Mutations detected in the DR family were subjected to co-segregation analysis to determine their causality.
-
Study participants in the dataset were genotyped for SNP sites using the Sequenom Mass ARRAY (Bioyong Technologies, Beijing, China). Quality control measures included MAF < 0.05, genotyping success < 80%, and failed Hardy-Weinberg equilibrium (HWE) test in control samples (P < 0.001, Pearson goodness-of-fit test).
-
Feature selection was performed using least absolute shrinkage and selection operator (LASSO) regression algorithms. The model training features included specific SNP loci and ten clinical variables: age at examination, biological sex (male or female), FPG, HbA1c, UMALB, insulin usage, oral glucose tolerance test (OGTT) results, therapeutic approach, monthly income, and educational level. Age was recorded on the day of the examination, and sex was recorded as assigned at birth. Insulin use and OGTT results were categorized into two groups (usage/no use and tested/not tested, respectively). The therapeutic approaches were classified into three groups: dietary control, exercise, and pharmacotherapy. Monthly income was divided into six brackets ranging from no income to more than 4,000 Chinese Yuan (CY). Educational level was divided into junior school or lower and high school or higher.
-
We utilized Python 3.9 and the SKLearn ML package for model development. The feature contributions were assessed using the Shapley Additive explanation (SHAP) approach. A linear support vector machine (SVM) served as the primary algorithm, partitioning the data into 70% training and 30% validation sets. We also examined additional machine learning algorithms, including random forest, logistic regression, K-nearest neighbor, decision tree, multilayer perceptron, linear discriminant analysis, multinomial naive Bayes, and AdaBoost. The model efficacy was measured using accuracy, sensitivity, specificity, area under the receiver operating characteristic curve (AUC), and kappa statistics.
-
Statistical analyses were performed using R (version 4.2.2) and R Studio (version 2023.06.1). The package used was EpiCalc (version 2.8.1.1, 2009). Chi-square test or Fisher’s exact test was used to compare categorical data between the two groups. Parametric variables were analyzed using t-tests. Nonparametric data were assessed using the Kruskal-Wallis rank-sum test. Binomial logistic regression was used for the multivariate analysis. The odds ratio (OR) and 95% confidence intervals (CI) were calculated. The statistical significance level was set at P < 0.05.
-
Within the DR pedigree comprising ten members, we identified seven SNP sites and mutations (rs116911833 in TRIM7, 1997T>C in LRBA, 1643T>C in PRMT10, rs117858678 in C9orf152, rs201922794 in CLDN25, rs146694895 in SH3GLB2, and rs201407189 in FANCC). These genetic variations were present in DR-afflicted individuals, but absent in DWR or non-T2DM subjects. The characteristics of these SNP sites and mutations, such as their location in the coding DNA sequence, SNP sites, allele frequencies, and predictive impact scores from SIFT and PolyPhen2, are detailed in Table 2.
Table 2. Multiple association analysis of genetic variants with diabetic retinopathy (DR) risk: functional prediction scores and odds ratios
Gene Position in CDS SNP Allele Frequency SIFTa PolyPhen2b Adjusted ORc (95% CI) P-value TRIM7 863 rs116911833 C/T 0.031 0.01 0.111 1.46x10⁶ (0, Inf) 0.18 LRBA 1997 — T/C — 0.05 0.989 3.34 (0.54, 20.82) 0.18 PRMT10 1643 — T/C — 0.01 0.999 1.21x10⁶ (0, Inf) 0.28 FANCC 973 rs201407189 G/A 0.01 0.35 0.956 0.78 (0.24, 2.57) 0.69 C9orf152 451 rs117858678 C/T 0.021 0.07 0.087 1.64 (0.66, 4.05) 0.29 CLDN25 379 rs201922794 A/T 0.01 0.4 0.297 1.11 (0.22, 5.64) 0.90 SH3GLB2 769 rs146694895 G/A 0.015 0.16 0.687 3.96 (1.02, 15.37) 0.03 Note. CDS, coding DNA sequence; SNP, single nucleotide polymorphism. aSIFT: prediction of a change being damaging (≥ 0.95) or tolerated (< 0.95). bPolyphen2: prediction of a change being damaging (> 0.85), possibly damaging (0.85–0.15) or benign (< 0.15). cOdds ratios from logistic regression models adjusted for age, fasting plasma glucose (FPG), glycated. hemoglobin (HbA1c), urinary microalbumin (UMALB), monthly income, oral glucose tolerance test (OGTT), therapeutic approaches, and insulin usage. The percentages of calorie sources (carbohydrate, fat, and protein) were analyzed using multiple logistic regression. After adjusting for multiple factors, including sex, ethnicity, use of insulin, glycosylated hemoglobin, hypertension, and exercise, dietary vitamin E [OR (95% CI): 0.97 (0.95, 1.00), P = 0.036] and selenium [OR (95% CI): 0.98 (0.96, 1.00), P = 0.017] intakes were inversely associated with the risk of DR (Table 2).
-
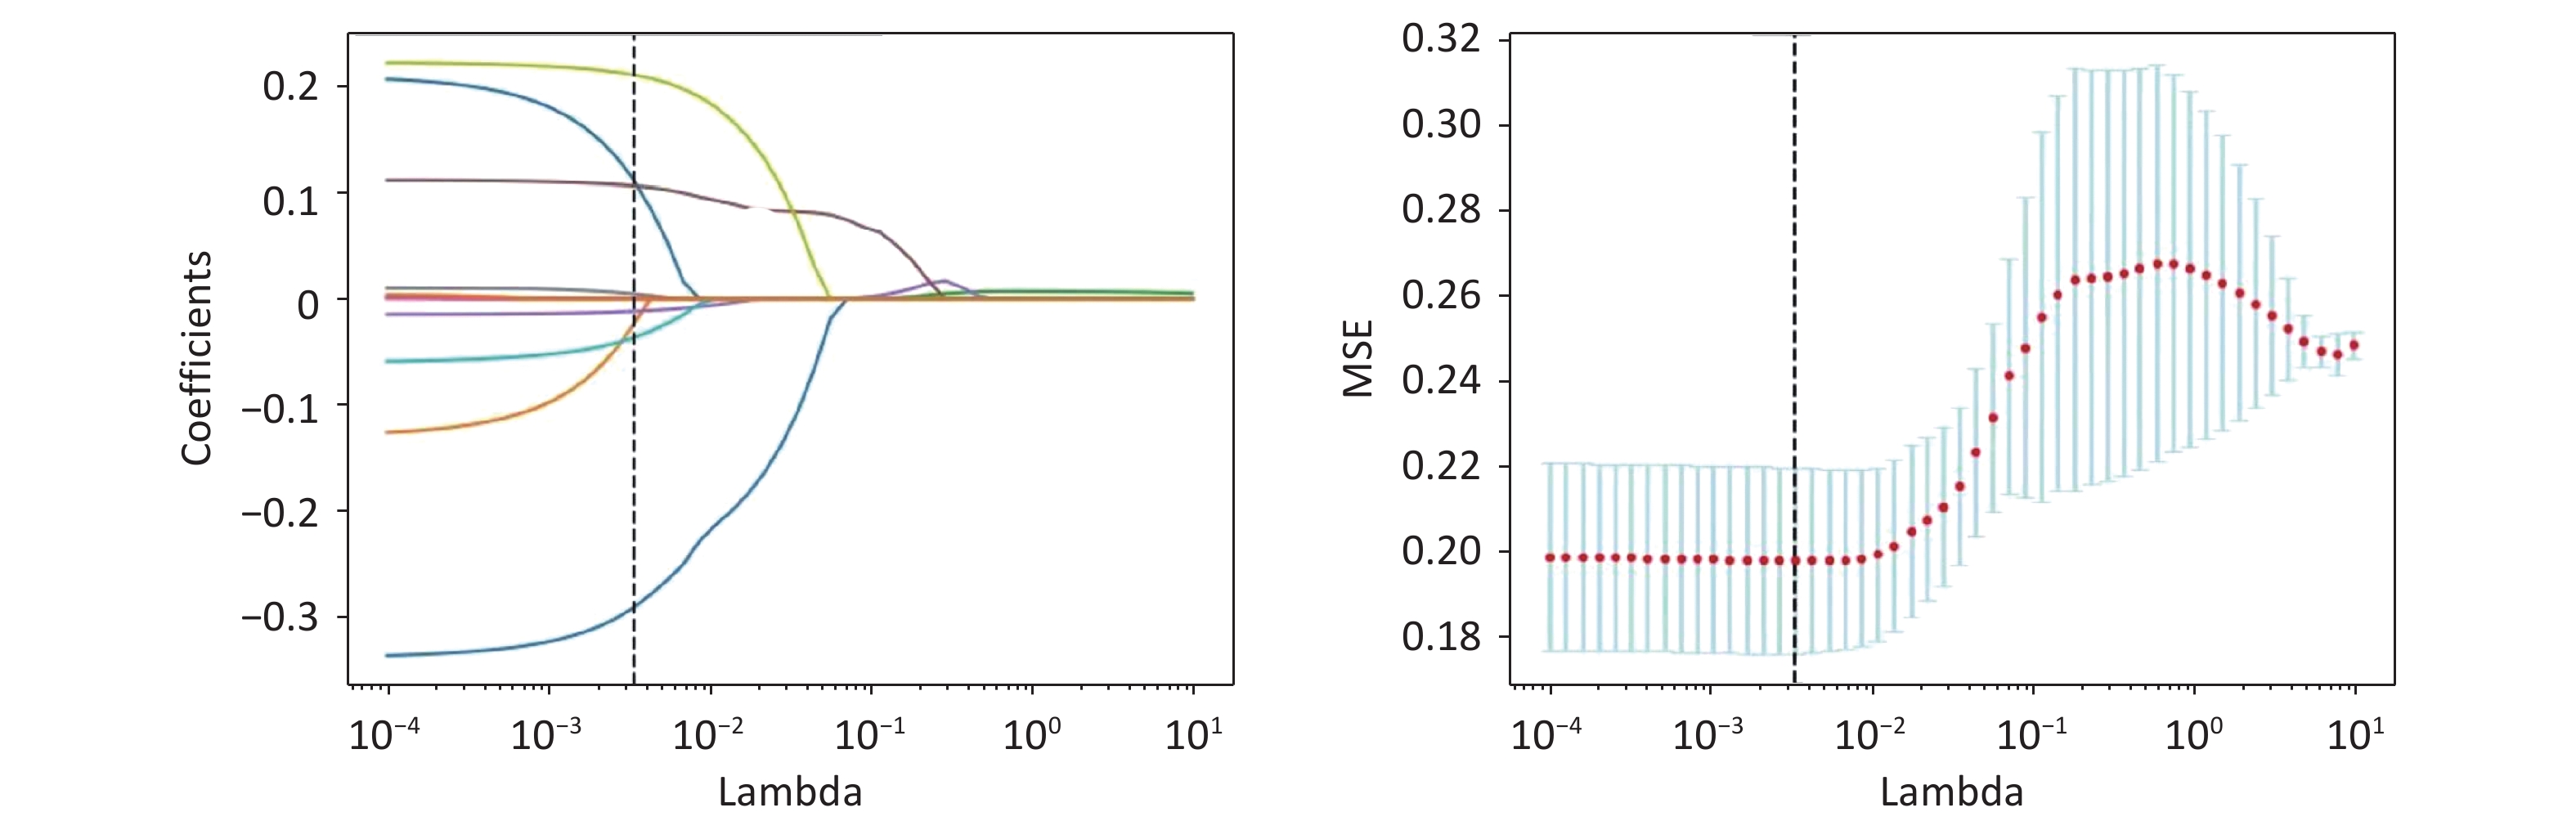
The demographic and clinical features selected for ML training in the T2DM cohort of 420 patients are shown in Table 3. These features, including age, FPG, HbA1c, UMALB, monthly income, insulin use, therapeutic interventions, and educational level, demonstrated statistically significant differences between the DR and non-DR groups (P < 0.05, T-test, Fisher’s exact test, and Kruskal-Wallis rank-sum test, respectively). Conversely, sex showed no significant difference (P = 0.65, chi-squared test). SNP rs146694895 exhibited significant variation (P = 0.02, Fisher’s exact test), whereas rs201407189 did not (P = 0.82, Fisher’s exact test). All features have all been selected through LASSO regularization, ensuring no collinearity issues are present among them; the lambda figures are shown in Figure 3.
Table 3. Demographic features of all the DM patients, including training and validation cohorts
Parameters DWR DR P- Valuea n = 198 n = 222 Age (year) 68.21 ± 7.17 65.66 ± 7.90 < 0.001b Biological sex, n (%) Male 83 (41.90) 94 (42.30) 0.65c FPG (mmol/L) 7.99 ± 2.30 9.17 ± 3.36 < 0.001b HbA1c (%) 6.70 ± 1.37 7.80 ± 1.71 < 0.001b UMALB (mmol/L) 3.50 (1.77, 9.05) 7.34 (3.0, 26.20) < 0.001d Monthly income, n (%) 0.03 No income 4 (2.02) 3 (1.35) Basic living allowance 2 (1.01) 3 (1.35) < 2,000 CY 48 (24.24) 73 (32.88) 2,000–3,000 CY 81 (40.91) 104 (46.85) 3,000–4,000 CY 40 (20.20) 24 (10.81) > 4,000 CY 23 (11.62) 15 (6.760) Insulin usage, n (%) 55 (27.80) 150 (67.60) < 0.001 Therapeutic approaches, n (%) < 0.001 Dietary control 131 (66.20) 83 (37.40) Exercise 12 (6.10) 52 (23.40) Pharmacotherapy 55 (27.80) 87 (39.20) OGTT test conducted, n (%) 122 (61.61) 105 (47.30) 0.004 High school or higher, n (%) 126 (63.60) 114 (51.40) 0.01 rs146694895 0.02 GA 3 (1.52) 15 (6.76) GG 195 (98.48) 207 (93.24) rs201407189 0.82 AG 8 (4.04) 7 (3.15) GG 190 (95.96) 215 (96.85) Note. DWR, diabetic-without retinopathy; DR, diabetic retinopathy; FPG, fasting plasma glucose, HbA1c, glycosylated hemoglobin; UMALB, urine microalbumin; CY, Chinese Yuan. aFisher’s exact test. bT-test. cChi-square test. dKruskal-Wallis rank-sum test. 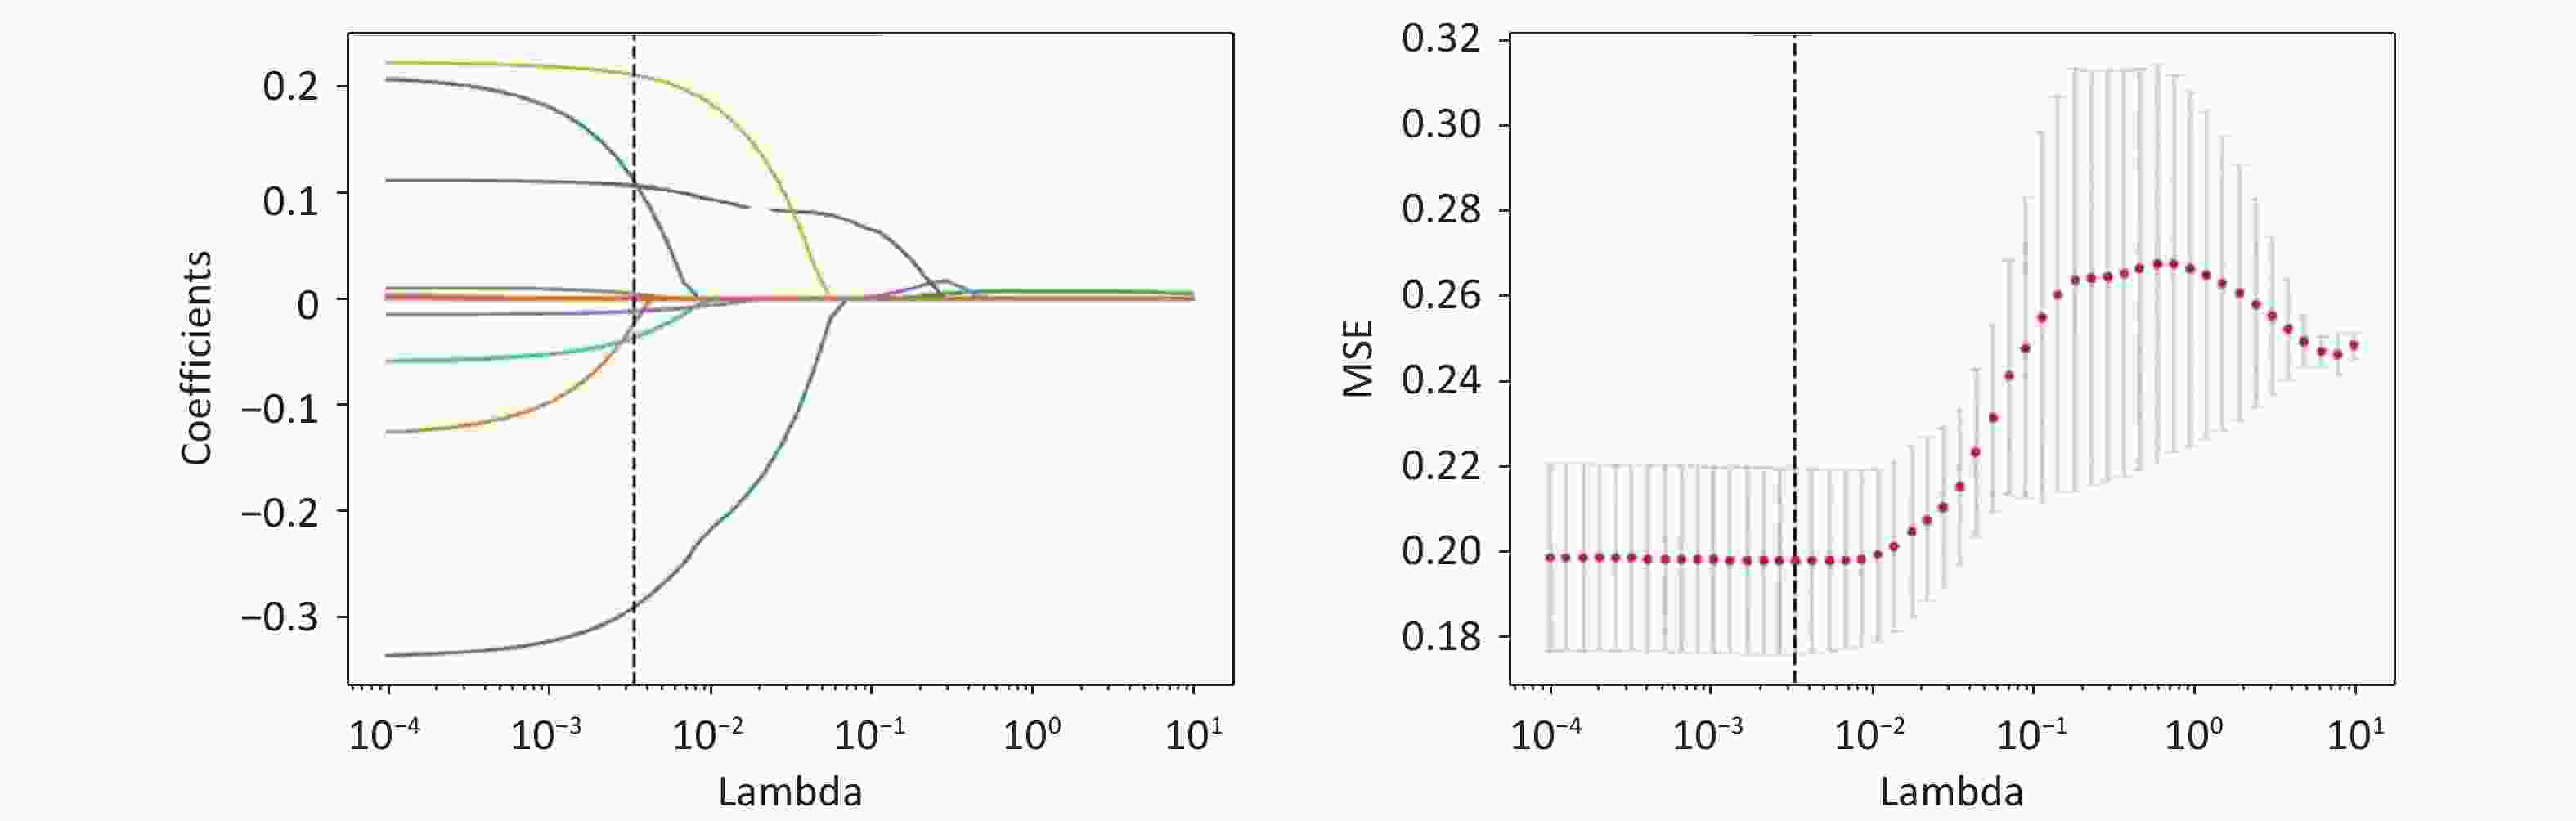
Figure 3. The lambda figures (coefficients and MSE) of Lasso features selection procedures.
-
During the evaluation of different ML algorithms, the SVM algorithm outperformed the others, achieving the highest accuracy, sensitivity, specificity, AUC, and kappa values for the test set (80.2%, 83.3%, 76.7%, 80.0%, and 60.1%, respectively), as presented in Table 4.
Table 4. Comparative performance of various algorithms in machine learning model
Algorithms Accuracy Sensitivity Specificity AUC Kappa value Random forest 73.0% 80.3% 65.0% 72.7% 45.6% Logistic Regression 77.8% 81.8% 73.3% 77.6% 55.3% K-nearest neighbor 65.1% 66.7% 63.3% 65.0% 30.0% Linear discriminant analysis 77.8% 81.8% 73.3% 77.6% 55.3% Multinomial Naive Bayes 57.9% 24.2% 95.0% 59.6% 18.6% Decision Tree 52.4% 56.1% 48.3% 52.2% 0.04% AdaBoost 66.7% 69.7% 63.3% 66.5% 33.1% Multi-layer perceptron 75.4% 81.8% 68.3% 75.1% 50.4% XGBoost 57.9% 59.1% 56.7% 57.9% 15.7% SVM 80.2% 83.3% 76.7% 80.0% 60.1% Note. SVM, Support vector machine; AUC, area under the receiver operating characteristic curve. -
The rs146694895 and rs201407189 were observed enhanced the performance of ML models for DR prediction (Table 5). Other identified SNP sites and mutations did not contribute significantly to predictive accuracy and were thus excluded from the feature set.
Table 5. Performance metrics of the support vector machine model with or without SH3GLB2 and FANCC variables
Features Accuracy Sensitivity Specificity AUC Kappa value Without SH3GLB2 79.4% 80.3% 78.3% 79.3% 58.6% Without FANCC 79.4% 83.3% 75.0% 79.2% 58.5% Without SH3GLB2 and FANCC 77.8% 80.3% 75.0% 77.7% 55.4% With SH3GLB2 and FANCC 80.2% 83.3% 76.7% 80.0% 60.1% Note. AUC, area under the receiver operating characteristic curve. -
The final model for predicting DR incorporated both demographic data and selected SNP sites (rs146694895 and rs201407189). The contribution of each parameter as quantified by the SHAP values is shown in Figure 4.
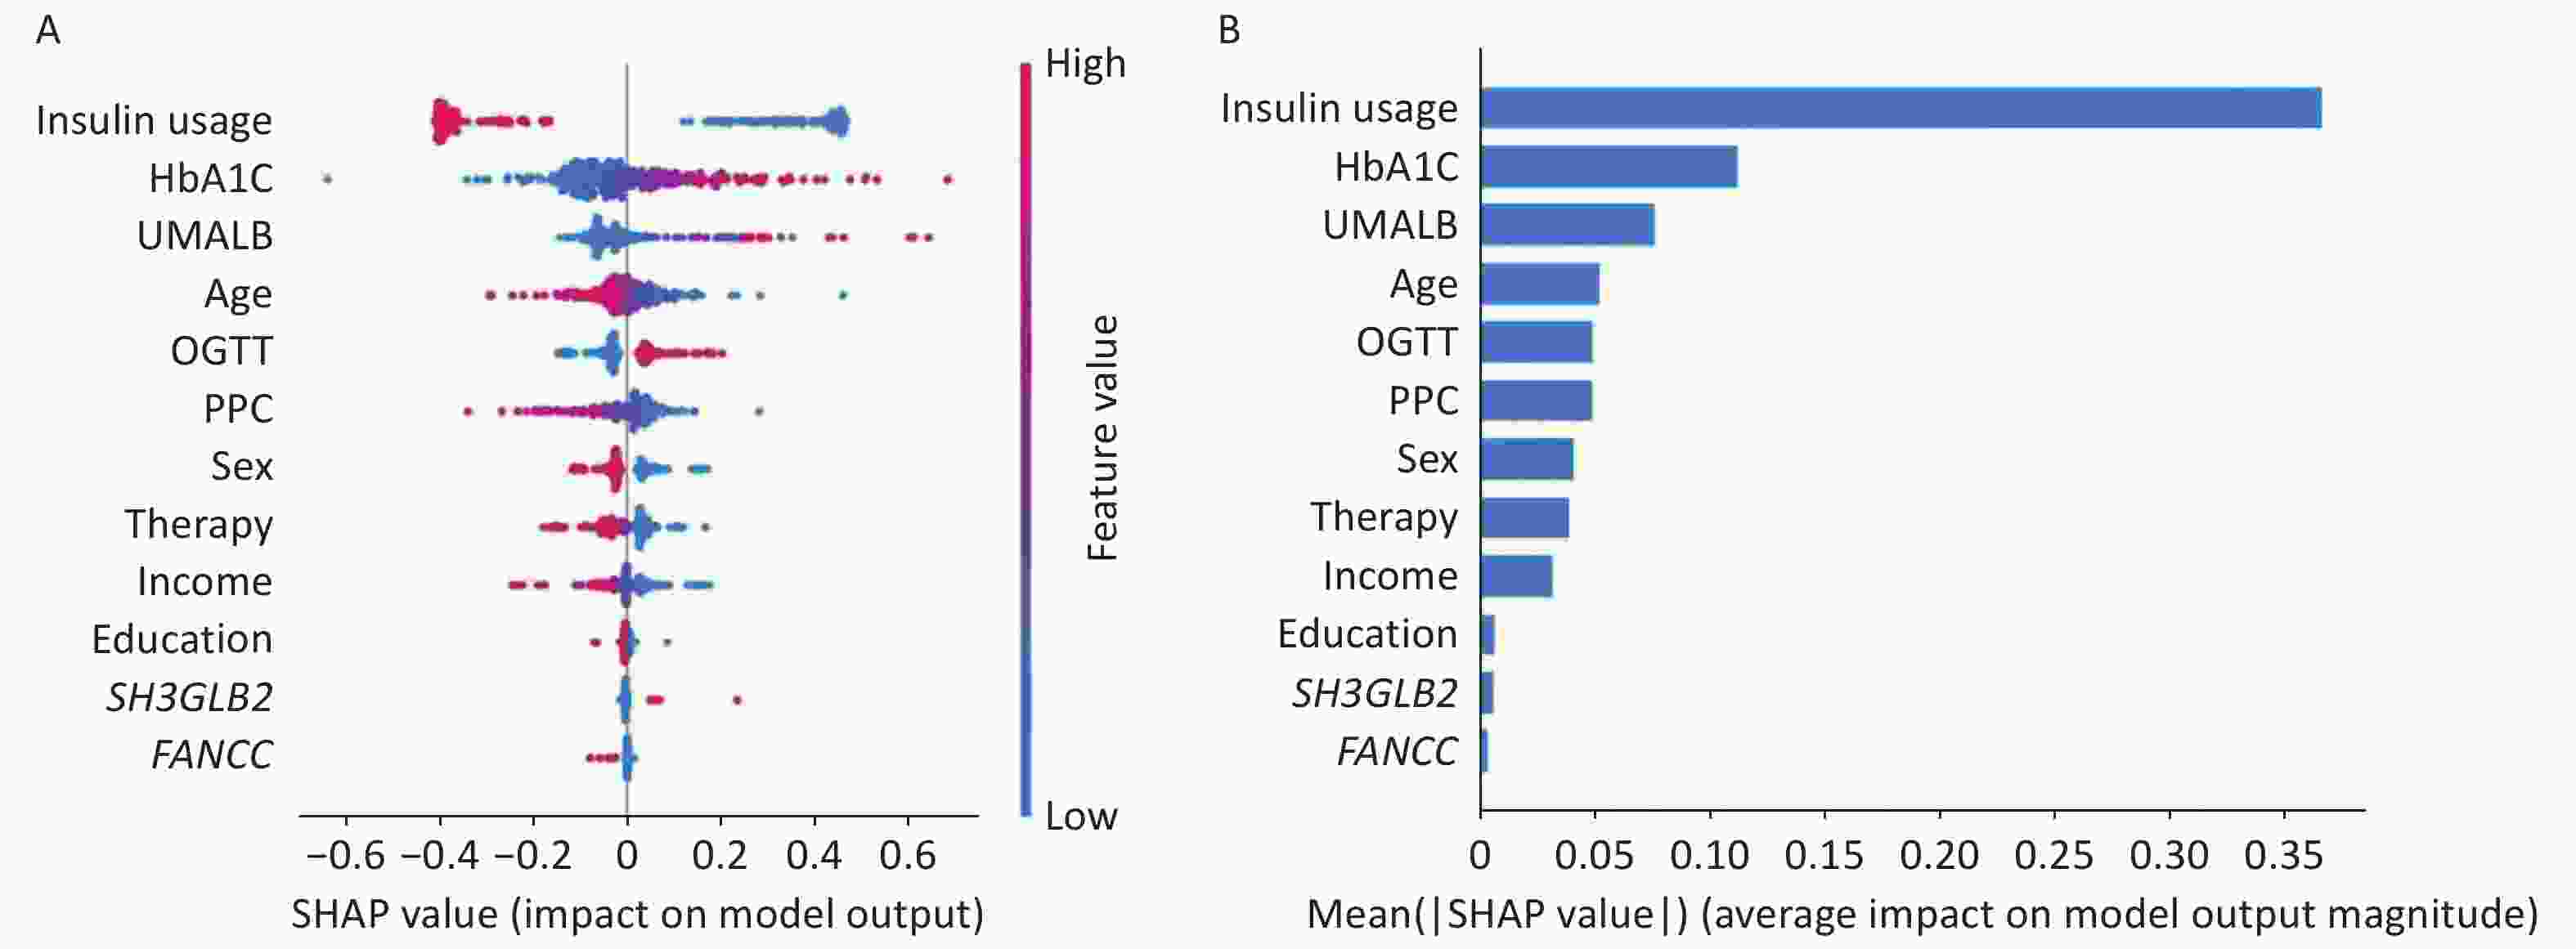
Figure 4. SHAP analysis illustrating the importance of each feature in the proposed model. A: Variable importance plot displaying the impact of various predictors on the model’s output. B: Bar chart showing the mean decrease in the magnitude of each variable’s importance. HbA1c, glycosylated hemoglobin; UMALB, urine microalbumin; OGTT, oral glucose tolerance test; FPG, fasting plasma glucose; therapy, therapeutic approaches.
-
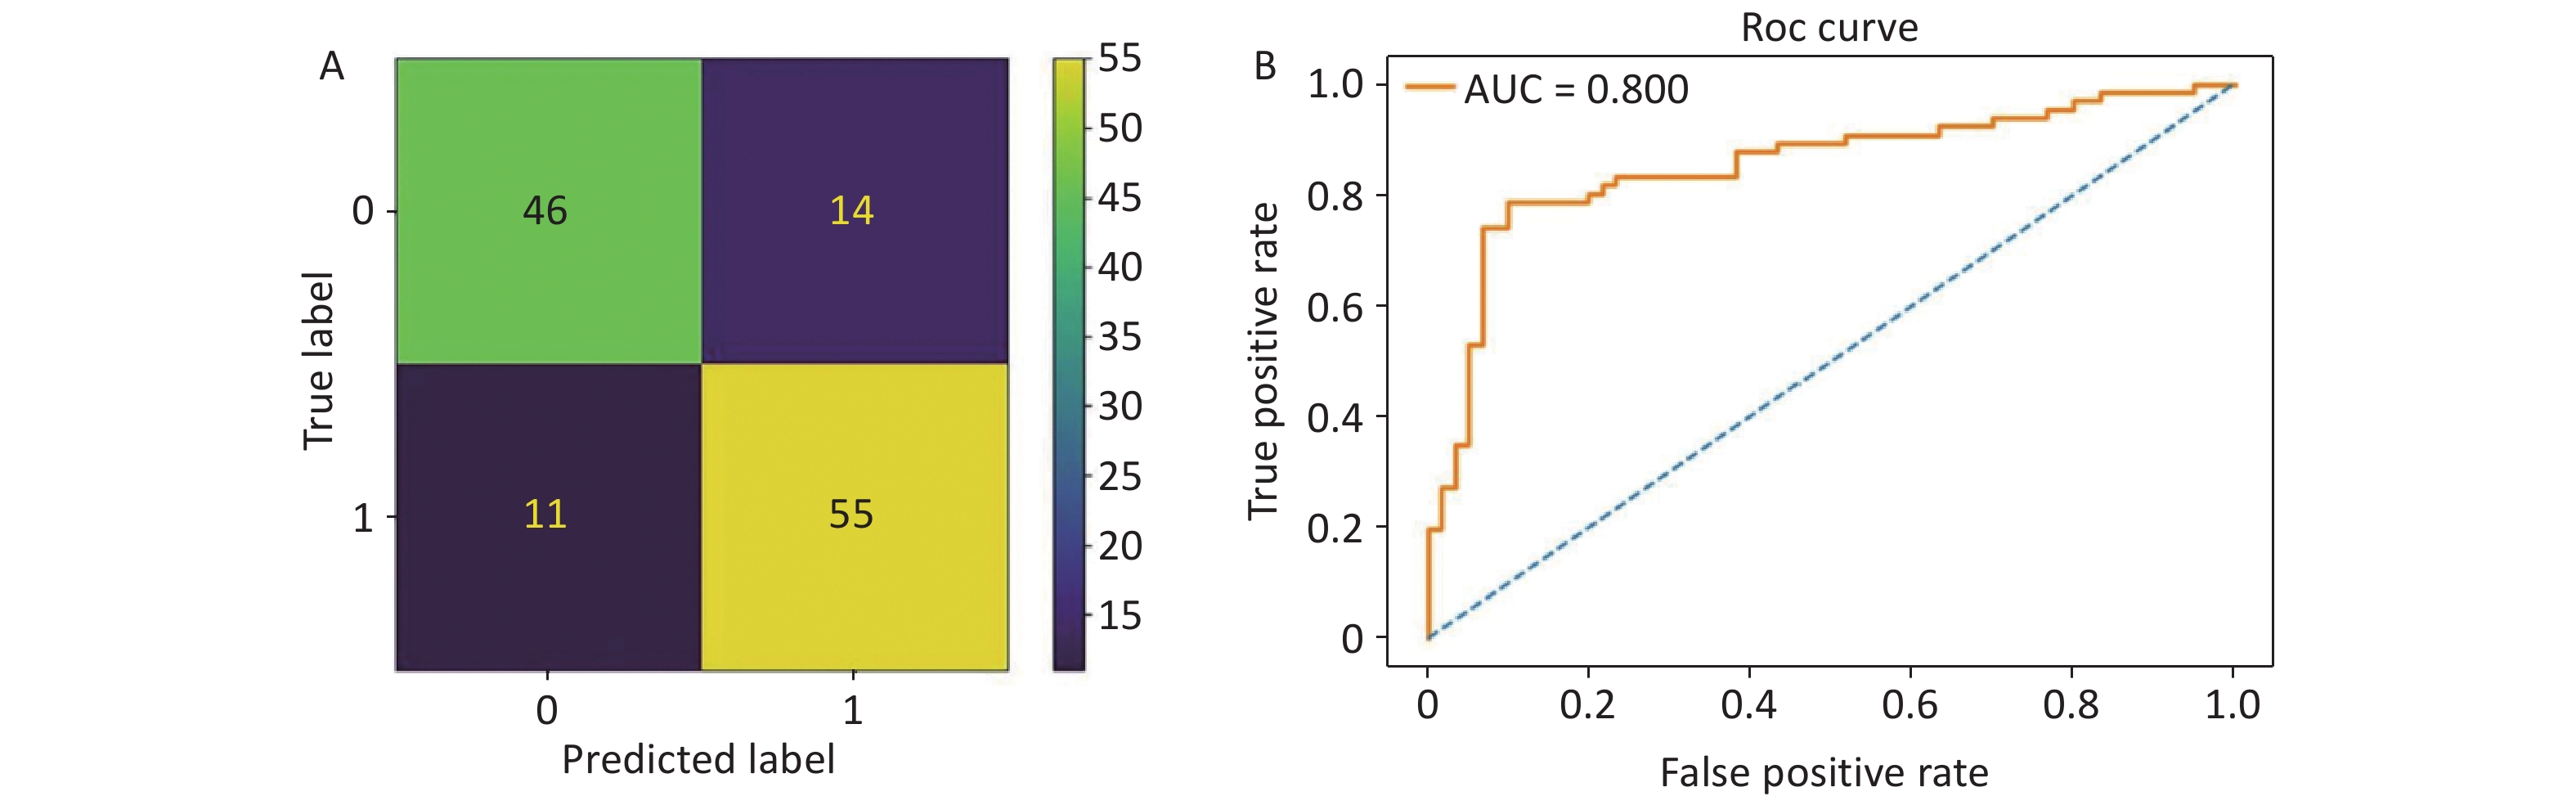
The performance of the SVM model is depicted through a confusion matrix and receiver operating characteristic curve in Figures 5. To facilitate the practical application of this model, we developed a web-based application for DR prediction that is accessible on DR Prediction Model Web Server. This tool allows users to input 12 features into designated fields and receive DR predictions (Figure 6).
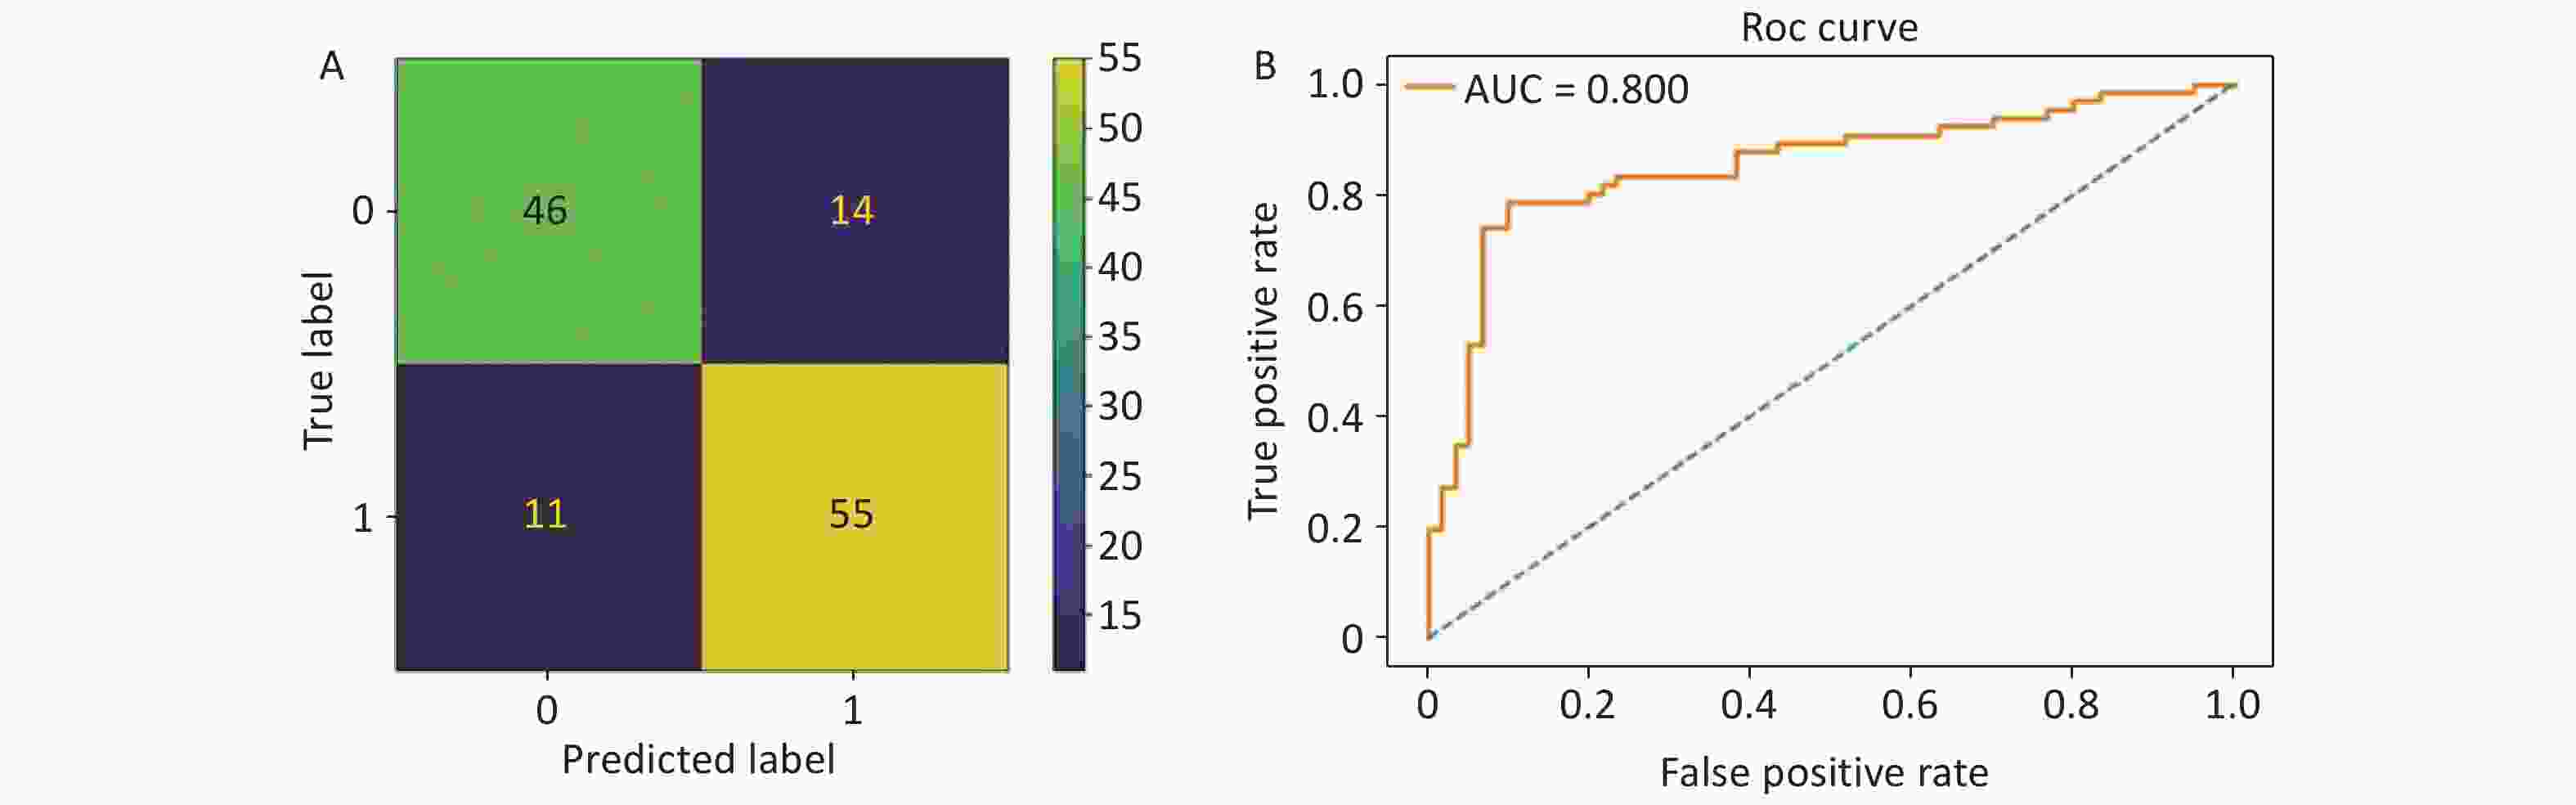
Figure 5. (A) Confusion matrix of the optimal model. “0” indicates diabetes without retinopathy (DWR), and “1” refers to diabetic retinopathy (DR). (B) The receiver operating characteristic curve of the proposed model. The area under the receiver operating characteristic (ROC) curve was 80.0%.
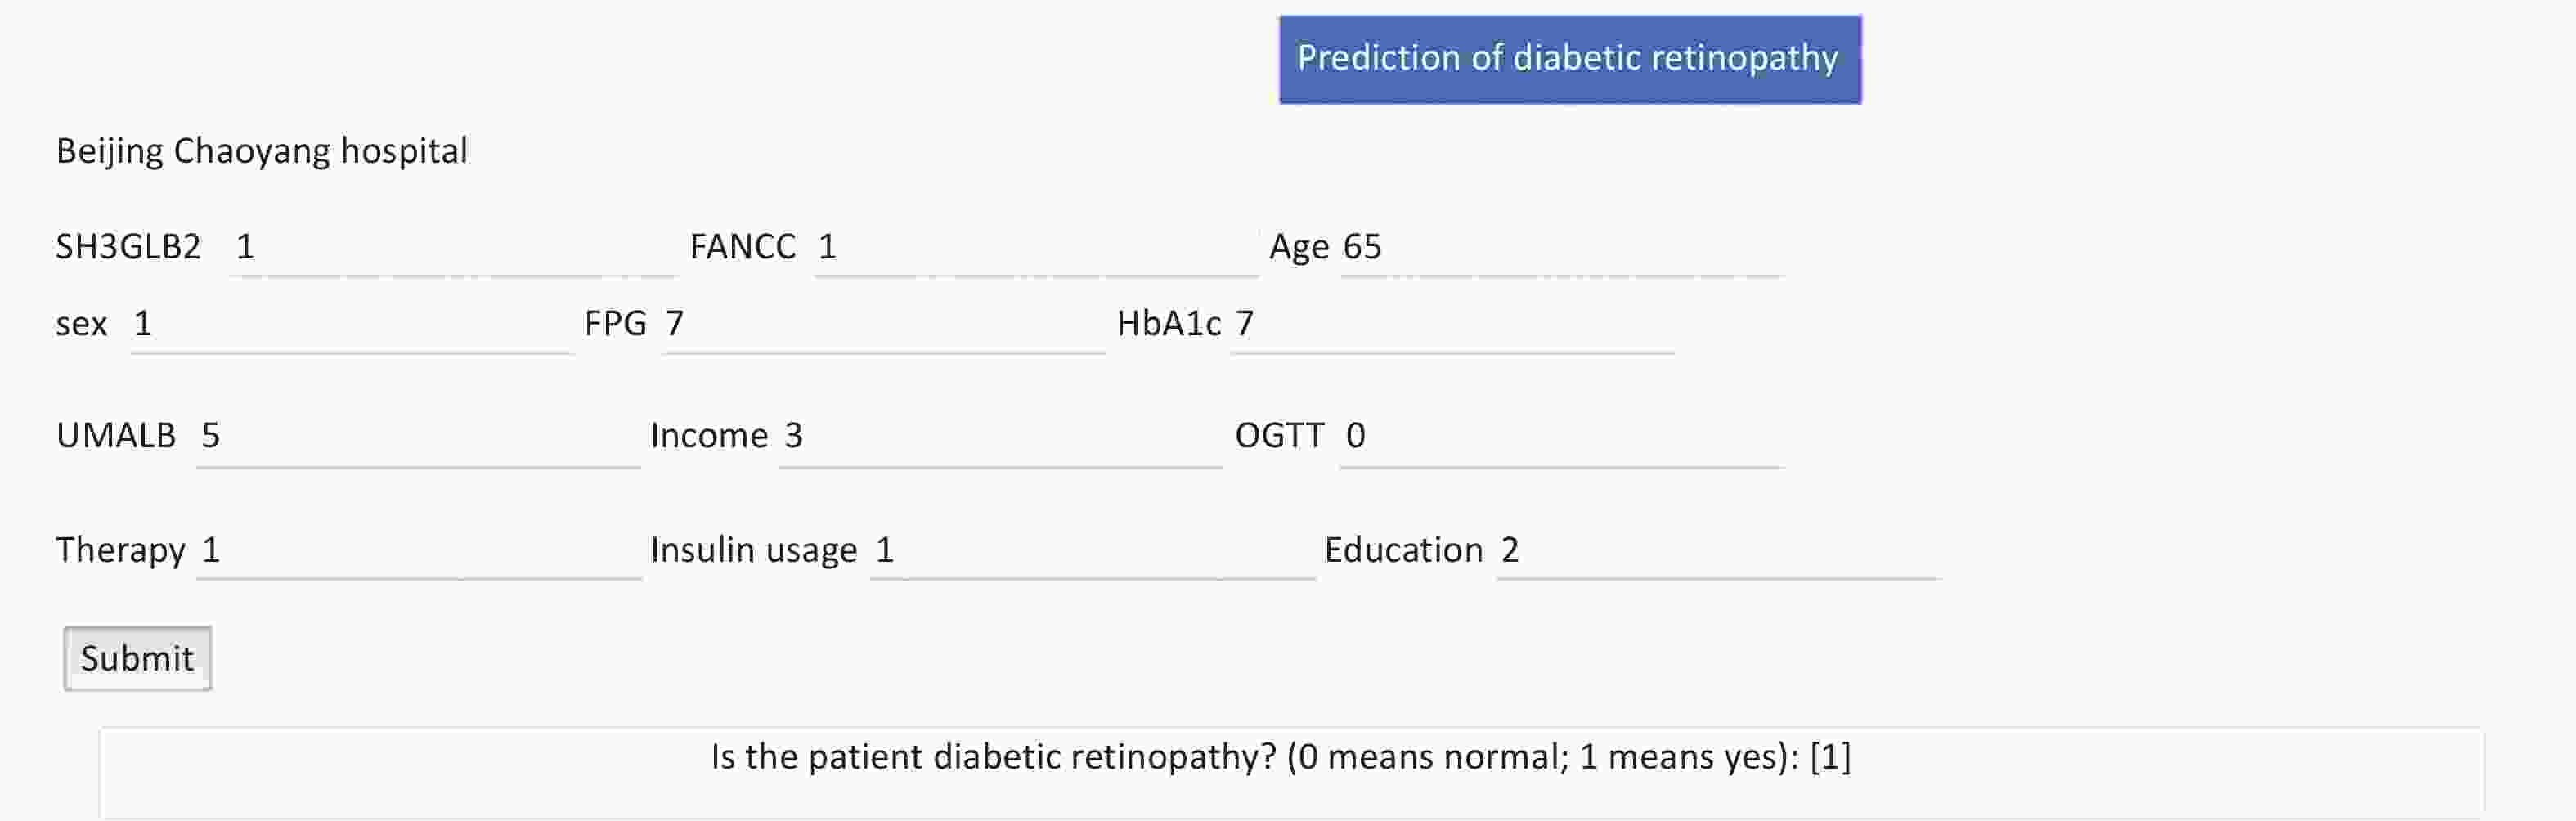
Figure 6. Public internet calculator for diabetic retinopathy (DR) risk assessment using 12 features. The DR prediction model can be accessed via the public web server at DR Prediction Model, which utilizes 12 distinct features for risk calculation. Users can input 12 features to predict DR risk. The interface provides text boxes for the following variables: SH3GLB2 (SH3GLB2 rs146694895: GG = 0 and GA = 1), FANCC (FANCC rs201407189: GG = 0 and AG = 1), age (continuous variable), sex (biological sex: male = 1, female = 2), FPG (fasting plasma glucose [mmol/L], continuous variable), HbA1c (glycosylated hemoglobin [%], continuous variable), UMALB (microalbuminuria [mg/L], continuous variable), monthly income (no income = 1, basic living allowance = 2, < 2,000 Chinese Yuan [CY] = 3, 2,000–3,000 CY = 4, 3,000–4,000 CY = 5, and > 4,000 CY = 6), OGTT (oral glucose tolerance test: tested = 1 and not tested = 2), therapy (therapeutic approach: dietary control = 1, exercise = 2, and drug therapy = 3), insulin usage (with usage = 1 and without usage = 2), education (educational level: junior school or lower = 0, high school or above = 1). Upon submission, the model computes the results, and the resulting probability indicates the DR status of the subject.
-
In the present study, we identified seven novel SNP sites in seven genes associated with DR, using a DR pedigree. Subsequently, an ML model for predicting DR, including both demographic and genetic factors, was established and tested. The inclusion of rs146694895 in SH3GLB2 and rs201407189 in FANCC improved model performance.
The identified 7 SNP sites and mutations have not been reported previously. Multiple candidate genes have been proposed to be associated with the development of DR[9-11]. However, previous studies involving linkage analyses, candidate gene studies, and underpowered genome-wide association studies have found limited or inconsistent genetic signals that cannot be replicated across multiple cohorts[16-18]. The heritability of DR attributed solely to common genetic variants is estimated to be 7%, based on studies involving distantly related individuals[10]. However, heritability estimates from specific family studies ranged from 18% to 52%[19,20]. Thus, identifying DR-associated genes in the DR pedigree is more efficient. Therefore, we first attempted to identify DR-associated genes in a DR pedigree using WES.
To date, only a few studies have reported on the utilization of machine learning analysis for assessing DR risks[7,8]. Moreover, these studies incorporated only the common risk factors associated with DR into their models. This study aimed to develop a robust DR risk prediction model by integrating genetic factors from the DR pedigree with demographic data.
SH3GLB2 rs146694895 and FANCC rs201407189 were identified as significant contributors to the model efficiency. These two genes were first reported to be associated with DR. Both SH3GLB2 and FANCC are expressed in the retina[21,22]. Previous studies have shown that SH3GLB2 and SH3GLB1 play crucial roles in mitochondrial autophagy[21]. Disruption of these genes can lead to weaker degradation of damaged mitochondrial membranes[23]. In diabetes, problems with mitochondria can lead to the overproduction of harmful substances such as superoxide, which can trigger unhealthy cellular reactions, contributing to oxidative stress, a known factor in DR development[24]. Furthermore, SH3GLB1 has been implicated in lipid metabolism in the adipose tissue and insulin resistance[25]. Because SH3GLB2 can interact with SH3GLB1 and share significant sequences and similar structures, they may have a similar function. However, direct evidence linking SH3GLB2 with DR is lacking.
Mutations in FANCA and FANCC have been identified in more than 70% of patients with Fanconi anemia patients worldwide[26]. Approximately half of patients with Fanconi anemia present with abnormalities in glucose metabolism[22], and FANCC knockout mice display a higher propensity towards developing diabetes mellitus[27]. Both patients with Fanconi anemia and knockout mouse models show increased levels of reactive oxygen species[28,29]. This surge contributed to oxidative stress and triggered endothelial cell death. Endothelial dysfunction or cell death can cause vascular barrier disruption, vasoconstriction, diastolic dysfunction, vascular smooth muscle cell proliferation, migration, inflammatory responses, and thrombosis. Each outcome is closely associated with DR[30].
In this study, the LASSO shrinkage and selection operator regression algorithm was used for feature selection. It has been proven to automatically select significant features that are relevant to the target variable, while setting the coefficients of irrelevant or redundant features to zero[31]. Oh et al.[7] embarked on a pioneering exploration of the potential of machine learning in the development of a risk prediction model for DR. This study demonstrated that the LASSO algorithm outperformed conventional indicators, delivering superior AUC values and accuracy rates. Using a similar sample size, our study achieved an improvement (5%) in accuracy. This may be attributed to the incorporation of both genetic factors and different ML algorithms.
Compared with prior studies, our research employed nine machine learning algorithms, facilitating flexibility in exploring diverse perspectives and techniques in model construction. Commonly used machine learning algorithms include the k-nearest neighbor, support vector machine, decision tree, random forest, linear discriminate analysis, AdaBoost, XGBoost, and CATBoost[32]. Our study adopted all these algorithms and found that the SVM demonstrated the highest effectiveness, with superior AUC and accuracy scores. Hemoglobin A1c, duration of diabetes, cholesterol, and blood pressure only accounted for 10%–11% of the DR risk[33,34]. Li et al.[8] conducted an exhaustive analysis of the electronic medical records of a large cohort of 32,452 T2DM inpatients. Logistic regression, random forest, SVM, and XGBoost were adopted. The XGBoost algorithm exhibits the highest AUC for the validation set. This model relied on hospital data, which may introduce bias and limit its generalizability.
We also found that insulin usage, HbA1c, UMALB, age, FPG, OGTT, sex, therapeutic approach, monthly income, and educational level also influenced DR conditions. Previous studies have demonstrated that HbA1c, duration of diabetes, cholesterol, and blood pressure account for 10% to 11% of DR risk[33,34]. The heritability of DR attributed solely to common genetic variants is estimated to be 7%, based on studies involving distantly related individuals[10]. According to previous studies, the contribution of demographic data to DR risk is higher than that of heritability, which is consistent with our findings. We noticed that the contribution of SNP factors was less than that reported previously. The reason for this might be that DR is a multifactorial disease influenced by many genes, but we only included two SNP sites. Therefore, additional DR-associated genes should be included in prediction models.
The present study has some limitations. First, although our study marks an important step forward in the field, we acknowledge that the limited sample size used for model construction poses constraints on the overall accuracy of the model. Second, although we found that genetic factors identified in the DR pedigree played a crucial role in the performance of the ML model, the collection of adequate pedigree can pose a challenge due to the relatively advanced age at the onset of T2DM. Furthermore, although whole exome sequencing is a powerful tool, it is not as comprehensive as whole-genome sequencing for detecting a wide range of intronic sites in genes. This could potentially overlook some factors influencing gene function. Additionally, the absence of pathway validation for the relevant SNP sites constrains our capacity to substantiate the impact of these SNP sites on DR. Finally, the restricted sample size for model construction limits the model accuracy.
In conclusion, this study represents a crucial advancement in DR risk prediction modeling through the integration of multiple machine learning algorithms and comprehensive evaluation metrics. SNPs of SH3GLB2 and FANCC screened from the DR pedigree were instrumental in enhancing the performance of the DR prediction model, thus proving the effectiveness and accuracy of this screening method. Our study is the first to determine the importance of genetic factors in the DR risk prediction model. Further enrollment of other DR-associated genetic sites in the prediction model is required.
doi: 10.3967/bes2025.002
Predicting Diabetic Retinopathy Using a Machine Learning Approach Informed by Whole-Exome Sequencing Studies
-
Abstract:
Objective To establish and validate a novel diabetic retinopathy (DR) risk-prediction model using a whole-exome sequencing (WES)-based machine learning (ML) method. Methods WES was performed to identify potential single nucleotide polymorphism (SNP) or mutation sites in a DR pedigree comprising 10 members. A prediction model was established and validated in a cohort of 420 type 2 diabetic patients based on both genetic and demographic features. The contribution of each feature was assessed using Shapley Additive explanation analysis. The efficacies of the models with and without SNP were compared. Results WES revealed that seven SNPs/mutations (rs116911833 in TRIM7, 1997T>C in LRBA, 1643T>C in PRMT10, rs117858678 in C9orf152, rs201922794 in CLDN25, rs146694895 in SH3GLB2, and rs201407189 in FANCC) were associated with DR. Notably, the model including rs146694895 and rs201407189 achieved better performance in predicting DR (accuracy: 80.2%; sensitivity: 83.3%; specificity: 76.7%; area under the receiver operating characteristic curve [AUC]: 80.0%) than the model without these SNPs (accuracy: 79.4%; sensitivity: 80.3%; specificity: 78.3%; AUC: 79.3%). Conclusion Novel SNP sites associated with DR were identified in the DR pedigree. Inclusion of rs146694895 and rs201407189 significantly enhanced the performance of the ML-based DR prediction model. -
Key words:
- Machine learning /
- Diabetic retinopathy /
- Whole exome sequencing /
- Type 2 diabetes mellitus
All authors report no financial disclosures or conflicts of interests.
All procedures were performed in accordance with the guidelines of the Declaration of Helsinki. The Institutional Review Board and Ethics Committees of Beijing Chao-Yang Hospital (2023-k-245) and Beijing Tongren Hospital (2013-k-225) approved the study protocols. All patients were fully informed of the purpose and procedures of the study, and written consent was obtained from each patient.
注释:1) Authors’ Contributions: 2) Competing Interests: 3) Ethics: -
Figure 1. Overview of the study design. The probands in the diabetic retinopathy (DR) pedigree and the type 2 diabetes mellitus (T2DM) cohort were derived from the Desheng Diabetic Eye Study. We collected clinical data through questionnaires and obtained venous blood samples from all participants. Genomic DNA was extracted from leukocytes. We identified seven single nucleotide polymorphisms (SNPs) and mutations associated with DR in the pedigree using whole-exome sequencing (WES). The dataset’s participants were genotyped for these SNPs employing Sequenom MassARRAY technology (Bioyong Technologies, Beijing, China). For the T2DM cohort, 70% of the data was allocated for training and 30% for validation. We assessed various machine learning algorithms, including the linear support vector machine (SVM), random forest, logistic regression, K-nearest neighbor, decision tree, multi-layer perceptron, linear discriminant analysis, multinomial naive Bayes, and AdaBoost. Model efficacy was evaluated by accuracy, sensitivity, specificity, the area under the receiver operating characteristic curve (AUC), and the kappa statistic.
Figure 2. Pedigree of the family showing diabetes status of each member. Circles represent female participants and squares male participants. A slash through the symbol indicates that the family member is deceased. Black symbols indicate patients with diabetic retinopathy (DR). Dashed symbol represented individuals with diabetes mellitus (DM) but without DR.
Figure 3. The lambda figures (coefficients and MSE) of Lasso features selection procedures.
Figure 4. SHAP analysis illustrating the importance of each feature in the proposed model. A: Variable importance plot displaying the impact of various predictors on the model’s output. B: Bar chart showing the mean decrease in the magnitude of each variable’s importance. HbA1c, glycosylated hemoglobin; UMALB, urine microalbumin; OGTT, oral glucose tolerance test; FPG, fasting plasma glucose; therapy, therapeutic approaches.
Figure 5. (A) Confusion matrix of the optimal model. “0” indicates diabetes without retinopathy (DWR), and “1” refers to diabetic retinopathy (DR). (B) The receiver operating characteristic curve of the proposed model. The area under the receiver operating characteristic (ROC) curve was 80.0%.
Figure 6. Public internet calculator for diabetic retinopathy (DR) risk assessment using 12 features. The DR prediction model can be accessed via the public web server at DR Prediction Model, which utilizes 12 distinct features for risk calculation. Users can input 12 features to predict DR risk. The interface provides text boxes for the following variables: SH3GLB2 (SH3GLB2 rs146694895: GG = 0 and GA = 1), FANCC (FANCC rs201407189: GG = 0 and AG = 1), age (continuous variable), sex (biological sex: male = 1, female = 2), FPG (fasting plasma glucose [mmol/L], continuous variable), HbA1c (glycosylated hemoglobin [%], continuous variable), UMALB (microalbuminuria [mg/L], continuous variable), monthly income (no income = 1, basic living allowance = 2, < 2,000 Chinese Yuan [CY] = 3, 2,000–3,000 CY = 4, 3,000–4,000 CY = 5, and > 4,000 CY = 6), OGTT (oral glucose tolerance test: tested = 1 and not tested = 2), therapy (therapeutic approach: dietary control = 1, exercise = 2, and drug therapy = 3), insulin usage (with usage = 1 and without usage = 2), education (educational level: junior school or lower = 0, high school or above = 1). Upon submission, the model computes the results, and the resulting probability indicates the DR status of the subject.
Table 1. Clinical features of the index patient and other family members
Family individual Age (years) Sex DM disease Age onset (years) DM duration (years) HbA1c (%) DR disease II2 64 Male DM 40 24 7.1 NPDR II4 61 Female DM 49 12 9.3 NPDR II6 60 Male DM 56 4 6.7 DWR II8 57 Female DM 41 16 7.8 NPDR II9 60 Male DM 44 16 6.1 DWR II10 54 Female DM 36 18 7.9 PDR II12 52 Female NDM — — 5.1 — II13 54 Male NDM — — 5.2 — III2 33 Male NDM — — 4.8 — III5 16 Female NDM — — 4.6 — Note. DM, diabetes mellitus; NDM, non-diabetes; HbA1c, glycosylated hemoglobin; DR, diabetic retinopathy; NPDR, non-proliferative diabetic retinopathy; DWR, diabetes without retinopathy; PDR, proliferative diabetic retinopathy.  下载: 导出CSV
Table 2. Multiple association analysis of genetic variants with diabetic retinopathy (DR) risk: functional prediction scores and odds ratios
Gene Position in CDS SNP Allele Frequency SIFTa PolyPhen2b Adjusted ORc (95% CI) P-value TRIM7 863 rs116911833 C/T 0.031 0.01 0.111 1.46x10⁶ (0, Inf) 0.18 LRBA 1997 — T/C — 0.05 0.989 3.34 (0.54, 20.82) 0.18 PRMT10 1643 — T/C — 0.01 0.999 1.21x10⁶ (0, Inf) 0.28 FANCC 973 rs201407189 G/A 0.01 0.35 0.956 0.78 (0.24, 2.57) 0.69 C9orf152 451 rs117858678 C/T 0.021 0.07 0.087 1.64 (0.66, 4.05) 0.29 CLDN25 379 rs201922794 A/T 0.01 0.4 0.297 1.11 (0.22, 5.64) 0.90 SH3GLB2 769 rs146694895 G/A 0.015 0.16 0.687 3.96 (1.02, 15.37) 0.03 Note. CDS, coding DNA sequence; SNP, single nucleotide polymorphism. aSIFT: prediction of a change being damaging (≥ 0.95) or tolerated (< 0.95). bPolyphen2: prediction of a change being damaging (> 0.85), possibly damaging (0.85–0.15) or benign (< 0.15). cOdds ratios from logistic regression models adjusted for age, fasting plasma glucose (FPG), glycated. hemoglobin (HbA1c), urinary microalbumin (UMALB), monthly income, oral glucose tolerance test (OGTT), therapeutic approaches, and insulin usage.
下载: 导出CSV
Table 3. Demographic features of all the DM patients, including training and validation cohorts
Parameters DWR DR P- Valuea n = 198 n = 222 Age (year) 68.21 ± 7.17 65.66 ± 7.90 < 0.001b Biological sex, n (%) Male 83 (41.90) 94 (42.30) 0.65c FPG (mmol/L) 7.99 ± 2.30 9.17 ± 3.36 < 0.001b HbA1c (%) 6.70 ± 1.37 7.80 ± 1.71 < 0.001b UMALB (mmol/L) 3.50 (1.77, 9.05) 7.34 (3.0, 26.20) < 0.001d Monthly income, n (%) 0.03 No income 4 (2.02) 3 (1.35) Basic living allowance 2 (1.01) 3 (1.35) < 2,000 CY 48 (24.24) 73 (32.88) 2,000–3,000 CY 81 (40.91) 104 (46.85) 3,000–4,000 CY 40 (20.20) 24 (10.81) > 4,000 CY 23 (11.62) 15 (6.760) Insulin usage, n (%) 55 (27.80) 150 (67.60) < 0.001 Therapeutic approaches, n (%) < 0.001 Dietary control 131 (66.20) 83 (37.40) Exercise 12 (6.10) 52 (23.40) Pharmacotherapy 55 (27.80) 87 (39.20) OGTT test conducted, n (%) 122 (61.61) 105 (47.30) 0.004 High school or higher, n (%) 126 (63.60) 114 (51.40) 0.01 rs146694895 0.02 GA 3 (1.52) 15 (6.76) GG 195 (98.48) 207 (93.24) rs201407189 0.82 AG 8 (4.04) 7 (3.15) GG 190 (95.96) 215 (96.85) Note. DWR, diabetic-without retinopathy; DR, diabetic retinopathy; FPG, fasting plasma glucose, HbA1c, glycosylated hemoglobin; UMALB, urine microalbumin; CY, Chinese Yuan. aFisher’s exact test. bT-test. cChi-square test. dKruskal-Wallis rank-sum test.
下载: 导出CSV
Table 4. Comparative performance of various algorithms in machine learning model
Algorithms Accuracy Sensitivity Specificity AUC Kappa value Random forest 73.0% 80.3% 65.0% 72.7% 45.6% Logistic Regression 77.8% 81.8% 73.3% 77.6% 55.3% K-nearest neighbor 65.1% 66.7% 63.3% 65.0% 30.0% Linear discriminant analysis 77.8% 81.8% 73.3% 77.6% 55.3% Multinomial Naive Bayes 57.9% 24.2% 95.0% 59.6% 18.6% Decision Tree 52.4% 56.1% 48.3% 52.2% 0.04% AdaBoost 66.7% 69.7% 63.3% 66.5% 33.1% Multi-layer perceptron 75.4% 81.8% 68.3% 75.1% 50.4% XGBoost 57.9% 59.1% 56.7% 57.9% 15.7% SVM 80.2% 83.3% 76.7% 80.0% 60.1% Note. SVM, Support vector machine; AUC, area under the receiver operating characteristic curve.
下载: 导出CSV
Table 5. Performance metrics of the support vector machine model with or without SH3GLB2 and FANCC variables
Features Accuracy Sensitivity Specificity AUC Kappa value Without SH3GLB2 79.4% 80.3% 78.3% 79.3% 58.6% Without FANCC 79.4% 83.3% 75.0% 79.2% 58.5% Without SH3GLB2 and FANCC 77.8% 80.3% 75.0% 77.7% 55.4% With SH3GLB2 and FANCC 80.2% 83.3% 76.7% 80.0% 60.1% Note. AUC, area under the receiver operating characteristic curve.
下载: 导出CSV
-
[1] Teo ZL, Tham YC, Yu M, et al. Global prevalence of diabetic retinopathy and projection of burden through 2045: systematic review and meta-analysis. Ophthalmology, 2021; 128, 1580−91. doi: 10.1016/j.ophtha.2021.04.027 [2] Sun H, Saeedi P, Karuranga S, et al. IDF Diabetes Atlas: global, regional and country-level diabetes prevalence estimates for 2021 and projections for 2045. Diabetes Res Clin Pract, 2022; 183, 109119. doi: 10.1016/j.diabres.2021.109119 [3] Chen XD, Gardner TW. A critical review: psychophysical assessments of diabetic retinopathy. Surv Ophthalmol, 2021; 66, 213−30. doi: 10.1016/j.survophthal.2020.08.003 [4] Hosseini SM, Maracy MR, Amini M, et al. A risk score development for diabetic retinopathy screening in Isfahan-Iran. J Res Med Sci, 2009; 14, 105−10. [5] Aspelund T, Þórisdóttir Ó, Ólafsdottir E, et al. Individual risk assessment and information technology to optimise screening frequency for diabetic retinopathy. Diabetologia, 2011; 54, 2525−32. doi: 10.1007/s00125-011-2257-7 [6] Verma L, Srivastava S, Negi PC. A hybrid data mining model to predict coronary artery disease cases using non-invasive clinical data. J Med Syst, 2016; 40, 178. doi: 10.1007/s10916-016-0536-z [7] Oh E, Yoo TK, Park EC. Diabetic retinopathy risk prediction for fundus examination using sparse learning: a cross-sectional study. BMC Med Inform Decis Mak, 2013; 13, 106. doi: 10.1186/1472-6947-13-106 [8] Li WY, Song YN, Chen K, et al. Predictive model and risk analysis for diabetic retinopathy using machine learning: a retrospective cohort study in China. BMJ Open, 2021; 11, e050989. doi: 10.1136/bmjopen-2021-050989 [9] Kaur N, Vanita V. Association of aldose reductase gene (AKR1B1) polymorphism with diabetic retinopathy. Diabetes Res Clin Pract, 2016; 121, 41−8. doi: 10.1016/j.diabres.2016.08.019 [10] Cole JB, Florez JC. Genetics of diabetes mellitus and diabetes complications. Nat Rev Nephrol, 2020; 16, 377−90. doi: 10.1038/s41581-020-0278-5 [11] Shtir C, Aldahmesh MA, Al-Dahmash S, et al. Exome-based case-control association study using extreme phenotype design reveals novel candidates with protective effect in diabetic retinopathy. Hum Genet, 2016; 135, 193−200. doi: 10.1007/s00439-015-1624-8 [12] Hao SF, Bai JY, Liu HM, et al. Comparison of machine learning tools for the prediction of AMD based on genetic, age, and diabetes-related variables in the Chinese population. Regen Ther, 2020; 15, 180−6. doi: 10.1016/j.reth.2020.09.001 [13] Yan Q, Jiang YL, Huang H, et al. Genome-wide association studies-based machine learning for prediction of age-related macular degeneration risk. Transl Vis Sci Technol, 2021; 10, 29. [14] Li YY, Yang XF, Gu H, et al. The Beijing Desheng Diabetic Eye Study: rationale, design, methodology and baseline data. Int J Ophthalmol, 2018; 11, 108−16. [15] Albert TJ, Molla MN, Muzny DM, et al. Direct selection of human genomic loci by microarray hybridization. Nat Methods, 2007; 4, 903−5. doi: 10.1038/nmeth1111 [16] Hampton BM, Schwartz SG, Brantley MA Jr, et al. Update on genetics and diabetic retinopathy. Clin Ophthalmol, 2015; 9, 2175−93. [17] Cho H, Sobrin L. Genetics of diabetic retinopathy. Curr Diab Rep, 2014; 14, 515. doi: 10.1007/s11892-014-0515-z [18] Meng WH, Shah KP, Pollack S, et al. A genome-wide association study suggests new evidence for an association of the NADPH Oxidase 4 (NOX4) gene with severe diabetic retinopathy in type 2 diabetes. Acta Ophthalmol, 2018; 96, e811−9. [19] Looker HC, Nelson RG, Chew E, et al. Genome-wide linkage analyses to identify loci for diabetic retinopathy. Diabetes, 2007; 56, 1160−6. doi: 10.2337/db06-1299 [20] Hietala K, Forsblom C, Summanen P, et al. Heritability of proliferative diabetic retinopathy. Diabetes, 2008; 57, 2176−80. doi: 10.2337/db07-1495 [21] Wang YH, Wang JQ, Wang QC, et al. Endophilin B2 promotes inner mitochondrial membrane degradation by forming heterodimers with Endophilin B1 during mitophagy. Sci Rep, 2016; 6, 25153. doi: 10.1038/srep25153 [22] Elder DA, D'Alessio DA, Eyal O, et al. Abnormalities in glucose tolerance are common in children with fanconi anemia and associated with impaired insulin secretion. Pediatr Blood Cancer, 2008; 51, 256−60. doi: 10.1002/pbc.21589 [23] Serfass JM, Takahashi Y, Zhou ZX, et al. Endophilin B2 facilitates endosome maturation in response to growth factor stimulation, autophagy induction, and influenza A virus infection. J Biol Chem, 2017; 292, 10097−111. doi: 10.1074/jbc.M117.792747 [24] Du YP, Miller CM, Kern TS. Hyperglycemia increases mitochondrial superoxide in retina and retinal cells. Free Radical Biol Med, 2003; 35, 1491−9. doi: 10.1016/j.freeradbiomed.2003.08.018 [25] Liu Y, Takahashi Y, Desai N, et al. Bif-1 deficiency impairs lipid homeostasis and causes obesity accompanied by insulin resistance. Sci Rep, 2016; 6, 20453. doi: 10.1038/srep20453 [26] MacKay C, Déclais AC, Lundin C, et al. Identification of KIAA1018/FAN1, a DNA repair nuclease recruited to DNA damage by monoubiquitinated FANCD2. Cell, 2010; 142, 65−76. doi: 10.1016/j.cell.2010.06.021 [27] Li J, Sipple J, Maynard S, et al. Fanconi anemia links reactive oxygen species to insulin resistance and obesity. Antioxid Redox Signal, 2012; 17, 1083−98. doi: 10.1089/ars.2011.4417 [28] Li JN, Sejas DP, Zhang XL, et al. TNF-α induces leukemic clonal evolution ex vivo in Fanconi anemia group C murine stem cells. J Clin Invest, 2007; 117, 3283−95. doi: 10.1172/JCI31772 [29] Pang QS, Andreassen PR. Fanconi anemia proteins and endogenous stresses. Mutat Res/Fundam Mol Mech Mutagen, 2009; 668, 42−53. doi: 10.1016/j.mrfmmm.2009.03.013 [30] Zheng DD, Liu J, Piao H, et al. ROS-triggered endothelial cell death mechanisms: focus on pyroptosis, parthanatos, and ferroptosis. Front Immunol, 2022; 13, 1039241. doi: 10.3389/fimmu.2022.1039241 [31] Tibshirani R. The lasso method for variable selection in the cox model. Stat Med, 1997; 16, 385−95. doi: 10.1002/(SICI)1097-0258(19970228)16:4<385::AID-SIM380>3.0.CO;2-3 [32] Spicer J, Sanborn AN. What does the mind learn? A comparison of human and machine learning representations. Curr Opin Neurobiol, 2019; 55, 97−102. doi: 10.1016/j.conb.2019.02.004 [33] Klein R, Klein BE, Moss SE, et al. The Wisconsin epidemiologic study of diabetic retinopathy: XVII. The 14-year incidence and progression of diabetic retinopathy and associated risk factors in type 1 diabetes. Ophthalmology, 1998; 105, 1801−15. doi: 10.1016/S0161-6420(98)91020-X [34] Lachin JM, Genuth S, Nathan DM, et al. Effect of glycemic exposure on the risk of microvascular complications in the diabetes control and complications trial—revisited. Diabetes, 2008; 57, 995−1001. doi: 10.2337/db07-1618 -

 点击查看大图
计量
- 文章访问数: 8581
- HTML全文浏览量: 4230
- PDF下载量: 64
- 被引次数: 0

 Quick Links