

 下载:
下载:


-
Epstein-Barr virus (EBV), also known as human herpes virus type 4 (HHV-4), belongs to the Herpesviridae and Gammaherpesvirinae subfamily[1]. Epstein-Barr virus (EBV) infection in infancy is typically asymptomatic; however, infection during or after adolescence can trigger infectious mononucleosis (IM). Most patients remain asymptomatic for the remainder of their lives because EBV can cause latent infections and evade host immunity[2]. However, EBV can cause low frequencies of several types of cancers, including gastric carcinoma (GC), nasopharyngeal carcinoma (NPC), natural killer (NK)/T-cell lymphoma (NKTCL), Hodgkin lymphoma (HL), and Burkitt lymphoma (BL)[3].
The detection of EBV DNA can serve as an early diagnostic tool for EBV-associated cancers[4]. Moreover, the detection of EBV DNA can be helpful in the diagnosis of recurrent or metastatic NPC with good sensitivity and specificity[5]. EBV has been observed in a significantly high proportion of patients with BL (> 50%). This study recommends EBV testing as an alternative for the prediction and assessment of the clinical status of BL[6]. The development of an EBV vaccine has the potential to prevent a significant number of EBV-related cancers, thereby reducing the overall cancer burden[7].
In addition to well-documented EBV-related tumors, other EBV-related diseases such as multiple sclerosis (MS)[8], juvenile dermatomyositis (JDM)[9], and autoimmune diseases[10] have been extensively studied. However, clinical studies on EBV have been hampered by the low incidence of associated disorders, regional variations, and low numbers of EBV-positive cells in healthy individuals. In addition, the effect of EBV DNA preprocessing on various diseases has not yet been explored. Studies have shown that coinfection with other viruses can result in elevated EBV titers in the peripheral blood, which can lead to rapid deterioration of health and eventual death[11]. Therefore, large-scale studies are required to investigate the prevalence and clinical impact of EBV infection in various patient populations across different age groups. This finding is of significance for patients with newly reported illnesses that may be associated with EBV infection and co-infection with other infectious agents.
This retrospective study aimed to investigate the epidemiological characteristics of whole-blood EBV DNA (WBEBV) in a diverse population of individuals with different ages and health statuses. This study used a large sample size and covered a wide range of diseases, thereby providing clinicians with valuable baseline information. In addition, this study examined variants of WBEBV in patients with different disease subtypes and at various stages of the disease with the goal of establishing associations between WBEBV and these diseases in different patient groups.
-
The study analyzed data on patients admitted to the First Affiliated Hospital of Zhejiang University College of Medicine between January 1, 2020, and August 31, 2023. Outpatients and inpatients who underwent whole-blood EBV nucleic acid assays were included. Specimens were collected at the time of the first visit or weekly from transplant patients, where the highest detected WBEBV load over a 2-month period was selected. We retrospectively collected demographic and diagnostic information and analyzed the epidemiological characteristics of patients of various ages and with different diseases.
-
This study adhered to the ethical guidelines of the Declaration of Helsinki and was approved by the Ethics Committee of the First Affiliated Hospital of the College of Medicine, Zhejiang University. Because of the retrospective nature of the data, the Ethics Committee waived the requirement for informed consent.
-
Viral DNA was extracted from ethylenediaminetetraacetic acid (EDTA) whole blood and quantified using quantitative real-time polymerase chain reaction (PCR). The results were reported as copies/mL. Viral DNA was extracted from EDTA whole blood and quantified using quantitative real-time polymerase chain reaction (PCR). The results were reported as copies/mL. PCR was performed using a LightCycler 480II instrument (Roche, Basel, Switzerland). WBEBV negativity was determined based on the Ct value of the negative control. WBEBV positivity was defined as a Ct value of < 35, indicating a WBEBV copy number of > 500 copies/mL. PCR amplification was performed using the following program: 37 °C for 2 min, 94 °C for 2 min, and 40 cycles of 94 °C for 15 s and 55 °C for 60 s. Fluorescence signals were collected at 55 °C for 45 s.
-
In this study, we investigated abnormal proliferation or hyperplasia (APH), including IM and lymph node hyperplasia (LNH). The diagnosis of LNH requires multiple clinical specialists to perform hematology, histopathology, and other clinical tests to exclude damage to other organs or neoplasms. We also studied EBV-associated neoplasms (EN), which include nasopharyngeal carcinoma (NPC), lymphoma (Ly), and gastric cancer (GC). Leukemia (Le), including monocyte leukemia (MoL), granulocyte leukemia (GL), lymphocyte leukemia (LL), and myelocytic Leukemia (MyL), is another research focus. Neoplasms (other) (Ne) include multiple myeloma (MM), myelodysplastic syndrome (MDS), liver cancer (LC), and colorectal cancer (CC). Transplant (TP) include liver transplants (LT), kidney transplants (KT), stem cell transplants (ST), and other transplants. Additionally, we categorized the cases into two groups: malignant (EN, Le, Ne, and TP associated with malignancy) and benign (healthy controls (HC), APH, and systemic lupus erythematosus (SLE), and other TP). A high WBEBV level was defined as a WBEBV load above the median EN level (2,151 copies/mL). Coinfection was defined as the presence of one of the following pathogens in addition to EBV: hepatitis B/C Virus (HBV/HCV), human immunodeficiency virus (HIV), or severe acute respiratory syndrome coronavirus 2 (SARS-CoV-2).
-
The chi-square test was used to compare categorical data, and continuous variables were summarized using the median and interquartile range (IQR) owing to their non-parametric distribution. To assess the variations in EBV-DNA load levels, we used the “ggpubr” package in R software. In addition, we log-transformed EBV DNA copy numbers for analysis. The chi-square test was performed using SPSS (version 23.0; IBM Corp, Chicago, IL, USA). Receiver operating characteristic (ROC) curves were constructed to evaluate the diagnostic ability of WBEBV in distinguishing EBV-associated diseases from healthy populations. The area under the curve (AUC) was calculated for each ROC curve. Sankey plots were generated using the R “ggalluvial” package to visually represent the relationships among diseases, EBV levels, and disease types in all groups.
-
This study included 26,648 participants, including 1,388 patients diagnosed with chronic active Epstein-Barr virus (CAEBV) and 1,159 healthy individuals who underwent WBEBV DNA assays. The overall positivity rate for EBV DNA in whole blood was 24.68% (6,235/25,260), with a positivity rate of 25.38% (6,117/24,101) in patients with suspected EBV-associated diseases and 10.18% (118/1,159) in the healthy group. The median age of all participants was 51 years (IQR, 34–63 years), and the male-to-female ratio was 5:4.
-
Based on the data listed in Table 1, the male EN group had the highest positive rate (4.75%), and there was a significant difference in positive rates between males and females (P = 0.0005). In contrast, the female HC group showed the lowest positivity rate (0.15%). In addition, significant differences in the positivity rates of WBEBV were observed between male and female patients diagnosed with APH (P = 0.0105), Le (P = 0.0397), and Ne (P = 0.0017) (Table 1).
Table 1. Distribution of whole-blood EBV-DNA load detection results for different genders (n = 25,260)
Diseases Gender Age (IQR) EBV-DNA detectable (n) EBV-DNA undetectable (n) n Positive rate (%) P value# Abnormal Proliferation or Hyperplasia Male 43 (24, 60) 255 474 729 1.01 0.0105 Female 184 464 648 0.73 EBV-associated Neoplasm Male 41 (55, 65) 1,200 3,720 4,920 4.75 0.0005 Female 701 2,624 3,325 2.78 Healthy Control Male 25 (30, 41) 79 615 694 0.31 0.1201 Female 39 426 465 0.15 Leukaemia Male 48 (33, 59) 779 1,669 2,448 3.08 0.0397 Female 607 1,489 2,096 2.40 Neoplasm (other) Male 49 (58, 67) 893 2,948 3,841 3.54 0.0017 Female 454 1,840 2,294 1.80 Systemic Lupus Erythematosus Male 32 (51, 61) 56 102 158 0.22 0.0927 Female 147 377 524 0.58 Transplant Male 16 (37, 51) 427 1,239 1,666 1.69 0.0770 Female 414 1,038 1,452 1.64 Note. Data were presented as No., %, or median and inter-quartile range (IQR); #Comparison of the rates of detectable EBV-DNA in the whole-blood between males and females. EBV, Epstein-Barr virus. The performance of WBEBV at diagnosis was evaluated in the different groups of the study population (Table 2). The IM group exhibited a relatively high sensitivity of 67.4% (95% CI: 57.6%–75.8%) and a specificity of 72.0% (95% CI: 63.3%–79.3%), with an AUC of 73.2% (95% CI: 66.3%–80.1%) (P < 0.0001) (Table 2). Moreover, the sensitivities and specificities of LNH, LL, and Ly were > 60%, and their AUCs ranged 62.5%–71.0% (all P < 0.005) (Table 2).
Table 2. Diagnostic performance of the whole-blood EBV-DNA levels at diagnosis to distinguish CAEBV from other EBV-infections
Diseases Abbreviation# Threshold
(log10 DNA)EBV-DNA load (copies/mL) Sensitivity
(%, 95% CI)Specificity
(%, 95% CI)AUC (95% CI) P value CC 3.362 2300.91 41.4 (36.2–46.9) 73 (63.38–79.38) 56.5 (50.5–62.5) 0.0367 MDS 3.450 2820.98 42.14 (37–47.5) 77.1 (68.8–83.8) 60.4 (54.6–66.2) 0.0007 IM 3.363 2305.69 67.4 (57.6–75.8) 72 (63.3–79.3) 73.2 (66.3–80.1) < 0.0001 NPC 3.358 2280.87 48.8 (42.5–55) 72 (63.3–79.3) 61.6 (55.5–67.7) 0.0004 SLE 3.013 1030.86 71.4 (64.9–77.2) 44.9 (36.2–53.9) 57.5 (50.9–64) 0.026 LNH 3.447 2800.92 63.4 (57.5–68.9) 60.3 (48.4–71.1) 63.8 (56.8–70.8) 0.0004 LL 3.451 2825.53 64.9 (59.3–70.1) 60.3 (48.4–71.1) 62.5 (55.1–69.8) 0.0014 Ly 3.445 2786.12 62 (59–64.9) 60.3 (48.4–71.1) 62.1 (55.8–68.5) 0.0008 MyL 3.446 2791.26 59 (54.1–63.8) 60.3 (48.4–71.1) 59.3 (52.2–66.5) 0.0138 Note. Data were presented as No., or median (interquartile range). AUC, area under the curve; CAEBV: Chronic active Epstein-Barr virus; CC: colorectal cancer; LNH: lymph-node hyperplasia; LL: lymphocyte leukaemia; Ly: lymphoma; MDS: myelodysplastic syndrome; IM: infectious mononucleosis; MyL: myelocytic leukemia; NPC: nasopharyngeal carcinoma; SLE: systemic lupus erythematosus. #Diseases with P value < 0.05 were listed. -
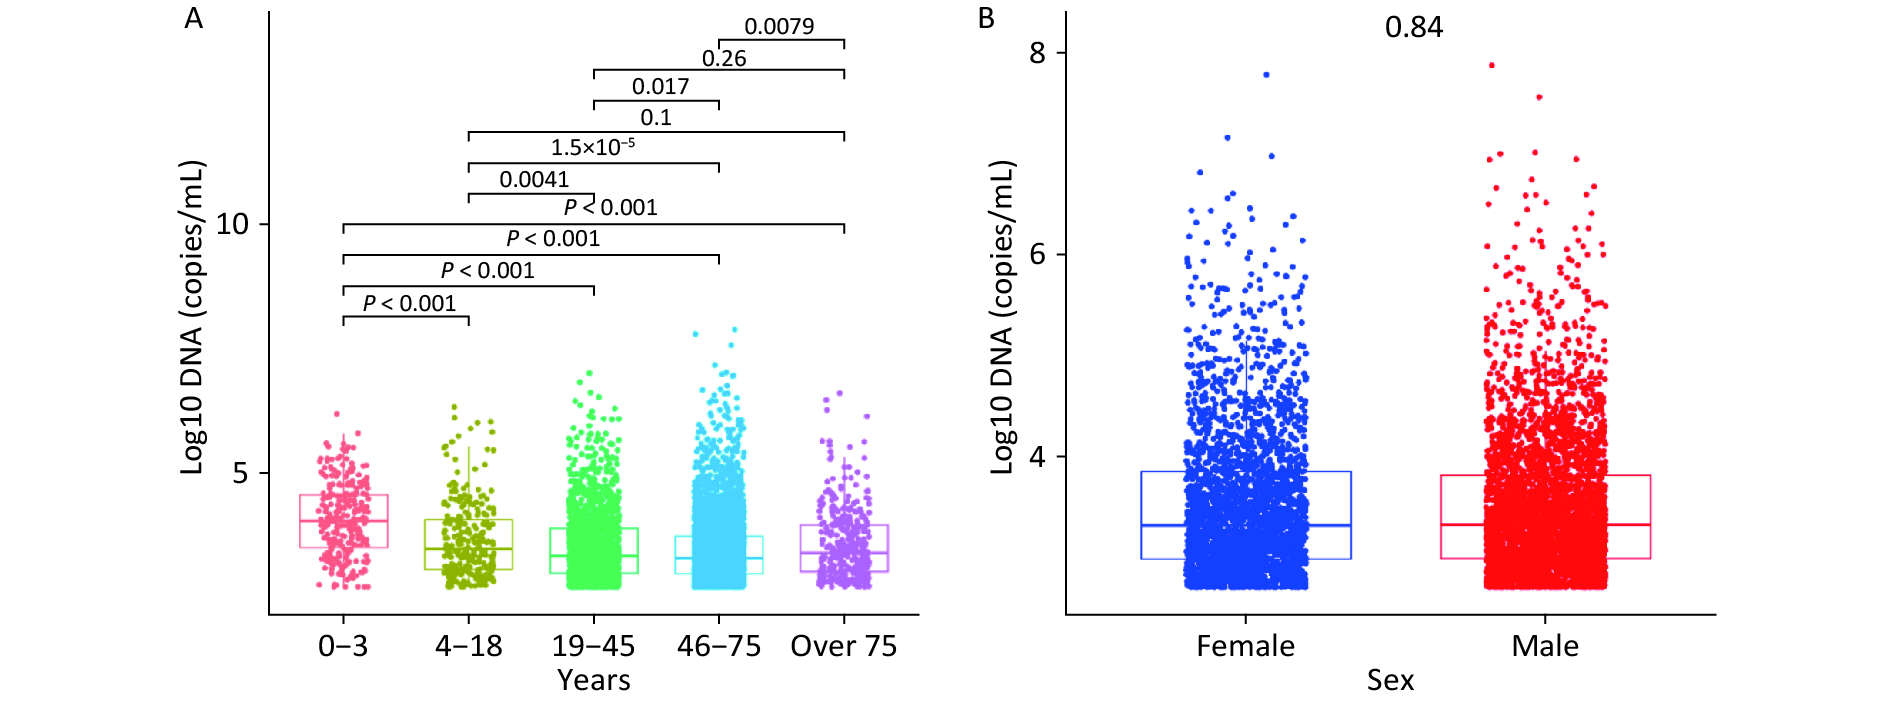
Figure 1A shows the median WBEBV levels for each age group: 10,410, 3,870, 1,890, 1,810, and 2,450 copies/mL. Notably, patients aged 0–3 years had the highest WBEBV levels (P < 0.001). Significant differences in WBEBV levels were observed across age groups, except for the 4–18 vs. > 75 and 19–45 vs. > 75 years groups. In contrast, Figure 1B shows no significant differences in WBEBV levels between males and females among all patients (Figure 1B).
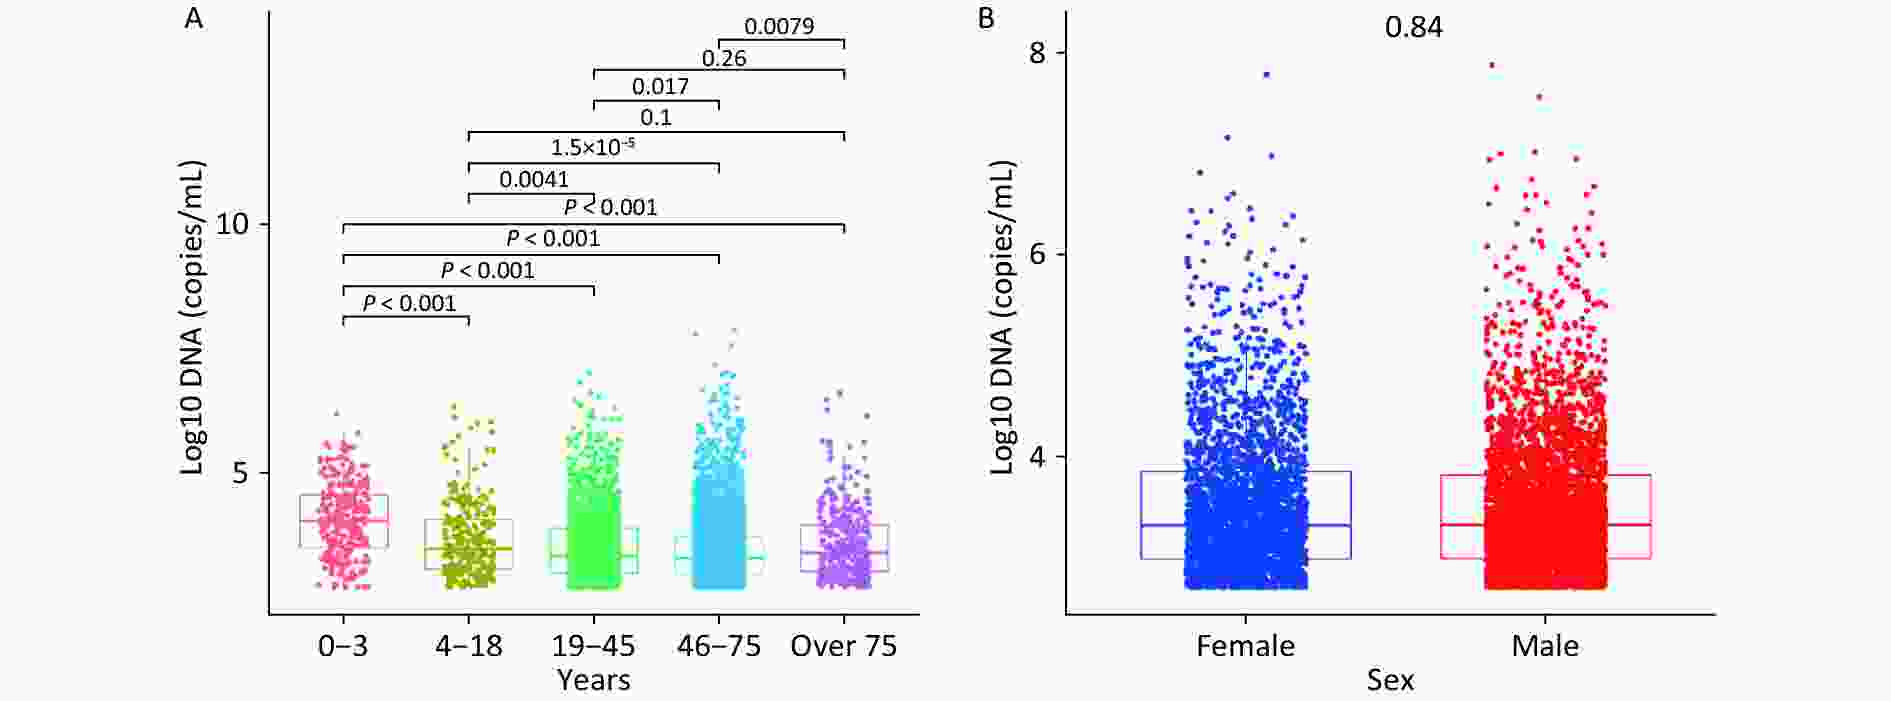
Figure 1. Quantitative detection of whole-blood EBV-DNA levels in different age and sex groups. (A) The box plot comparing the whole-blood EBV-DNA levels of patients in different age groups; (B) The box plot comparing the levels in the male and female groups. EBV, Epstein-Barr virus.
-
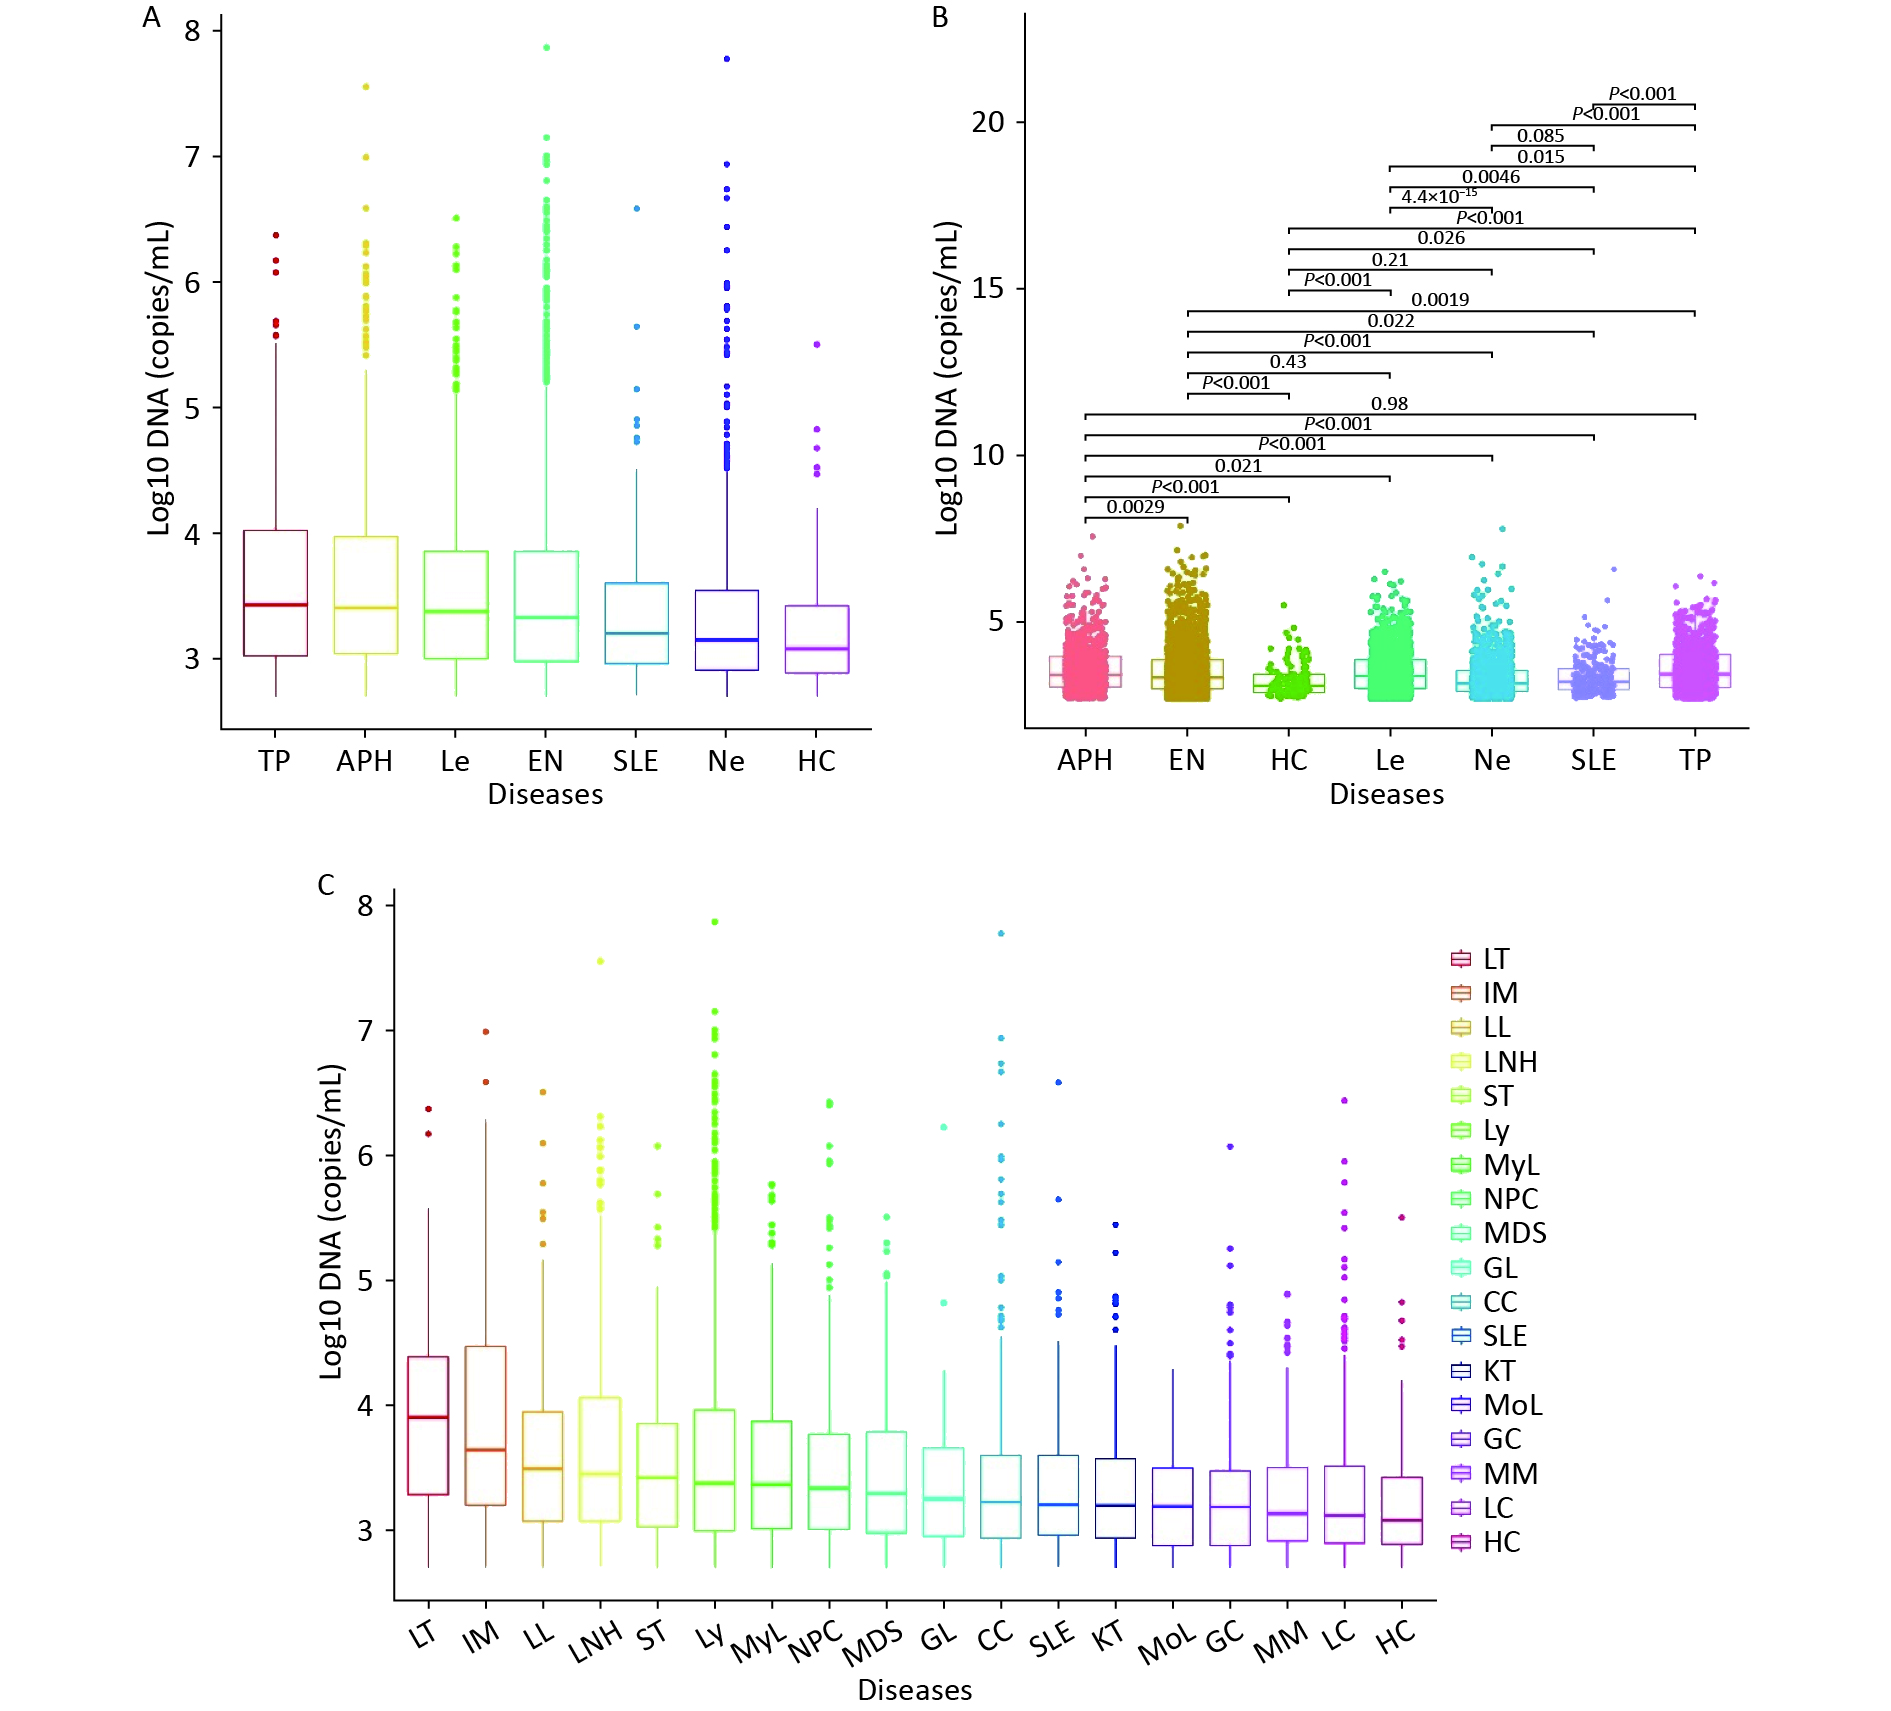
We initially divided all patients into six groups based on their clinical diagnosis, and then compared their WBEBV levels pairwise. Figure 2A shows that the TP group had the highest median WBEBV level at 2,711 copies/mL, which was significantly higher than that of all the other groups, followed by the APH group at 2,561 copies/mL. The HC group had the lowest WBEBV level, with a median of 1,211 copies/mL (Figure 2A). Compared with the EN group, there were statistically significant differences in the positive WBEBV detection rates, except for Le. Statistically significant differences in the WBEBV levels were observed among the different groups, except for the APH vs. TP, EN vs. Le, HC vs. Ne, and Ne vs. SLE comparisons (Figure 2B). To further analyze the data, we subdivided the six groups and ranked them based on their WBEBV levels. Figure 2C shows that the LT group had the highest median WBEBV level at 8,071 copies/mL, which was significantly higher than that in all other groups, followed by the IM group at 4,411 copies/mL.
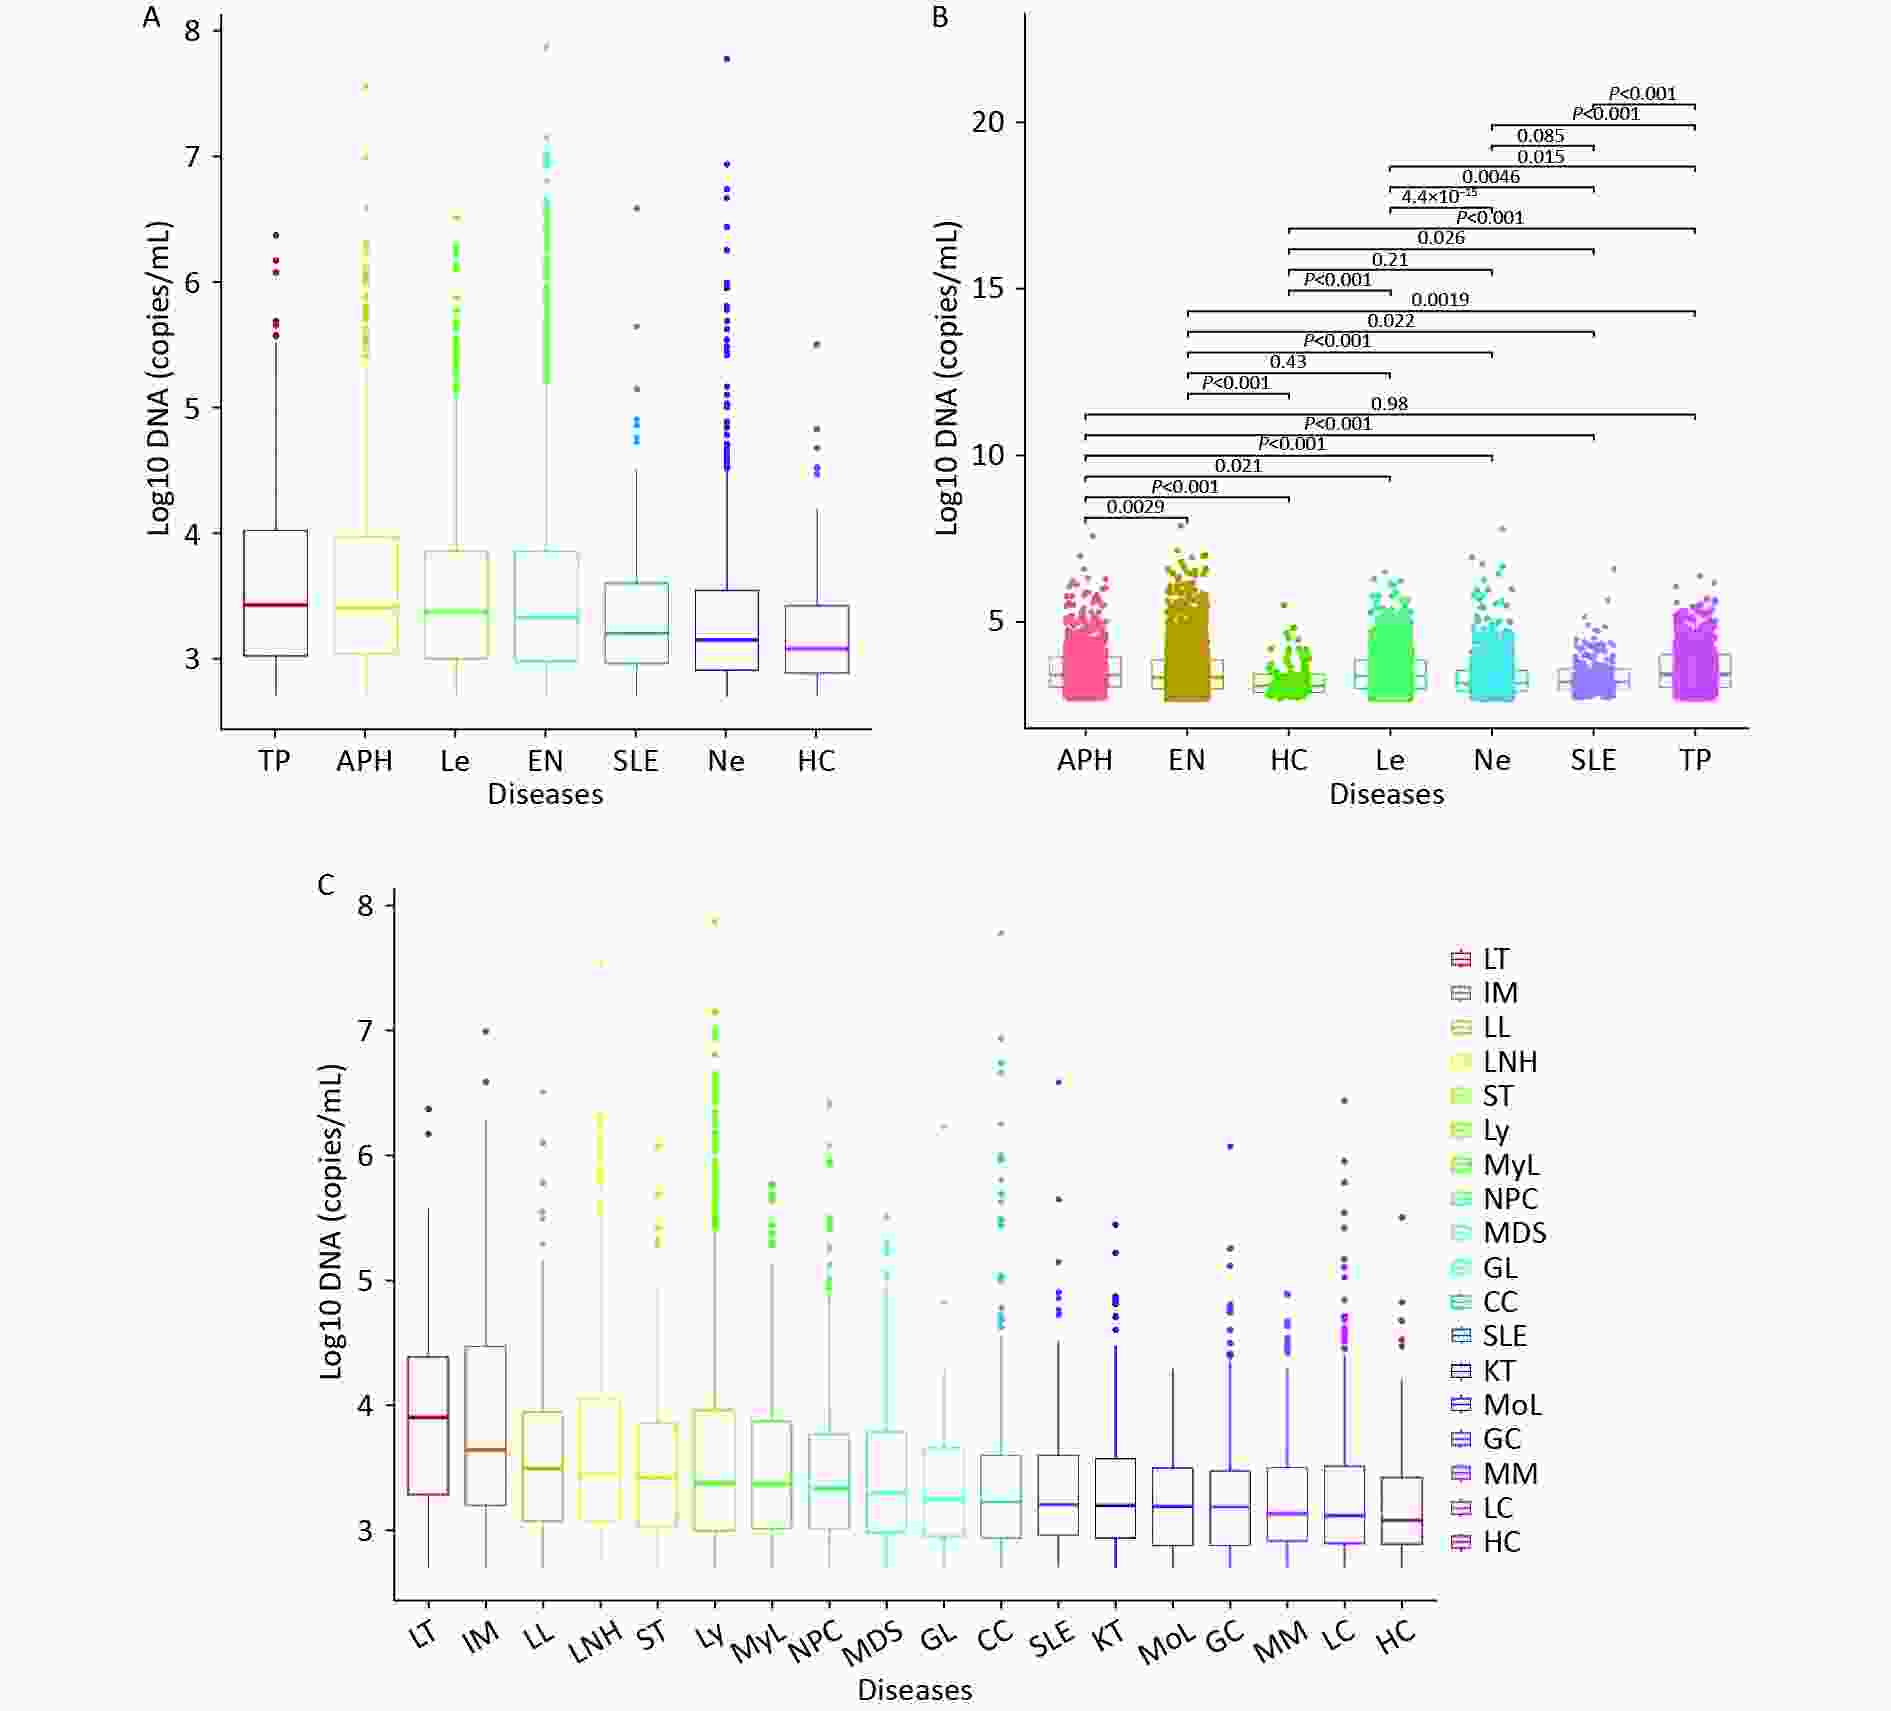
Figure 2. Differences in whole-blood EBV-DNA levels across diseases.
-
EBV-positive results were common in acute Le (19.60%) and Ly (22.12%), with positivity rates of 4.84% and 5.46%, respectively (Figures 3A and B). The positivity rates for malignant and benign diseases were 18.35% and 6.34%, respectively (Figure 3C). Patients with higher levels of WBEBV, specifically those with levels above the median of 2,151 copies/mL, were classified as high. Sankey plot analyses revealed that patients with IM, LL, LNH, or LT were more likely to have elevated WBEBV levels. In addition, there may be an underlying association between benign diseases and low EBV levels (Figure 3D).
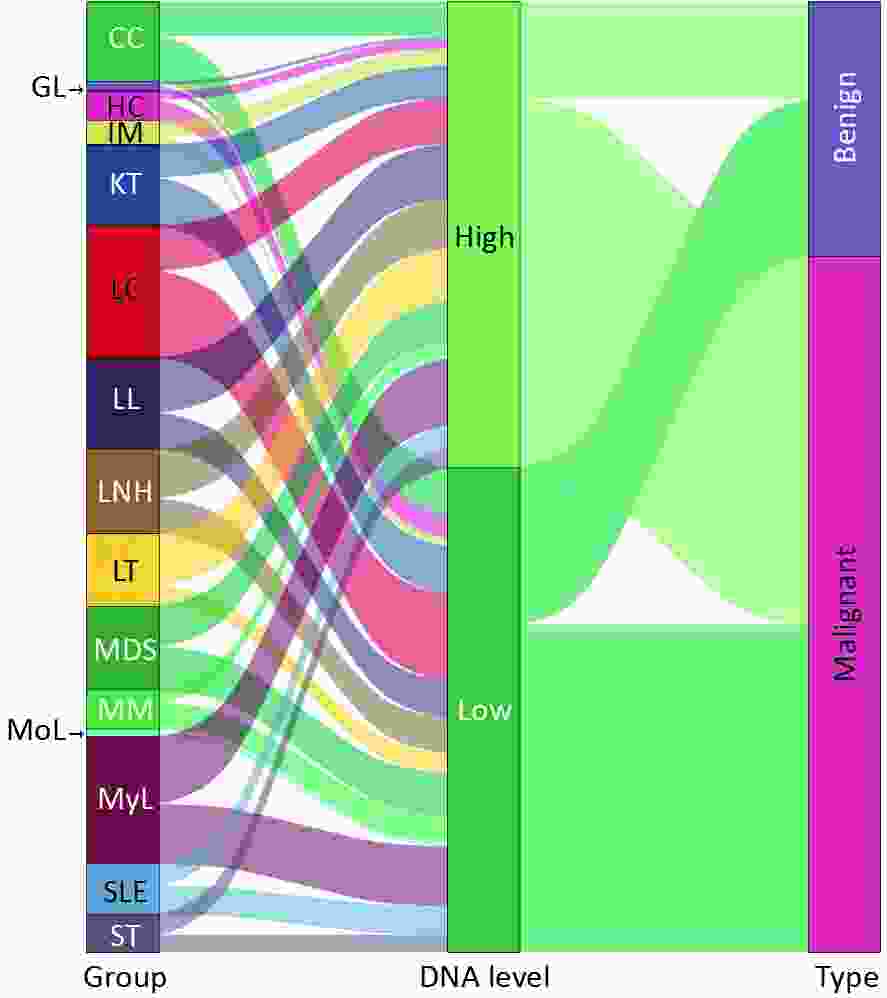
Figure 3. Sankey plot illustrating the relationship between whole-blood EBV-DNA levels and different disease types. The term “EBV-DNA high” refers to whole blood EBV-DNA levels that are above the median of EBV-associated neoplasms, specifically 2,151 copies/mL. The category “EBV-associated neoplasm (EN)” encompasses nasopharyngeal carcinoma (NPC), lymphoma (Ly), and gastric cancer (GC). Other abbreviations used in the figure include APH (abnormal proliferation or hyperplasia), Le (leukaemia), Ne (neoplasm other than EN), SLE (systemic lupus erythematosus), TP (transplant), IM (infectious mononucleosis), LNH (lymph-node hyperplasia), MoL (monocyte leukaemia), GL (granulocyte leukaemia), LL (lymphocyte leukaemia), MyL (myelocytic leukemia), MM (multiple myeloma), LC (liver cancer), CC (colorectal cancer), MDS (myelodysplastic syndrome), SEL (systemic lupus erythematosus), LT (liver transplantation), KT (kidney transplantation), and ST (stem-cell transplantation). The category “malignant” includes EN, Le, Ne, and TP associated with malignancy, while “benign” includes healthy control (HC), APH, and SLE, as well as other TP.
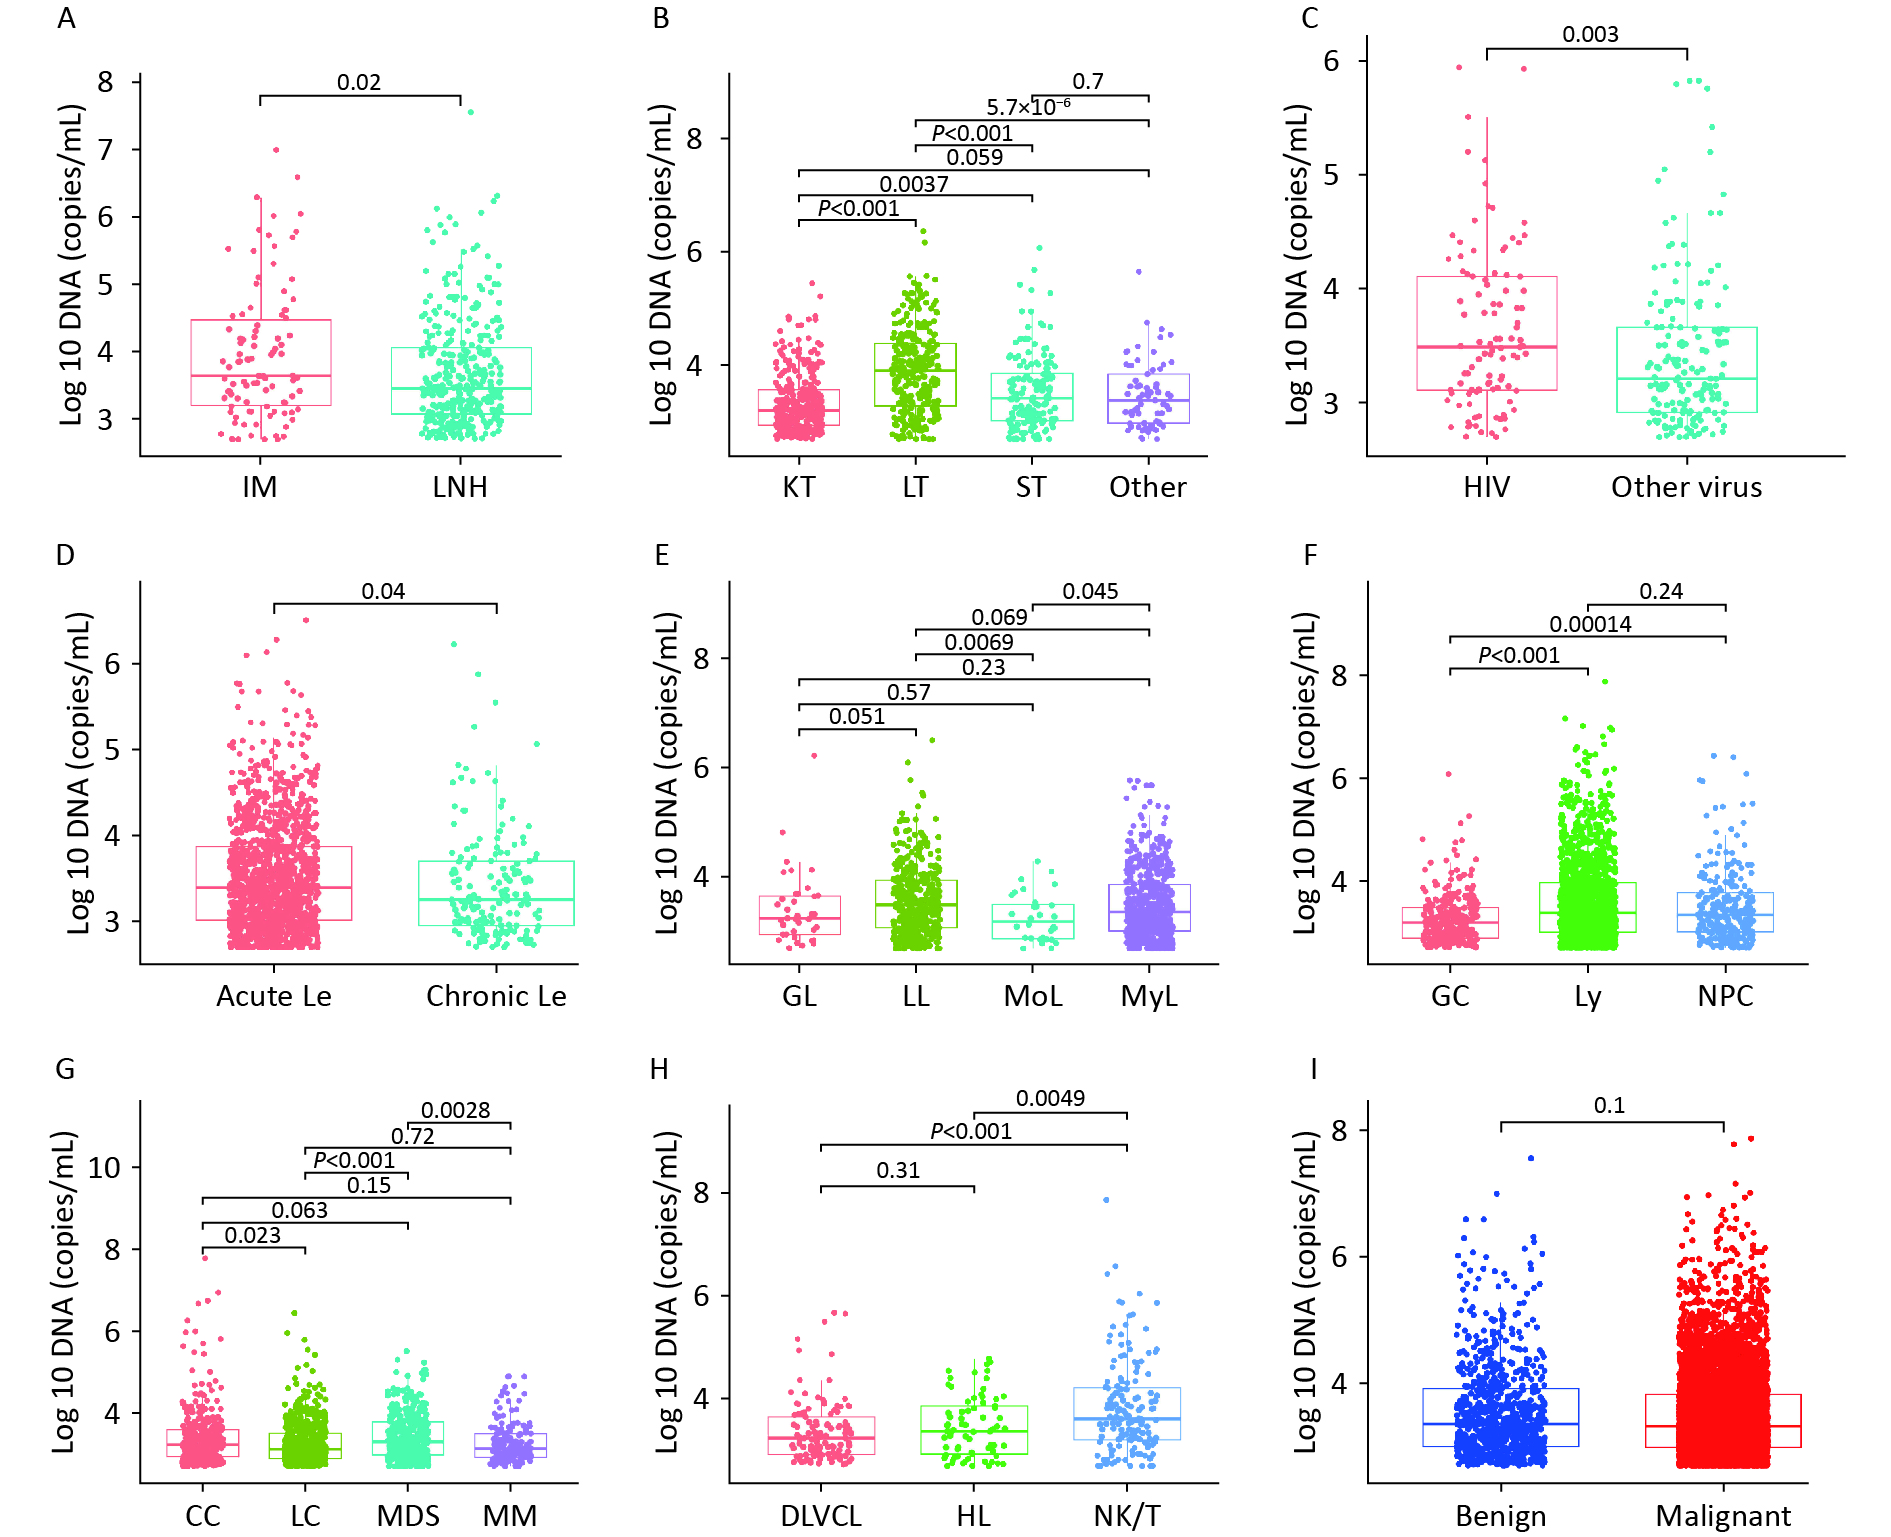
Figure 4 shows the variability in WBEBV levels across the subgroups of these diseases. Specifically, the median WBEBV levels were higher in the IM group than in the LNH group (P = 0.02). The WBEBV levels in the LT group were the highest among all TP disease groups (P < 0.0001). Additionally, we observed that patients co-infected with HIV had a higher median EBV DNA level compared to those co-infected with other viruses (HBV, HCV, or SARS-CoV-2) (P = 0.003) (Figure 4C).
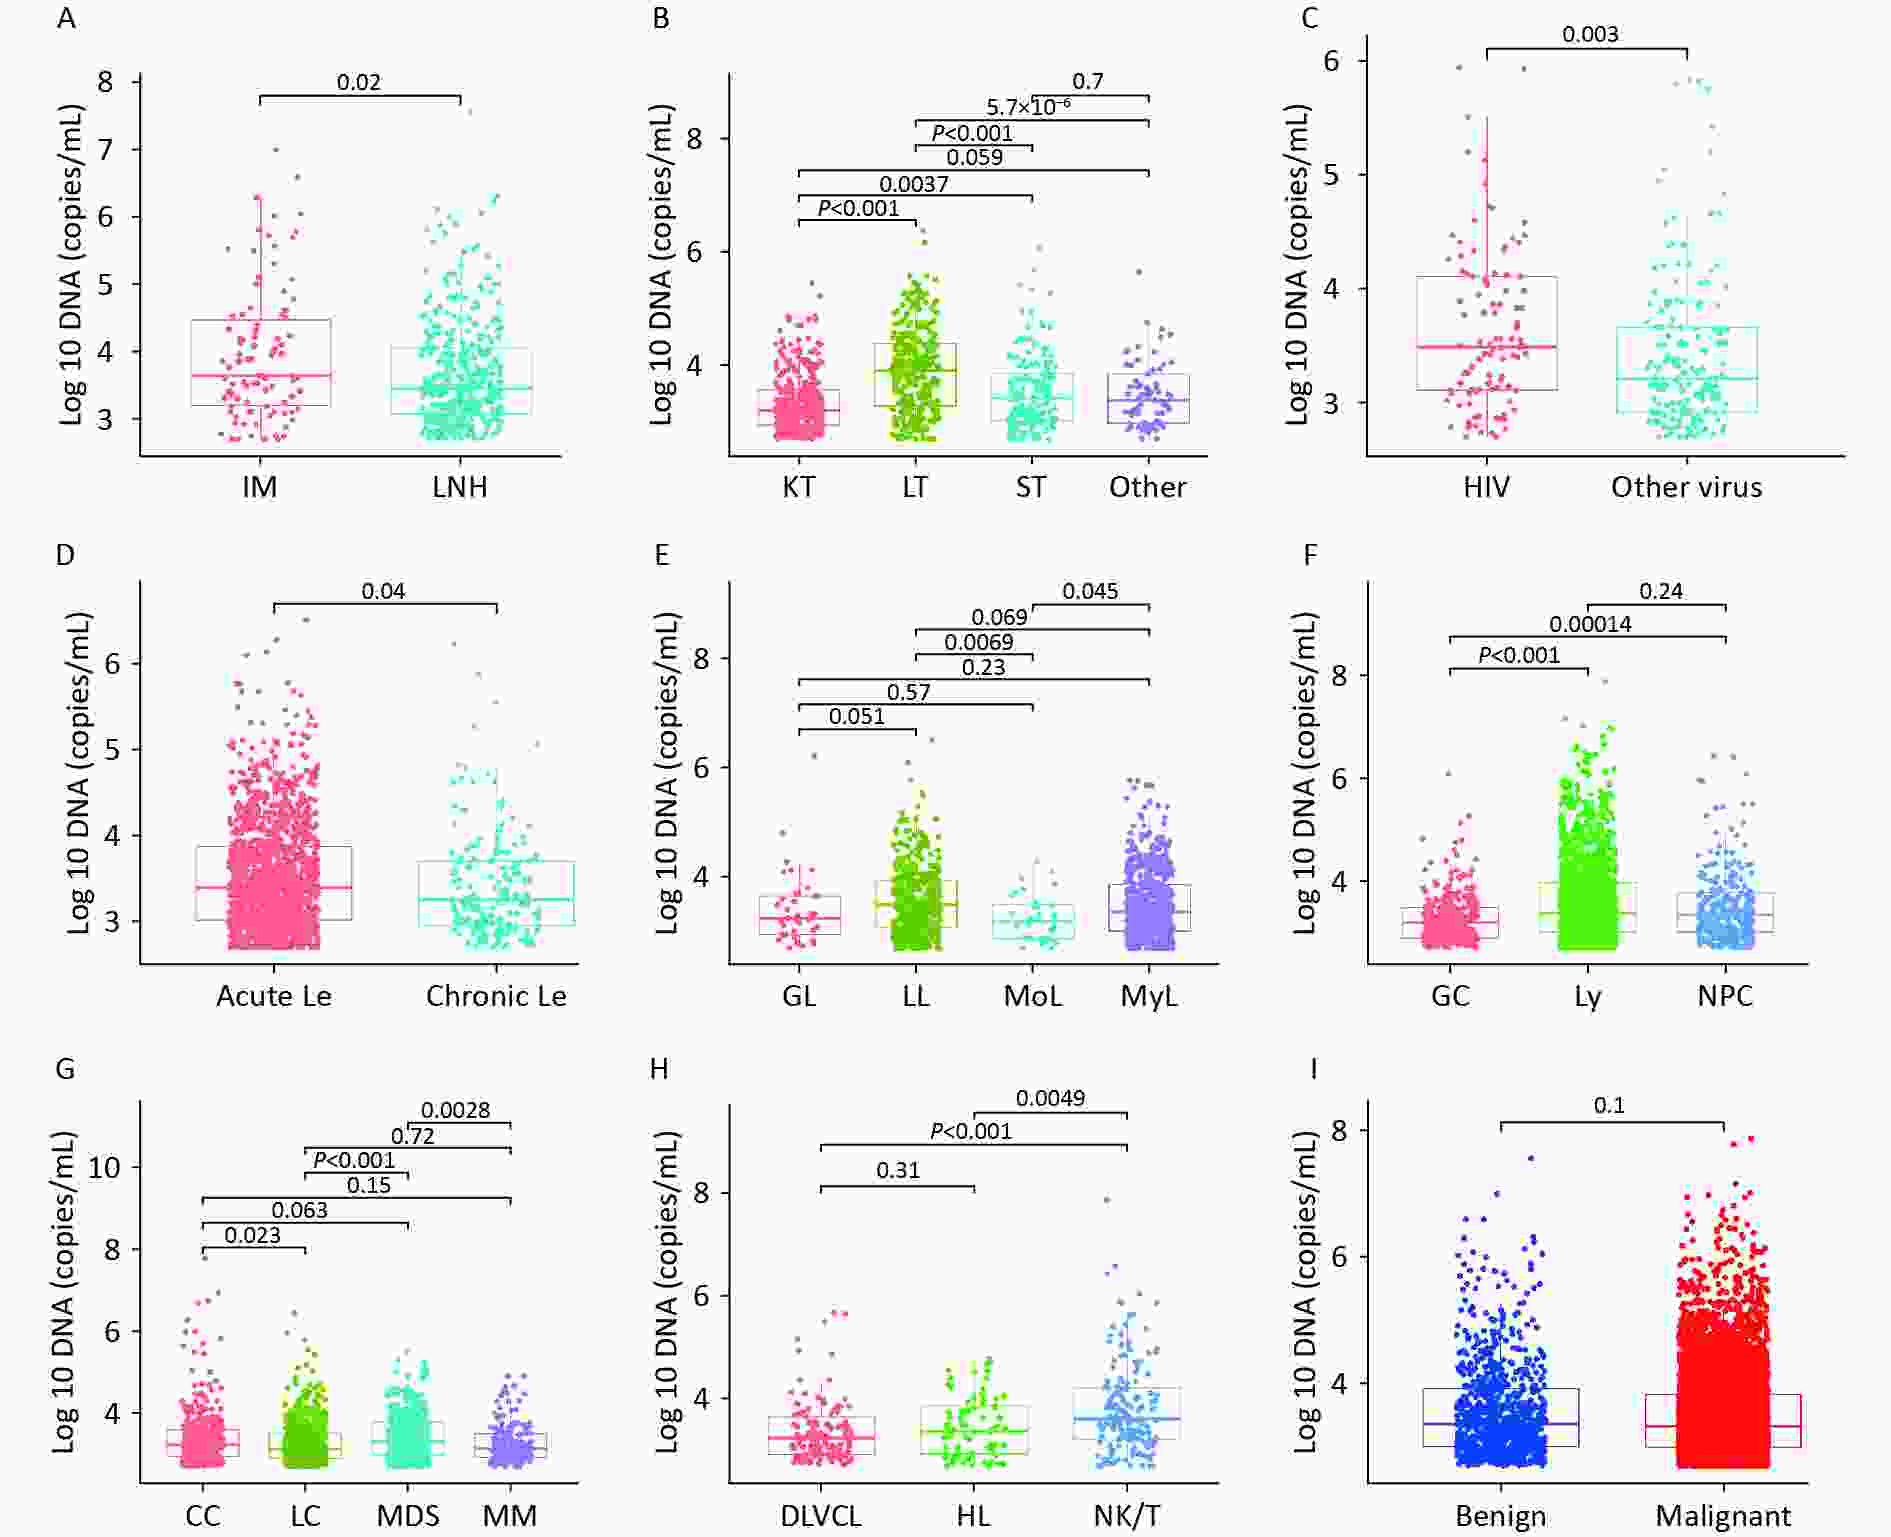
Figure 4. Variation in whole-blood EBV-DNA levels across subgroups within these diseases. (A) Box plot showing the EBV-DNA levels between APH group. (B) Box plot showing the EBV-DNA levels among TP group. (C) Box plot showing EBV-DNA levels from co-infection patients. (D) Box plot showing EBV-DNA levels for different types of Le. (E) Box plot showing EBV-DNA levels for Le. (F) Box plot showing EBV-DNA levels for EN. (G) Box plot showing EBV-DNA levels for Ne; (H) Box plot showing EBV-DNA levels for Ly; (I) Box plot showing EBV-DNA levels for benign and malignant diseases. APH: abnormal proliferation or hyperplasia; EN: EBV-associated neoplasm; Le: leukaemia; Ne: neoplasm (other); SLE: systemic lupus erythematosus; TP: transplant; IM: infectious mononucleosis; LNH: lymph-node hyperplasia; NPC: nasopharyngeal carcinoma; Ly: lymphoma; GC: gastric cancer; MoL: monocyte leukaemia; GL: granulocyte leukaemia; LL: lymphocyte leukaemia; MyL: myelocytic leukemia; MM: multiple myeloma; LC: liver cancer; CC: colorectal cancer; MDS: myelodysplastic syndrome; SEL: systemic lupus erythematosus; LT: liver transplantation; KT: kidney transplantation; ST: stem-cell transplantation.
Significant differences were observed in DNA levels between acute and chronic Le (P = 0.04) (Figure 4D). Among all Le subtypes, LL showed higher WBEBV levels than MoL (P = 0.0069) (Figure 4E). Statistically significant differences were observed between EN and Ne groups (Figures 4F and G). WBEBV levels were higher in NK/T-cell lymphoma (NK/T) than in Hodgkin lymphoma (HL) (P = 0.0049) and diffuse large B-cell lymphoma (DLBCL) (P < 0.0001) (Figure 4H). However, no statistically significant difference in WBEBV levels was observed between the malignant and benign cases (Figure 4I).
-
This was a large-sample study of the prevalence of EBV in the Zhejiang region, China, which included 1,159 healthy individuals and showed that 10.18% of the healthy individuals tested positive for EBV in whole blood. The prevalence of EBV in whole blood from these participants was consistent with the 9.09% prevalence reported in peripheral blood mononuclear cells[12]. These results are much lower than the 31.0% reported by Yan et al. for lymphocytes from healthy donors[13]. To the best of our knowledge, this was still lower than the result of 16.7% in the same area 15 years ago[14]. Notably, our sample size was the largest and, thus, the most convincing of all the aforementioned reports; therefore, we believe that the prevalence of EBV in this region is low among healthy individuals. Moreover, the overall EBV detection rate was 25.4% in individuals with EBV-related diseases, surpassing the 17.7% detection rate reported in a previous study that used clinical specimens[15]. When examining specific diseases such as lymphoma, our detection rate was 24.1% (1,379/5,727), which was lower than that reported in other studies[16]. This may be attributed to the sample size, with 5,727 patients with lymphoma included in our study, whereas only 454 cases were included in the cited literature. Thus, our results are well supported. Other reasons lie in the age distribution of the patients with lymphoma included in our study, which was an average of 57 years (ranging 47–67 years). The results indicated that EBV levels were lower in patients aged 19–75 years. Therefore, the abovementioned causes lead to differences in the detection of EBV in the whole blood of patients with the same type of lymphoma.
CAEBV infection, formerly known as chronic active Epstein-Barr virus infection, is characterized by systemic inflammation and the clonal proliferation of EBV-infected T and NK cells[17]. However, it remains unclear how the threshold EBV load in whole blood can be used to detect CAEBV[18]. A recent study conducted in Japan reported that EBV-DNA load ≥ 10,000 IU/mL in whole blood was proposed as the diagnostic cut-off value for CAEBV[19]. The disease is progressive, with significantly elevated levels of EBV DNA in the blood and organ infiltration by EBV-positive lymphocytes[17]. Therefore, it remains unclear whether the baseline EBV load levels in patients with CAEBV before diagnosis differ from those in patients with other EBV infectious diseases. In our study, using a threshold range of 2,300–2,800 copies/mL, patients with CAEBV were well distinguished from those with IM, LNH, LL, and Ly, yielding a sensitivity of 67.4%, specificity of 72%, and AUC of 73.2% (Table 2). This will provide clinicians with the opportunity to identify patients with early CAEBV infection for further testing by assessing EBV load levels in whole blood, particularly in those with CAEBV enteritis[20]. This is particularly meaningful for this subset of patients because CAEBV infection suggests the need for specific treatment regions[21].
Previous studies have reported that whole blood samples exhibit higher sensitivity than plasma samples[22] and that the detection rate of EBV DNA in whole blood is higher than that in serum[23]. The EBV detection rate was higher in patients with malignant disease (18.35%) than in those with benign disease (6.34%). Additionally, high levels of EBV DNA have been associated with poor prognosis[16,24,25]. Based on previous studies, patients with EBV DNA ≥ 1,500 copies/mL showed higher N classification[26]. Other studies have also concluded that elevated plasma EBV-DNA can predict NPC risk over 3 years[27]. In the present study, we considered that patients with EBV levels higher than the mean median of the EN group (GC, Ly, and NPC, 2,151 copies/mL) had a high baseline EBV load, and extremely high EBV levels were observed in IM, LL, LNH, and LT. Therefore, it is difficult to determine the degree of malignancy of this EBV-associated disease based on the high baseline EBV load. However, this can indicate that the patient has a high EBV load and relatively poor infection status at this time. If EBV is malignant, the prognosis may also be poor[28].
Solid organ transplant (SOT) recipients have an increased risk of infection and malignancy due to the immunosuppression they receive to prevent allograft rejection[29]. This study found that SOT recipients, particularly patients with LT and ST, had elevated levels of whole-blood EBV DNA (Figure 2), which is consistent with previous studies[30,31]. However, monitoring patients after SOT using EBV DNA indicators alone may be insufficient. Studies have reported that post-transplantation lymphoproliferative disorder (PTLD) may develop without a further increase in EBV-DNA in WB, and EBV-DNA testing in different specimen types or complementary tests is required[32]. Routine screening of EBV-DNA in whole blood appears to be a useful tool supplemented by EBV-load measurement in plasma to discriminate chronically high EBV-load carriers without the risk of PTLD from those who are at risk of PTLD[33].
Moreover, we observed that patients aged 0–3 years had the highest median WBEBV level among all participants at 10,410 copies/mL, which was significantly higher than that reported by others[34]. The primary reason was that 85.22% (611/717) of the children aged 0–3 years in this study received liver transplantations. However, no statistically significant differences were observed between the median EBV DNA levels of the KT and HC groups. Lazzarotto et al. also reported a weak correlation between EBV DNA in plasma and whole blood samples from kidney transplant recipients[35]. This may be attributed to several factors, including immunosuppression, inflammation, and senescence, in kidney transplant patients. These factors play a crucial role in viral reactivation and the expansion of EBV-positive B cells[36].
In the APH subgroup analysis, the median EBV DNA level was higher in the IM group than that in the LNH group. This difference suggests an association between primary EBV infection and elevated EBV DNA levels[37]. Among all the TP subgroups, LT had the highest median EBV DNA. According to literature, the presence of a high post-transplant EBV viral load may be related to PTLD, which is a clinically heterogeneous and potentially fatal complication of pediatric liver transplantation (PLT)[38]. The presence of high levels of EBV DNA following transplantation was associated with an increased risk of PTLD in a multivariate analysis[39]. In the Le subgroup, the median EBV-DNA level in LL was higher than that in Mol. Previous studies have reported that patients infected with EBV show an imbalance in lymphocyte subsets and immune dysfunction, and the peripheral blood lymphocyte count is a risk factor for death in EBV-infected patients[40].
Our study demonstrates that EBV infection is associated with certain diseases, although it is often detected in healthy individuals. The level of EBV DNA load is closely linked to factors such as patient age, specific diseases, targeted cells, hyperinflammatory status[41], and immune response. Notably, a high EBV-DNA load may be related to the suppression of the immune status[42,43]; therefore, the EBV-DNA level could potentially serve as an indicator of the immune status in patients with reactivation. The “U”-shaped age distribution of EBV-DNA levels and the higher levels of EBV-DNA in HIV-infected patients further supported the above conclusion.
-
This study has several limitations. First, as a cross-sectional study, we were unable to establish a causal relationship between a high whole-blood EBV load at baseline and malignancy. Second, because the data were obtained from the patient system, we were unable to analyze the dynamic EBV levels at our time points. Third, owing to the lack of prognostic data, conducting a long-term follow-up of patients with a high baseline EBV load to further confirm the relationship between baseline EBV load and prognostic outcomes was not possible. Finally, it did not consider unmeasured potential confounding factors, such as co-infection with other pathogens.
-
Our study demonstrated that the prevalence of EBV infection is low in the healthy population in the Zhejiang region, China, and that a high EBV load at baseline is more common in LT, IM, and LL. The present study is a large-sample survey to characterize the prevalence of whole-blood EBV levels for various diseases, including stages and subtypes. Although no clear correlation was observed between malignancy and a high baseline EBV DNA load in whole blood samples, the EBV detection rate was higher in patients with cancer than in those without cancer. Our study provides clinicians with baseline information regarding EBV-associated diseases.
doi: 10.3967/bes2024.101
Disparities in the Levels of Whole-Blood Epstein-Barr Virus between the Cancer and Non-Cancer Populations in Zhejiang, China
-
Abstract:
Objective This study aimed to investigate the prevalence of Epstein-Barr virus (EBV) infection in patients with and without cancer. Methods A total of 26,648 participants who underwent whole-blood EBV DNA (WBEBV) assays between January 1, 2020, and August 31, 2023, were included. The chi-square test was used for categorical data analysis, and R software was used to analyze the differences in EBV DNA load levels and the diagnostic capabilities of WBEBV. Results Positive rates were 10.2% and 25.4% for healthy controls (HC) and patients, respectively. The positivity rate for EBV-associated neoplasms (EN) was the highest at 7.53%, followed by leukemia (Le) at 5.49%. The subgroup analysis showed that the positivity rate for abnormal proliferation or hyperplasia (APH) was 31.9%, followed by 30.5% for Le. The WBEBV of patients with transplants (TP), especially living-related transplants (LT), was the highest among all subgroups. WBEBV at diagnosis was used to differentiate between infectious mononucleosis (IM) and chronic active Epstein-Barr virus (CAEBV), with a sensitivity of 67.4% (95% confidence interval [CI]: 57.6–75.8) and specificity of 72% (95% CI: 63.3–79.3). We conclude that the prevalence of EBV infection is low in the healthy population in this region and that a high EBV load at baseline is more common in LT, IM, and Lymphocyte Leukemia (LL). Conclusion This study used a large-sample survey to characterize the prevalence of whole-blood EBV levels in various diseases, including the stages and subtypes. The EBV detection rate was higher in patients with malignant disease than in those with benign disease. Our study provides clinicians with baseline information regarding EBV-associated diseases. -
Key words:
- Epstein-Barr virus /
- Epstein-Barr virus DNA /
- Whole blood Epstein-Barr virus DNA /
- Viral load
注释:1) CONFLICTS OF INTEREST: -
Figure 1. Quantitative detection of whole-blood EBV-DNA levels in different age and sex groups. (A) The box plot comparing the whole-blood EBV-DNA levels of patients in different age groups; (B) The box plot comparing the levels in the male and female groups. EBV, Epstein-Barr virus.
Figure 2. Differences in whole-blood EBV-DNA levels across diseases.
(A) The sort box plot showing the whole-blood EBV-DNA levels for the six disease groups and the HC group, ranked from highest to lowest. (B) The boxplots illustrating the whole-blood EBV-DNA across different diseases. (C) The sort box plot presents the whole-blood EBV-DNA levels of subgroups within the six diseases mentioned above. The Healthy Control (HC) group serves as the control group. The abbreviations used are as follows: APH: abnormal proliferation or hyperplasia; EN: EBV-associated neoplasm; Le: leukaemia; Ne: neoplasm (other); SLE: systemic lupus erythematosus; TP: transplant; IM: infectious mononucleosis; LNH: lymph-node hyperplasia; NPC: nasopharyngeal carcinoma; Ly: lymphoma; GC: gastric cancer; MoL: monocyte leukaemia; GL: granulocyte leukaemia; LL: lymphocyte leukaemia; MyL: myelocytic leukemia; MM: multiple myeloma; LC: liver cancer; CC: colorectal cancer; MDS: myelodysplastic syndrome; SEL: systemic lupus erythematosus; LT: liver transplantation; KT: kidney transplantation; ST: stem-cell transplantation.
Figure 3. Sankey plot illustrating the relationship between whole-blood EBV-DNA levels and different disease types. The term “EBV-DNA high” refers to whole blood EBV-DNA levels that are above the median of EBV-associated neoplasms, specifically 2,151 copies/mL. The category “EBV-associated neoplasm (EN)” encompasses nasopharyngeal carcinoma (NPC), lymphoma (Ly), and gastric cancer (GC). Other abbreviations used in the figure include APH (abnormal proliferation or hyperplasia), Le (leukaemia), Ne (neoplasm other than EN), SLE (systemic lupus erythematosus), TP (transplant), IM (infectious mononucleosis), LNH (lymph-node hyperplasia), MoL (monocyte leukaemia), GL (granulocyte leukaemia), LL (lymphocyte leukaemia), MyL (myelocytic leukemia), MM (multiple myeloma), LC (liver cancer), CC (colorectal cancer), MDS (myelodysplastic syndrome), SEL (systemic lupus erythematosus), LT (liver transplantation), KT (kidney transplantation), and ST (stem-cell transplantation). The category “malignant” includes EN, Le, Ne, and TP associated with malignancy, while “benign” includes healthy control (HC), APH, and SLE, as well as other TP.
Figure 4. Variation in whole-blood EBV-DNA levels across subgroups within these diseases. (A) Box plot showing the EBV-DNA levels between APH group. (B) Box plot showing the EBV-DNA levels among TP group. (C) Box plot showing EBV-DNA levels from co-infection patients. (D) Box plot showing EBV-DNA levels for different types of Le. (E) Box plot showing EBV-DNA levels for Le. (F) Box plot showing EBV-DNA levels for EN. (G) Box plot showing EBV-DNA levels for Ne; (H) Box plot showing EBV-DNA levels for Ly; (I) Box plot showing EBV-DNA levels for benign and malignant diseases. APH: abnormal proliferation or hyperplasia; EN: EBV-associated neoplasm; Le: leukaemia; Ne: neoplasm (other); SLE: systemic lupus erythematosus; TP: transplant; IM: infectious mononucleosis; LNH: lymph-node hyperplasia; NPC: nasopharyngeal carcinoma; Ly: lymphoma; GC: gastric cancer; MoL: monocyte leukaemia; GL: granulocyte leukaemia; LL: lymphocyte leukaemia; MyL: myelocytic leukemia; MM: multiple myeloma; LC: liver cancer; CC: colorectal cancer; MDS: myelodysplastic syndrome; SEL: systemic lupus erythematosus; LT: liver transplantation; KT: kidney transplantation; ST: stem-cell transplantation.
Table 1. Distribution of whole-blood EBV-DNA load detection results for different genders (n = 25,260)
Diseases Gender Age (IQR) EBV-DNA detectable (n) EBV-DNA undetectable (n) n Positive rate (%) P value# Abnormal Proliferation or Hyperplasia Male 43 (24, 60) 255 474 729 1.01 0.0105 Female 184 464 648 0.73 EBV-associated Neoplasm Male 41 (55, 65) 1,200 3,720 4,920 4.75 0.0005 Female 701 2,624 3,325 2.78 Healthy Control Male 25 (30, 41) 79 615 694 0.31 0.1201 Female 39 426 465 0.15 Leukaemia Male 48 (33, 59) 779 1,669 2,448 3.08 0.0397 Female 607 1,489 2,096 2.40 Neoplasm (other) Male 49 (58, 67) 893 2,948 3,841 3.54 0.0017 Female 454 1,840 2,294 1.80 Systemic Lupus Erythematosus Male 32 (51, 61) 56 102 158 0.22 0.0927 Female 147 377 524 0.58 Transplant Male 16 (37, 51) 427 1,239 1,666 1.69 0.0770 Female 414 1,038 1,452 1.64 Note. Data were presented as No., %, or median and inter-quartile range (IQR); #Comparison of the rates of detectable EBV-DNA in the whole-blood between males and females. EBV, Epstein-Barr virus.  下载: 导出CSV
Table 2. Diagnostic performance of the whole-blood EBV-DNA levels at diagnosis to distinguish CAEBV from other EBV-infections
Diseases Abbreviation# Threshold
(log10 DNA)EBV-DNA load (copies/mL) Sensitivity
(%, 95% CI)Specificity
(%, 95% CI)AUC (95% CI) P value CC 3.362 2300.91 41.4 (36.2–46.9) 73 (63.38–79.38) 56.5 (50.5–62.5) 0.0367 MDS 3.450 2820.98 42.14 (37–47.5) 77.1 (68.8–83.8) 60.4 (54.6–66.2) 0.0007 IM 3.363 2305.69 67.4 (57.6–75.8) 72 (63.3–79.3) 73.2 (66.3–80.1) < 0.0001 NPC 3.358 2280.87 48.8 (42.5–55) 72 (63.3–79.3) 61.6 (55.5–67.7) 0.0004 SLE 3.013 1030.86 71.4 (64.9–77.2) 44.9 (36.2–53.9) 57.5 (50.9–64) 0.026 LNH 3.447 2800.92 63.4 (57.5–68.9) 60.3 (48.4–71.1) 63.8 (56.8–70.8) 0.0004 LL 3.451 2825.53 64.9 (59.3–70.1) 60.3 (48.4–71.1) 62.5 (55.1–69.8) 0.0014 Ly 3.445 2786.12 62 (59–64.9) 60.3 (48.4–71.1) 62.1 (55.8–68.5) 0.0008 MyL 3.446 2791.26 59 (54.1–63.8) 60.3 (48.4–71.1) 59.3 (52.2–66.5) 0.0138 Note. Data were presented as No., or median (interquartile range). AUC, area under the curve; CAEBV: Chronic active Epstein-Barr virus; CC: colorectal cancer; LNH: lymph-node hyperplasia; LL: lymphocyte leukaemia; Ly: lymphoma; MDS: myelodysplastic syndrome; IM: infectious mononucleosis; MyL: myelocytic leukemia; NPC: nasopharyngeal carcinoma; SLE: systemic lupus erythematosus. #Diseases with P value < 0.05 were listed.
下载: 导出CSV
-
[1] Baer R, Bankier AT, Biggin MD, et al. DNA sequence and expression of the B95-8 Epstein-Barr virus genome. Nature, 1984; 310, 207−11. doi: 10.1038/310207a0 [2] Zhang BC, Choi IK. Facts and hopes in the relationship of EBV with cancer immunity and immunotherapy. Clin Cancer Res, 2022; 28, 4363−9. doi: 10.1158/1078-0432.CCR-21-3408 [3] Teow SY, Liew K, Khoo ASB, et al. Pathogenic role of exosomes in epstein-barr virus (EBV)-associated cancers. Int J Biol Sci, 2017; 13, 1276−86. doi: 10.7150/ijbs.19531 [4] Xian RR, Ambinder RF. Cell-free circulating tumor DNA and epstein-barr virus DNA for early diagnosis of Epstein-Barr virus-associated cancers. J Clin Oncol, 2023; 41, 4290−2. doi: 10.1200/JCO.23.00687 [5] Peng HQ, Li ZZ, Long YJ, et al. Clinical value of a plasma Epstein-Barr virus DNA assay in the diagnosis of recurrent or metastatic nasopharyngeal carcinoma: a meta-analysis. Biosci Rep, 2019; 39, BSR20190691. doi: 10.1042/BSR20190691 [6] Al-Khreisat MJ, Ismail NH, Tabnjh A, et al. Worldwide prevalence of Epstein-Barr virus in patients with burkitt lymphoma: a systematic review and meta-analysis. Diagnostics (Basel), 2023; 13, 2068. doi: 10.3390/diagnostics13122068 [7] Hirabayashi M, Traverse-Glehen A, Combes JD, et al. Estimating the prevalence of Epstein-Barr virus in primary gastric lymphoma: a systematic review and meta-analysis. Infect Agent Cancer, 2023; 18, 8. doi: 10.1186/s13027-023-00482-2 [8] Bjornevik K, Cortese M, Healy BC, et al. Longitudinal analysis reveals high prevalence of Epstein-Barr virus associated with multiple sclerosis. Science, 2022; 375, 296−301. doi: 10.1126/science.abj8222 [9] Zheng Q, Zhu K, Gao CN, et al. Prevalence of Epstein-Barr virus infection and characteristics of lymphocyte subsets in newly onset juvenile dermatomyositis. World J Pediatr, 2021; 17, 205−9. doi: 10.1007/s12519-019-00314-7 [10] Bogers L, Kuiper KL, Smolders J, et al. Epstein-Barr virus and genetic risk variants as determinants of T-bet+ B cell-driven autoimmune diseases. Immunol Lett, 2023; 261, 66−74. doi: 10.1016/j.imlet.2023.07.006 [11] Villafuerte DB, Lavrynenko O, Qazi R, et al. Chronic active Epstein-Barr exacerbated by COVID-19 co-infection. Int J Infect Dis, 2022; 122, 976−8. doi: 10.1016/j.ijid.2022.07.046 [12] Chen XT, Li H, Wu CL, et al. Epstein‒Barr virus and human herpesvirus 6 infection in patients with systemic lupus erythematosus. Virol J, 2023; 20, 29. doi: 10.1186/s12985-023-01987-3 [13] Yan M, Zhang Y, Yang F, et al. Comparative study between chronic immune thrombocytopenia patients and healthy population on Epstein-Barr virus infection status by polymerase chain reaction. Expert Rev Hematol, 2020; 13, 781−6. doi: 10.1080/17474086.2020.1772746 [14] Wu YM, Yan J, Chen LL, et al. Infection frequency of Epstein-Barr virus in subgingival samples from patients with different periodontal status and its correlation with clinical parameters. J Zhejiang Univ Sci B, 2006; 7, 876−83. doi: 10.1631/jzus.2006.B0876 [15] Li JY, Chen XP, Tie YQ, et al. Detection of low-load Epstein-Barr virus in blood samples by enriched recombinase aided amplification assay. AMB Express, 2022; 12, 71. doi: 10.1186/s13568-022-01415-9 [16] Shen ZY, Hu LL, Yao MK, et al. Disparity analysis and prognostic value of pretreatment whole blood Epstein-Barr virus DNA load and Epstein-Barr encoding region status in lymphomas: A retrospective multicenter study in Huaihai Lymphoma Working Group. Int J Cancer, 2022; 150, 327−34. doi: 10.1002/ijc.33802 [17] Kimura H, Cohen JI. Chronic active Epstein-Barr virus disease. Front Immunol, 2017; 8, 1867. doi: 10.3389/fimmu.2017.01867 [18] Ito Y, Suzuki M, Kawada JI, et al. Diagnostic values for the viral load in peripheral blood mononuclear cells of patients with chronic active Epstein-Barr virus disease. J Infect Chemother, 2016; 22, 268−71. doi: 10.1016/j.jiac.2015.11.002 [19] Kawada JI, Ito Y, Ohshima K, et al. Updated guidelines for chronic active Epstein-Barr virus disease. Int J Hematol, 2023; 118, 568−76. doi: 10.1007/s12185-023-03660-5 [20] Tseng YJ, Ding WQ, Zhong L, et al. Chronic active Epstein-Barr virus (CAEBV) enteritis. Int J Infect Dis, 2019; 82, 15−7. doi: 10.1016/j.ijid.2019.02.020 [21] Wang JS, Su M, Wei N, et al. Chronic active Epstein-Barr virus disease originates from infected hematopoietic stem cells. Blood, 2024; 143, 32−41. doi: 10.1182/blood.2023021074 [22] Rzepka M, Depka D, Gospodarek-Komkowska E, et al. Diagnostic value of whole-blood and plasma samples in Epstein-Barr virus infections. Diagnostics (Basel), 2023; 13, 476. doi: 10.3390/diagnostics13030476 [23] Gao WA, Wu JH, Han YY, et al. Study on diagnostic value of results of EB virus nucleic acid quantification in whole blood lymphocyte and serum in children with EB virus infection. Cytokine, 2022; 155, 155902. doi: 10.1016/j.cyto.2022.155902 [24] Zhou XH, Liang JH, Wang L, et al. High viral loads of circulating Epstein-Barr virus DNA copy number in peripheral blood is associated with inferior prognosis in patients with mantle cell lymphoma. J Cancer, 2020; 11, 4980−8. doi: 10.7150/jca.37484 [25] Zeng MC, Jia QJ, Chen JJ, et al. High plasma EBV-DNA load and positive EBER status associated with viral recurrence and persistent infection in early treatment of lymphoma. Clin Exp Med, 2023; 23, 1307−16. [26] Zhu J, Fang RH, Pan ZW, et al. Circulating lymphocyte subsets are prognostic factors in patients with nasopharyngeal carcinoma. BMC Cancer, 2022; 22, 716. doi: 10.1186/s12885-022-09438-y [27] Chen WJ, Xu WN, Wang HY, et al. Plasma Epstein-Barr virus DNA and risk of nasopharyngeal carcinoma in a prospective seropositive population. BMC Cancer, 2021; 21, 651. doi: 10.1186/s12885-021-08408-0 [28] Hua L, Chen SJ, Wei MZ, et al. Predictive value of ERCC1 mRNA level from receiver-operator characteristic and pretreatment EBV-DNA virus load in stage II nasopharyngeal carcinoma patients receiving intensity-modulated radiotherapy with concurrent Cisplatin. Cancer Biother Radiopharm, 2022; 37, 2−10. [29] Fishman JA. Infection in organ transplantation. Am J Transplant, 2017; 17, 856−79. doi: 10.1111/ajt.14208 [30] Holmes RD, Orban-Eller K, Karrer FR, et al. Response of elevated Epstein-Barr virus DNA levels to therapeutic changes in pediatric liver transplant patients: 56-month follow up and outcome. Transplantation, 2002; 74, 367−72. doi: 10.1097/00007890-200208150-00013 [31] Styczynski J, van der Velden W, Fox CP, et al. Management of Epstein-Barr Virus infections and post-transplant lymphoproliferative disorders in patients after allogeneic hematopoietic stem cell transplantation: Sixth European Conference on Infections in Leukemia (ECIL-6) guidelines. Haematologica, 2016; 101, 803−11. doi: 10.3324/haematol.2016.144428 [32] Kullberg-Lindh C, Olofsson S, Brune M, et al. Comparison of serum and whole blood levels of cytomegalovirus and Epstein-Barr virus DNA. Transpl Infect Dis, 2008; 10, 308−15. doi: 10.1111/j.1399-3062.2008.00313.x [33] Ruf S, Behnke-Hall K, Gruhn B, et al. Comparison of six different specimen types for Epstein-Barr viral load quantification in peripheral blood of pediatric patients after heart transplantation or after allogeneic hematopoietic stem cell transplantation. J Clin Virol, 2012; 53, 186−94. doi: 10.1016/j.jcv.2011.11.010 [34] Piralam B, Prosperi C, Thamthitiwat S, et al. Pneumococcal colonization prevalence and density among Thai children with severe pneumonia and community controls. PLoS One, 2020; 15, e0232151. doi: 10.1371/journal.pone.0232151 [35] Lazzarotto T, Chiereghin A, Piralla A, et al. Kinetics of cytomegalovirus and Epstein-Barr virus DNA in whole blood and plasma of kidney transplant recipients: Implications on management strategies. PLoS One, 2020; 15, e0238062. doi: 10.1371/journal.pone.0238062 [36] Petrara MR, Serraino D, Di Bella C, et al. Immune activation, immune senescence and levels of Epstein Barr Virus in kidney transplant patients: Impact of mTOR inhibitors. Cancer Lett, 2020; 469, 323−31. doi: 10.1016/j.canlet.2019.10.045 [37] Montani MSG, Santarelli R, Granato M, et al. EBV reduces autophagy, intracellular ROS and mitochondria to impair monocyte survival and differentiation. Autophagy, 2019; 15, 652−67. doi: 10.1080/15548627.2018.1536530 [38] Walabh P, Moore DP, Hajinicolaou C. Post-transplant lymphoproliferative disorder in pediatric liver transplant recipients: Experience from a South African transplant center. Transpl Infect Dis, 2024; 26, e14221. doi: 10.1111/tid.14221 [39] Seo E, Kim J, Oh SH, et al. Epstein-Barr viral load monitoring for diagnosing post-transplant lymphoproliferative disorder in pediatric liver transplant recipients. Pediatr Transplant, 2020; 24, e13666. doi: 10.1111/petr.13666 [40] Lin JC, Chen XK, Wu HM, et al. Peripheral blood lymphocyte counts in patients with infectious mononucleosis or chronic active Epstein-Barr virus infection and prognostic risk factors of chronic active Epstein-Barr virus infection. Am J Transl Res, 2021; 13, 12797−806. [41] Zhang J, Qin SC, Jin Z, et al. The clinical significance and prognostic role of whole-blood Epstein-Barr virus DNA in lymphoma-associated hemophagocytic lymphohistiocytosis. J Clin Immunol, 2023; 43, 1302−10. doi: 10.1007/s10875-023-01493-9 [42] Liu QF, Xuan L, Liu H, et al. Molecular monitoring and stepwise preemptive therapy for Epstein-Barr virus viremia after allogeneic stem cell transplantation. Am J Hematol, 2013; 88, 550−5. doi: 10.1002/ajh.23452 [43] Thieme CJ, Schulz M, Wehler P, et al. In vitro and in vivo evidence that the switch from calcineurin to mTOR inhibitors may be a strategy for immunosuppression in Epstein-Barr virus-associated post-transplant lymphoproliferative disorder. Kidney Int, 2022; 102, 1392−408. doi: 10.1016/j.kint.2022.08.025 -

 点击查看大图
计量
- 文章访问数: 1299
- HTML全文浏览量: 594
- PDF下载量: 81
- 被引次数: 0

 Quick Links