

 下载:
下载:


-
Prion diseases, also known as transmissible spongiform encephalopathies (TSEs), encompass a range of fatal degenerative disorders that affect the central nervous system (CNS) in humans and various mammals[1,2]. The causative agents of these pathologies are prion, self-replicating protein devoid of nucleic acids. According to the current knowledge, the fundamental concept underlying prion diseases/infectivity involves the conformational conversion of cellular prion protein (PrPC), which is normally expressed in the CNS and other tissues, to infectious and pathogenic scrapie prion protein (PrPSc). This conversion can occur spontaneously, or can be triggered by genetic mutations or exogenous infections. In addition to the widespread deposition of PrPSc, the CNS exhibits neuronal loss and reactive proliferation of glial cells, in addition to the activation of innate or nonspecific immunity mechanisms, such as microglial activation, complement system activation, and increased levels of various cytokines and chemokines[3].
The innate immune system is a crucial host defence response aimed at eradicating invading infectious agents. The activation of glial cells and various inflammatory factors in brain tissue is frequently observed in both acute and chronic CNS infectious diseases, highlighting their significance as integral components of the innate immune system. Furthermore, patients suffering from neurodegenerative diseases also exhibit activation of the CNS innate immune system, which is closely associated with aberrant deposits of aggregated and misfolded proteins, such as amyloid-β in Alzheimer disease (AD), α-synuclein in Parkinson disease (PD), and prions in prion disease[4]. The abnormal upregulation of numerous cytokines, including chemokine (C-X-C motif) ligand 10 (CXCL10), also known as interferon gamma-induced protein 10 (IP10), has further been described in the brains of various scrapie-infected experimental mouse models, as well as in the cerebral spinal fluid (CSF) and brains of patients with Creutzfeldt-Jacob disease (CJD) patients[5-11].
Chemokines are a group of small-molecular-weight proteins ranging from 8 to 10 kDa, which can be classified into four main subfamilies based on the arrangement of cysteine residues in the N-terminus: CXC, CC, CX3C, and XC[12,13]. IP10 is a secretory protein with a molecular weight of 10 kDa that belongs to the CXC subfamily. IP10 induces chemotactic responses in monocytes, macrophages, and other immune cells, including T cells, NK cells, and DC cells[14]. Additionally, IP10 plays important roles in various physiological activities, such as white blood cell transport, acquired immune response, inflammation, hematopoiesis, and angiogenesis[15-21]. IP10 functionality is mediated by its binding to the chemokine receptor CXCR3[22], which is a G protein-coupled receptor (GPCR) comprising seven transmembrane units. The primary ligands of CXCR3 include CXCL9, CXCL10, and CXCL11[14,23,24]. Previous studies using Luminex assay and ELISA have demonstrated abnormal elevations of IP10 levels in the brain tissues of mice infected with different scrapie agents, meanwhile, a slight increase in IP10 levels has been observed in cerebrospinal fluid (CSF) samples extracted from patients with sporadic Creutzfeldt-Jakob disease[25]. However, the morphological distribution of IP10 and the potential alteration of CRCX3 in the brains of patients with prion diseases remain unclear.
In the present study, we observed that increased IP10 signals in the brain tissues of scrapie-infected mice were mainly localized to neurons. Further, we found that levels of CXCR3 were significantly elevated in the brains of both scrapie-infected mice and the prion infected cell line SMB-S15, with increased CXCR3 primarily distributed in neurons and activated microglia. We further noted clear colocalizations between PrP/PrPSc and IP10/CXCR3 in the brain tissues of scrapie-infected mice, particularly within regions with higher PrPSc deposits. Using coimmunoprecipitation assays and a biomolecular interaction analysis system, we further identified evidence of the molecular interactions between PrP and IP10/CXCR3. Furthermore, increased IP10 accumulation was observed in SMB-S15 cells compared to their normal partner cell line SMB-PS; however, the removal of prion replication by resveratrol decreased intracellular accumulation, while increasing secretion.
-
Brain samples from C57BL/6 mice intracerebrally inoculated with mouse-adapted scrapie strains 139A and ME7 were used as models in this study. Detailed descriptions of the clinical, neuropathological, and pathogenic features of the infected mice have been previously reported[26,27]. The mean incubation periods for 139A-, and ME7-infected mice were 183.9 ± 23.1 and 184.2 ± 11.8 days, respectively. Age-matched healthy mice were used as controls.
-
Brain homogenates were prepared as previously described[27]. In brief, brain tissues extracted from infected and control mice were washed three times with TBS (10 mmol/L Tris-HCl, 133 mmol/L NaCl, pH 7.4). Subsequently, 10% (w/v) brain homogenates were prepared in a cold lysis buffer (100 mmol/L NaCl, 10 mM EDTA, 0.5% Nonidet P-40, 0.5% sodium deoxycholate, 10 mmol/L Tris, pH 7.5), supplemented with protease inhibitor cocktail set III (Merck, 535140, Germany). Tissue debris were eliminated by low-speed centrifugation at 2000 ×g for 10 min, and the resulting supernatants were collected for further analysis.
-
The prion cell line SMB-S15 and the normal control cell line SMB-PS were provided by the Roslin Institute, UK[28]. SMB-S15 cells were derived from the mesodermal tissue of mice clinically exposed to the scrapie agent Chandler, and has consistently been shown to replicate PrPSc through cell passage. The SMB-PS cell line was obtained from PS-treated SMB-S15 cells, with pentosane sulfate (PS) resulting in undetectable levels of PrPSc[29]. All cells were cultured in Dulbecco’s modified Eagle’s medium (DMEM), supplemented with 10% fetal bovine serum (FBS) at a temperature of 33 °C under a humidified atmosphere containing 5% CO2. Confluent cells were passaged every 7 to 10 days using trypsin/EDTA (0.05% porcine trypsin and 0.02% EDTA), and the medium was changed every 3 to 4 days.
-
After washing three times in phosphate buffered saline (PBS), cultured cells were scraped and harvested by centrifugation at 500×g for 10 min. The pellets were subsequently lysed for 1 h using cell protein extraction reagent (CW BioTech, CW0889, China), supplemented with protease inhibitor cocktail set III (1%, v/v, Merck, 535140, Germany), followed by centrifugation at 500 ×g for 10 min to collect supernatants. The protein concentration was determined using a BCA Protein Assay Kit (Merck, 71285-3, Germany).
-
Ten microliters of scrapie-infected mouse brain tissue homogenates or SMB cell lysates were loaded and separated on 12% polyacrylamide gels and ran in Tris-glycine-SDS buffer (SDS-PAGE), before being transferred to nitrocellulose membranes (GE, 10600001, USA) using a semi-dry blotting system (Bio-Rad, USA). The membranes were then blocked at room temperature (RT) for 1 h with a solution of 5% (w/v) non-fat milk powder in 1×Tris-buffered saline containing 0.1% Tween 20 (TBST) followed by overnight incubation at 4 °C with rabbit-derived anti-CXCR3 antibody (Proteintech, 26756-1-AP, USA) diluted at a ratio of 1:2,000 and rabbit-derived anti-IP10 antibody (Abcam, ab9938, UK) diluted at a ratio of 1:1,000. After washing three times with TBST, the membranes were incubated with the corresponding horseradish peroxidase (HRP)-conjugated secondary antibodies at RT for 1 h. The blots were then developed using an enhanced chemiluminescence system (PerkinElmer, NEL103E001EA, USA), and visualized on autoradiography films (Carestream, 6535876, China). Images were captured using ChemiDoc™ XRS+ System equipped with Image Lab software (Bio-Rad, USA), while quantification was performed using Image J software.
-
Total brain RNAs from healthy and scrapie-infected mice were extracted using TRIzol reagent (Invitrogen, 15596026, USA), following the manufacturer’s instructions. Subsequently, both double- and single-stranded DNA in the samples were degraded using RNase-free DNase (Invitrogen, 2028724, USA). Reverse transcription was further performed using SuperScriptTM III First-Strand Synthesis System (Invitrogen, 2028724, USA). In brief, 2 μg of total RNA was mixed with 10 μL of RT Reaction Mix (2×), 2 μL of RT Enzyme Mix and DEPC-treated water to a final volume of 20 μL. The mixtures were then incubated at 25 °C for 10 min, followed by incubation at 50 °C for 30 min, and inactivated by heating at 85 °C for 5 min. To remove RNA from the cDNA, E. coli RNase H (1 μL) was added to the mixture and incubated at 37 °C for 20 min. Aliquots (2 μL) of the RT reaction products were then amplified by Real-Time PCR using primers designed and synthesized based on published mRNA sequences (
Supplementary Table S1 , available in www.besjournal.com).Real-time PCR was finally performed using Supermix containing SYBR Green fluorescent dye (TSINGKE, TSE202, China). In brief, a reaction mixture comprising reverse transcription product (1 μL), T5 Fast qPCR Mix (10 μL; diluted to a final concentration of × 2), primers (1 μL; final concentration: 10 μmol/L each), and Nuclease-free H2O (7 μL) were compiled in a total volume of 20 μL. PCR amplification was carried out using the CFX96 Real-Time PCR System (Bio-Rad, USA) under the following conditions: enzyme activation was performed at an initial temperature cycle consisting of denaturation step at 95 °C for 15 s, followed by annealing/extension step at 60 °C for 60 s, repeated over 40 cycles. The fluorescence signals were collected, and the expression level of each specific mRNA was determined relative to that of individual β-actin using the comparative Ct method (2−ΔΔCt). All real-time PCR reactions were performed in triplicate.
-
SMB-S15 and SMB-PS cells were washed with PBS, and fixed with 4% paraformaldehyde at RT for 20 min, permeabilized with 0.4% Triton X-100 for 5 min, and blocked with PBS containing 5% BSA at RT for 1 h. Subsequently, the fixed cells were incubated overnight at 4 °C with primary antibodies including rabbit-derived pAb anti-IP10 (diluted to 1:100), rabbit-derived pAb anti-CXCR3 (diluted to 1:100), mouse-derived mAb anti-PrP (Santa, sc-58581, USA) (diluted to 1:100). After washing three times with PBS, the fixed cells were incubated at RT for 1 h with Alexa Fluor-labeled secondary antibodies derived from goats against rabbit or mouse (both diluted 1:200). Finally, the cells were stained using DAPI (at a concentration of 1 μg/mL) for 5 min at RT. Targeted protein images were subsequently analyzed by high-resolution confocal microscopy using the Operetta EnSpire software. The integral optical density (IOD) values of each field-specific fluorescent stain were collected using this software. The IOD values of the specific staining relative to those of DAPI-specific staining represented the final IOD values of each field-specific fluorescence staining target.
Brain slices were permeabilized with 0.3% Triton X-100 for 20 min and subsequently blocked with BSA for 1 h. Following blocking, the sections were incubated overnight at 4 °C with rabbit-derived pAb anti-IP10 (1:100), mouse-derived mAb anti-GFAP (1:100, CST, 3670S, USA), rabbit-derived pAb anti-Iba-1 (1:100 Abcam, ab5076, UK), rabbit-derived pAb anti-Iba-1 (1:100, Sigma, SAB2702364, Germany), mouse-derived mAb anti-NeuN (1:100, Merck Millipore, MAB377, Germany), or rabbit-derived pAb anti-CXCR3 (1:100). Subsequently, the slices were washed and incubated with goat-derived anti-rabbit or anti-mouse secondary antibody at a concentration of 1:200 (v/v) for 1 h at 37 °C. After washing again, slices were stained with DAPI at a concentration of 1 μg/mL (Beyotime, China) for 30 min at RT before being sealed. Images depicting the targeted proteins were analyzed using a high-resolution confocal microscope (LEICA TCS SP8, Germany). The control results obtained using only secondary antibodies are presented in
Supplementary Figure S1A (available in www.besjournal.com). -
The brain tissue was fixed in a 10% buffered formalin solution, and paraffin sections (2 μm in thickness) were routinely prepared. After washing with PBS three times, the tissue slices were quenched with a 3% H2O2 solution for 10 min, and subjected to high temperature repair using a 1% sodium citrate solution in a microwave for 20 min. Following blocking with 5% bovine serum albumin (BSA) at RT for 15 min, the sections were incubated overnight at 4 °C with rabbit-derived pAb anti-IP10, rabbit-derived pAb anti-CXCR3, mouse-derived mAb anti-PrP antibodies diluted at a ratio of 1:100. Subsequently, the sections were incubated at 37 °C for 1 h with an HRP-conjugated goat-derived anti-rabbit or anti-mouse secondary antibody diluted to a ratio of 1:250, and visualized by incubation with DAB (3,3'-diaminobenzidine tetrahydrochloride). The slices were counterstained with hematoxylin, dehydrated, and mounted using Permount. The control results using only secondary antibodies are shown in Supplementary Figure S1B.
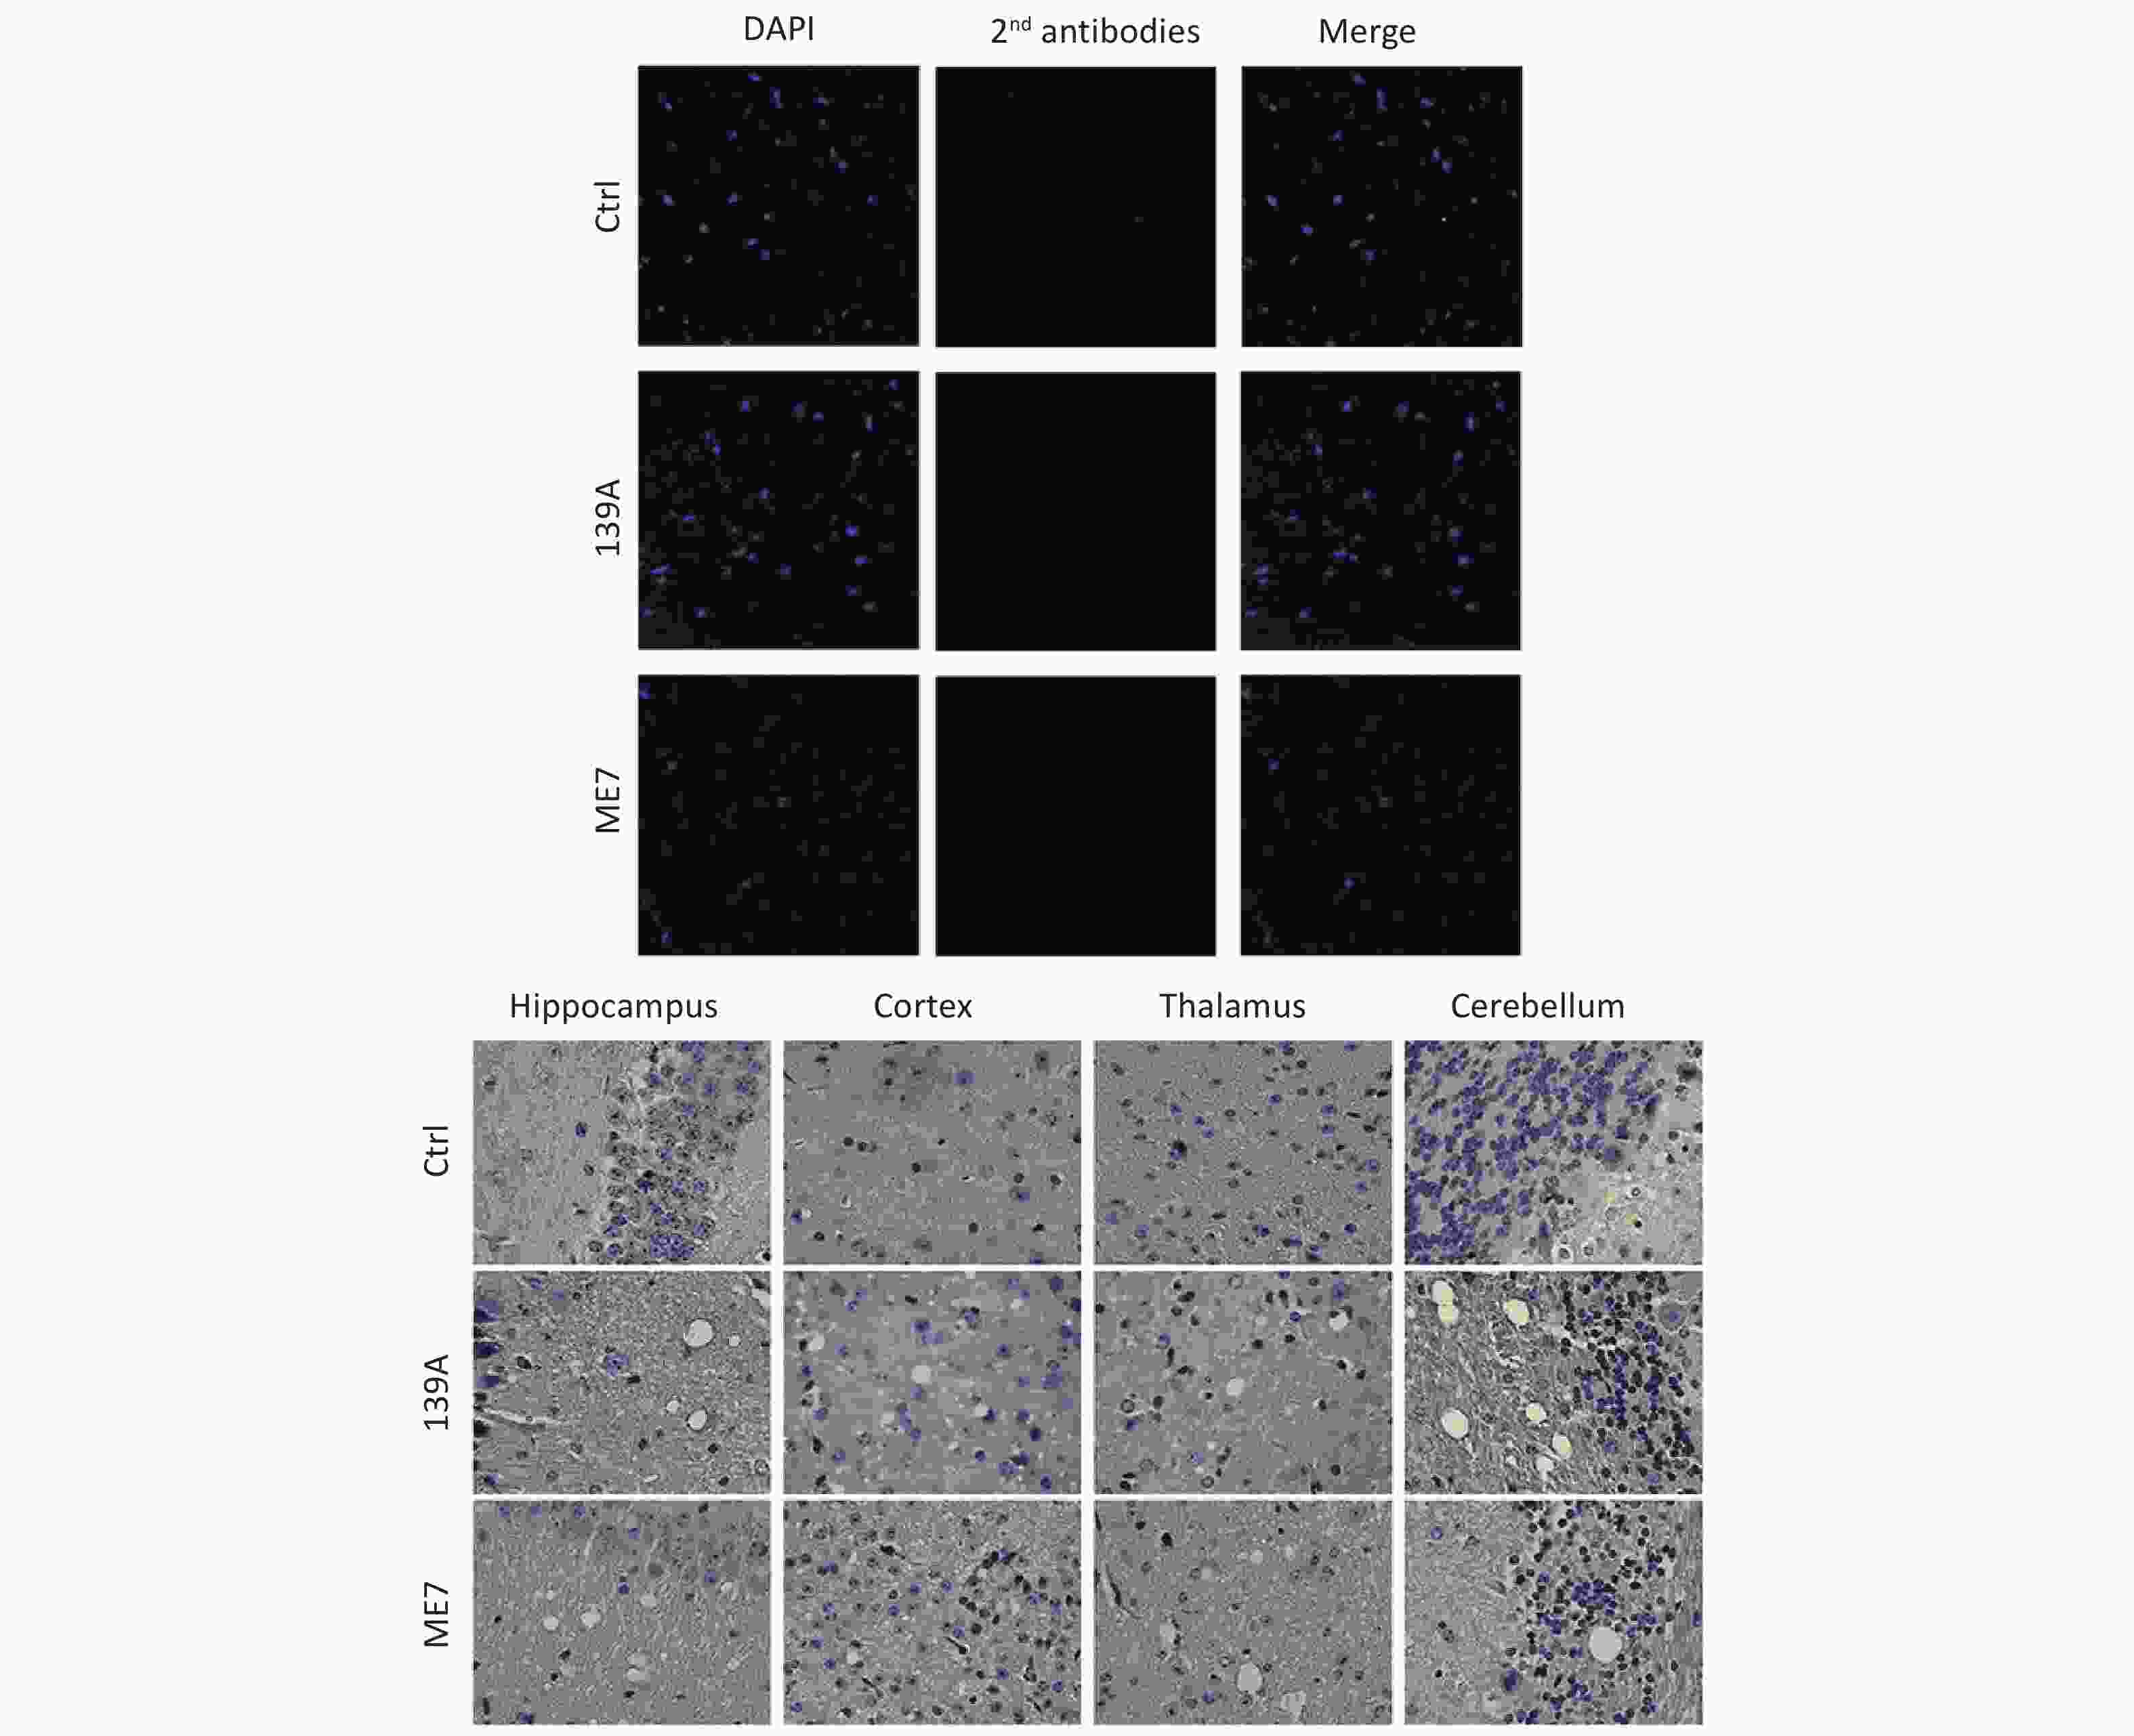
Figure S1. IF and IHC staining with only secondary antibodies in cortical regions of 139A/ME7-mouse models and age-matched healthy controls.
-
The IP10 levels in the whole cell lysate and medium were quantified using a commercially-available murine IP-10 precoated ELISA kit (NeoBioscience, EMC121.96, China). In brief, 10 μL of lysate was mixed with the manufacturer’s dilution buffer and added to duplicate wells of an antibody precoated plate. Subsequently, the plates were incubated at 37 °C for 90 min. After washing each well five times with 300 μL wash buffer, 100 μL of biotin-labeled antibodies were added and incubated at 37 °C for 60 min. Following another round of washing, HRP-conjugated streptavidin solution was added and incubated at 37 °C for 30 min. The reactions were finally developed by adding 100 μL substrate working solution in the dark for 15 min and terminated with stop solution. The OD450 values were measured using a microplate reader (Thermo Scientific, USA). The IP10 concentration was determined using the corresponding standard curve.
-
The cell lysate was aliquoted and used as the input control. A total of 20 mg of cell lysate was incubated at 4 °C overnight with Protein G Dynabeads pre-treated with 4 µg rabbit-derived anti-IP10 pAb or 4 µg mouse-derived anti-PrP mAb, respectively. After washing six times in PBS 0.05% Tween-20, the IP products were eluted using an elution buffer (50 mmol/L glycine, pH 2.8), and subjected to mouse-derived mAb anti-PrP specific western blot analysis, along with the corresponding input and isotype IgG.
-
Prokaryotic recombinant full-length human PrP (rHuPrP23-231) was expressed in E. coli strain BL21 (Tiangen, China). In brief, plasmid pQE30-HuPrP transformed bacteria were grown to an OD600 of 0.5–0.6 and induced with 0.5 mmol/L isopropyl-Dthiogalactoside (IPTG) at a final concentration of 0.5 µmol/L. Cells were harvested by centrifugation and resuspended in 0.01 mol/L PBS (pH 7.4), with 1 mmol/L phenylmethylsulfonyl fluoride (PMSF) as a protease inhibitor. Lysozyme was added to a final concentration of 2 mg/mL, while cells were lysed by incubation for 30 min and treated with sonication 24 times in power of 400 W at 10 s intervals. For purification of the proteins with the histidine tag, the soluble cell lysate was incubated with nickel-NTA agarose (Amersham Pharmacia Biotech, USA) and stirred at 4 °C for 30 min. HIS-fusion proteins were subsequently eluted according to the manufacturer’s guidelines. Protein concentrations were determined using the BCA method (Pierce, USA) prior to molecular interaction analysis.
-
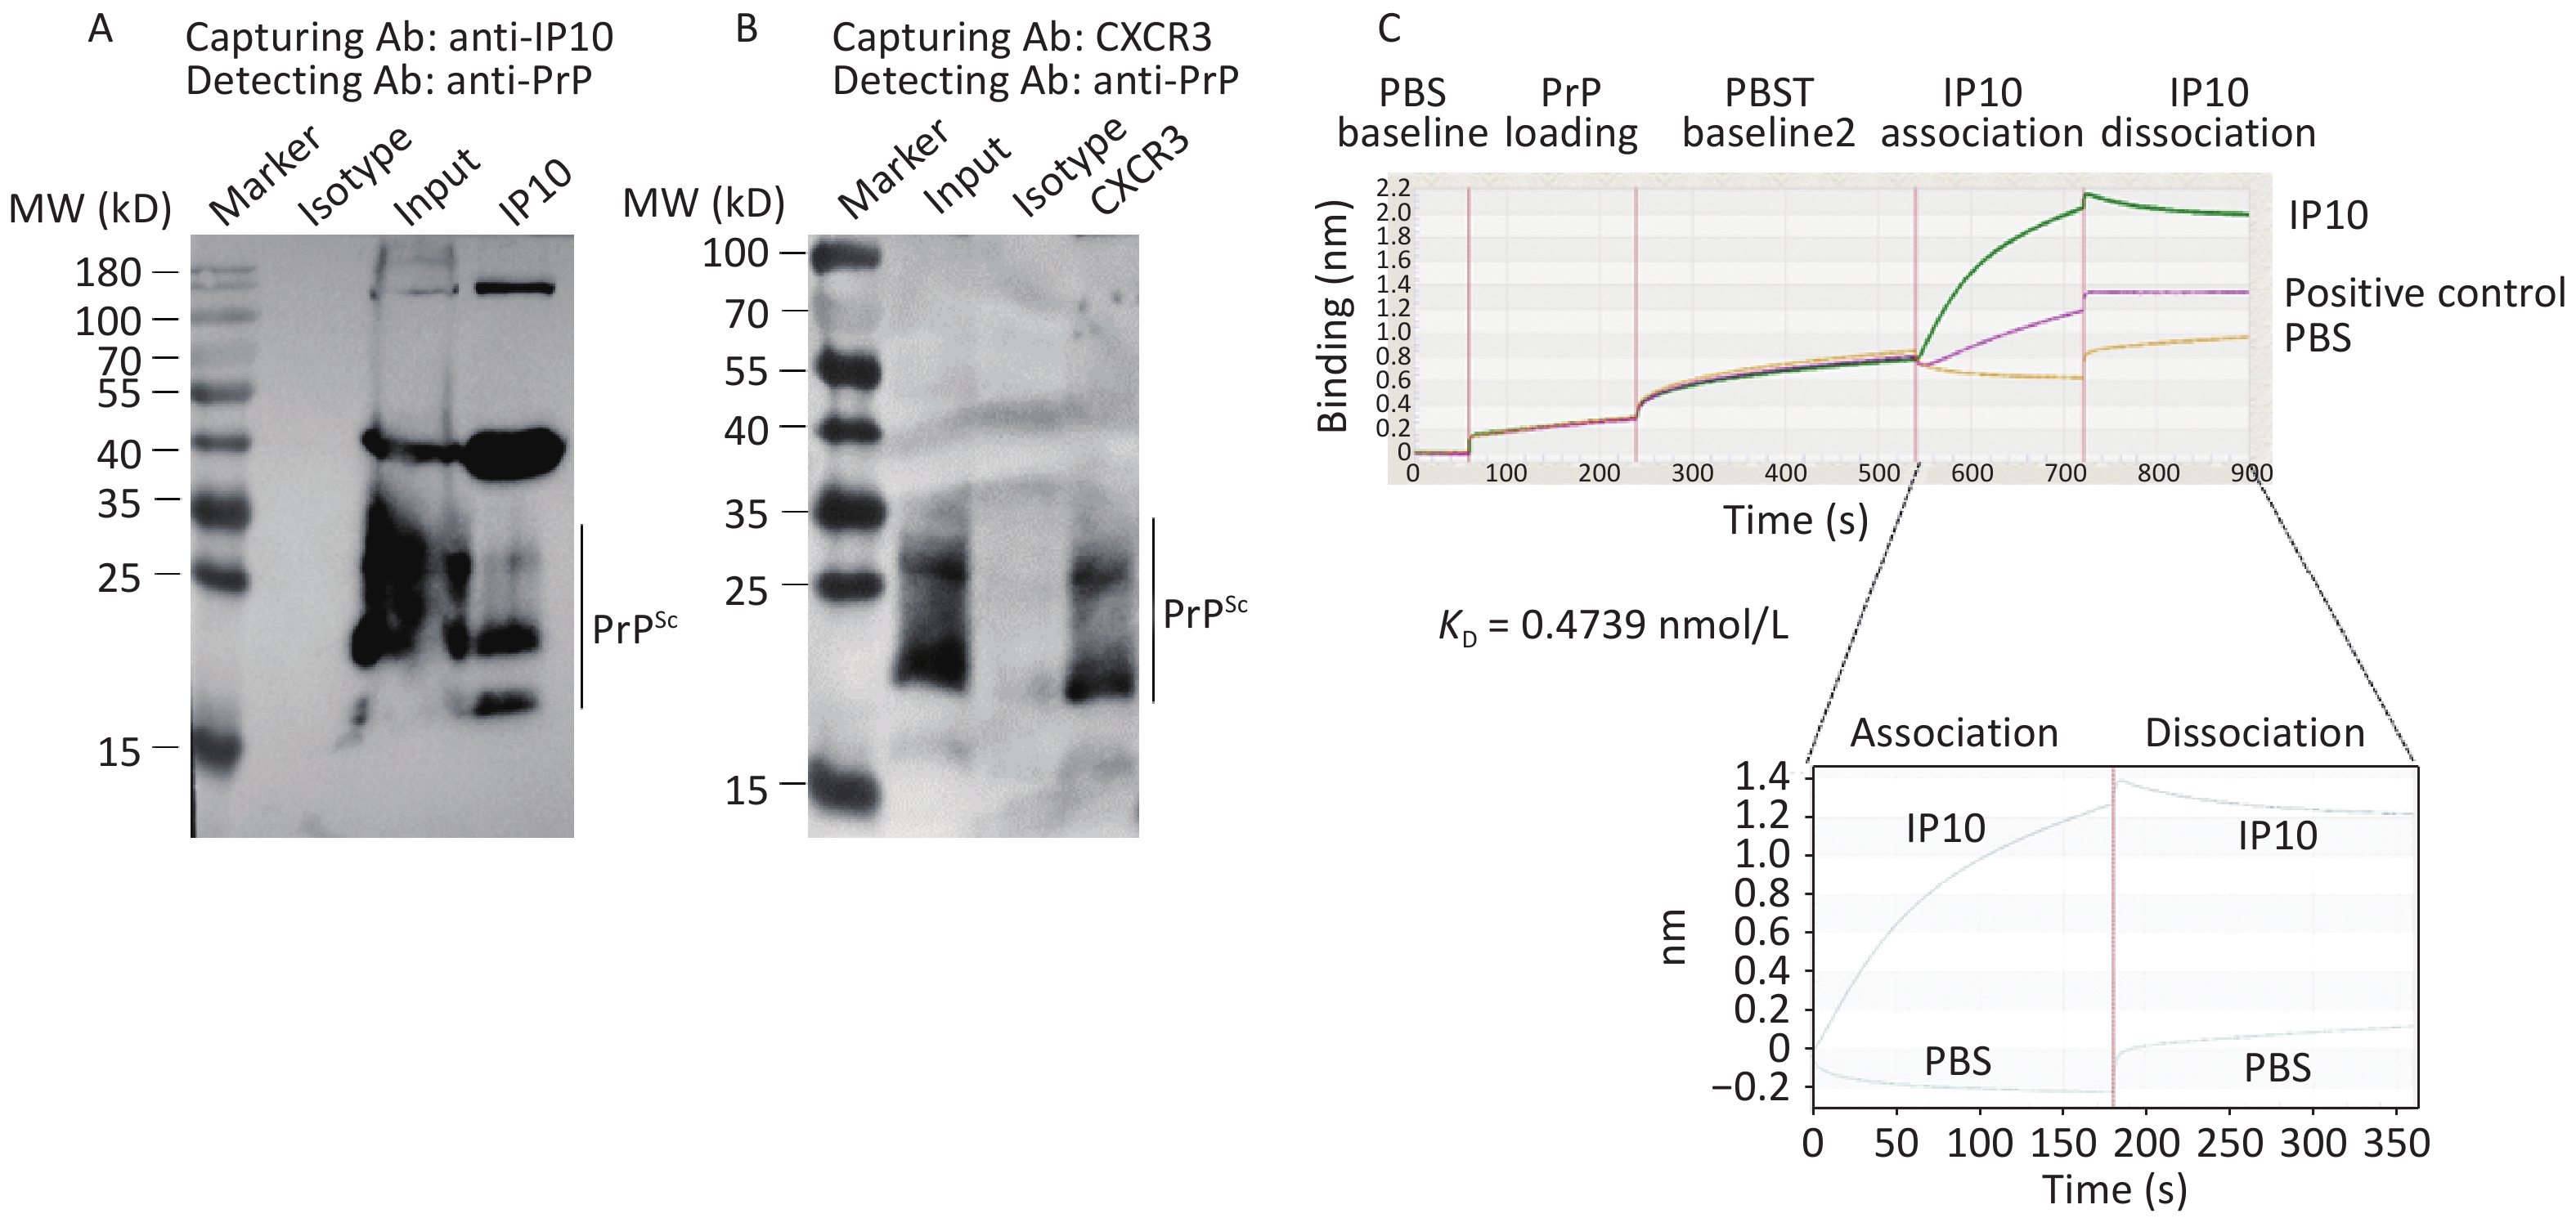
The interaction between recombinant IP10 and PrP was analyzed using Octet RED96 (ForteBio, USA). IP10 was purchased from a commercial biotechnology company (Abcam, Cambridge, USA). PrP was immobilized on a 96-well microplate with two-fold serially diluted antibodies in accordance with the manufacturer’s protocol. Subsequently, IP10 protein was injected into each well, and the binding responses of IP10-PrP were measured. The apparent equilibrium dissociation constants (apparent binding affinity, KD), representing the apparent binding affinity for each IP10-PrP interaction, were calculated using Octet® RED96 Software[30].
-
SMB-PS and SMB-S15 cells were harvested by routine trypsinization. Approximately 5 × 10⁵ cells from each cell line in 1 mL media were seeded into the lower chamber of a Transwell insert (Corning, 3421). The upper chamber of the transwell plate was then moistened with DMEM and carefully placed in the lower chamber. Approximately 1 × 10⁵ BV2 cells were subsequently added to the upper chamber. After incubation at 34 °C for 24 h, the upper chamber of the Transwell was gently removed and any excess BV2 cells on the membrane surface were wiped away using a moistened cotton swab. Following PBS washing, the membrane was stained with 0.1% crystal violet, and cell counting was performed under a light microscope.
-
Statistical analyses were performed using the Statistical Package for the Social Sciences version 22.0. The quantified IFA levels are presented as the IOD, which denotes the cumulative reaction intensities of all selected objects within the field of view, and was conducted using ImageJ software. All experiments in this study were repeated at least three times, with consistent results. The data were presented as the mean + SEM. Differences between the two groups were assessed using a two-tailed Student’s t test to determine P values, which are indicated in the figures or denoted as *** (P < 0.001), ** (P < 0.01), * (P < 0.05), and ns (not significant).
-
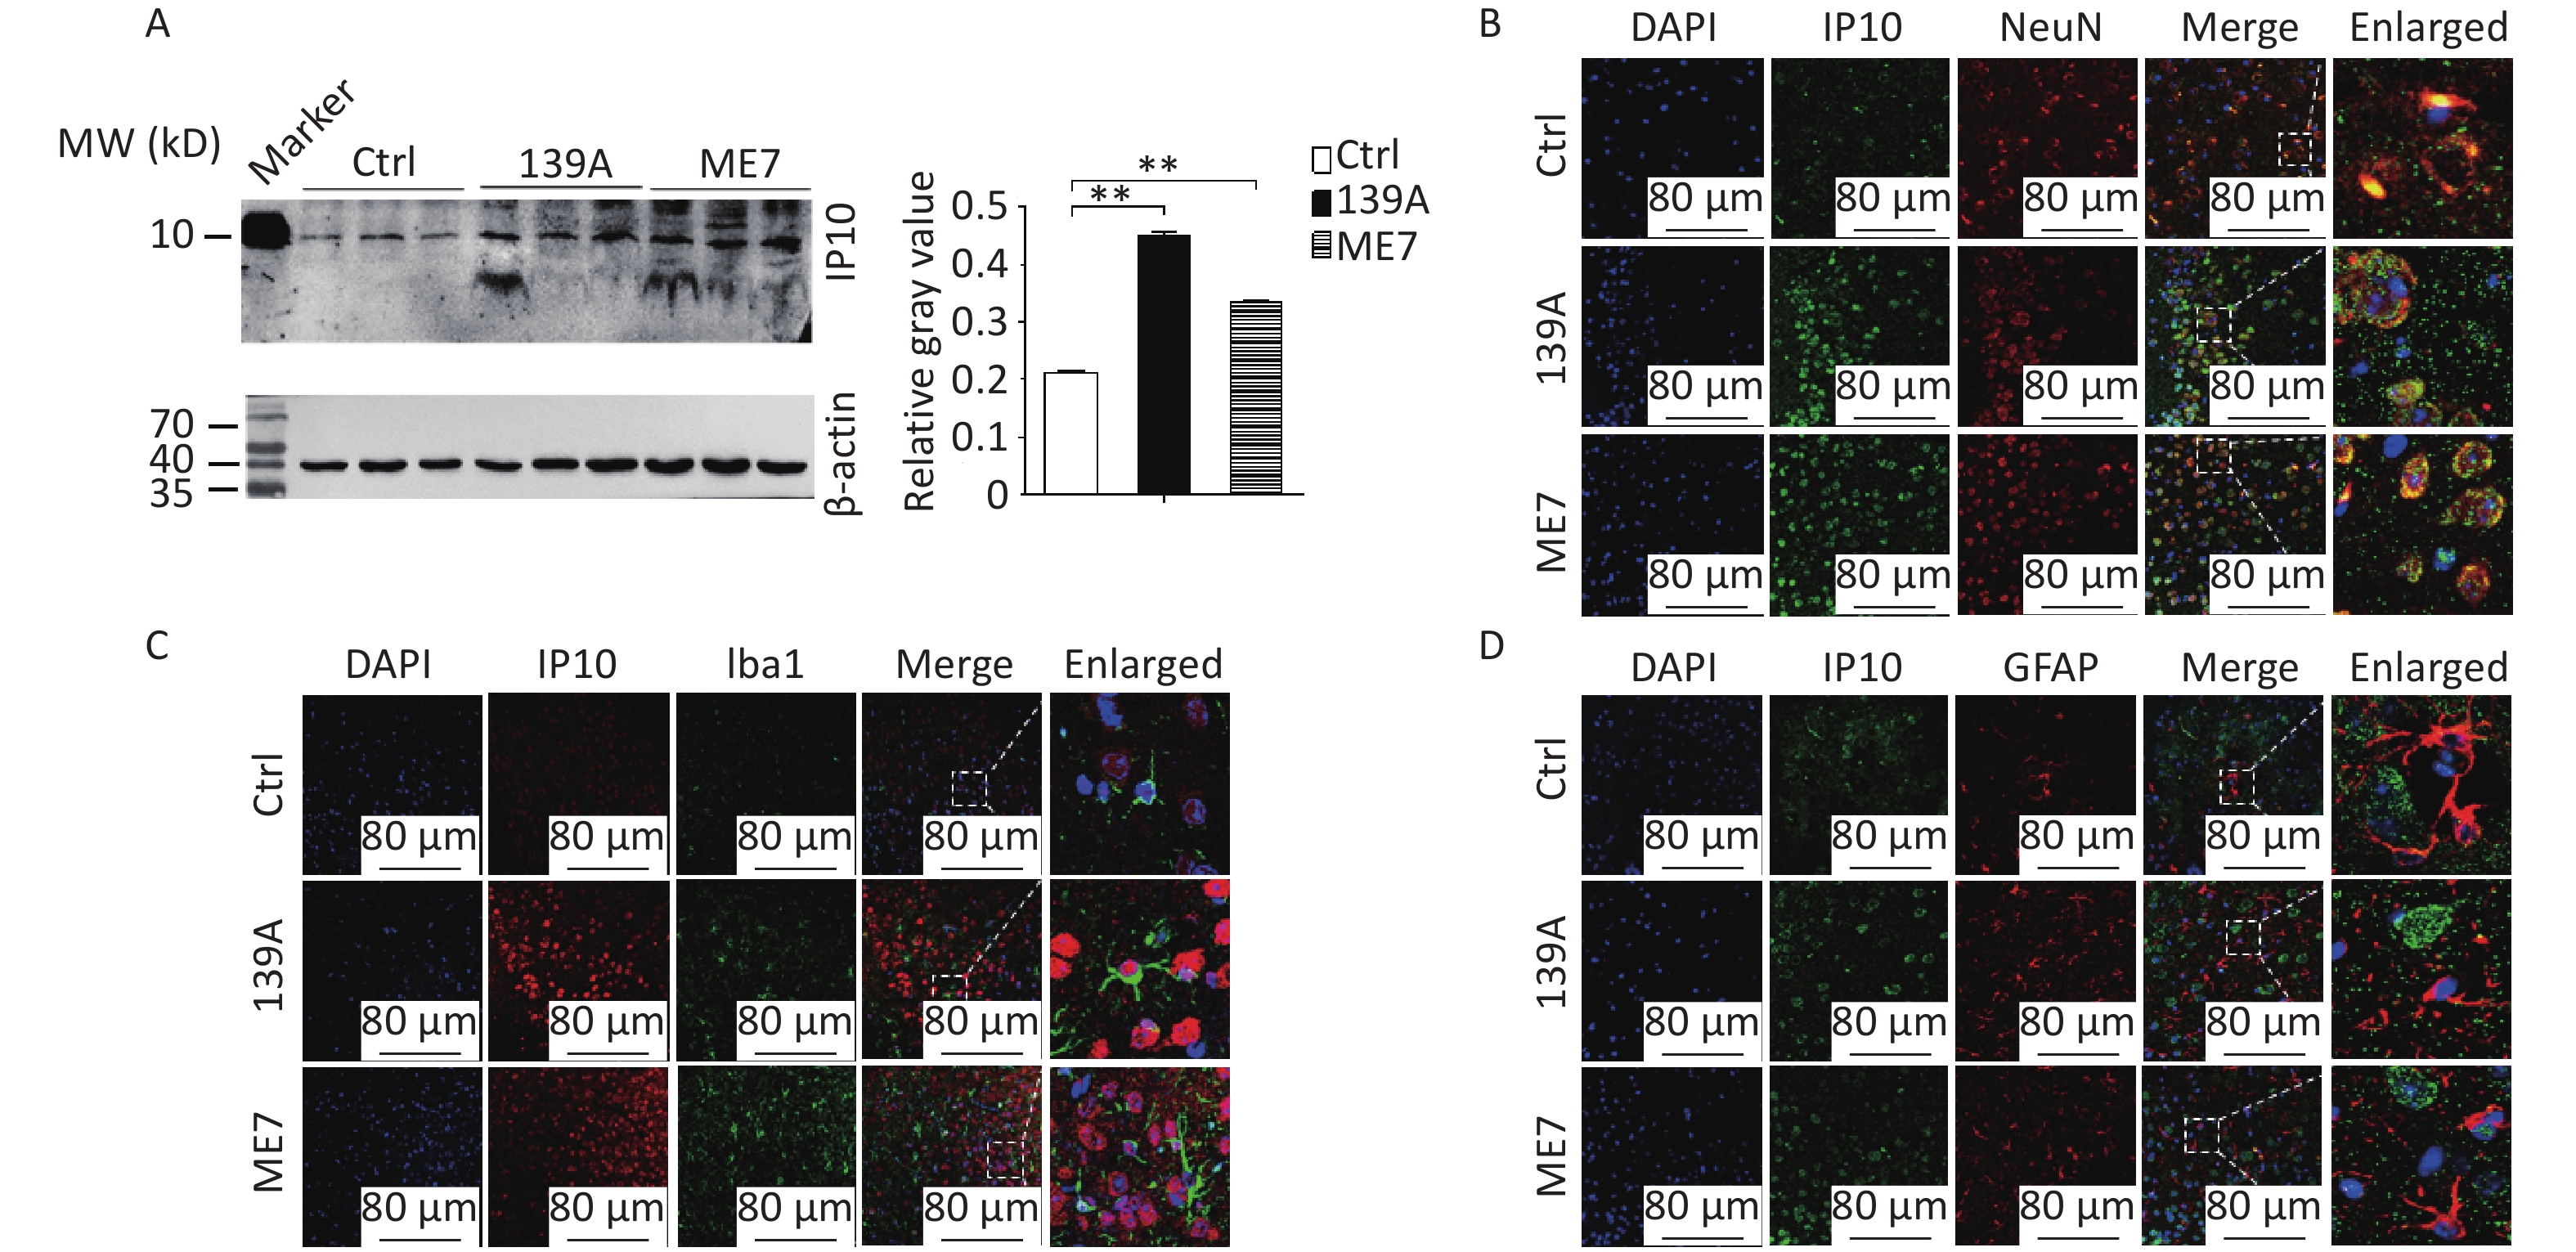
In this study, the levels of IP10 in the brain were further analyzed using IP10-specific Western blotting in mice infected with scrapie agents 139A and ME7 at the terminal stage (F = 1305.49, both P < 0.001). Stronger IP10 signals were detected in scrapie-infected mice than in age-matched controls (Figure 1A). To identify the expression and localization of IP10 during scrapie infection among different cell types within the CNS, sections of the cortical regions of 139A- and ME7-infected mice were immunofluorescently double-stained with NeuN (neuron-specific nuclear protein), GFAP (glial fibrillary acidic protein), or Iba-1 (ionized calcium-binding adapter molecule 1) -specific antibodies. A higher level of specific signals for IP10 (red) were observed in preparations from 139A- and ME7-infected mice at the terminal stage (Figure 1B–D). Double staining of tissues with antibodies against IP10 and biomarkers of various cell types further revealed colocalization between IP10-positive signals and NeuN-positive cells (Figure 1B) within the cortex region of scrapie-infected mice; however, no overlap was observed between these signals and Iba-1- (Figure 1C) or GFAP-positive cells (Figure 1D). These findings indicate that increased levels of IP10 are primarily localized to neurons in the brain tissue of scrapie-infected mice.
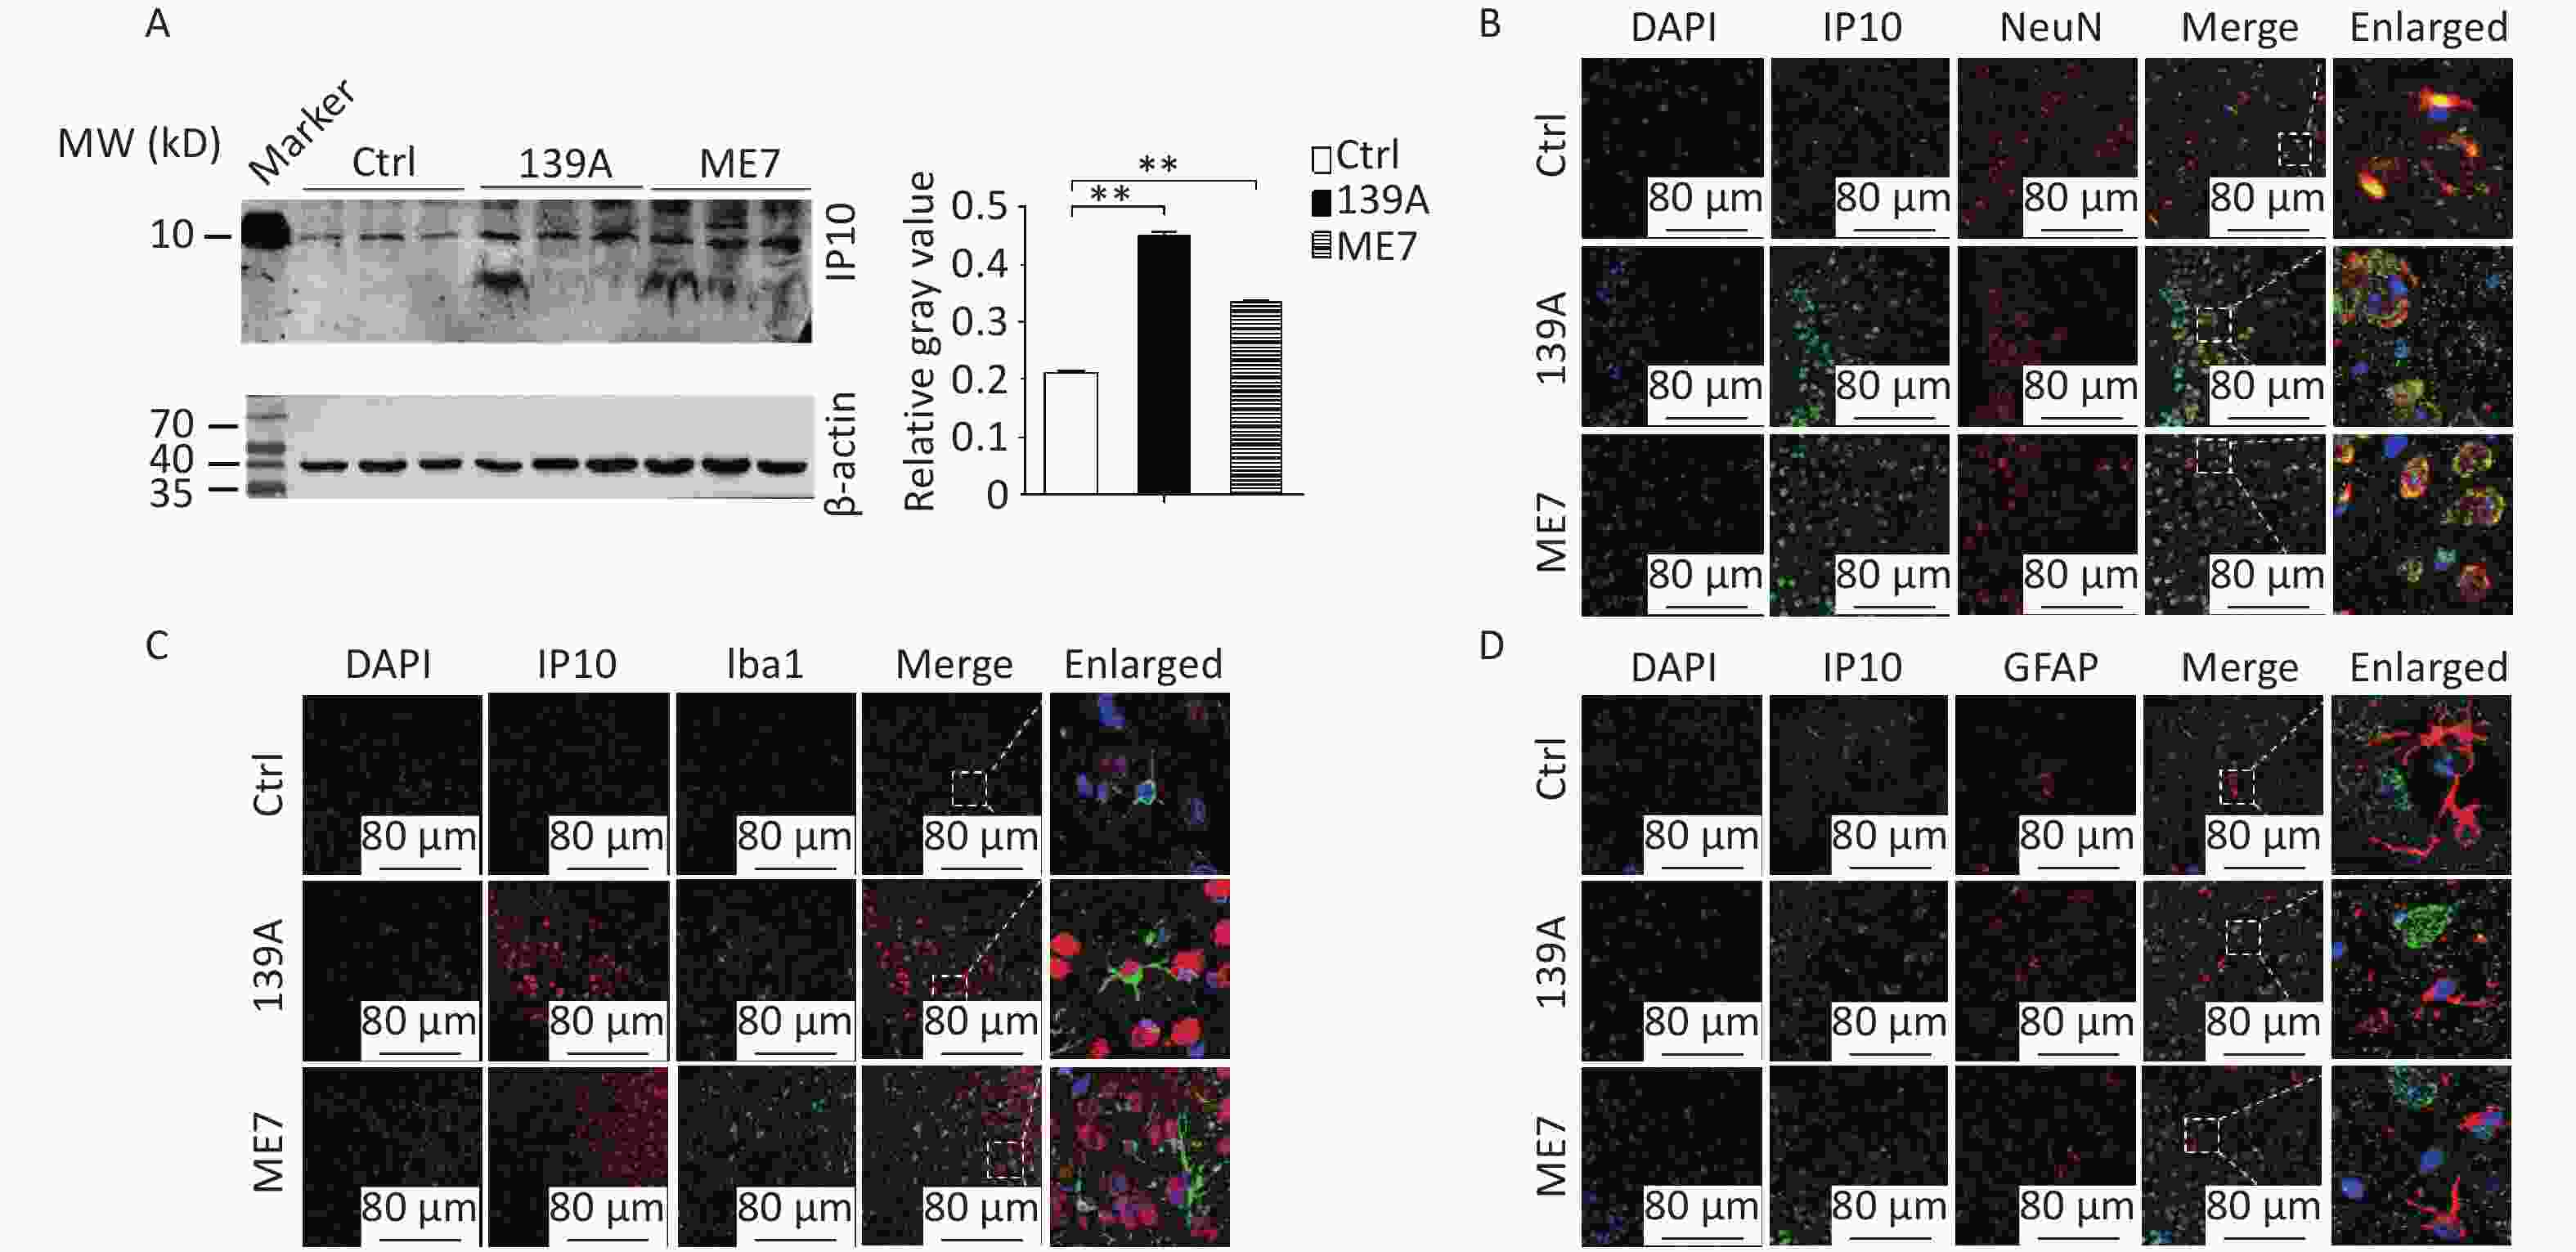
Figure 1. Upregulation of IP10 in the brains of scrapie-infected mice. (A) Western blot analysis showing IP10 levels in brain homogenates extracted from terminal stage mice treated with 139A and ME7 prion strains (n = 3). Equal quantities of the brain homogenates of normal and infected mice were loaded onto a 12% SDS-PAGE gel, with β-actin as an internal control. Molecular weight markers are depicted on the left side. Quantitative densitometry analysis relative to IP10/β-actin is presented on the right side, with graphical data representing the mean + SEM (n = 3). Statistical differences relative to controls are shown above the images. (B) Representative images demonstrating double staining for IP10 (green) and NeuN (red) in the brain sections of 139A and ME7 infected mice. (C) Representative images showing double staining for IP10 (red) and Iba-1 (green) in the brain sections of 139A and ME7 infected mice. (D) Representative images displaying double staining for IP10 (green) and GFAP (red) in brain sections of 139A and ME7 infected mice. The enlarged images are presented on the right side.
-
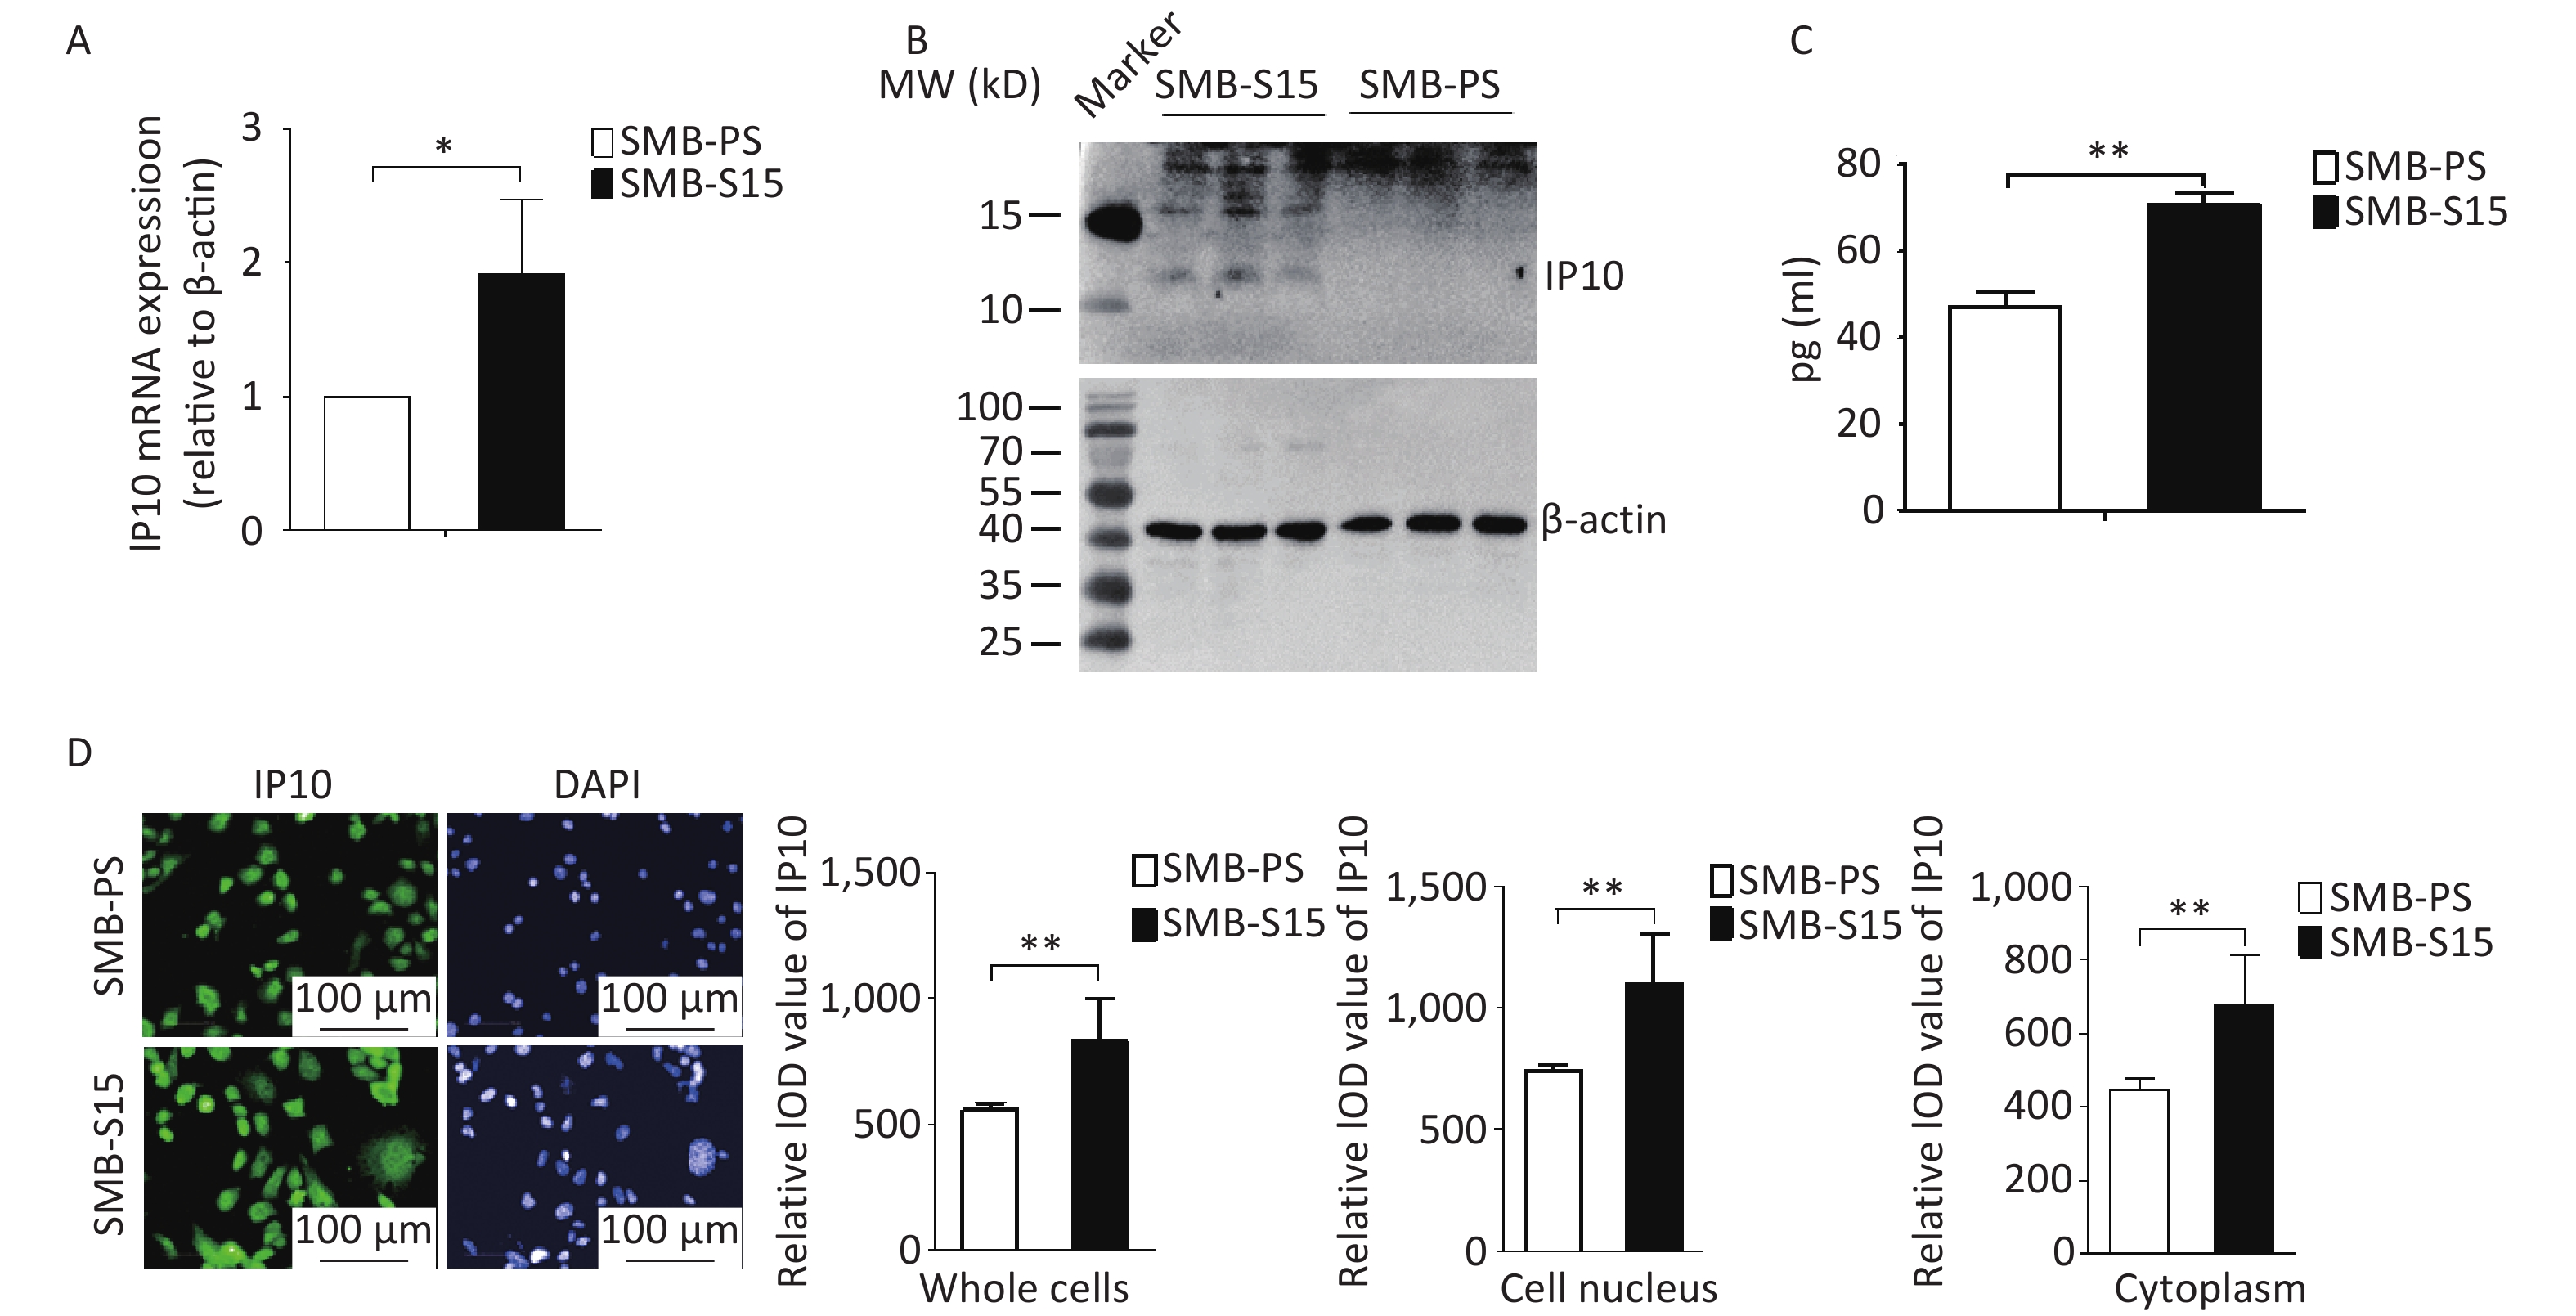
To investigate the potential alterations in IP10 in cultured cells with prion replication, we assessed the expression of IP10 in SMB-15 cells and their normal counterparts, SMB-PSs. Quantitative RT-PCR analysis with IP10-specific primers revealed a significant increase in the transcription levels of specific mRNAs in SMB-S15 cells compared to in SMB-PS cells (Figure 2A, t = −2.85, P = 0.046). Western blotting with anti-IP10 antibodies further identified specific bands in lysates from SMB-15 cells, but not in lysates from SMB-PS cells (Figure 2B). ELISA also showed significantly higher levels of IP10 expression in SMB-S15 cell lysates (Figure 2C, t = −9.31, P < 0.001). Moreover, markedly stronger signals for IP10 (green) were observed by immunofluorescence microscopy in both the cytoplasmic and nuclear fractions of SMB-S15 cells than in the corresponding fractions from the control cell line SMB-PS; these differences were statistically significant (Figure 2D, whole cells: t = −3.99, P = 0.003, cell nucleus: t = −4.11, P = 0.002, Cytoplasm: t = −3.96, P = 0.003). These findings indicate that the upregulation of endogenous expression of IP10 is associated with persistent prion replication.
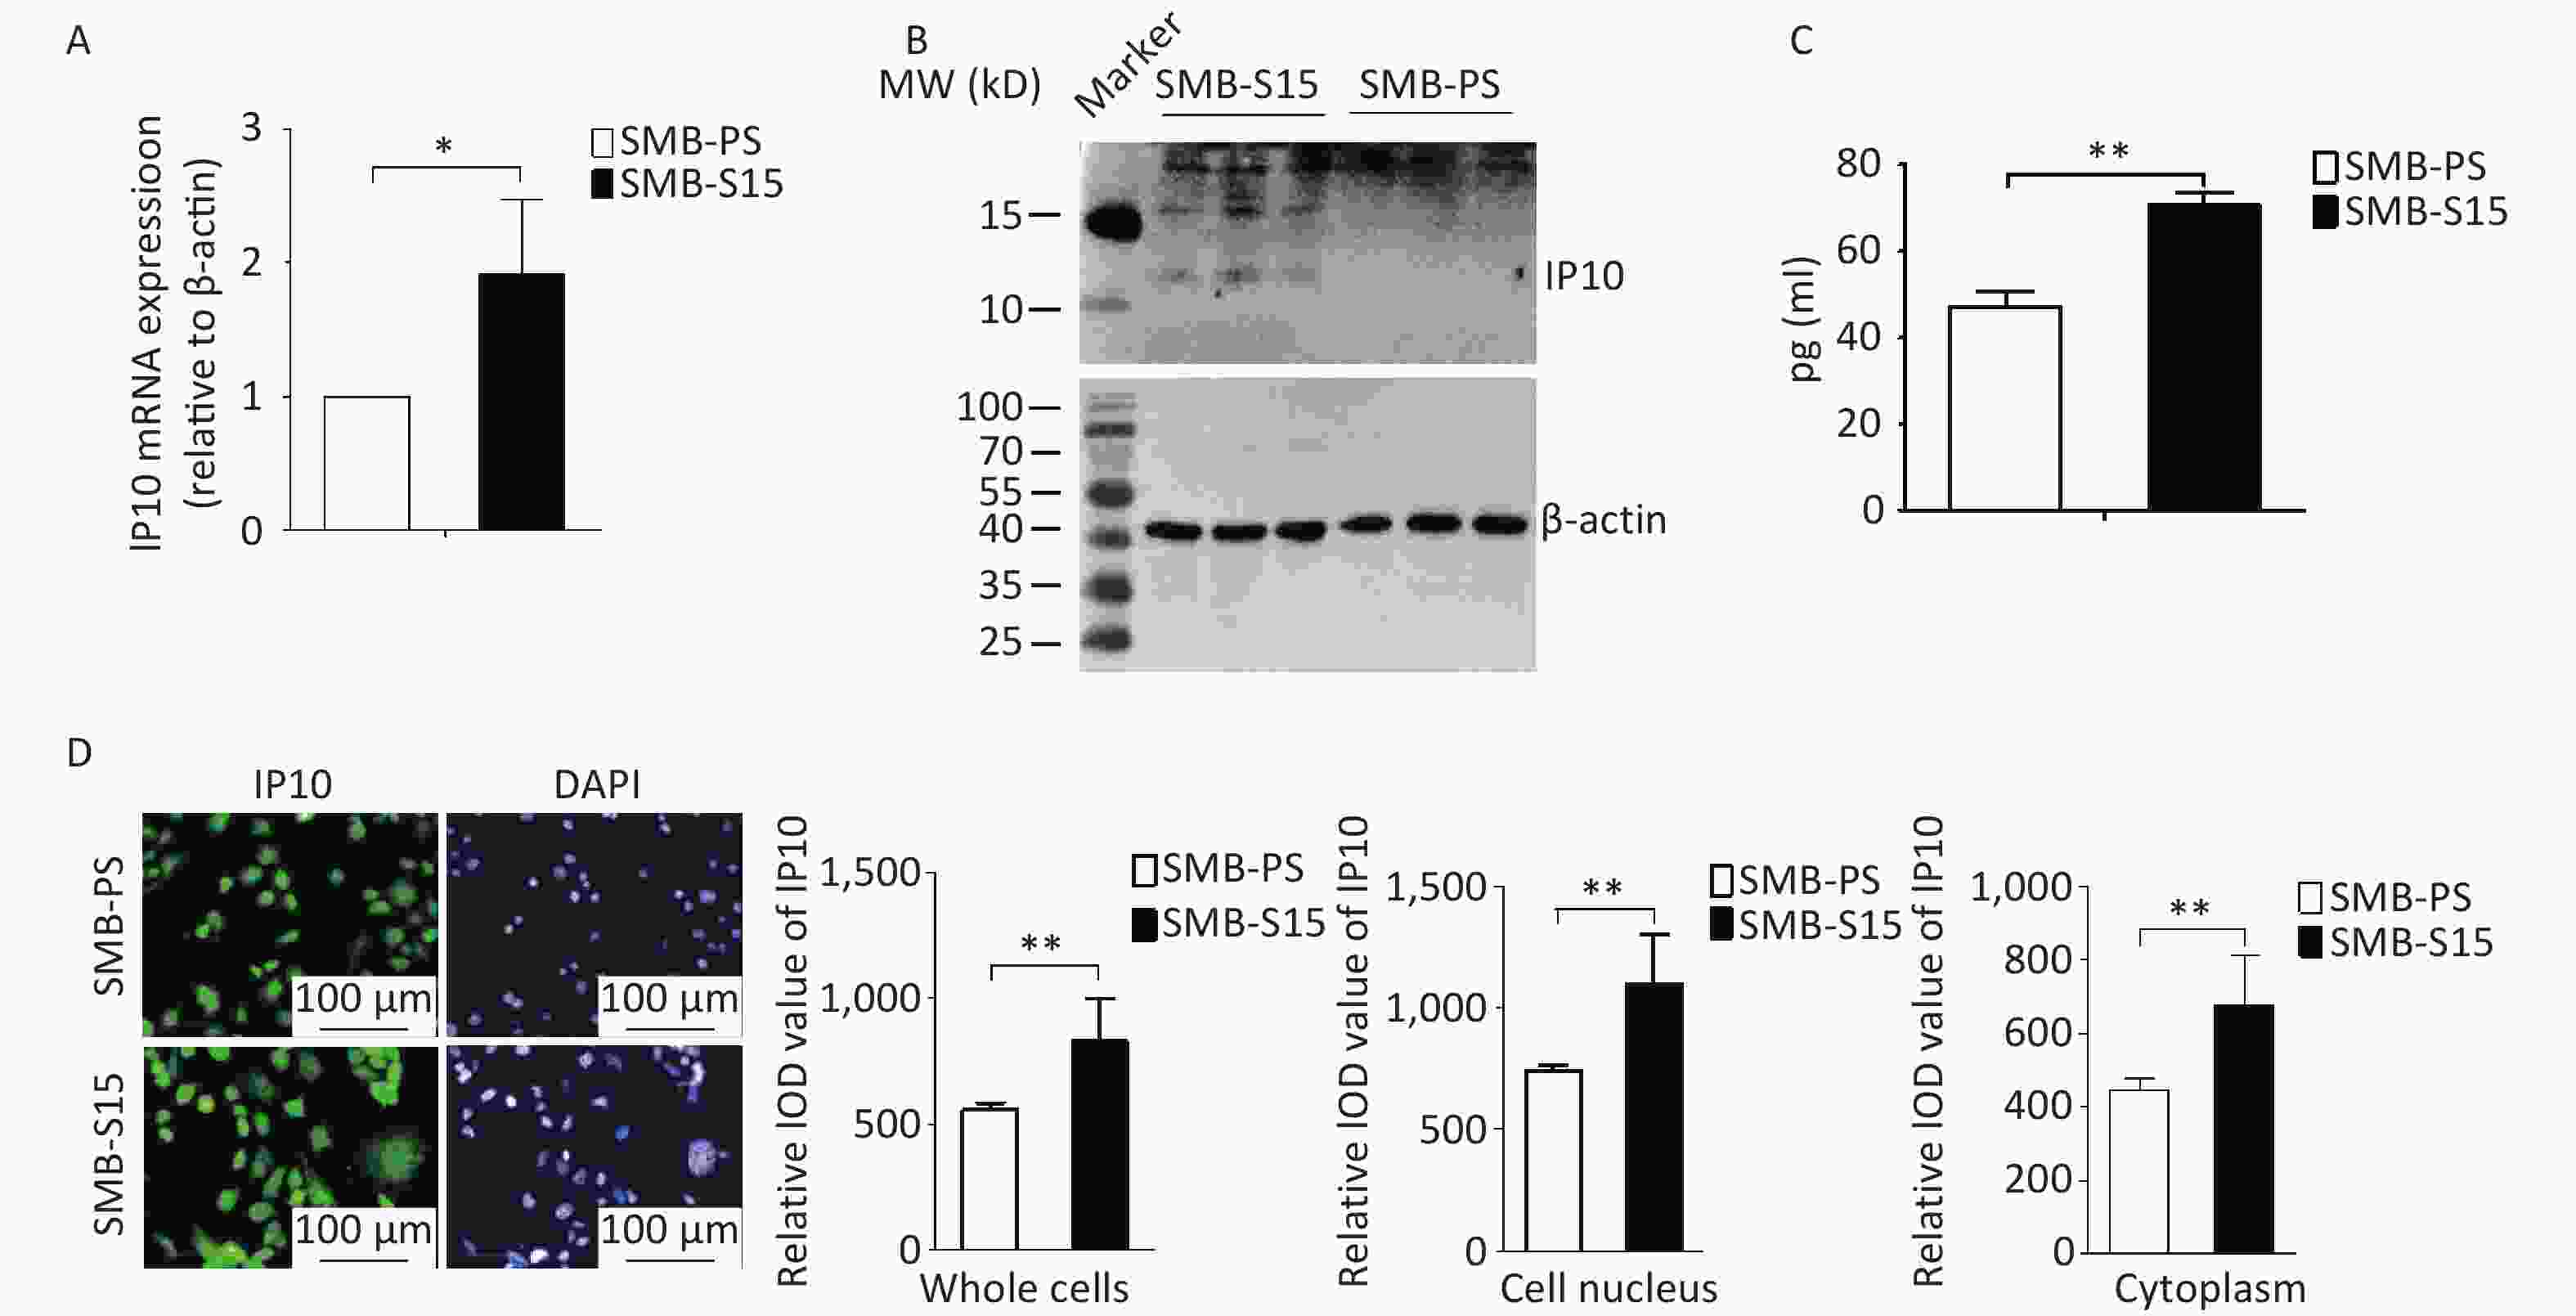
Figure 2. Upregulation of IP10 in prion-infected SMB-S15 cells. (A) IP10 specific qRT-PCR. Quantitative real-time PCR (qRT-PCR) was performed to analyze the transcriptional levels of IP10 in three batches of cultured SMB-S15 and SMB-PS cells. The Y-axis represents the values of 2-ρρCT for SMB-S15 and SMB-PS cells (n = 3). (B) Western blot for IP10 in three batches of each SMB cell line (n = 3). (C) Measurement of IP10 level with an ELISA Kit. The quantities of IP10 (pg/mL) are depicted on the Y-axis (n = 3). (D) Representative images of IP10-specific IFAs. The intensity optical density (IOD) values for IP10 were automatically calculated using Image J software for whole cells, cytoplasm, and nuclear fractions separately.
-
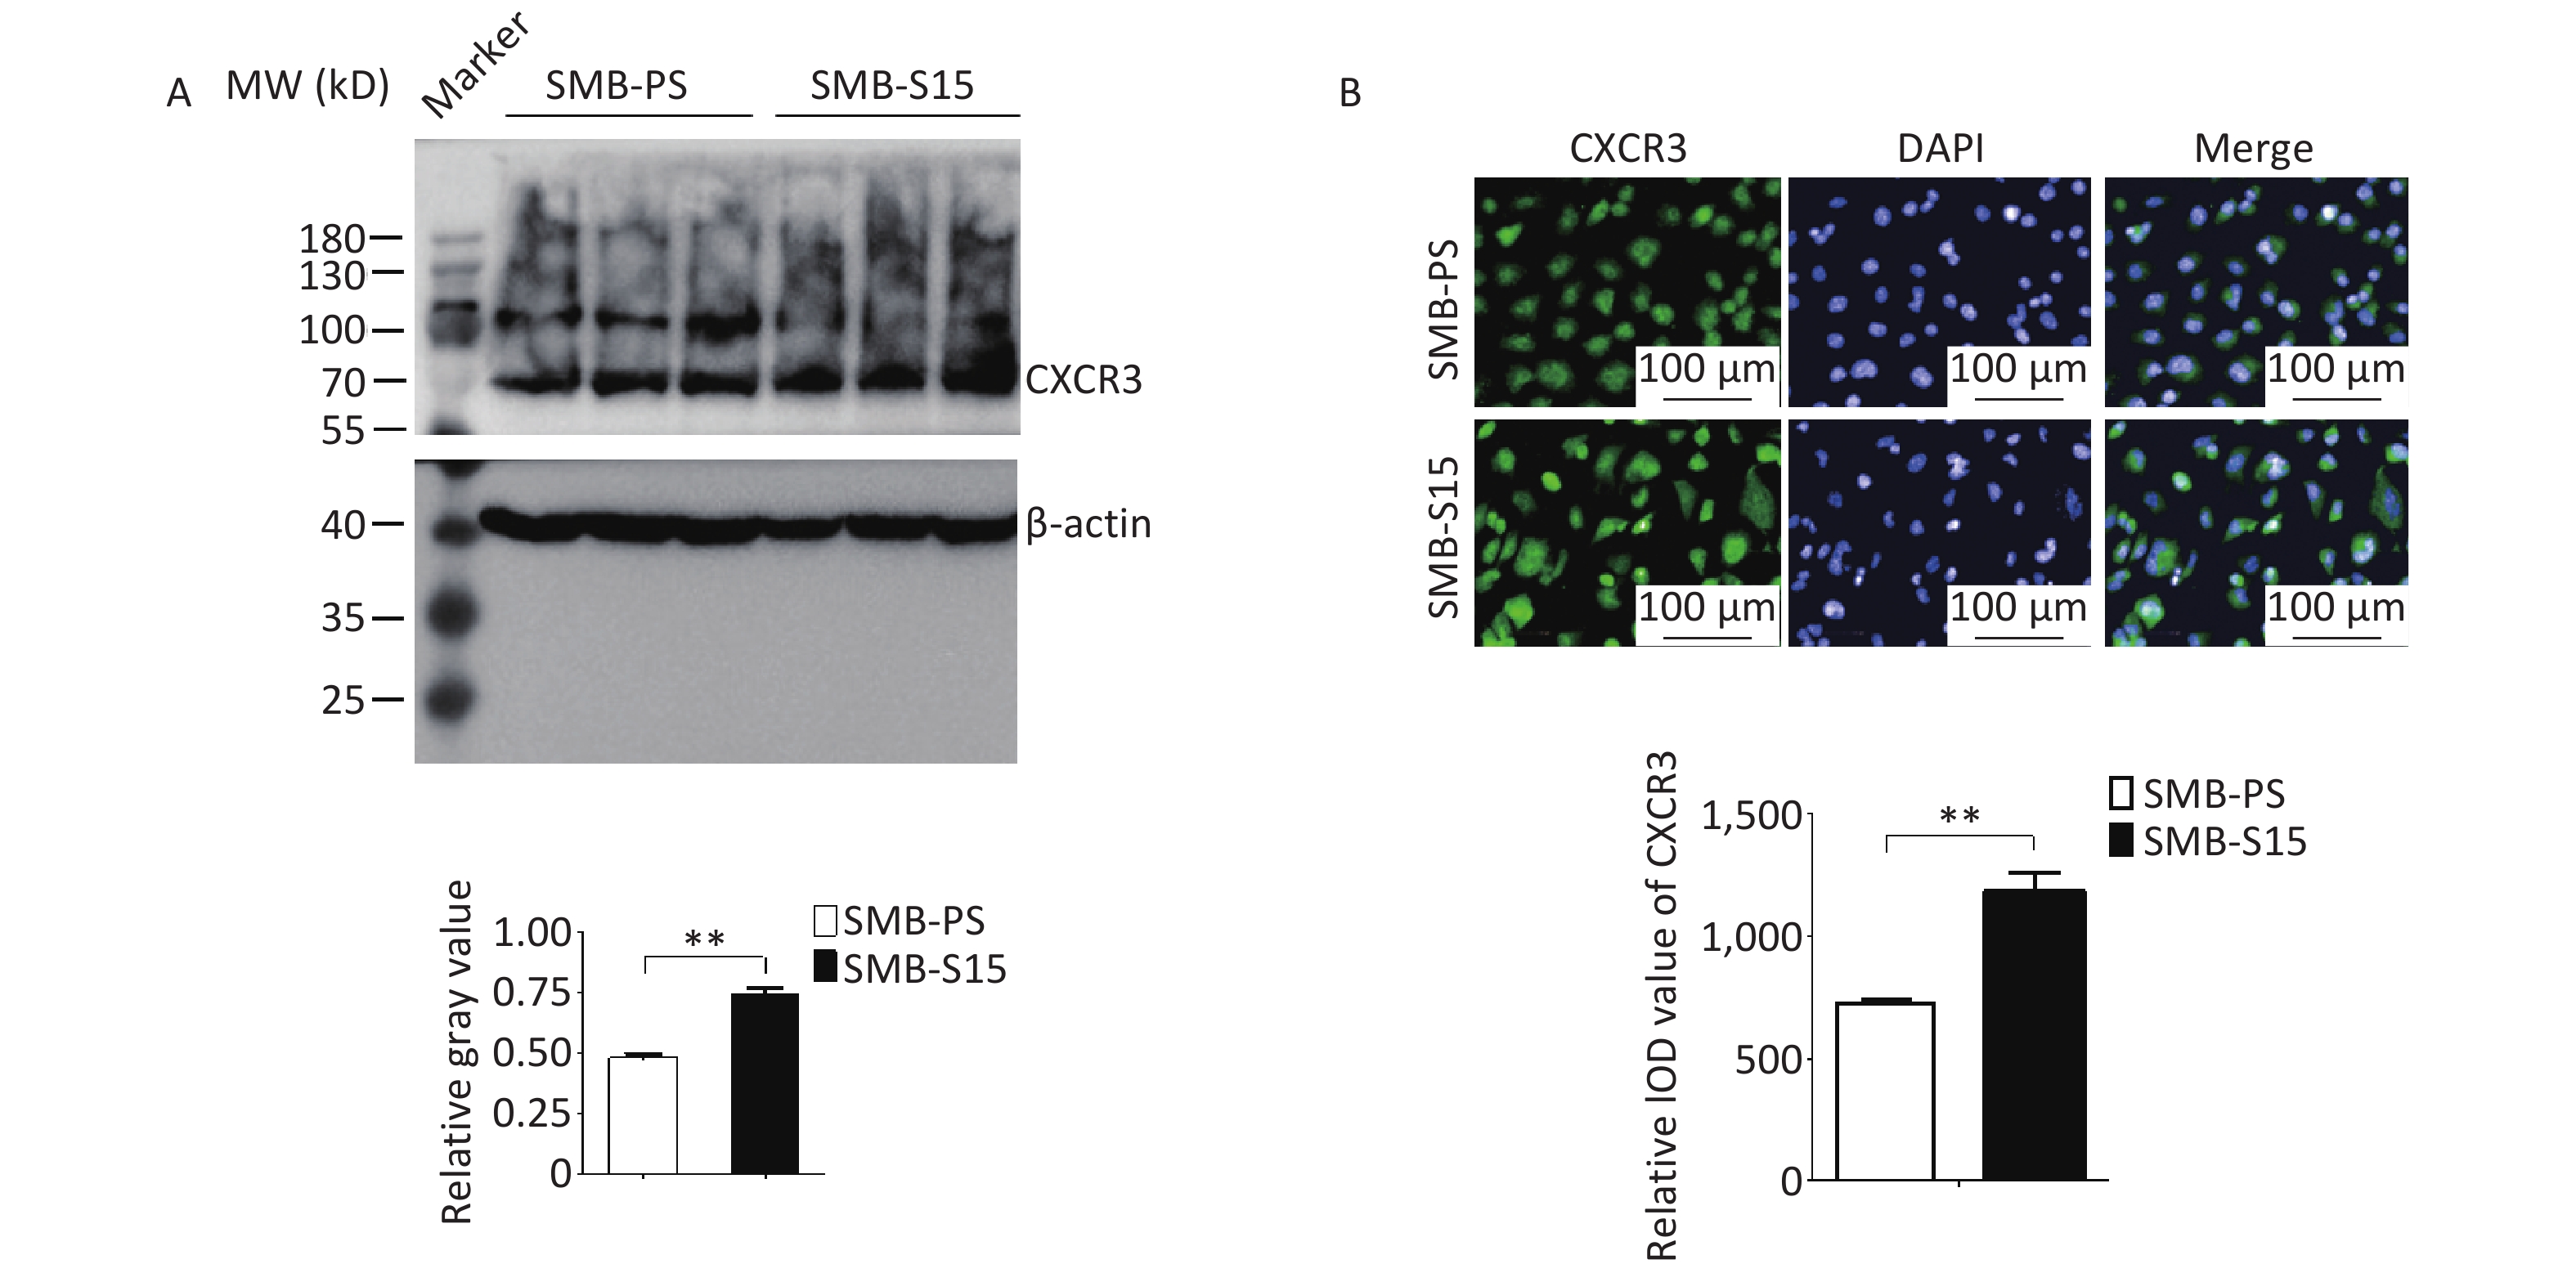
To assess potential changes in CXCR3 during prion infection, lysates from SMB-PS and SMB-S15 cells were subjected to CXCR3-specific Western blotting. The CXCR3 level was significantly higher in SMB-S15 cells than in SMB-PS cells, as indicated by quantitative analysis (Figure 3A, t = −9.08, P < 0.001). Immunofluorescence assay targeting CXCR3 further showed stronger green signals in SMB-S15 cells than in SMB-PS cells. Following normalization to nuclear data for quantitative analysis (P < 0.01), the integrated optical density (IOD) value of CXCR3 was found to be significantly higher in SMB-S15 cells (Figure 3B, t = −5.91, P = 0.004), indicating a relatively elevated level of CXCR3 in prion-infected cells.
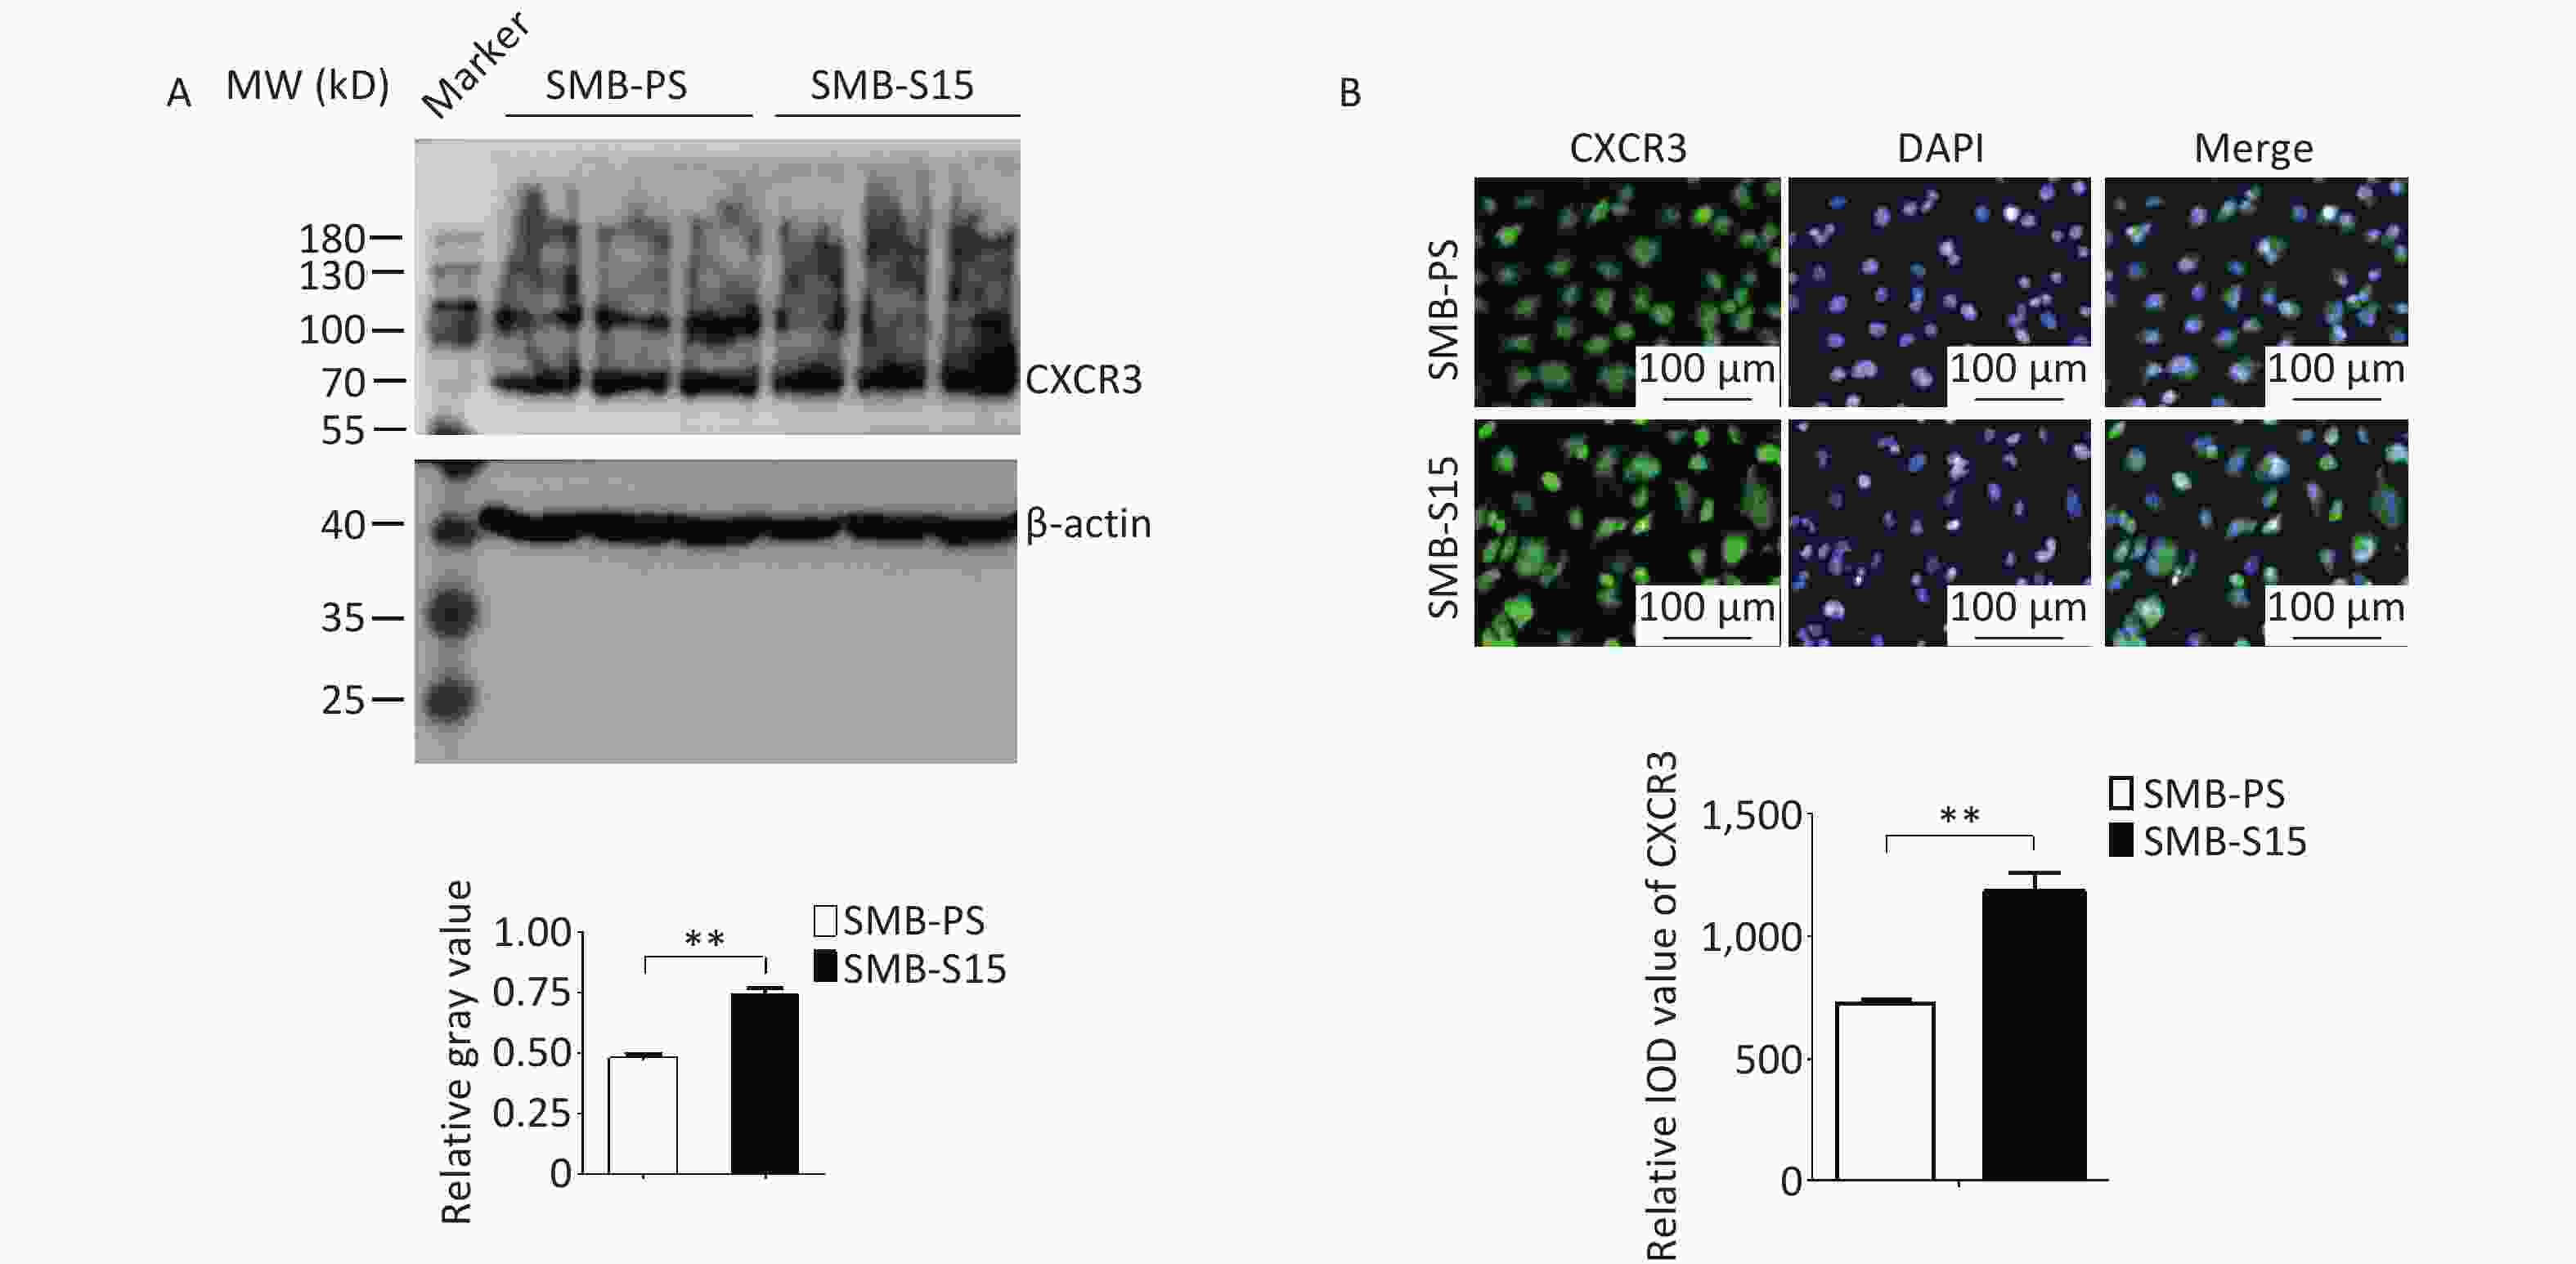
Figure 3. Upregulation of CXCR3 in the prion-infected cell line SMB-S15. (A) Western blot for CXCR3 in three batches of each of the SMB cell line. Quantitative assays were performed using densitometry analysis using CXCR3/β-actin as the reference, while the graphical data represent the mean + SEM (n = 3). (B) CXCR3-specific IFAs. The software image J is utilized to automatically calculate the IOD values of CXCR3 in SMB-S15 and SMB-PS cells (n = 3).
To evaluate the alterations in the brain tissues of experimental rodents infected with scrapie agents, brain samples from 139A- and ME7-infected mice (n = 3) were analyzed using real-time PCR with specific primer pairs for CXCR3 mRNA detection, while β-actin served as an internal control housekeeping gene for normalization purposes. The original average Ct values of CXCR3 and β-actin mRNA in the brains of control, 139A- and ME7-infected mice were 33.64 ± 0.15, 34.66 ± 0.76, and 31.37 ± 0.28; and 37.85 ± 0.65, 31.02 ± 0.12 and 36.61 ± 0.13, respectively. Following normalization to the respective β-actin delta-delta-Ct values, the relative expression levels of CXCR3 were calculated based on three independent reactions using the 2−ΔΔCt method. The transcript levels of CXCR3 were further found to be significantly upregulated in the brains of both 139A- and ME7-infected mice compared to the controls (Figure 4A, F = 10.26, P = 0.016, and P = 0.005).
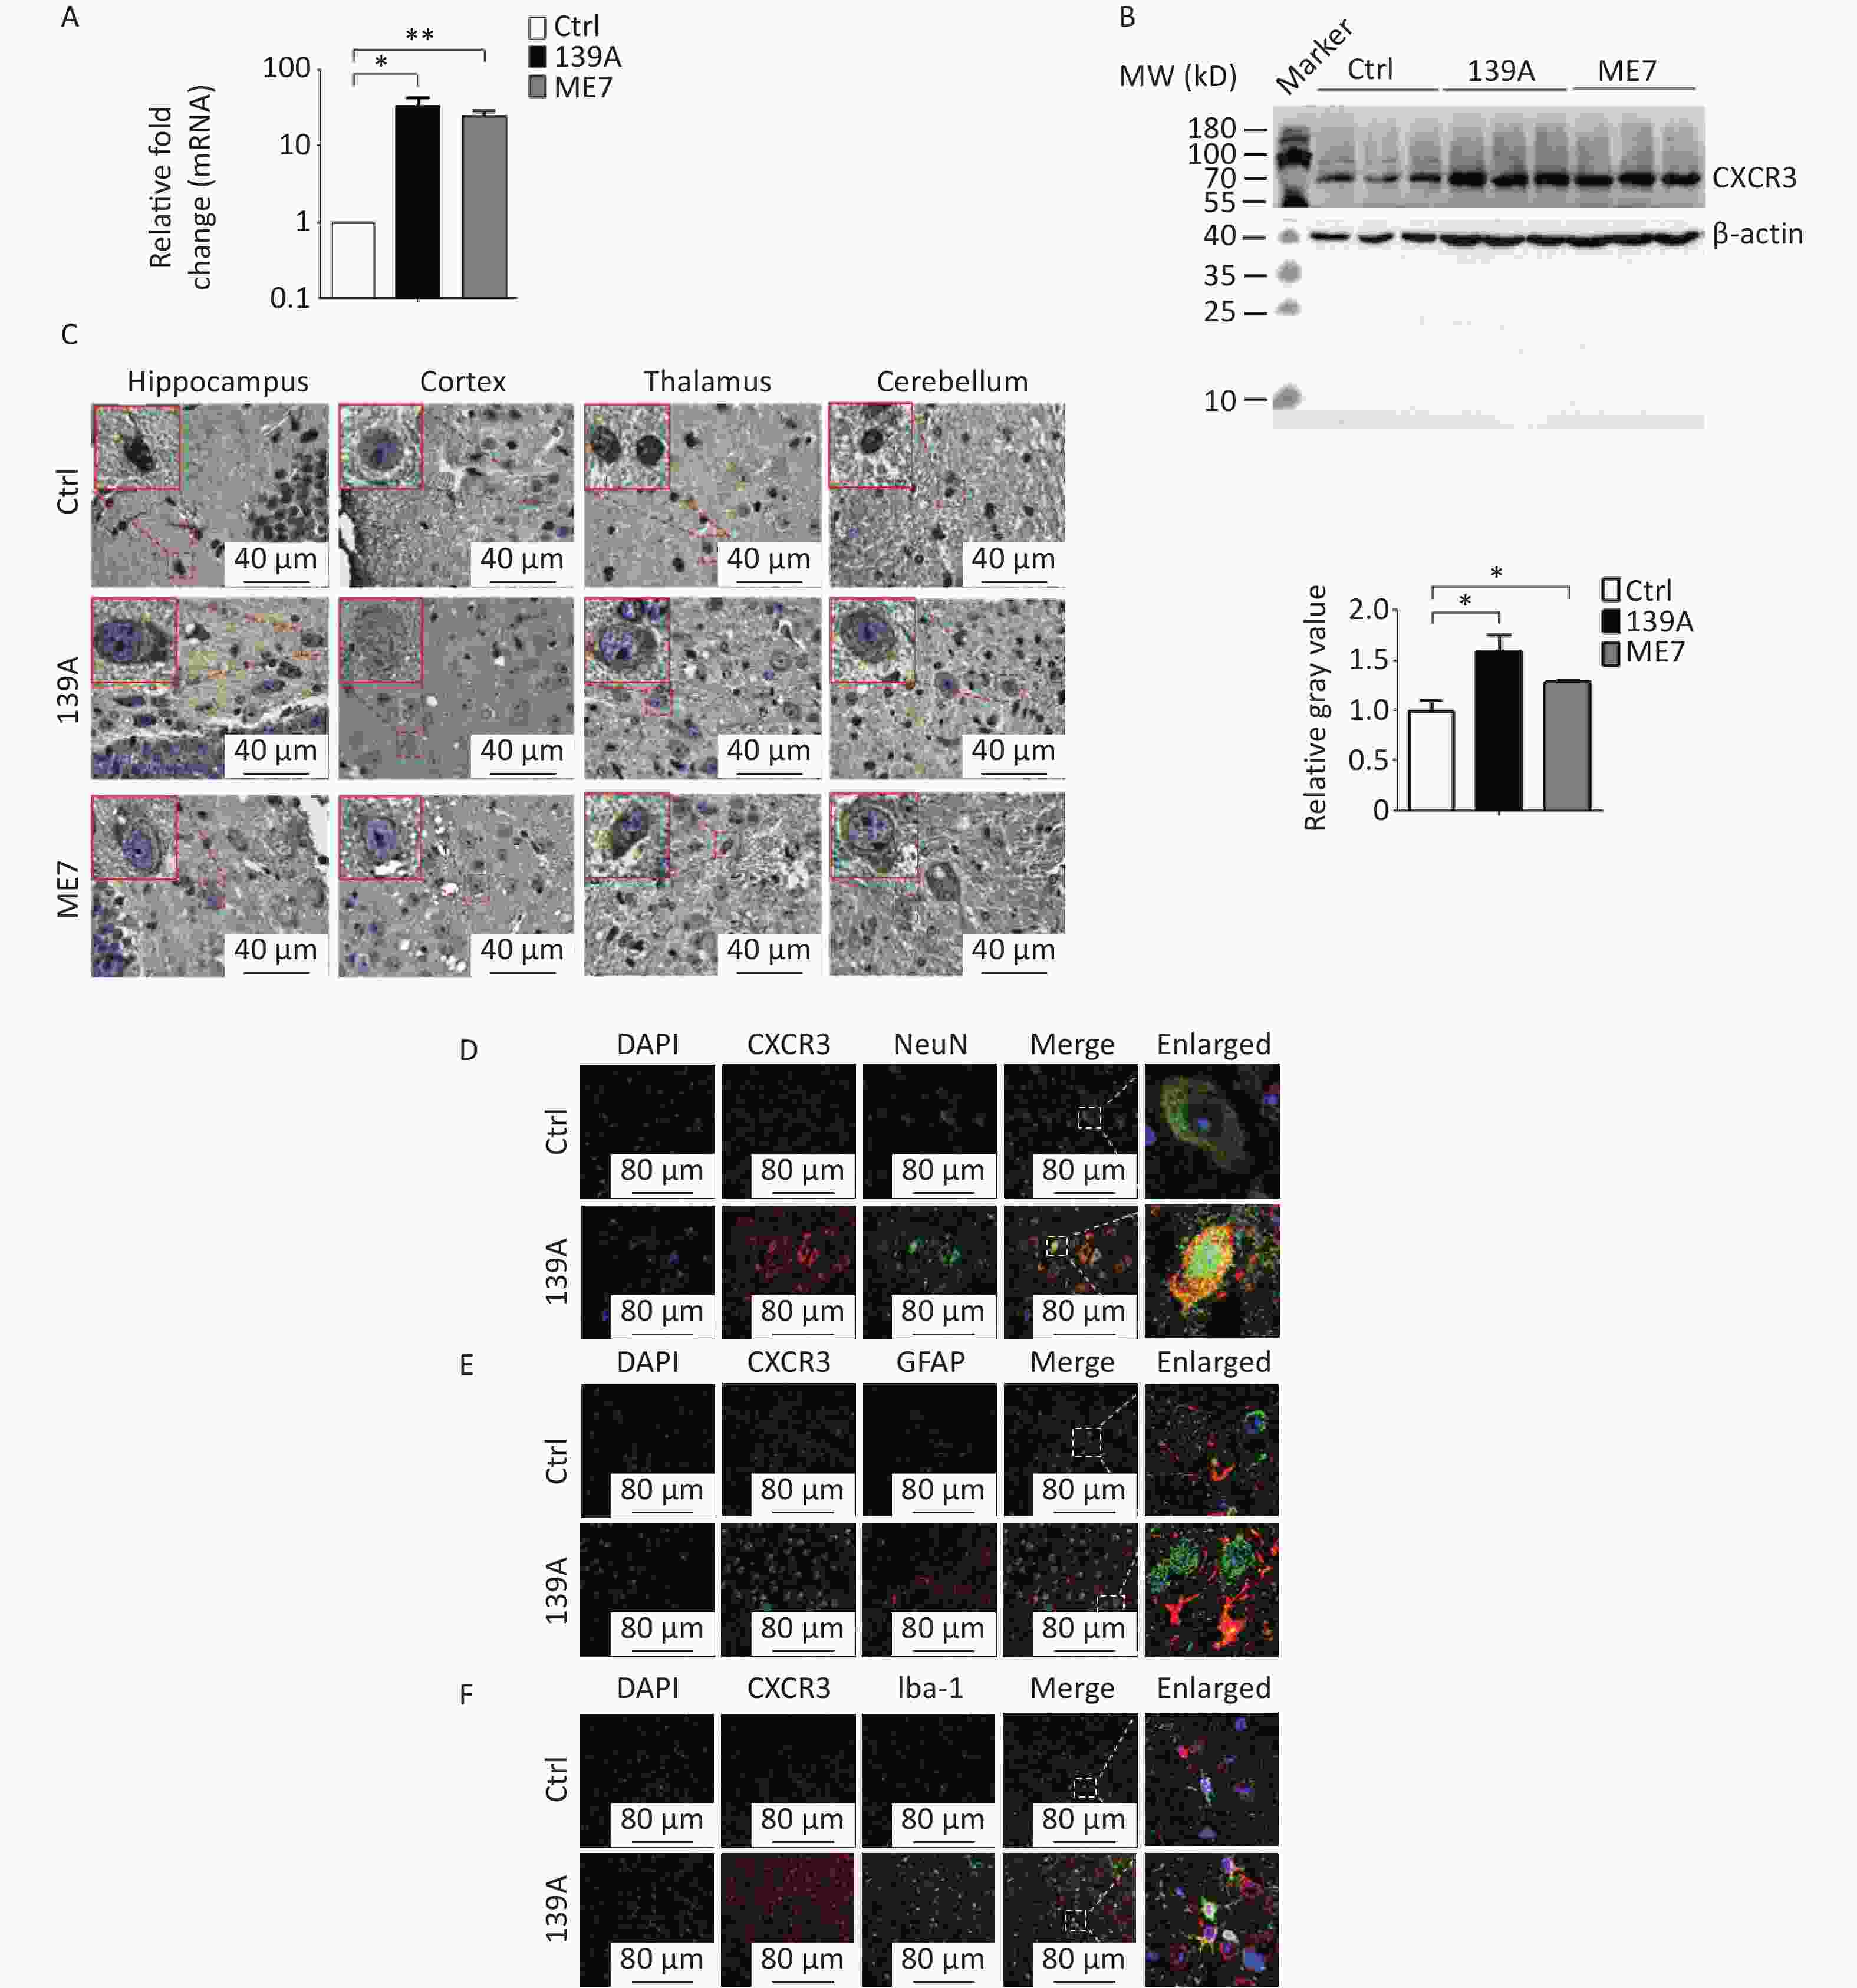
Figure 4. Upregulation of CXCR3 in the brains of scrapie-agent infected mice. (A) CXCR3 specific qRT-PCR. Total RNA extracted from normal, 139A, and ME7 infected mice (n = 3 each) were subjected to CXCR3 specific qRT-PCR. The Y-axis represents the 2-ρρCT values. (B) Specific Western blots for CXCR3. Equal amounts of brain homogenates from normal and infected mice (n = 3 each) were subjected to CXCR3-specific Western blot analysis. Quantitative assays were determined by assessment of the densitometry relative to IP10/β-actin, while the graphical data represent the mean + SEM. (C) Representative graphs of CXCR3-specific immunohistochemistry (IHC) assays of the brain sections of normal, 139A, and ME7 infected mice. The brain regions of the hippocampus, cortex, thalamus, and cerebellum are indicated above the images. (D) Representative images of double staining for of CXCR3 (red) and NeuN (green) in the brain sections of normal and 139A infected mice. (E) Representative images of double staining for CXCR3 (green) and GFAP (red) in the brain sections of normal and 139A infected mice. (F) Representative images of CXCR3 (red) and Iba-1 (green) double staining in brain sections from normal and 139A infected mice. Enlarged images are shown on the right-hand side.
Western blotting revealed significantly stronger CXCR3 signals in the brains of 139A- and ME7-infected mice compared to in age-matched healthy controls, as evidenced by quantitative assays (Figure 4B, F = 7.31, P = 0.035, and P = 0.034). To gain further insight into the expression of CXCR3 in different brain regions, we performed CXCR3-specific immunohistochemistry (IHC) assays on sections from four distinct brain regions (the hippocampus, cortex, thalamus, and cerebellum) of 139A- and ME7-infected mice, as well as age-matched healthy controls. We further observed a significant increase in dark brown staining specific to CXCR3 in all tested brain sections of 139A- and ME7-infected mice compared to the control group, with the majority localized within cell bodies (Figure 4C). Subsequently, we applied double-stained immunofluorescence assay (IFA) on brain sections from 139A-infected and normal mice to examine the distribution of CXCR3 across different cell types in the brain tissues. Brain slices from infected mice exhibited higher levels of CXCR3 signals than those in normal controls (Figure 4D–F). Analysis of the merged images revealed colocalized signals (yellow) between CXCR3- and NeuN-positive cells (Figure 4D) and Iba-1-positive cells (Figure 4F), but not GFAP-positive cells (Figure 4E). These data indicated the upregulation of CXCR3 levels in prion-infected brains, predominantly within neurons and activated microglia.
-
To assess the morphological colocalization of increased CXCR3 and IP10 with PrP, the brain sections on normal and 139A-infected mice were double-stained immunofluorescently using a combination of anti-IP10 and anti-CXCR3 antibodies. In the merged images of different brain regions (e.g., cortex in Figure 5A, 5D, hippocampus in Figure 5B, 5E and cerebellum in Figure 5C, 5F) of 139A-infected mice, a significantly higher number of colocalized signals (yellow) within cellular structures was observed compared to in normal animals. However, colocalized signals were also occasionally detected in the brain tissues of normal animals.
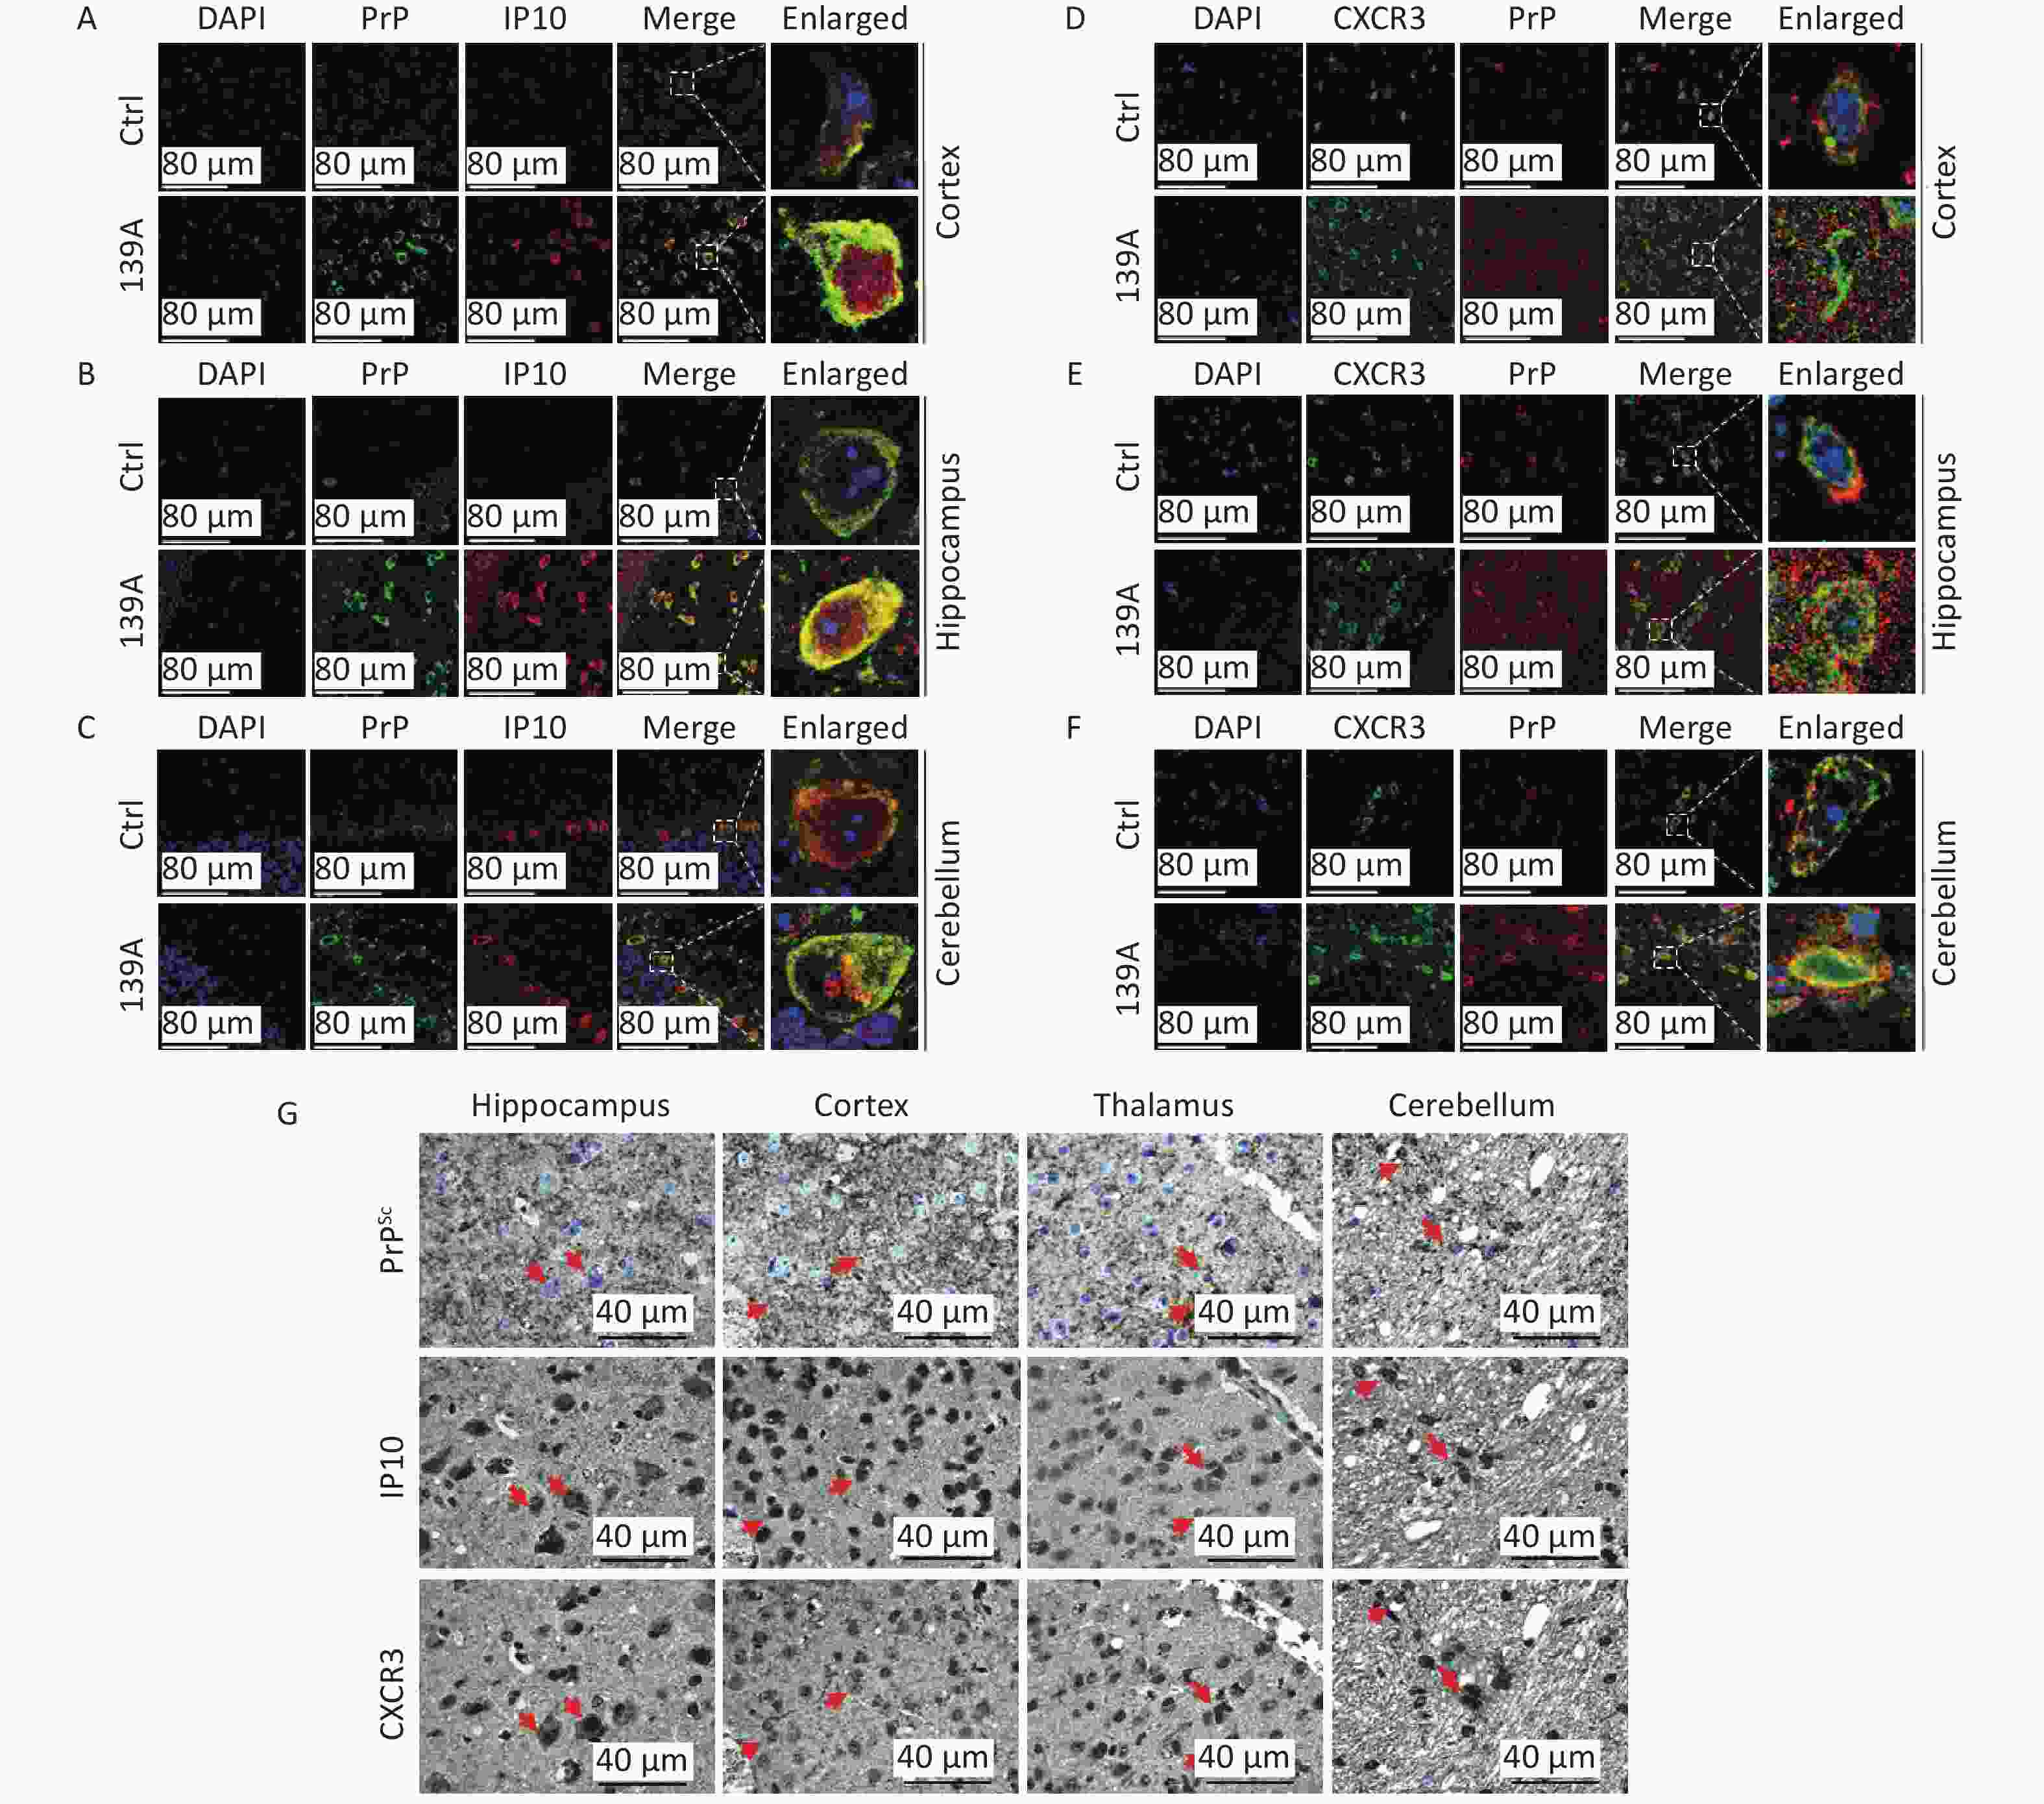
Figure 5. Morphological colocalization of PrP/PrPSc, IP10, and CXCR3 in the brains of scrapie-infected mice. (A)–(C) Representative immunofluorescence images depicting the colocalization of PrP (green) and IP10 (red) in the following distinct brain regions: the cortex (A), hippocampus (B), and cerebellum (C), of both normal and 139A-infected mice. (D)–(F) Representative images depicting the double staining of PrP (red) and CXCR3 (green) in the cortex (D), hippocampus (E), and cerebellum (F) regions of normal and 139A infected mice. Enlarged images are shown on the right. (G) Representative immunohistochemistry (IHC) images of PrPSc, IP10, and CXCR3 in serial brain sections of 139A-infected mice. For PrPSc detection, the brain sections underwent GdnHCl treatment followed by staining with a PrP specific mAb prior to IHC analysis. Colocalized signals are indicated with arrows.
To investigate the morphological associations among PrPSc, IP10, and CXCR3 in prion-infected brains, serial brain sections were prepared from 139A-infected mice. IHC assays for IP10 and CXCR3 were performed routinely, whereas those for PrPSc were conducted after removing normal PrP using GdnHCl. As depicted in Figure 5G, substantial brown signals were observed at the corresponding positions on serial sections stained with anti-IP10, anti-CXCR3, and anti-PrP antibodies. Codeposits of PrPSc, IP10, and CXCR3 were widely distributed across various brain regions, including the cortex, hippocampus, thalamus, and cerebellum (Figure 5G).
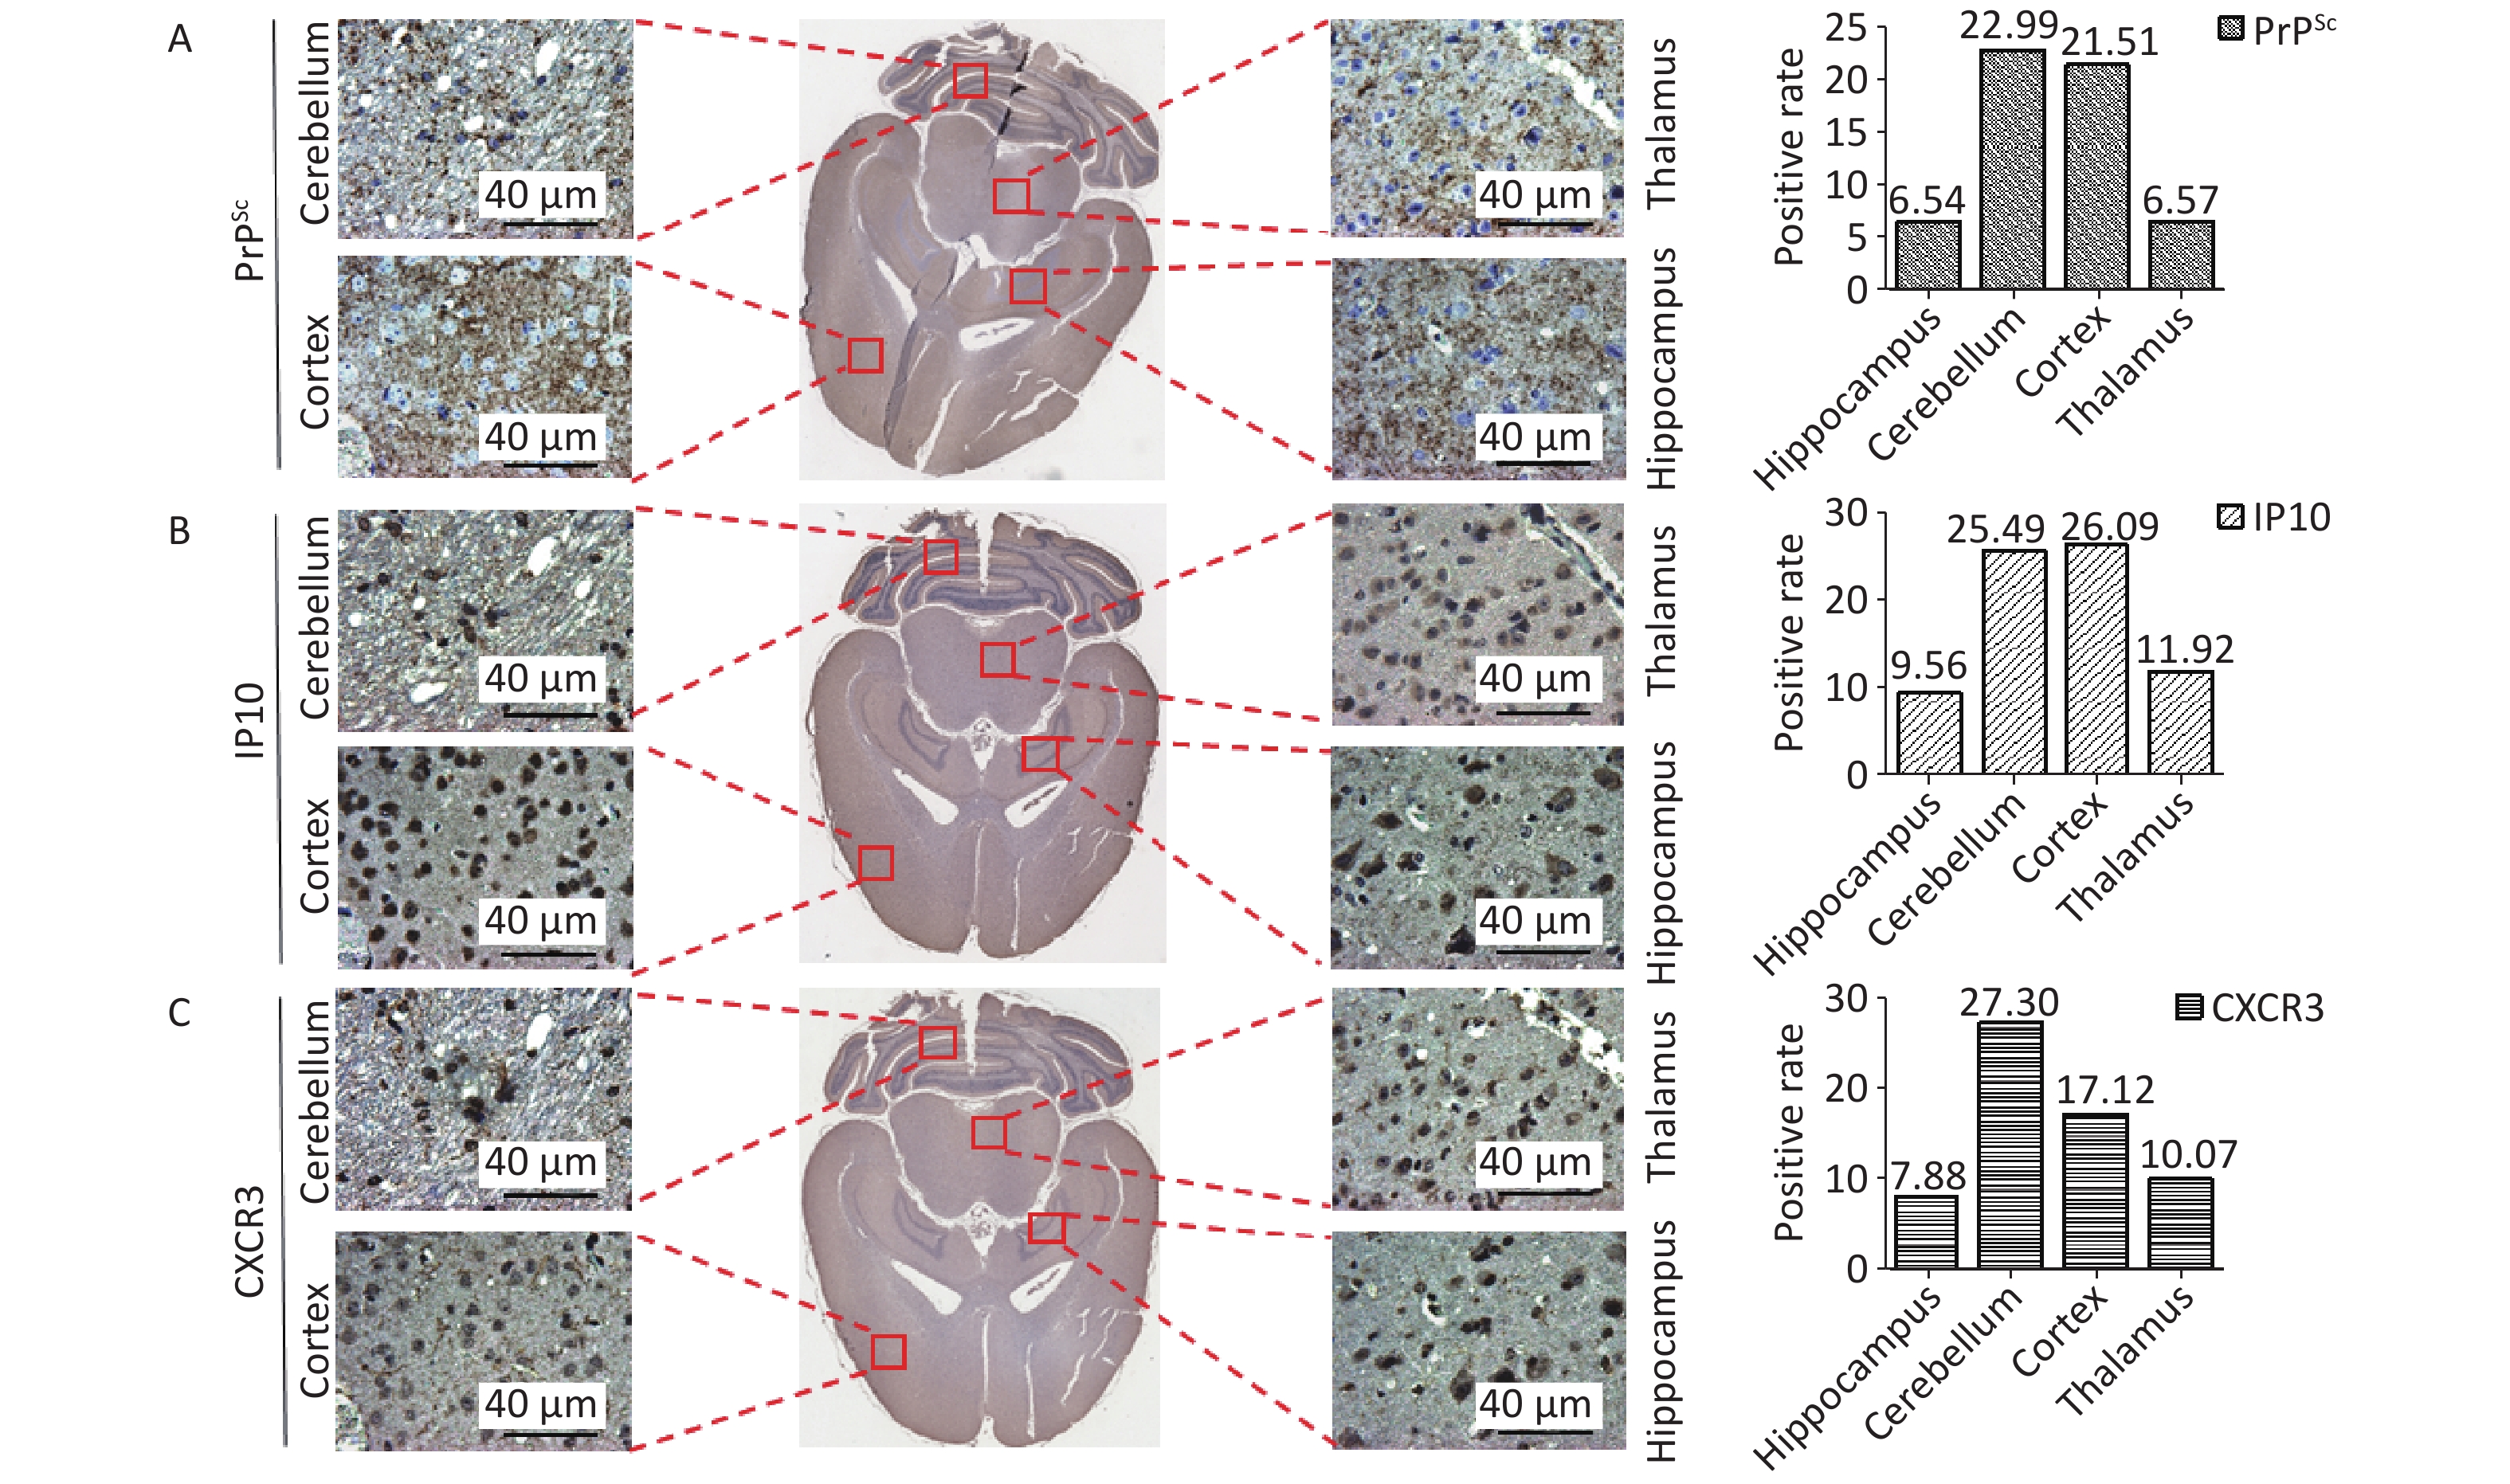
Furthermore, immunohistochemical staining was performed on whole brain sections from 139A-infected mice using anti-IP10, anti-CXCR3, and anti-PrP antibodies. The Imagescope software equipped in Leica Aperio CS2 was used to automatically scan and calculate the percentages of PrPSc, IP10, and CXCR3 in the hippocampus, cerebellum, cortex, and thalamus. As shown in Figure 6, the percentages of cells positive for PrPSc (Figure 6A) were found to be 6.54%, 22.99%, 21.51%, and 6.57% in the hippocampus, cerebellum, cortex, and thalamus, respectively, whereas for IP10 (Figure 6B) and CXCR3 (Figure 6C), levels of 9.56%, 25.49%, 26.09%, 11.92%; and 7.88%, 27.30%, 17.12%, and 10.07%, respectively, were found. Notably, the cortex and cerebellum regions exhibited higher deposition of these three biomarkers than the other brain regions. This finding emphasizes that IP10 and CXCR3 signals were predominantly located in brain areas with greater PrPSc deposits.
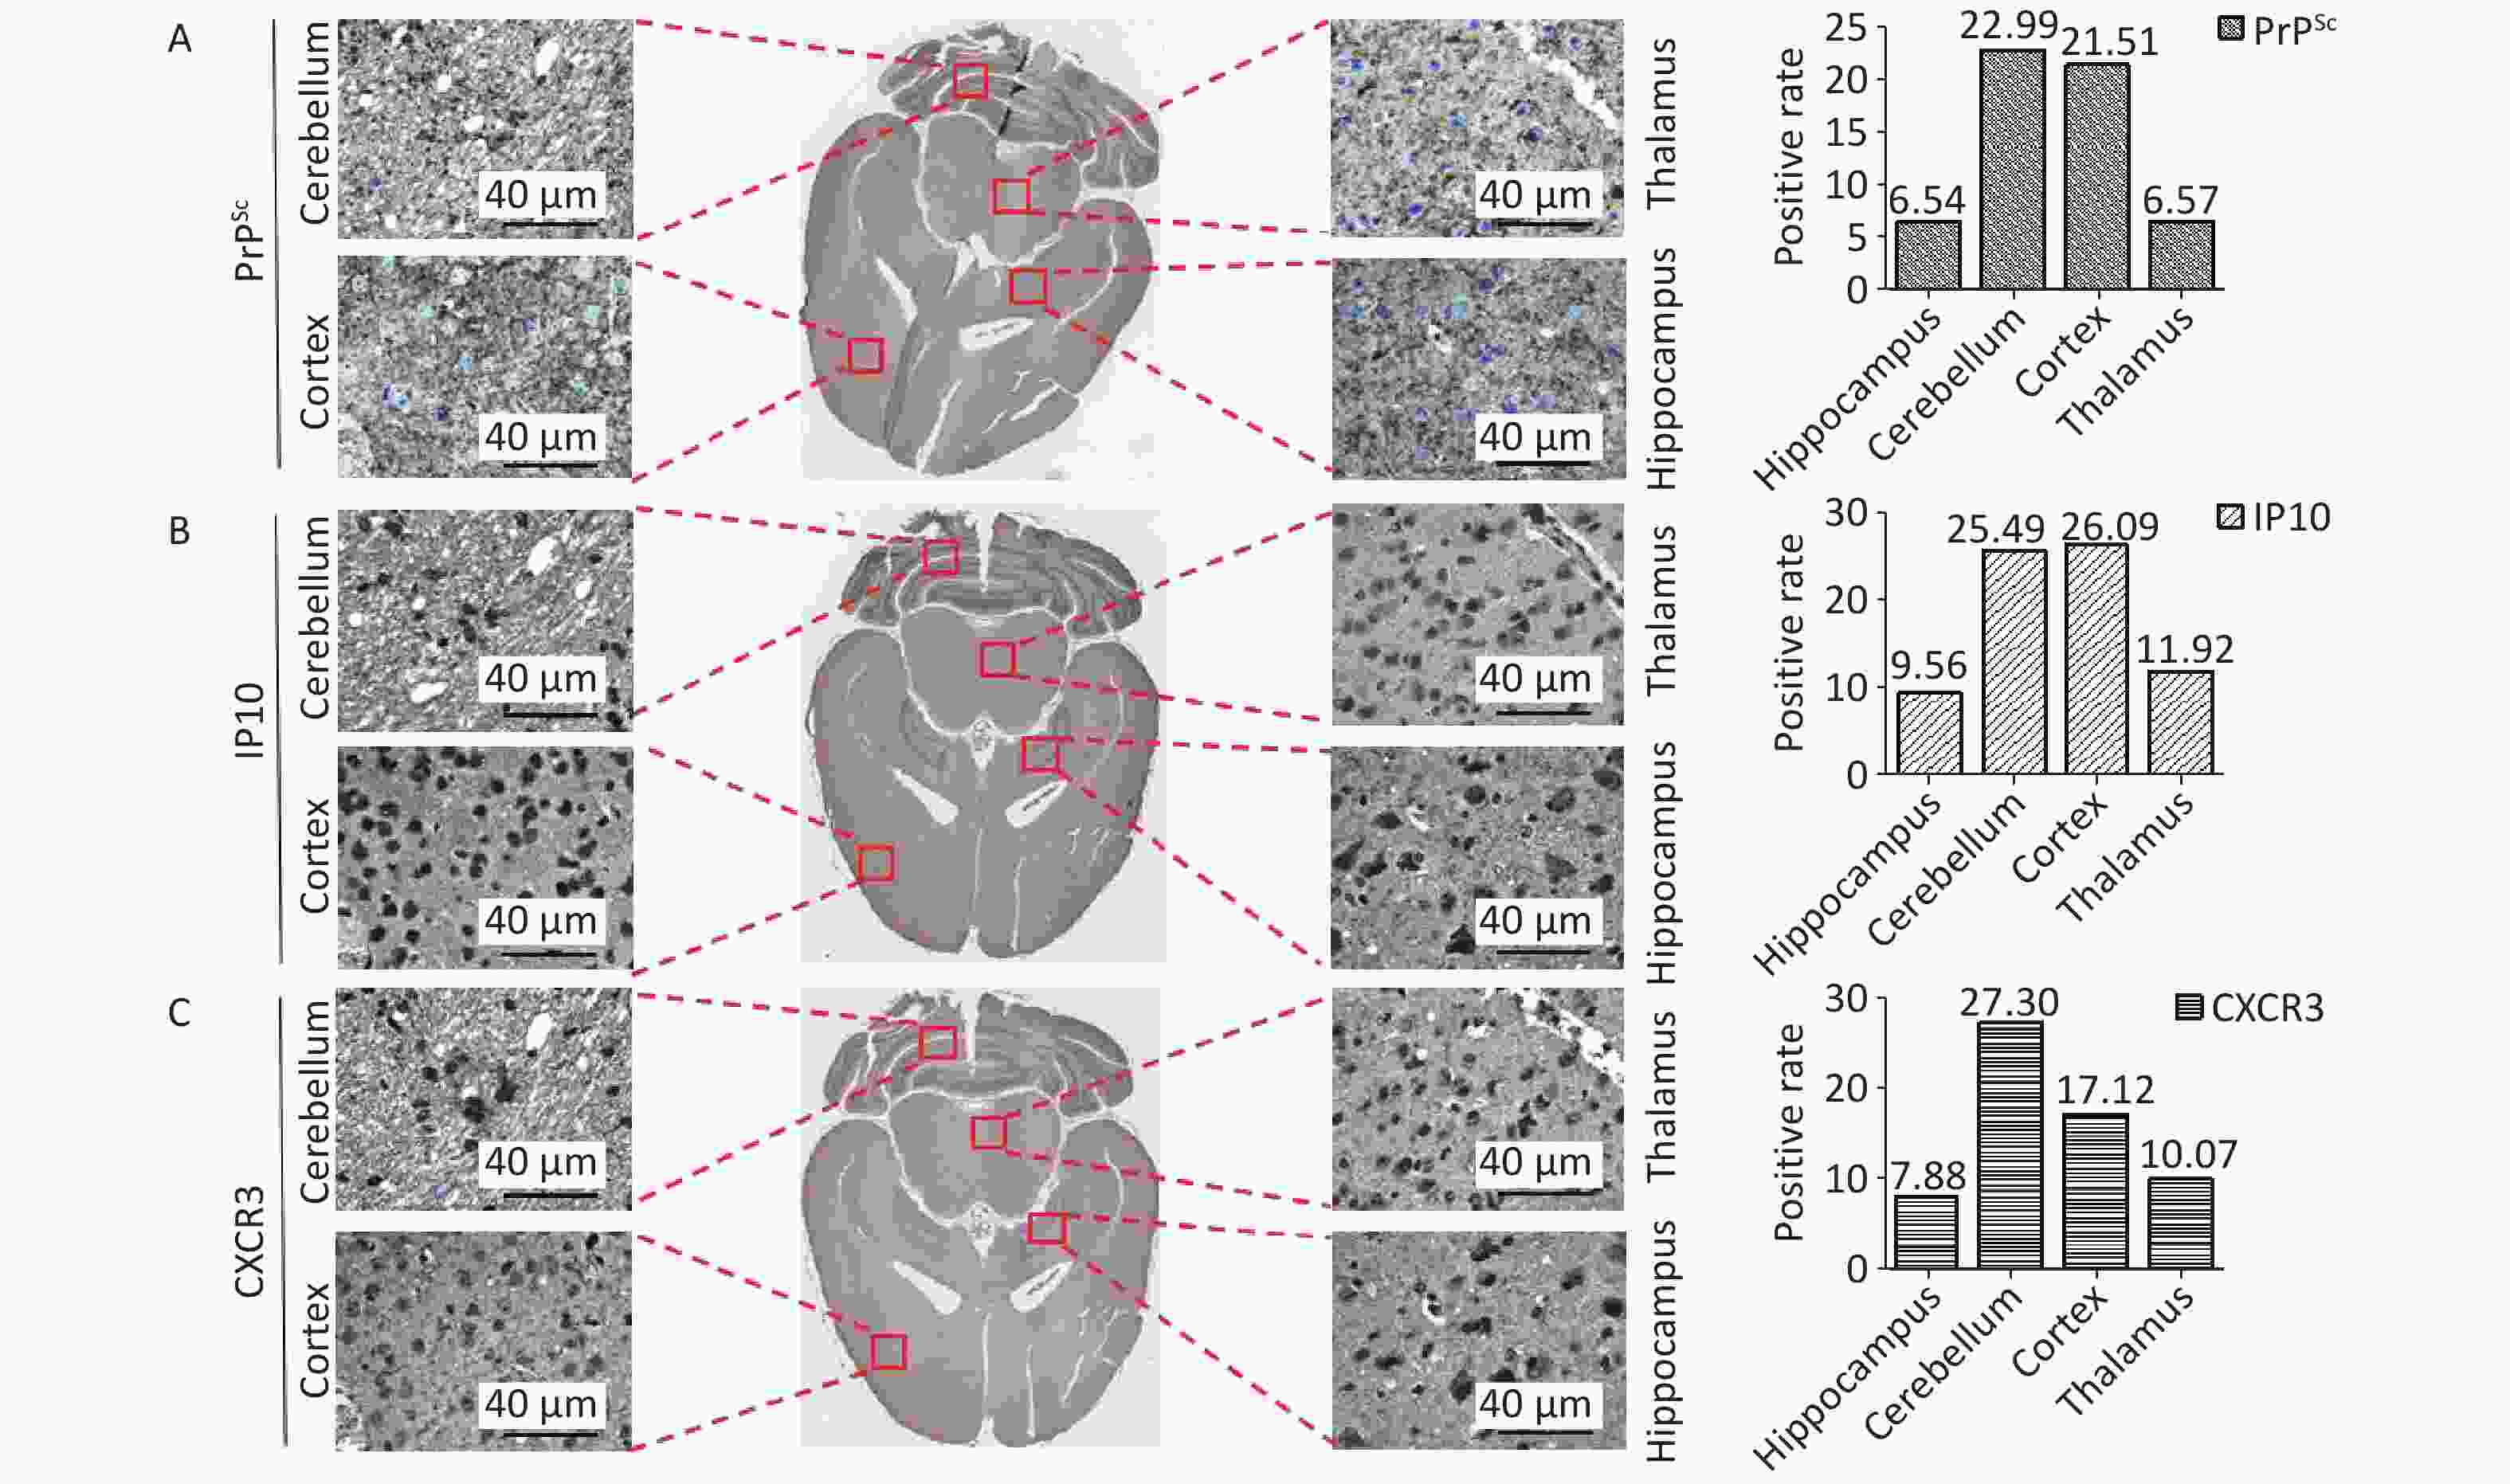
Figure 6. Co-distribution of PrPSc, IP10, and CXCR3 in the distinct brain regions of scrapie-infected mice. Whole brain sections from 139A-infected mice were individually subjected to immunohistochemistry (IHC) assays with specific mAbs against (A) PrPSc, (B) IP10, and (C) CXCR3. The whole brain IHC images generated by the Imagescope software installed in the Leica Aperio CS2 are presented centrally, while representative graphs of the hippocampus, cortex, thalamus, and cerebellum regions are displayed in the surrounding. The positive percentages of PrPSc, IP10, and CXCR3 are depicted on the bottom.
-
To investigate the potential binding of PrP to IP10 and CXCR3, immunoprecipitation assays were performed in SMB-S15 cell lysates using anti-IP10 or anti-CXCR3 as capturing antibodies and anti-PrP as the detection antibody. Prior to Western blotting, the precipitated products were digested with PK (20 mg/mL). Clear PK-resistant PrP bands were detected in preparations captured by either anti-IP10 (Figure 7A) or anti-CXCR3 (Figure 7B) antibodies, but not in those precipitated with isotype mouse IgG, indicating that PrP, particularly PrPSc, could form complexes with both IP10 and CXCR3 in SMB-S15 cells.
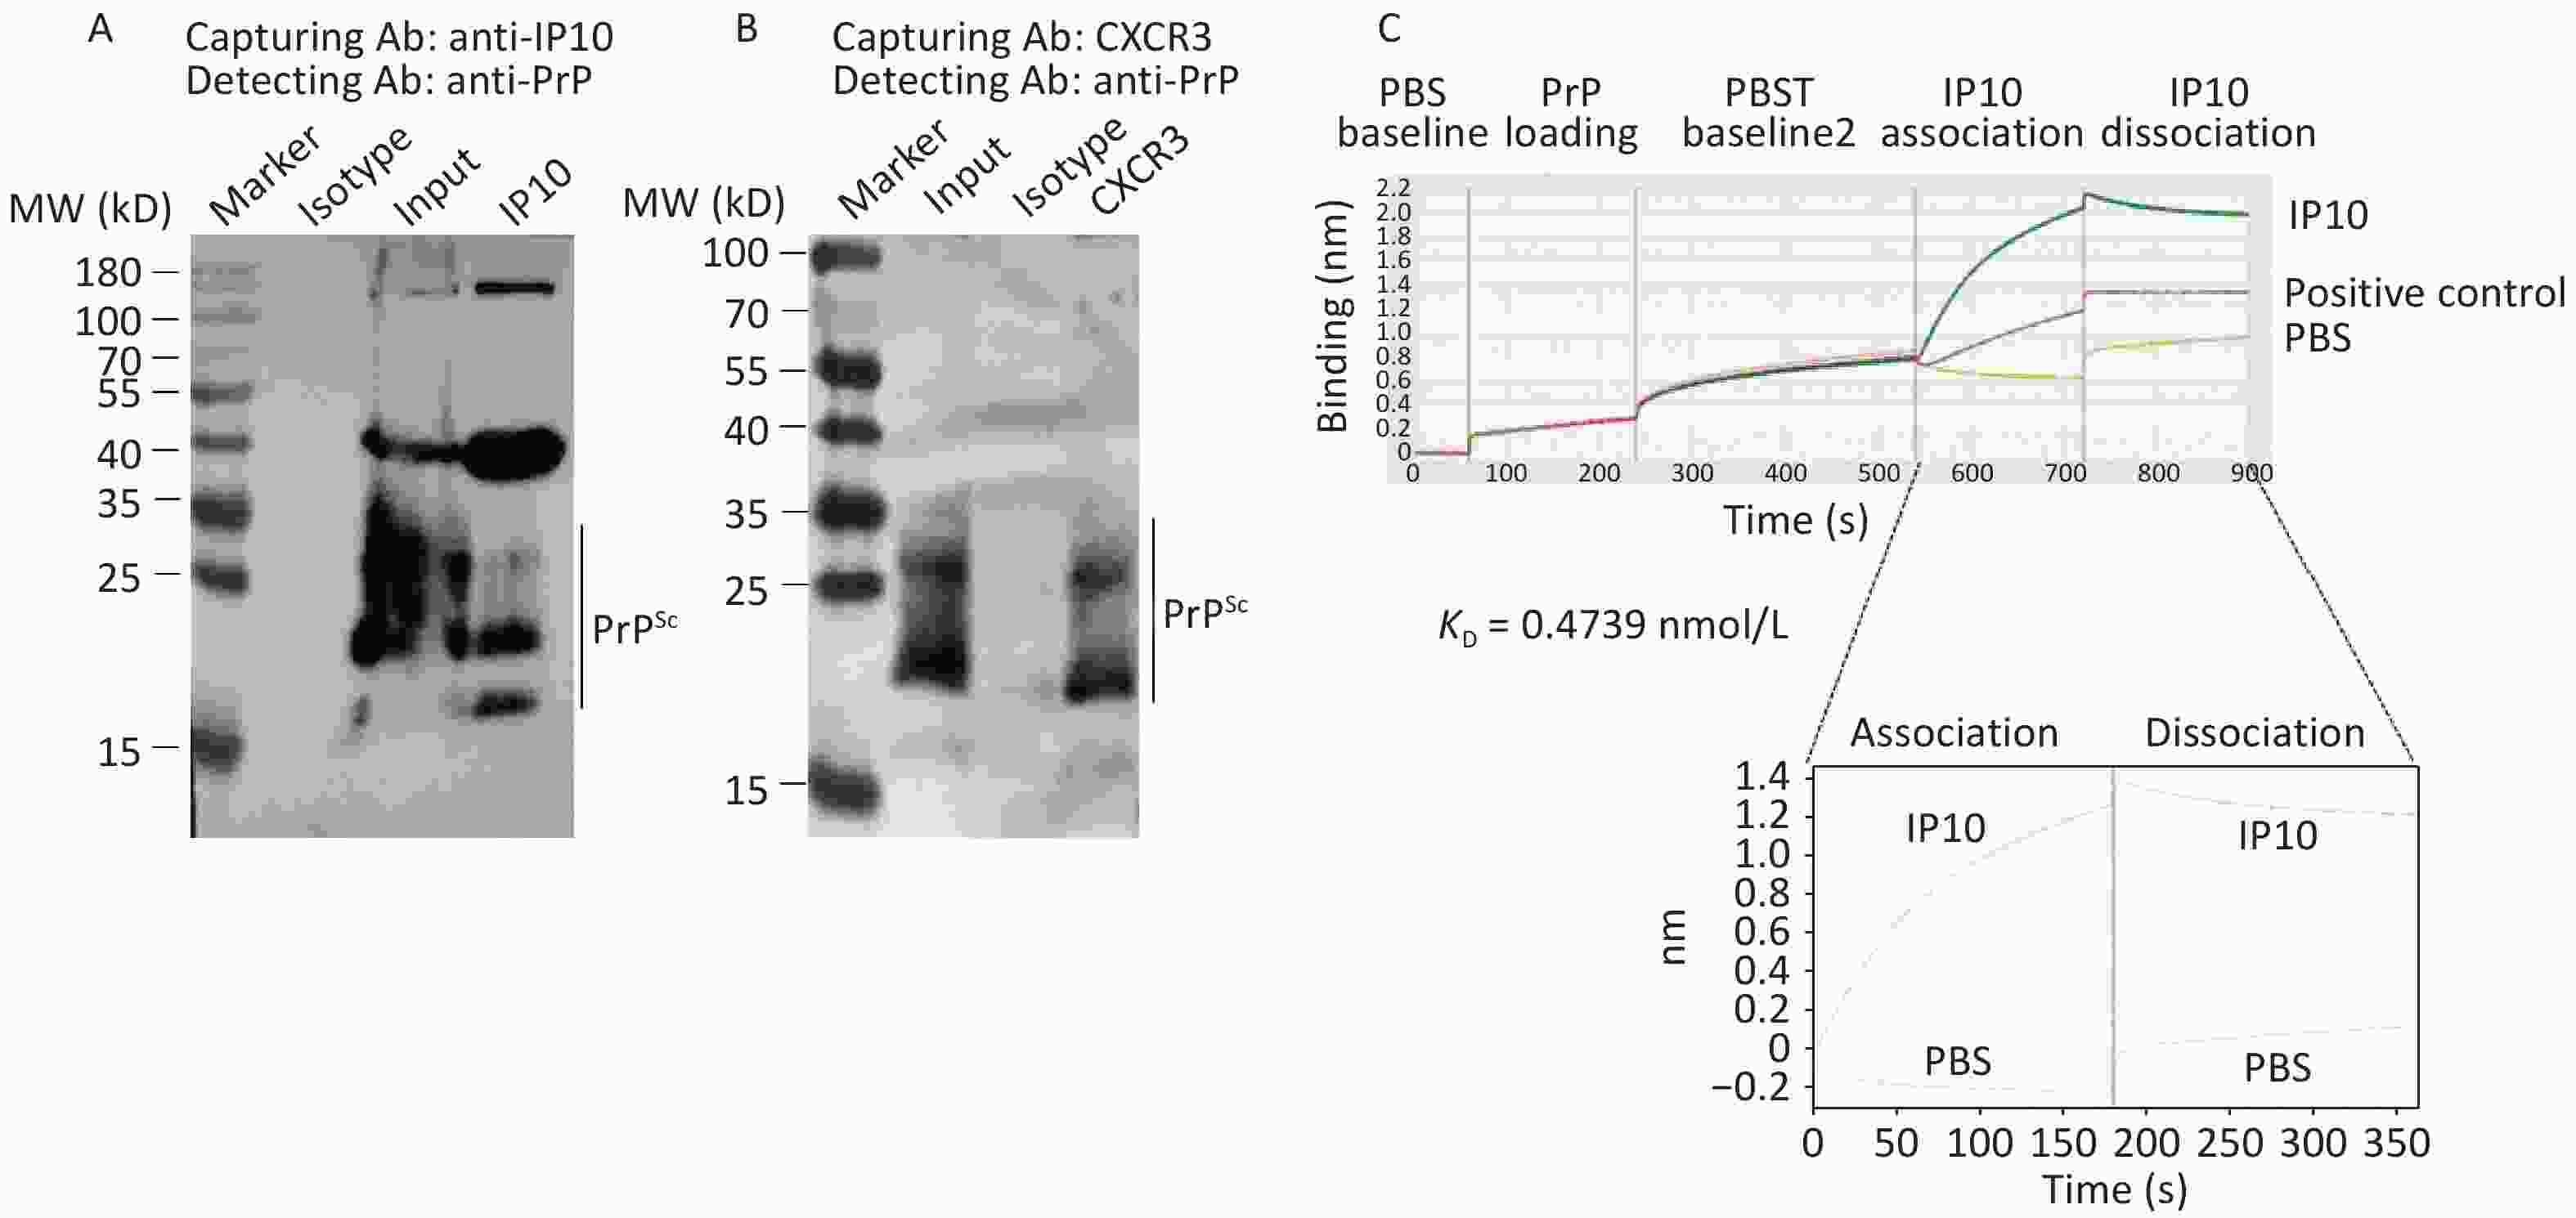
Figure 7. Molecular interactions between PrP/PrPSc and IP10, as well as PrP/PrPSc and CXCR3. (A) Co-IP for PrPSc and IP10. Lysates of SMB-S15 cells were immunoprecipitated using either anti-IP10 or an isotypic IgG control, followed by immunoblotting with anti-PrP antibody. Prior to SDS-PAGE analysis, the eluted product precipitated by anti-PrP antibody was subject to digestion with 20 mg/mL PK. (B) Co-IP for PrPSc and CXCR3: the lysate of SMB-S15 cells was immunoprecipitated using anti-CXCR3 or an isotypic IgG, followed by immunoblotting with an anti-PrP antibody. Prior to SDS-PAGE analysis, the eluted products precipitated using the anti-PrP antibody were subject to digestion with 20 mg/mL PK. (C) Measurement of binding affinities between recombinant full-length human PrP and IP10 were conducted using Biolayer Interferometry, resulting in the automatic generation of the KD (mol/L) value.
To provide further evidence for this interaction, prokaryotic recombinant full-length human PrP (rHuPrP23-231) was expressed and purified, and its binding activity to the commercially supplied recombinant human IP10 protein was measured using the ForteBio Octet RED96E biomolecular interaction analysis system. As shown in Figure 7C, significant binding activity was observed between immobilized rHuPrP23-231 and input IP10, with a KD value of 0.4739 nmol/L.
-
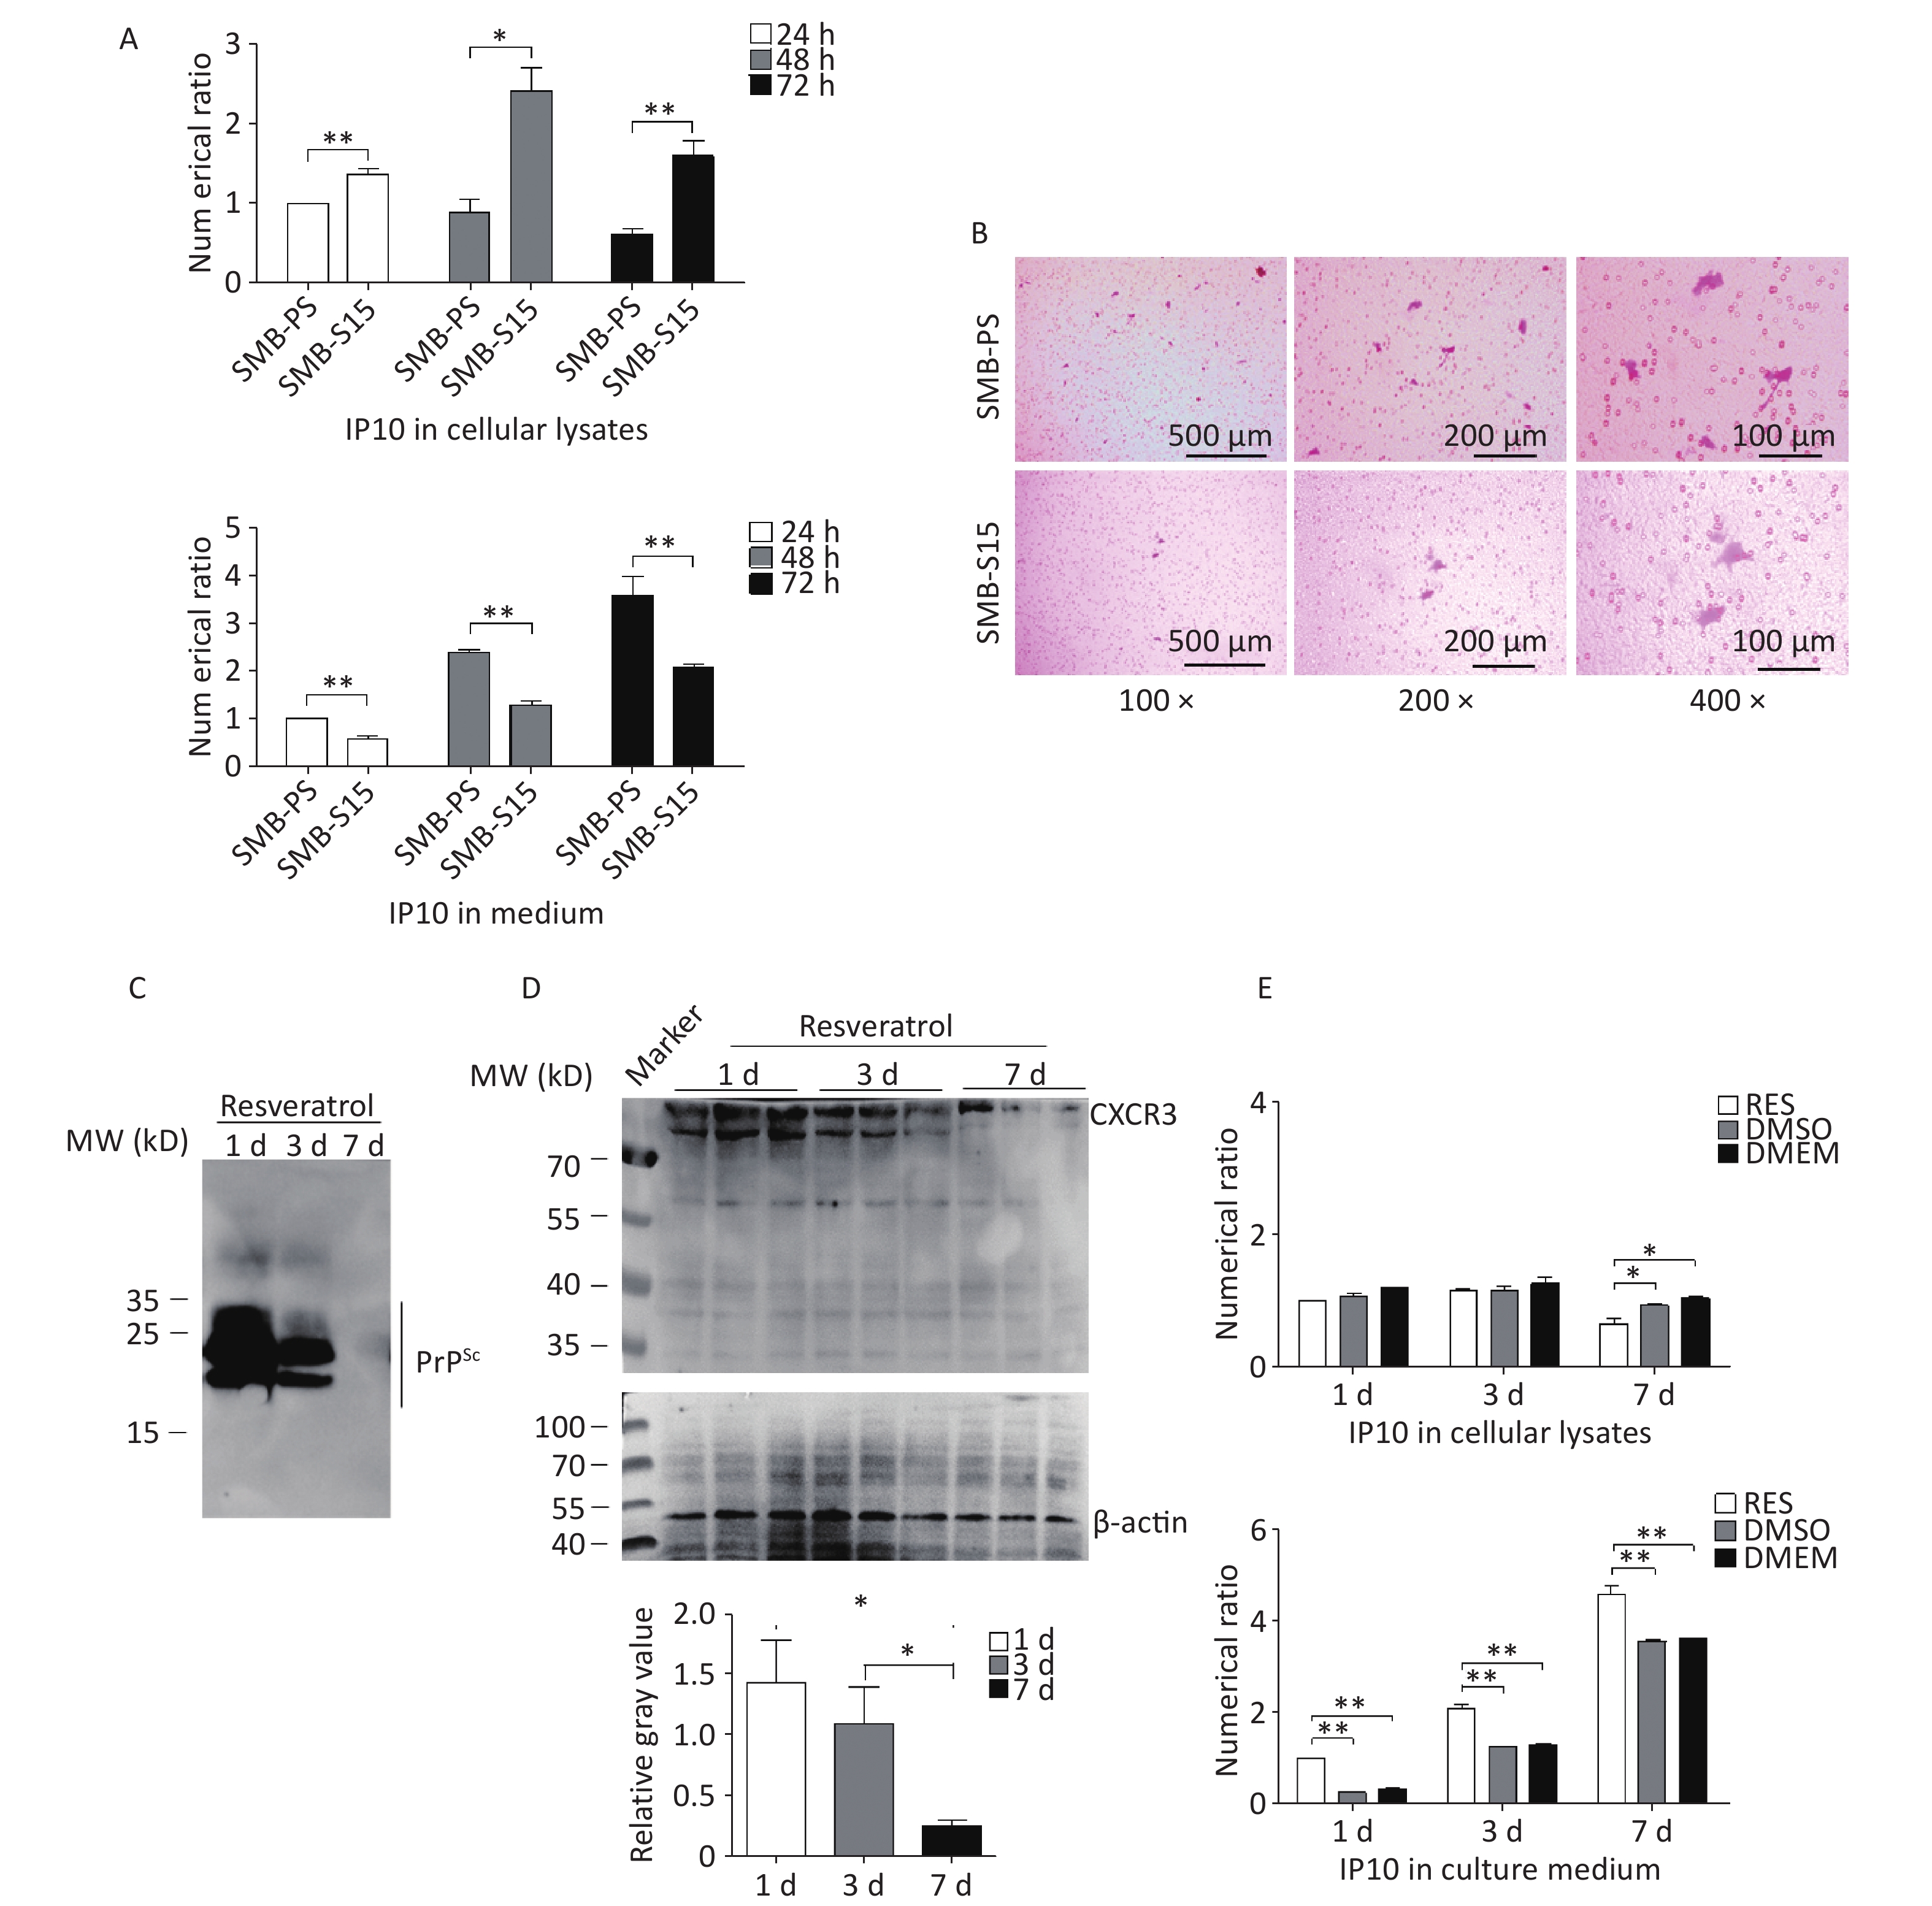
To investigate the distribution of increased IP10 levels inside and outside the SMB-S15 and SMB-PS cells, we collected the culture media and cells separately at 24, 48, and 72 h post-passage. The IP10 levels in both fractions were subsequently quantified using a commercial IP10 ELISA kit. Interestingly, at all three time points, the intracellular levels of IP10 in SMB-S15 cells were higher than those in SMB-PS cells. However, the levels of extracellular IP10 in the culture media from SMB-S15 cells were significantly lower than those in SMB-PS cells (Figure 8A). These findings highlight the increased distribution of IP10, mainly within prion-infected cells. To compare the activity of IP10 in the medium fractions, two SMB cell lines were co-cultured with the microglial cell line BV2 separated by a semipermeable membrane. After staining the membranes with crystal violet, migrated BV2 cells were counted. As expected, a greater number of migrated BV2 cells was observed on membranes from co-culture preparations with SMB-PS cells compared to those from SMB-S15 cells (Figure 8B).
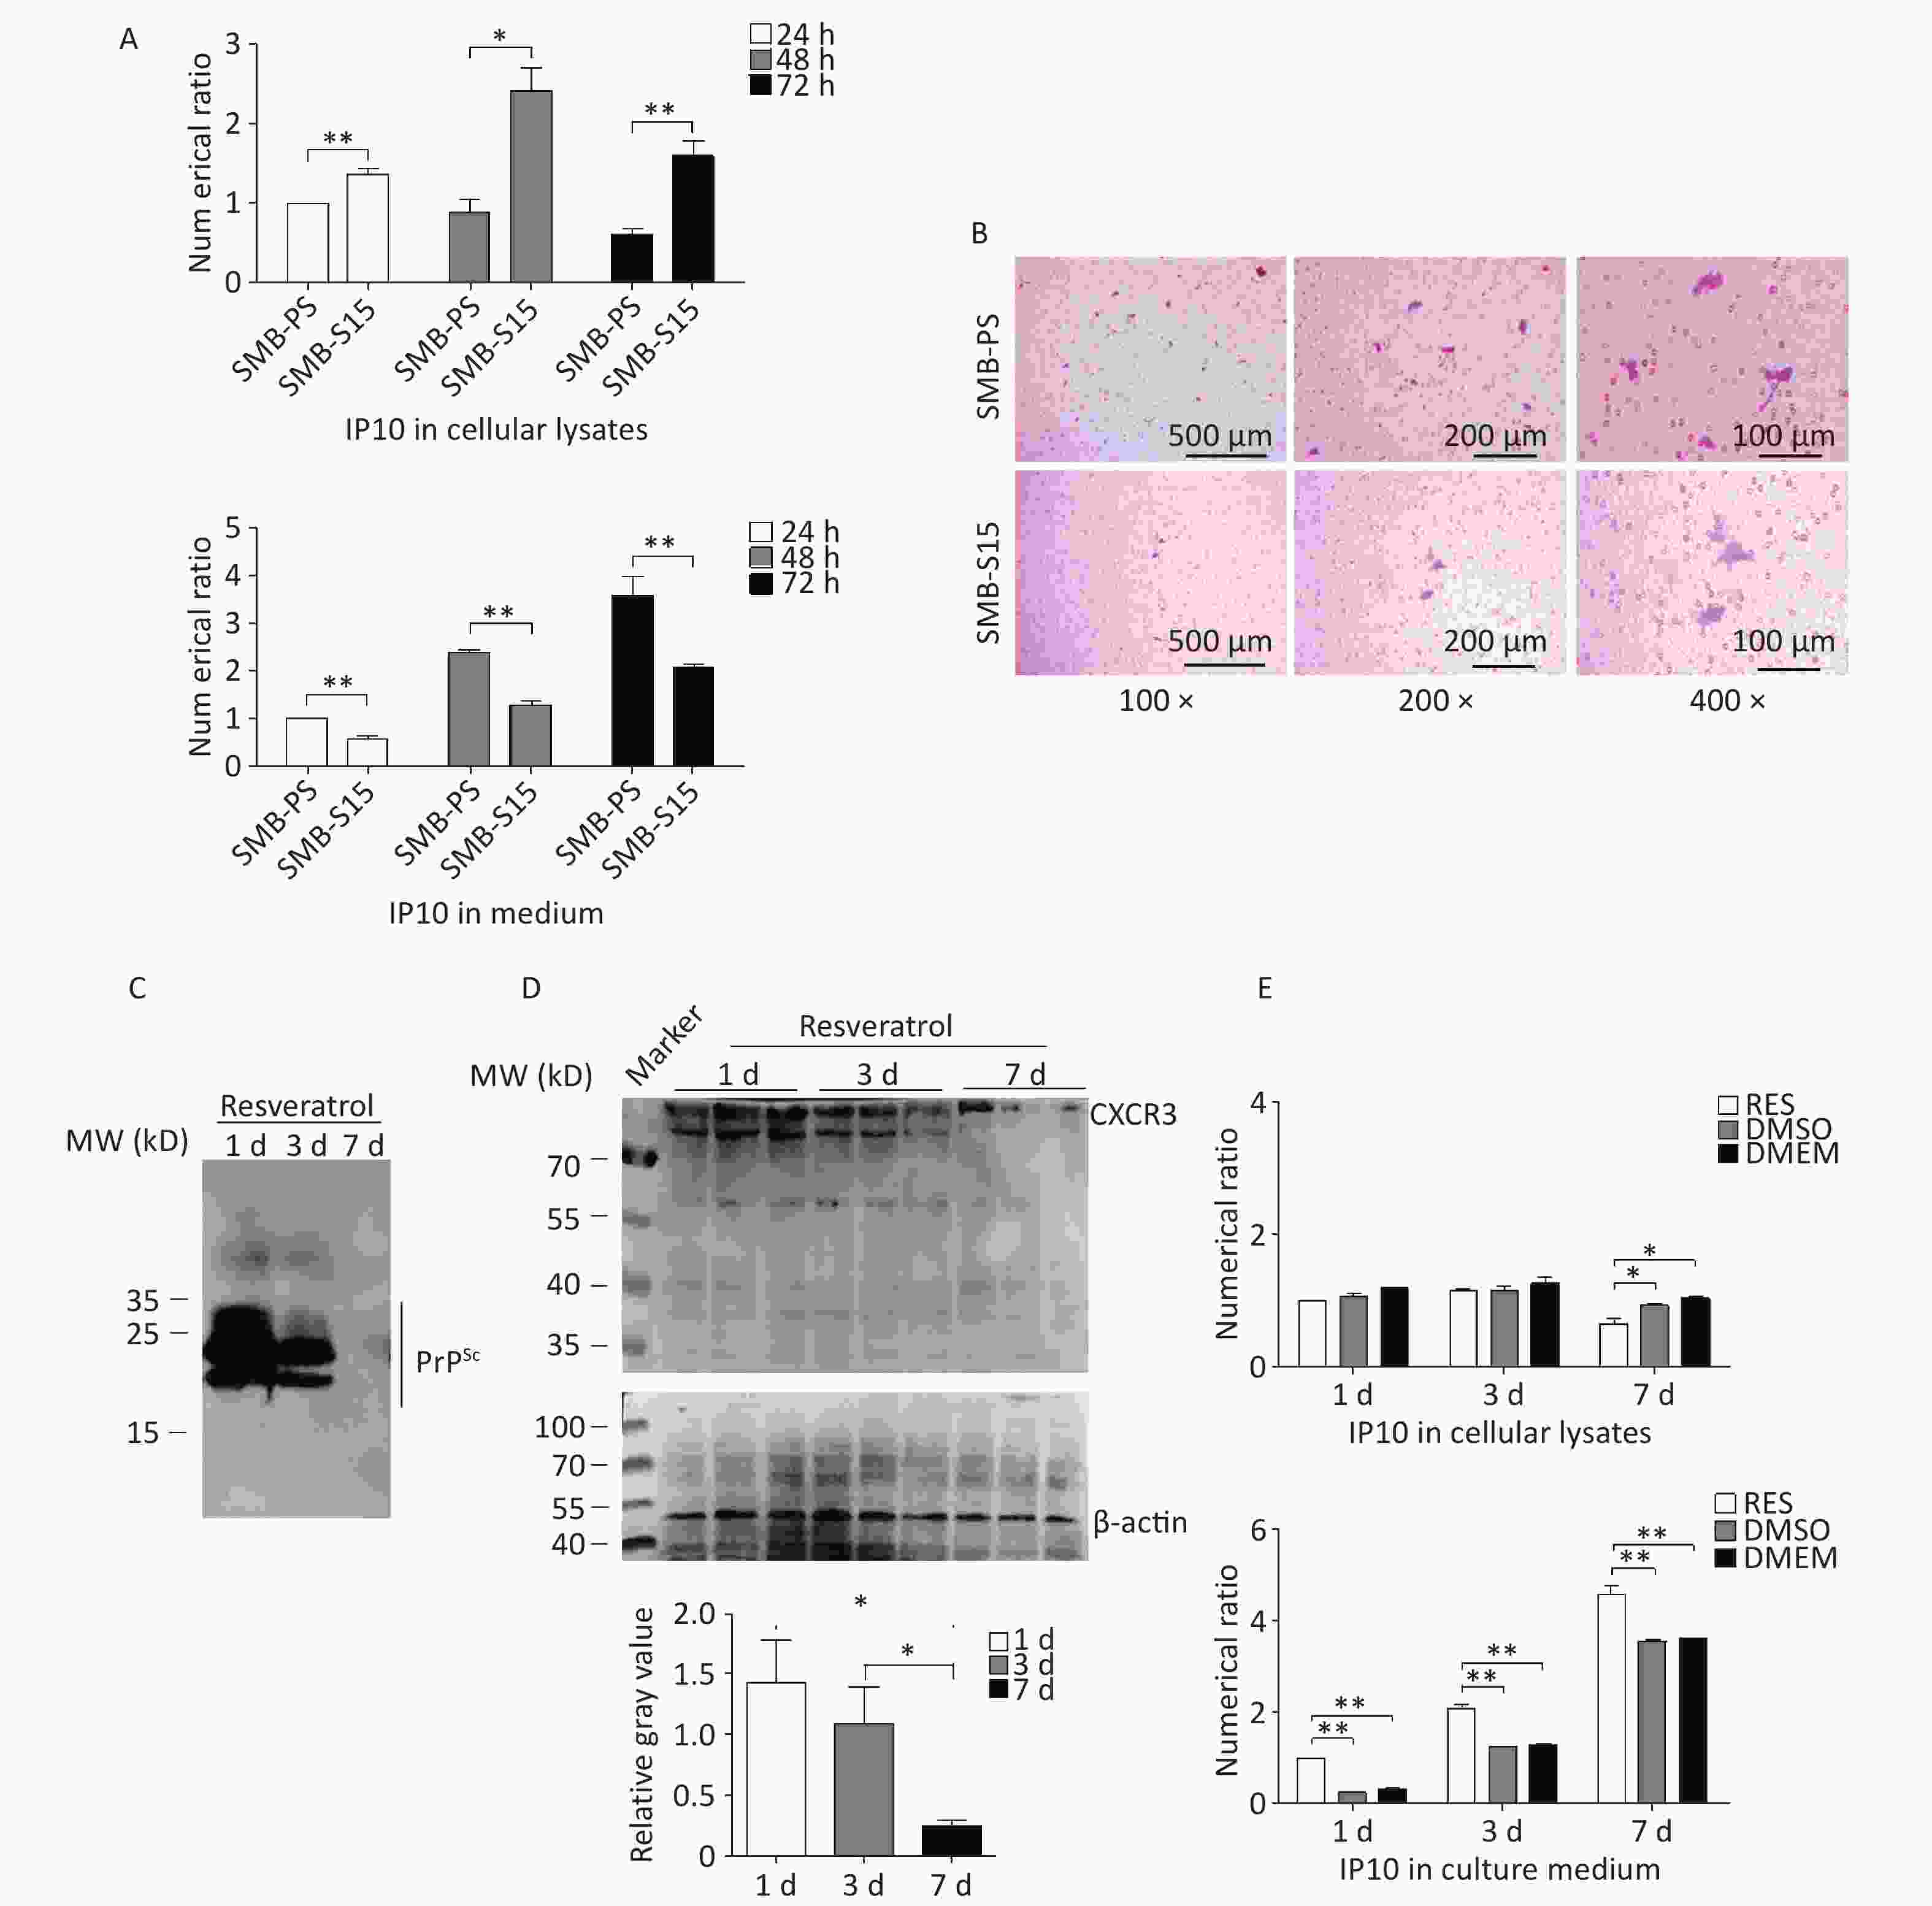
Figure 8. Distributions of IP10 and CXCR3 in cellular lysates and cultured medium before and after resveratrol treatment. (A) Measurement of IP10 in the cytolysis and medium of SMB-S15 and SMB-PS cells using ELISA prior to resveratrol treatment. Cells were collected at 24, 48, and 72 h after passage, and the IP10 values for each preparation were normalized to those of SMB-PS cells collected after 24 h. The Y-axis represents the numerical values, while graphical data represent mean + SEM (n = 3). (B) Representative images of Transwell chemotaxis tests of SMB-PS and SMB-S15 cells prior to resveratrol treatment. BV2 cells adhering to the membrane were subject to crystal violet staining. (C) Western blotting for PrPSc in SMB-S15 cells collected at 1, 3, and 7 days post-treatment with resveratrol (n = 3). The cell lysates were subject to proteolytic digestion using 20 mg/mL PK prior to SDS-PAGE. (D) Western blotting for CXCR3 in SMB-S15 cell lysates treated with resveratrol for 1, 3, and 7 days (n = 3). (E) Measurement of IP10 in the cytolysis solution and medium of SMB-S15 using ELISA after treatment with resveratrol. Cells were collected 1, 3, and 7 days post-exposure to resveratrol or DMSO. DMEM mock cells maintained in culture medium without any treatment. The IP10 values for each sample were normalized against those of SMB-RES cells treated with resveratrol for 1 day. The Y-axis represents numerical values, while graphical data represent mean + SEM (n = 3).
Our previous study showed that the treatment of SMB-S15 cells with resveratrol effectively reduced PrPSc accumulation in vitro and prion infection in vivo[31]. To evaluate the potential impact of prion propagation inhibition on IP10 expression, SMB-S15 cells were further treated with 10 μmol/L resveratrol for 1, 3, or 7 days, and cell lysates and culture medium fractions were collected separately. PrP-specific Western blotting of cell lysates demonstrated clear signals of PK-resistant PrP (PrPres) in SMB-S15 cells exposed to resveratrol for one day, which became weaker after three days, and markedly diminished after seven days (Figure 8C). CXCR3-specific Western blotting further showed a notable reduction in CXCR3 intensity in SMB-S15 cells treated with resveratrol for 7 days (Figure 8D). ELISA analysis of IP10 levels in the cytolytic fraction revealed a significant decrease following treatment with resveratrol for 7 days, whereas a remarkable increase was observed in the culture medium as early as day one compared to DMSO- and mock-treated cells (Figure 8E). These data suggest that the inhibition of prion replication by resveratrol converts cellular IP10 accumulation and secretion while restoring elevated CXCR3 levels.
-
Following our previous study, we confirmed the elevation of brain IP10 levels in various scrapie-infected experimental rodent models using different techniques. The increased IP10 levels demonstrated close colocalization with neurons rather than with microglia and astrocytes. Additionally, elevated IP10 expression was observed in prion-infected SMB-S15 cells. Importantly, heightened activity of CXCR3, the receptor for IP10, was also observed in the brains of scrapie-infected animals and prion-infected cell lines. Morphologically, increased IP10 and CXCR3 closely colocalize with PrPSc within the neuronal cells of scrapie-infected brains, whereas these three elements show highly coincidental distributions across the different brain regions. Molecular interactions between PrPSc and IP10, as well as CXCR3 have also been confirmed, strongly suggesting that the accumulation of IP10 within neurons may occur as a consequence of abnormal PrPSc deposition. Moreover, we discovered a greater accumulation of IP10 within the cytoplasmic compartments of prion-infected cell lines. Treatment with resveratrol effectively suppressed prion propagation in SMB-S15 cells by significantly reducing the cytoplasmic accumulation of IP10 and decreasing the levels of CXCR3. These novel findings present a new perspective on the active participation of the chemokine IP10 and its receptor CXCR3 in prion pathophysiology.
Neuroinflammation occurs as a consequence of the host’s innate immune response to various pathological conditions of the CNS, including infection, injury, and proliferative and degenerative disorders. Neuroinflammation can trigger either neuroprotective or neurotoxic pathophysiological effects. Active neuroinflammatory responses have been extensively documented in prion diseases, and are characterized by microglial activation, complement system activation, and increased production of inflammatory cytokines[32-37]. IP10 is primarily secreted by the microglia within the CNS following LPS stimulation[38]. Previous studies have also demonstrated the pathological effects of elevated IP10 levels in neuronal cells under abnormal conditions[39-41]. Increased levels of IP10 have also been repeatedly observed in the brain tissue, CSF, and peripheral blood samples of patients with AD and AD transgenic mice[42-44]. In patients with PD, cognitive function and ability have been shown to be closely associated with IP10 levels[41], while increased IP10 expression promotes an overall inflammatory response and accelerates neuronal cell death[45]. The observed increase in brain IP10 during prion infection aligns with similar alterations observed in AD and PD.
We further provided, for the first time, evidence of upregulation of the receptor CXCR3 in the brains of scrapie-infected mouse models, along with an increase in brain IP10 levels. CXCR3 serves as a receptor for IP10, monokine-induced interferon-gamma (Mig/CXCL9), and interferon-gamma-inducible T-cell alpha-chemoattractant (I-TAC/CXCL11). In certain contexts, the IP10/CXCR3 signaling pathway may further contribute to neuronal apoptosis by activating pro-apoptotic signaling cascades such as the MAPK family of pathways (particularly p38). This effect is particularly relevant in the context of viral infections, autoimmune diseases, and neurodegenerative disorders[46]. The critical role of CXCR3 in modulating glial cell activation during cuprizone-induced toxic demyelination has also been previously demonstrated[47]. Elevated CXCR3 expression has previously been documented in brain tissues affected by neuroinflammatory and neurodegenerative diseases, such as AD, multiple sclerosis (MS), glioma, chronic pain, human T-lymphotropic virus type 1-associated myelopathy/tropical spastic paraparesis (HAM/TSP) and bipolar disorder[48]. Constitutive expression of CXCR3 has further been observed in a subpopulation of neurons across various regions, including the neocortex, hippocampal formation, striatum, cerebellum, and spinal cord, of the postmortem brain tissue extracted from patients with AD patients[49]. The expression patterns of IP10, Mig, and CXCR3 have also been detected in the CNS tissues of patients with MS[46]. The IP10/CXCR3 signaling pathway may play a role in neuronal regeneration by modulating the proliferation and differentiation of neural progenitor cells[46]. Prion diseases exhibit similar activation patterns within the IP10/CXCR3 signaling pathway.
The IHC data presented herein demonstrated a close morphological association between the deposition of PrPSc and the accumulation of IP10 and CXCR3 in the brain tissues of prion-infected mice. These histopathological characteristics are reflected not only by the colocalizations of these three factors in serial brain sections, but also by their distribution in various brain regions observed throughout the brain. Among patients with AD, IP10-positive astrocytes have further been found to be associated with amyloid deposits[49]. Increased levels of IP10 show intense colocalization with Aβ-plaques in AD model mice[42]. Within demyelinating lesions of postmortem CNS tissue from MS patients, IP10 and CXCR3 have also been shown to be predominantly expressed within plaques[46]. The regions in which plaque formation occurs have also been identified to include CCR5- and CXCR3-expressing cells[50]. Increased IP10 and CXCR3 levels indicate chronic inflammatory responses to amyloid deposits in AD and MS, thereby facilitating plaque formation[48]. Elevated levels of IP10 and CXCR3 have further been detected within lesions associated with other disorders characterized by plaque formation, such as atherosclerosis[51,52] and psoriasis[53]. The close association between the increases in the levels of IP10 and its receptor CXCR3, as well as abnormal protein amyloid deposits across various disorders, including prion disease, reflects a similar pattern of responsiveness exhibited by the host innate immunity.
In the present study, we found that the removal of prion propagation in the cell model attenuated the elevated cellular levels of IP10 and CXCR3, thus providing evidence that PrPSc deposits directly induced increased expression of IP10 and CXCR3. Conversely, the deprivation of CXCR3 expression may also affect AD pathology. In one study using the amyloid precursor protein (APP)/presenilin 1 (PS1) transgenic mouse model of AD, deletion of CXCR3 was found to significantly reduce amyloid deposition and Aβ levels, enhance microglial uptake of Aβ, and improve spatial memory[54]. Another study using CXCR3-deficient mice further demonstrated that CXCR3 deficiency decreases the activation and accumulation of microglia and astrocytes during cuprizone feeding-induced demyelination, resulting in a milder clinical course and rapid recovery following diet offset[47]. Additionally, studies have shown that prion-infected CXCR3 knockout mice exhibit decreased microglial activation, but increased astrocyte proliferation, in addition to with extensive prion deposition[55]. Despite an incomplete understanding of the underlying mechanisms[48,56], the therapeutic potential of targeting CXCR3 with different antagonists or monoclonal antibodies against IP10 for AD and MS has been repeatedly evaluated. Further investigations into the deprivation of IP10 and/or inhibition of CXCR3 during prion infection are thus warranted to explore its therapeutic potential in prion diseases.
Additionally, a higher proportion of IP10 accumulation has been shown in the cytoplasmic fraction of prion-infected cell lines. This accumulation pattern could be reversed by removing prion replication. However, the exact underlying mechanisms remain unclear. One hypothesis is that there may be an active molecular interaction between PrPSc and IP10, in which an increased number of PrPSc molecules within infected cells could bind more IP10 molecules. Upon removal of the prion agent, the bound-IP10 complexes are secreted from the cells. The pathophysiological consequences of IP10-CXCR3 signaling activation in prion-infected cells are currently unclear. Prior studies have demonstrated that exposure of human fetal brain cell cultures to simian human immunodeficiency virus (sHIV) 89.6P and viral gp120 leads to the upregulation of IP10 in neurons, subsequently inducing membrane permeability followed by apoptosis via caspase-3 activation[39]. The treatment of cultured neurons with exogenous IP10 further induces apoptosis by elevating intracellular Ca2+ levels and activating caspases[57]. Apoptosis and dysfunction of intracellular Ca2+ homeostasis are common phenomena observed in prion pathology, which can be triggered by various pathways[58,59]. As such, it is reasonable to hypothesize that the activation of IP10/CXCR3 signaling may further contribute to such abnormalities in both prion-infected cells and the brain.
-
Not applicable.
-
Table S1. Primers used in the present study
Primer Sequence β-actin forward 5′-TAAAACGCAGCTCAGTAACAGTCCC-3′ β-actin reverse 5′-TGGAATCCTGTGGCATCCATGAAAC-3′ CXCR3 forward 5′- TAAAACGCAGCTCAGTAACAGTCCC-3′ CXCR3 reverse 5′- TGGAATCCTGTGGCATCCATGAAAC-3′ IP-10 forward 5′-ATCCCTCTCGCAAGGACGGT-3′ IP-10 reverse 5′-CGGATTCAGACATCTCTGCT-3′
doi: 10.3967/bes2024.158
Activation of IP10/CXCR3 Signaling is Highly Coincidental with PrPSc Deposition in the Brains of Scrapie-Infected Mice
-
Abstract:
Objective To analyze the relationship between Chemokine IP10 and its receptor CXCR3 during prion infection. Methods We investigated the increases in IP10 signals, primarily localized in neurons within the brains of scrapie-infected mice, using western blotting, ELISA, co-immunoprecipitation, immunohistochemistry, immunofluorescence assays, and RT-PCR. Results Both CXCR3 levels and activation were significantly higher in the brains of scrapie-infected mice and prion-infected SMB-S15 cells. Enhanced CXCR3 expression was predominantly observed in neurons and activated microglia. Morphological colocalization of PrPC/PrPSc with IP10/CXCR3 was observed in scrapie-infected mouse brains using immunohistochemistry and immunofluorescence. immunohistochemistry (IHC) analysis of whole brain sections further revealed increased accumulation of IP10/CXCR3 specifically in brain regions with higher levels of PrPSc deposits. Co-immunoprecipitation and biomolecular interaction assays revealed the molecular interactions between PrP and IP10/CXCR3. Notably, a significantly larger amount of IP10 accumulated within prion-infected SMB-S15 cells than in the normal partner cell line, SMB-PS. Importantly, resveratrol treatment effectively suppressed prion replication in SMB-S15 cells, thereby restoring the accumulation and secretion pattern of cellular IP10 similar to that observed in SMB-PS cells. Conclusion Our data demonstrate that the activation of IP10/CXCR3 signaling in prion-infected brain tissues coincides with PrPSc deposition. Modulation of IP10/CXCR3 signaling in the brain represents a potential therapeutic target for mitigating the progression of prion diseases. -
Key words:
- Prion /
- Chemokine /
- IP10 /
- CXCR3 /
- Activation
&These authors contributed equally to this work.
注释:1) COMPETING INTERESTS: -
S1. IF and IHC staining with only secondary antibodies in cortical regions of 139A/ME7-mouse models and age-matched healthy controls.
Figure 1. Upregulation of IP10 in the brains of scrapie-infected mice. (A) Western blot analysis showing IP10 levels in brain homogenates extracted from terminal stage mice treated with 139A and ME7 prion strains (n = 3). Equal quantities of the brain homogenates of normal and infected mice were loaded onto a 12% SDS-PAGE gel, with β-actin as an internal control. Molecular weight markers are depicted on the left side. Quantitative densitometry analysis relative to IP10/β-actin is presented on the right side, with graphical data representing the mean + SEM (n = 3). Statistical differences relative to controls are shown above the images. (B) Representative images demonstrating double staining for IP10 (green) and NeuN (red) in the brain sections of 139A and ME7 infected mice. (C) Representative images showing double staining for IP10 (red) and Iba-1 (green) in the brain sections of 139A and ME7 infected mice. (D) Representative images displaying double staining for IP10 (green) and GFAP (red) in brain sections of 139A and ME7 infected mice. The enlarged images are presented on the right side.
Figure 2. Upregulation of IP10 in prion-infected SMB-S15 cells. (A) IP10 specific qRT-PCR. Quantitative real-time PCR (qRT-PCR) was performed to analyze the transcriptional levels of IP10 in three batches of cultured SMB-S15 and SMB-PS cells. The Y-axis represents the values of 2-ρρCT for SMB-S15 and SMB-PS cells (n = 3). (B) Western blot for IP10 in three batches of each SMB cell line (n = 3). (C) Measurement of IP10 level with an ELISA Kit. The quantities of IP10 (pg/mL) are depicted on the Y-axis (n = 3). (D) Representative images of IP10-specific IFAs. The intensity optical density (IOD) values for IP10 were automatically calculated using Image J software for whole cells, cytoplasm, and nuclear fractions separately.
Figure 3. Upregulation of CXCR3 in the prion-infected cell line SMB-S15. (A) Western blot for CXCR3 in three batches of each of the SMB cell line. Quantitative assays were performed using densitometry analysis using CXCR3/β-actin as the reference, while the graphical data represent the mean + SEM (n = 3). (B) CXCR3-specific IFAs. The software image J is utilized to automatically calculate the IOD values of CXCR3 in SMB-S15 and SMB-PS cells (n = 3).
Figure 4. Upregulation of CXCR3 in the brains of scrapie-agent infected mice. (A) CXCR3 specific qRT-PCR. Total RNA extracted from normal, 139A, and ME7 infected mice (n = 3 each) were subjected to CXCR3 specific qRT-PCR. The Y-axis represents the 2-ρρCT values. (B) Specific Western blots for CXCR3. Equal amounts of brain homogenates from normal and infected mice (n = 3 each) were subjected to CXCR3-specific Western blot analysis. Quantitative assays were determined by assessment of the densitometry relative to IP10/β-actin, while the graphical data represent the mean + SEM. (C) Representative graphs of CXCR3-specific immunohistochemistry (IHC) assays of the brain sections of normal, 139A, and ME7 infected mice. The brain regions of the hippocampus, cortex, thalamus, and cerebellum are indicated above the images. (D) Representative images of double staining for of CXCR3 (red) and NeuN (green) in the brain sections of normal and 139A infected mice. (E) Representative images of double staining for CXCR3 (green) and GFAP (red) in the brain sections of normal and 139A infected mice. (F) Representative images of CXCR3 (red) and Iba-1 (green) double staining in brain sections from normal and 139A infected mice. Enlarged images are shown on the right-hand side.
Figure 5. Morphological colocalization of PrP/PrPSc, IP10, and CXCR3 in the brains of scrapie-infected mice. (A)–(C) Representative immunofluorescence images depicting the colocalization of PrP (green) and IP10 (red) in the following distinct brain regions: the cortex (A), hippocampus (B), and cerebellum (C), of both normal and 139A-infected mice. (D)–(F) Representative images depicting the double staining of PrP (red) and CXCR3 (green) in the cortex (D), hippocampus (E), and cerebellum (F) regions of normal and 139A infected mice. Enlarged images are shown on the right. (G) Representative immunohistochemistry (IHC) images of PrPSc, IP10, and CXCR3 in serial brain sections of 139A-infected mice. For PrPSc detection, the brain sections underwent GdnHCl treatment followed by staining with a PrP specific mAb prior to IHC analysis. Colocalized signals are indicated with arrows.
Figure 6. Co-distribution of PrPSc, IP10, and CXCR3 in the distinct brain regions of scrapie-infected mice. Whole brain sections from 139A-infected mice were individually subjected to immunohistochemistry (IHC) assays with specific mAbs against (A) PrPSc, (B) IP10, and (C) CXCR3. The whole brain IHC images generated by the Imagescope software installed in the Leica Aperio CS2 are presented centrally, while representative graphs of the hippocampus, cortex, thalamus, and cerebellum regions are displayed in the surrounding. The positive percentages of PrPSc, IP10, and CXCR3 are depicted on the bottom.
Figure 7. Molecular interactions between PrP/PrPSc and IP10, as well as PrP/PrPSc and CXCR3. (A) Co-IP for PrPSc and IP10. Lysates of SMB-S15 cells were immunoprecipitated using either anti-IP10 or an isotypic IgG control, followed by immunoblotting with anti-PrP antibody. Prior to SDS-PAGE analysis, the eluted product precipitated by anti-PrP antibody was subject to digestion with 20 mg/mL PK. (B) Co-IP for PrPSc and CXCR3: the lysate of SMB-S15 cells was immunoprecipitated using anti-CXCR3 or an isotypic IgG, followed by immunoblotting with an anti-PrP antibody. Prior to SDS-PAGE analysis, the eluted products precipitated using the anti-PrP antibody were subject to digestion with 20 mg/mL PK. (C) Measurement of binding affinities between recombinant full-length human PrP and IP10 were conducted using Biolayer Interferometry, resulting in the automatic generation of the KD (mol/L) value.
Figure 8. Distributions of IP10 and CXCR3 in cellular lysates and cultured medium before and after resveratrol treatment. (A) Measurement of IP10 in the cytolysis and medium of SMB-S15 and SMB-PS cells using ELISA prior to resveratrol treatment. Cells were collected at 24, 48, and 72 h after passage, and the IP10 values for each preparation were normalized to those of SMB-PS cells collected after 24 h. The Y-axis represents the numerical values, while graphical data represent mean + SEM (n = 3). (B) Representative images of Transwell chemotaxis tests of SMB-PS and SMB-S15 cells prior to resveratrol treatment. BV2 cells adhering to the membrane were subject to crystal violet staining. (C) Western blotting for PrPSc in SMB-S15 cells collected at 1, 3, and 7 days post-treatment with resveratrol (n = 3). The cell lysates were subject to proteolytic digestion using 20 mg/mL PK prior to SDS-PAGE. (D) Western blotting for CXCR3 in SMB-S15 cell lysates treated with resveratrol for 1, 3, and 7 days (n = 3). (E) Measurement of IP10 in the cytolysis solution and medium of SMB-S15 using ELISA after treatment with resveratrol. Cells were collected 1, 3, and 7 days post-exposure to resveratrol or DMSO. DMEM mock cells maintained in culture medium without any treatment. The IP10 values for each sample were normalized against those of SMB-RES cells treated with resveratrol for 1 day. The Y-axis represents numerical values, while graphical data represent mean + SEM (n = 3).
S1. Primers used in the present study
Primer Sequence β-actin forward 5′-TAAAACGCAGCTCAGTAACAGTCCC-3′ β-actin reverse 5′-TGGAATCCTGTGGCATCCATGAAAC-3′ CXCR3 forward 5′- TAAAACGCAGCTCAGTAACAGTCCC-3′ CXCR3 reverse 5′- TGGAATCCTGTGGCATCCATGAAAC-3′ IP-10 forward 5′-ATCCCTCTCGCAAGGACGGT-3′ IP-10 reverse 5′-CGGATTCAGACATCTCTGCT-3′  下载: 导出CSV
-
[1] Walker LC, Jucker M. Neurodegenerative diseases: expanding the prion concept. Annu Rev Neurosci, 2015; 38, 87−103. doi: 10.1146/annurev-neuro-071714-033828 [2] Chen C, Dong XP. Epidemiological characteristics of human prion diseases. Infect Dis Poverty, 2016; 5, 47. doi: 10.1186/s40249-016-0143-8 [3] Aguzzi A, Nuvolone M, Zhu CH. The immunobiology of prion diseases. Nat Rev Immunol, 2013; 13, 888−902. doi: 10.1038/nri3553 [4] Gasque P, Dean YD, McGreal EP, et al. Complement components of the innate immune system in health and disease in the CNS. Immunopharmacology, 2000; 49, 171−86. doi: 10.1016/S0162-3109(00)80302-1 [5] Boshtam M, Asgary S, Kouhpayeh S, et al. Aptamers against pro- and anti-inflammatory cytokines: a review. Inflammation, 2017; 40, 340−9. doi: 10.1007/s10753-016-0477-1 [6] Tribouillard-Tanvier D, Striebel JF, Peterson KE, et al. Analysis of protein levels of 24 cytokines in scrapie agent-infected brain and glial cell cultures from mice differing in prion protein expression levels. J Virol, 2009; 83, 11244−53. doi: 10.1128/JVI.01413-09 [7] Xie WL, Shi Q, Zhang J, et al. Abnormal activation of microglia accompanied with disrupted CX3CR1/CX3CL1 pathway in the brains of the hamsters infected with scrapie agent 263K. J Mol Neurosci, 2013; 51, 919−32. doi: 10.1007/s12031-013-0002-z [8] Felton LM, Cunningham C, Rankine EL, et al. MCP-1 and murine prion disease: separation of early behavioural dysfunction from overt clinical disease. Neurobiol Dis, 2005; 20, 283−95. doi: 10.1016/j.nbd.2005.03.008 [9] Saas P, Boucraut J, Quiquerez AL, et al. CD95 (Fas/Apo-1) as a receptor governing astrocyte apoptotic or inflammatory responses: a key role in brain inflammation? J Immunol, 1999; 162, 2326-33. [10] Gossner A, Hunter N, Hopkins J. Role of lymph-borne cells in the early stages of scrapie agent dissemination from the skin. Vet Immunol Immunopathol, 2006; 109, 267−78. doi: 10.1016/j.vetimm.2005.08.021 [11] Schultz J, Schwarz A, Neidhold S, et al. Role of interleukin-1 in prion disease-associated astrocyte activation. Am J Pathol, 2004; 165, 671−8. doi: 10.1016/S0002-9440(10)63331-7 [12] Rossi D, Zlotnik A. The biology of chemokines and their receptors. Annu Rev Immunol, 2000; 18, 217−42. doi: 10.1146/annurev.immunol.18.1.217 [13] Belperio JA, Keane MP, Arenberg DA, et al. CXC chemokines in angiogenesis. J Leukoc Biol, 2000; 68, 1−8. doi: 10.1189/jlb.68.1.1 [14] Wightman SC, Uppal A, Pitroda SP, et al. Oncogenic CXCL10 signalling drives metastasis development and poor clinical outcome. Br J Cancer, 2015; 113, 327−35. doi: 10.1038/bjc.2015.193 [15] Banquet S, Delannoy E, Agouni A, et al. Role of Gi/o-Src kinase-PI3K/Akt pathway and caveolin-1 in β2-adrenoceptor coupling to endothelial NO synthase in mouse pulmonary artery. Cell Signalling, 2011; 23, 1136−43. doi: 10.1016/j.cellsig.2011.02.008 [16] Chou CH, Wei LH, Kuo ML, et al. Up-regulation of interleukin-6 in human ovarian cancer cell via a Gi/PI3K-Akt/NF-κB pathway by lysophosphatidic acid, an ovarian cancer-activating factor. Carcinogenesis, 2005; 26, 45−52. [17] Ding Q, Lu PP, Xia YJ, et al. CXCL9: evidence and contradictions for its role in tumor progression. Cancer Med, 2016; 5, 3246−59. doi: 10.1002/cam4.934 [18] Hsieh MJ, Tsai TL, Hsieh YS, et al. Dioscin-induced autophagy mitigates cell apoptosis through modulation of PI3K/Akt and ERK and JNK signaling pathways in human lung cancer cell lines. Arch Toxicol, 2013; 87, 1927−37. doi: 10.1007/s00204-013-1047-z [19] Hueso L, Ortega R, Selles F, et al. Upregulation of angiostatic chemokines IP-10/CXCL10 and I-TAC/CXCL11 in human obesity and their implication for adipose tissue angiogenesis. Int J Obes, 2018; 42, 1406−17. doi: 10.1038/s41366-018-0102-5 [20] Kouroumalis A, Nibbs RJ, Aptel H, et al. The chemokines CXCL9, CXCL10, and CXCL11 differentially stimulate Gαi-independent signaling and actin responses in human intestinal myofibroblasts. J Immunol, 2005; 175, 5403−11. doi: 10.4049/jimmunol.175.8.5403 [21] Nash CA, Séverin S, Dawood BB, et al. Src family kinases are essential for primary aggregation by Gi-coupled receptors. J Thromb Haemostasis, 2010; 8, 2273−82. doi: 10.1111/j.1538-7836.2010.03992.x [22] Fang JX, Wang C, Shen C, et al. The expression of CXCL10/CXCR3 and effect of the axis on the function of T lymphocyte involved in oral lichen planus. Inflammation, 2019; 42, 799−810. doi: 10.1007/s10753-018-0934-0 [23] Li JH, Ge ML, Lu SH, et al. Pro-inflammatory effects of the Th1 chemokine CXCL10 in acquired aplastic anaemia. Cytokine, 2017; 94, 45−51. doi: 10.1016/j.cyto.2017.04.010 [24] Trotta T, Costantini S, Colonna G. Modelling of the membrane receptor CXCR3 and its complexes with CXCL9, CXCL10 and CXCL11 chemokines: putative target for new drug design. Mol Immunol, 2009; 47, 332−9. doi: 10.1016/j.molimm.2009.09.013 [25] Chen J, Chen C, Hu C, et al. IP10, KC and M-CSF are remarkably increased in the brains from the various strains of experimental mice infected with different scrapie agents. Virol Sin, 2020; 35, 614−25. doi: 10.1007/s12250-020-00216-3 [26] Xiao K, Zhang BY, Zhang XM, et al. Re-infection of the prion from the scrapie-infected cell line SMB-S15 in three strains of mice, CD1, C57BL/6 and Balb/c. Int J Mol Med, 2016; 37, 716−26. doi: 10.3892/ijmm.2016.2465 [27] Shi Q, Zhang BY, Gao C, et al. Mouse-adapted scrapie strains 139A and ME7 overcome species barrier to induce experimental scrapie in hamsters and changed their pathogenic features. Virol J, 2012; 9, 63. doi: 10.1186/1743-422X-9-63 [28] Clarke MC, Haig DA. Multiplication of scrapie agent in mouse spleen. Res Vet Sci, 1971; 12(2), 195-7. [29] Birkett CR, Hennion RM, Bembridge DA, et al. Scrapie strains maintain biological phenotypes on propagation in a cell line in culture. EMBO J, 2001; 20, 3351−8. doi: 10.1093/emboj/20.13.3351 [30] Niu PH, Zhang SY, Zhou PP, et al. Ultrapotent human neutralizing antibody repertoires against middle east respiratory syndrome coronavirus from a recovered patient. J Infect Dis, 2018; 218, 1249−60. doi: 10.1093/infdis/jiy311 [31] Wang J, Zhang BY, Zhang J, et al. Treatment of SMB-S15 cells with resveratrol efficiently removes the PrPSc accumulation in vitro and prion infectivity in vivo. Mol Neurobiol, 2016; 53, 5367−76. doi: 10.1007/s12035-015-9464-z [32] Prasad KN, Bondy SC. Oxidative and inflammatory events in prion diseases: can they be therapeutic targets? Curr Aging Sci, 2019; 11, 216-25. [33] Lv Y, Chen C, Zhang BY, et al. Remarkable activation of the complement system and aberrant neuronal localization of the membrane attack complex in the brain tissues of scrapie-infected rodents. Mol Neurobiol, 2015; 52, 1165−79. doi: 10.1007/s12035-014-8915-2 [34] Chen C, Lv Y, Hu C, et al. Alternative complement pathway is activated in the brains of scrapie-infected rodents. Med Microbiol Immunol, 2020; 209, 81−94. doi: 10.1007/s00430-019-00641-6 [35] Ma Y, Shi Q, Wang J, et al. Reduction of NF-κB (p65) in scrapie-infected cultured cells and in the brains of scrapie-infected rodents. ACS Chem Neurosci, 2017; 8, 2535−48. doi: 10.1021/acschemneuro.7b00273 [36] Ma Y, Shi Q, Xiao K, et al. Stimulations of the culture medium of activated microglia and TNF-alpha on a scrapie-infected cell line decrease the cell viability and induce marked necroptosis that also occurs in the brains from the patients of human prion diseases. ACS Chem Neurosci, 2019; 10, 1273−83. doi: 10.1021/acschemneuro.8b00354 [37] Salvesen Ø, Tatzelt J, Tranulis MA. The prion protein in neuroimmune crosstalk. Neurochem Int, 2019; 130, 104335. doi: 10.1016/j.neuint.2018.11.010 [38] Shen Q, Zhang R, Bhat NR. MAP kinase regulation of IP10/CXCL10 chemokine gene expression in microglial cells. Brain Res, 2006; 1086, 9−16. doi: 10.1016/j.brainres.2006.02.116 [39] Sui Y, Potula R, Dhillon N, et al. Neuronal apoptosis is mediated by CXCL10 overexpression in simian human immunodeficiency virus encephalitis. Am J Pathol, 2004; 164, 1557−66. doi: 10.1016/S0002-9440(10)63714-5 [40] Lang S, Li LB, Wang XN, et al. CXCL10/IP-10 neutralization can ameliorate lipopolysaccharide-induced acute respiratory distress syndrome in rats. PLoS One, 2017; 12, e0169100. doi: 10.1371/journal.pone.0169100 [41] Rocha NP, Scalzo PL, Barbosa IG, et al. Cognitive status correlates with CXCL10/IP-10 levels in Parkinson’s disease. Parkinson’s Dis, 2014; 2014, 903796. [42] Duan RS, Yang X, Chen ZG, et al. Decreased fractalkine and increased IP-10 expression in aged brain of APPswe transgenic mice. Neurochem Res, 2008; 33, 1085−9. doi: 10.1007/s11064-007-9554-z [43] Bettcher BM, Johnson SC, Fitch R, et al. Cerebrospinal fluid and plasma levels of inflammation differentially relate to CNS markers of Alzheimer’s disease pathology and neuronal damage. J Alzheimer’s Dis, 2018; 62, 385−97. doi: 10.3233/JAD-170602 [44] Mohd Hasni DS, Lim SM, Chin AV, et al. Peripheral cytokines, C-X-C motif ligand10 and interleukin-13, are associated with Malaysian Alzheimer's disease. Geriatr Gerontol Int, 2017; 17, 839−46. doi: 10.1111/ggi.12783 [45] Hirsch EC, Vyas S, Hunot S. Neuroinflammation in Parkinson's disease. Parkinsonism Relat Disord, 2012; 18, S210−2. [46] Simpson JE, Newcombe J, Cuzner ML, et al. Expression of the interferon-γ-inducible chemokines IP-10 and Mig and their receptor, CXCR3, in multiple sclerosis lesions. Neuropathol Appl Neurobiol, 2000; 26, 133−42. doi: 10.1046/j.1365-2990.2000.026002133.x [47] Krauthausen M, Saxe S, Zimmermann J, et al. CXCR3 modulates glial accumulation and activation in cuprizone-induced demyelination of the central nervous system. J Neuroinflammation, 2014; 11, 109. doi: 10.1186/1742-2094-11-109 [48] Zhou YQ, Liu DQ, Chen SP, et al. The role of CXCR3 in neurological diseases. Curr Neuropharmacol, 2019; 17, 142−50. doi: 10.2174/1570159X15666171109161140 [49] Xia MQ, Bacskai BJ, Knowles RB, et al. Expression of the chemokine receptor CXCR3 on neurons and the elevated expression of its ligand IP-10 in reactive astrocytes: in vitro ERK1/2 activation and role in Alzheimer’s disease. J Neuroimmunology, 2000; 108, 227−35. doi: 10.1016/S0165-5728(00)00285-X [50] Balashov KE, Rottman JB, Weiner HL, et al. CCR5+ and CXCR3+ T cells are increased in multiple sclerosis and their ligands MIP-1αand IP-10 are expressed in demyelinating brain lesions. Proc Natl Acad Sci USA, 1999; 96, 6873−8. doi: 10.1073/pnas.96.12.6873 [51] van Wanrooij EJ, de Jager SC, van Es T, et al. CXCR3 antagonist NBI-74330 attenuates atherosclerotic plaque formation in LDL receptor-deficient mice. Arterioscler Thromb Vasc Biol, 2008; 28, 251−7. doi: 10.1161/ATVBAHA.107.147827 [52] Zernecke A, Shagdarsuren E, Weber C. Chemokines in atherosclerosis: an update. Arterioscler Thromb Vasc Biol, 2008; 28, 1897−908. doi: 10.1161/ATVBAHA.107.161174 [53] Ferrari SM, Ruffilli I, Colaci M, et al. CXCL10 in psoriasis. Adv Med Sci, 2015; 60, 349−54. doi: 10.1016/j.advms.2015.07.011 [54] Krauthausen M, Kummer MP, Zimmermann J, et al. CXCR3 promotes plaque formation and behavioral deficits in an Alzheimer'’s disease model. J Clin Invest, 2015; 125, 365−78. doi: 10.1172/JCI66771 [55] Riemer C, Schultz J, Burwinkel M, et al. Accelerated prion replication in, but prolonged survival times of, prion-infected CXCR3-/- mice. J Virol, 2008; 82, 12464−71. doi: 10.1128/JVI.01371-08 [56] Guedes JR, Lao TT, Cardoso AL, et al. Roles of microglial and monocyte chemokines and their receptors in regulating Alzheimer’s disease-associated amyloid-β and tau pathologies. Front Neurol, 2018; 9, 549. doi: 10.3389/fneur.2018.00549 [57] Sui Y, Stehno-Bittel L, Li SP, et al. CXCL10-induced cell death in neurons: role of calcium dysregulation. Eur J Neurosci, 2006; 23, 957−64. doi: 10.1111/j.1460-9568.2006.04631.x [58] Peggion C, Bertoli A, Sorgato MC. Possible role for Ca2+ in the pathophysiology of the prion protein? BioFactors, 2011; 37, 241-9. [59] De Mario A, Peggion C, Massimino ML, et al. The link of the prion protein with Ca2+ metabolism and ROS production, and the possible implication in aβ toxicity. Int J Mol Sci, 2019; 20, 4640. doi: 10.3390/ijms20184640 -
 24113+Supplementary Materials.pdf

-

 点击查看大图

计量
- 文章访问数: 395
- HTML全文浏览量: 174
- PDF下载量: 48
- 被引次数: 0

 Quick Links