

 下载:
下载:

-
Copper is one of the essential trace elements for living beings, influencing several critical processes like cellular energy production, antioxidant defense, communication within cells, and the functioning of enzymes[1]. The daily intake of copper is 0.7−3.0 mg/d, and copper homeostasis is strictly regulated by physiological processes, including duodenal and small intestinal uptake, blood transport, liver storage and release, and bile excretion, thereby maintaining copper homeostasis in the body[2], and many studies have confirmed that copper disorders in the body are associated with neurodegenerative, metabolic, and genetic diseases[3]. Currently, copper is widely used in mining, construction, medical equipment, power generation and other industries, resulting in increasing environmental copper exposure levels. The World Health Organization has set the safety standard for copper concentration in drinking water at 2 mg/L, and more and more industries will discharge a large amount of copper-containing wastewater in a short period of time, causing the copper concentration in the water to reach more than 100 mg/L, or even more than 1,000 mg/L[4]. Therefore, effective prevention and mitigation of copper toxicity are urgently needed. Untargeted metabolomics by gas chromatography-mass spectrometry (GC-MS), through the comprehensive analysis of metabolites or small-molecule substrates within organisms, provides a powerful tool for understanding disease mechanisms and conducting systems biology analyses[5]. In this study, we used this technology to analyze the changes in metabolites in the serum and tissues of mice exposed to high-dose copper, aiming to systematically analyze and explore the toxic mechanisms of copper.
Eight-week-old mice were randomly divided into two groups (n = 7). After adaptivefeeding, weselected CuSO4·5H2O as the Cu source and exposed them to Cu for 4 weeks. The Cu-exposed group drank water containing 500 mg/L of sulfate, while the control group drank the same amount of tap water. This model can simulate high-dose Cu pollution in an actual environment. The dosage and period of exposure were selected based on previous research and relevant scholarly articles[6]. All mice survived until the end of the experiment, and there was no statistically significant difference in body weight between the two groups (Figure 1A). As the central organ for maintaining Cu homeostasis, approximately 20% of Cu is distributed in the liver, and blood is the transportation center of various substances in the human body; approximately 5%–10% of Cu is distributed in the blood. Therefore, selecting serum and liver samples to monitor changes in Cu levels can reflect the overall Cu exposure of the body and important changes in physiological status (Figure 1B–C). Cu ions accumulated significantly in the blood and liver of mice in the Cu-exposure group compared with the control group. H&E staining revealed obvious pathological changes in the livers of mice after exposure to high-dose Cu, with congestion of the central and portal veins in the hepatic lobules (red arrows), hydropic degeneration of a large number of hepatocytes (blue arrows), swollen cells, and loose and lightly stained cytoplasm (Figure 1D), which provided sufficient verification for subsequent research.
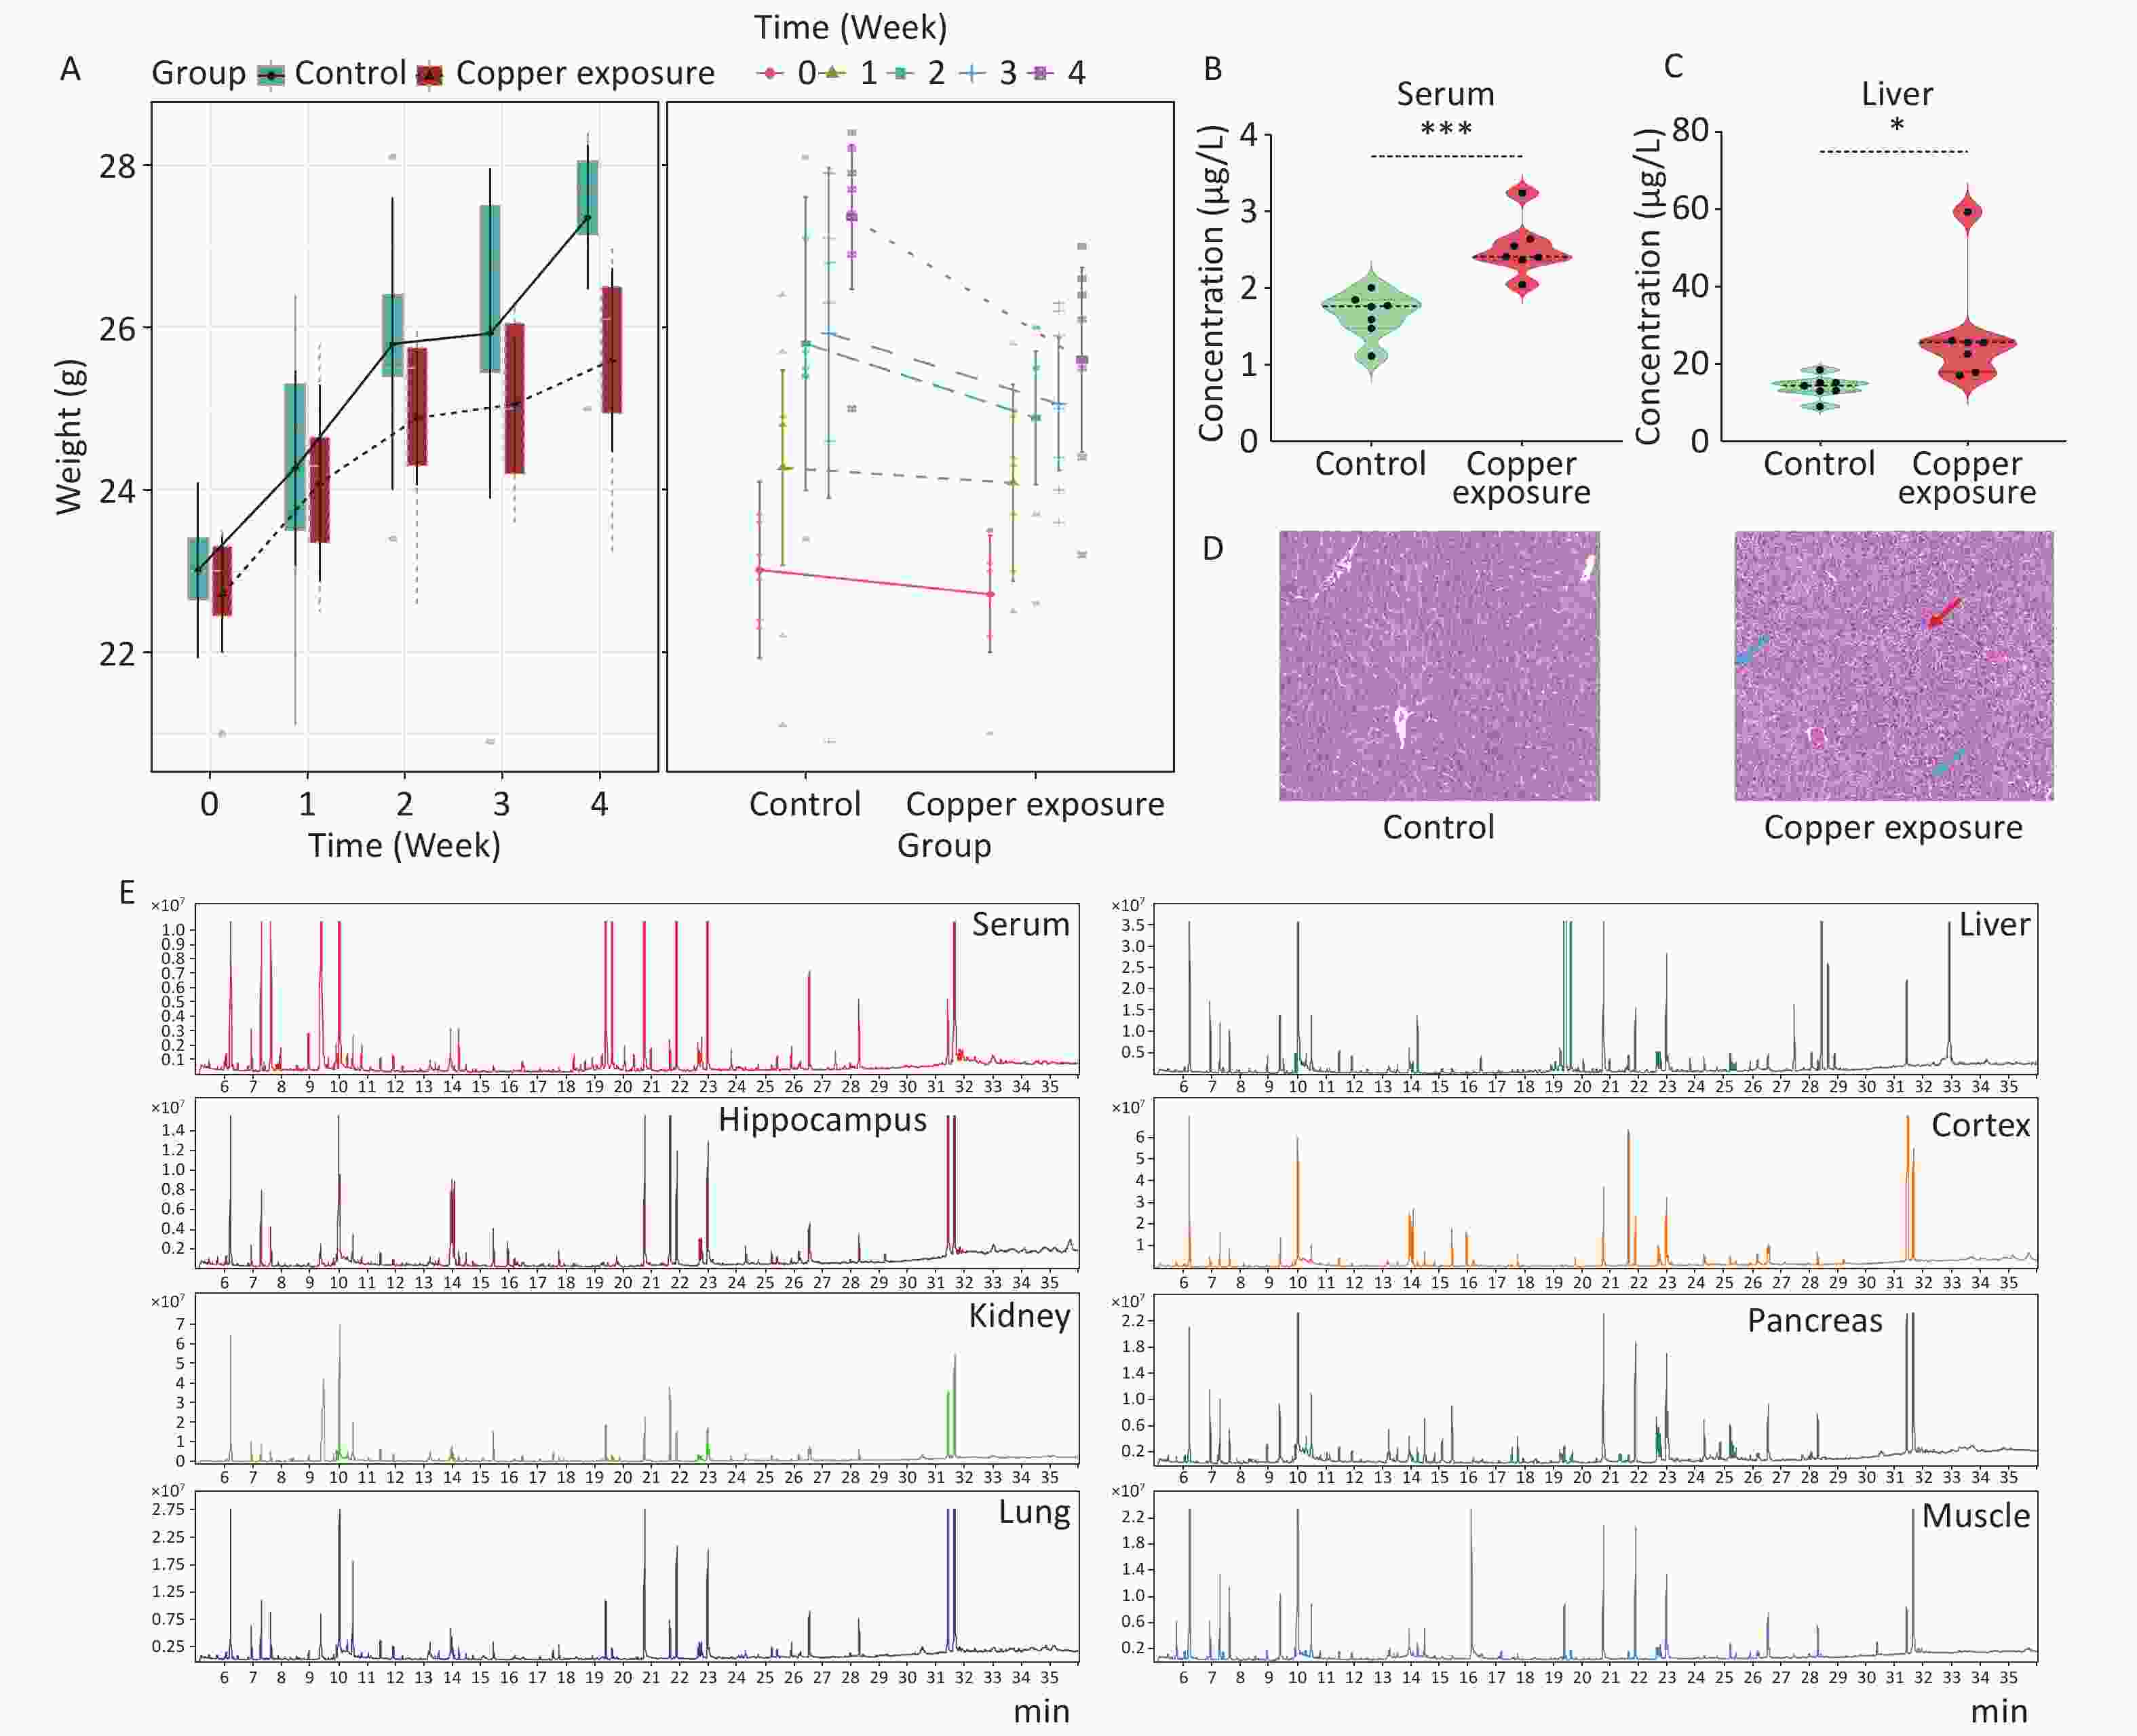
Figure 1. After copper exposure (A) weight, (B–C) Cu ion concentrations in serum and liver, (D) pathological examination, and (E) TIC images of QCs. Data are presented as mean ± standard deviation. *P < 0.05, **P < 0.01, and ***P < 0.001 indicate differences between different groups, respectively.
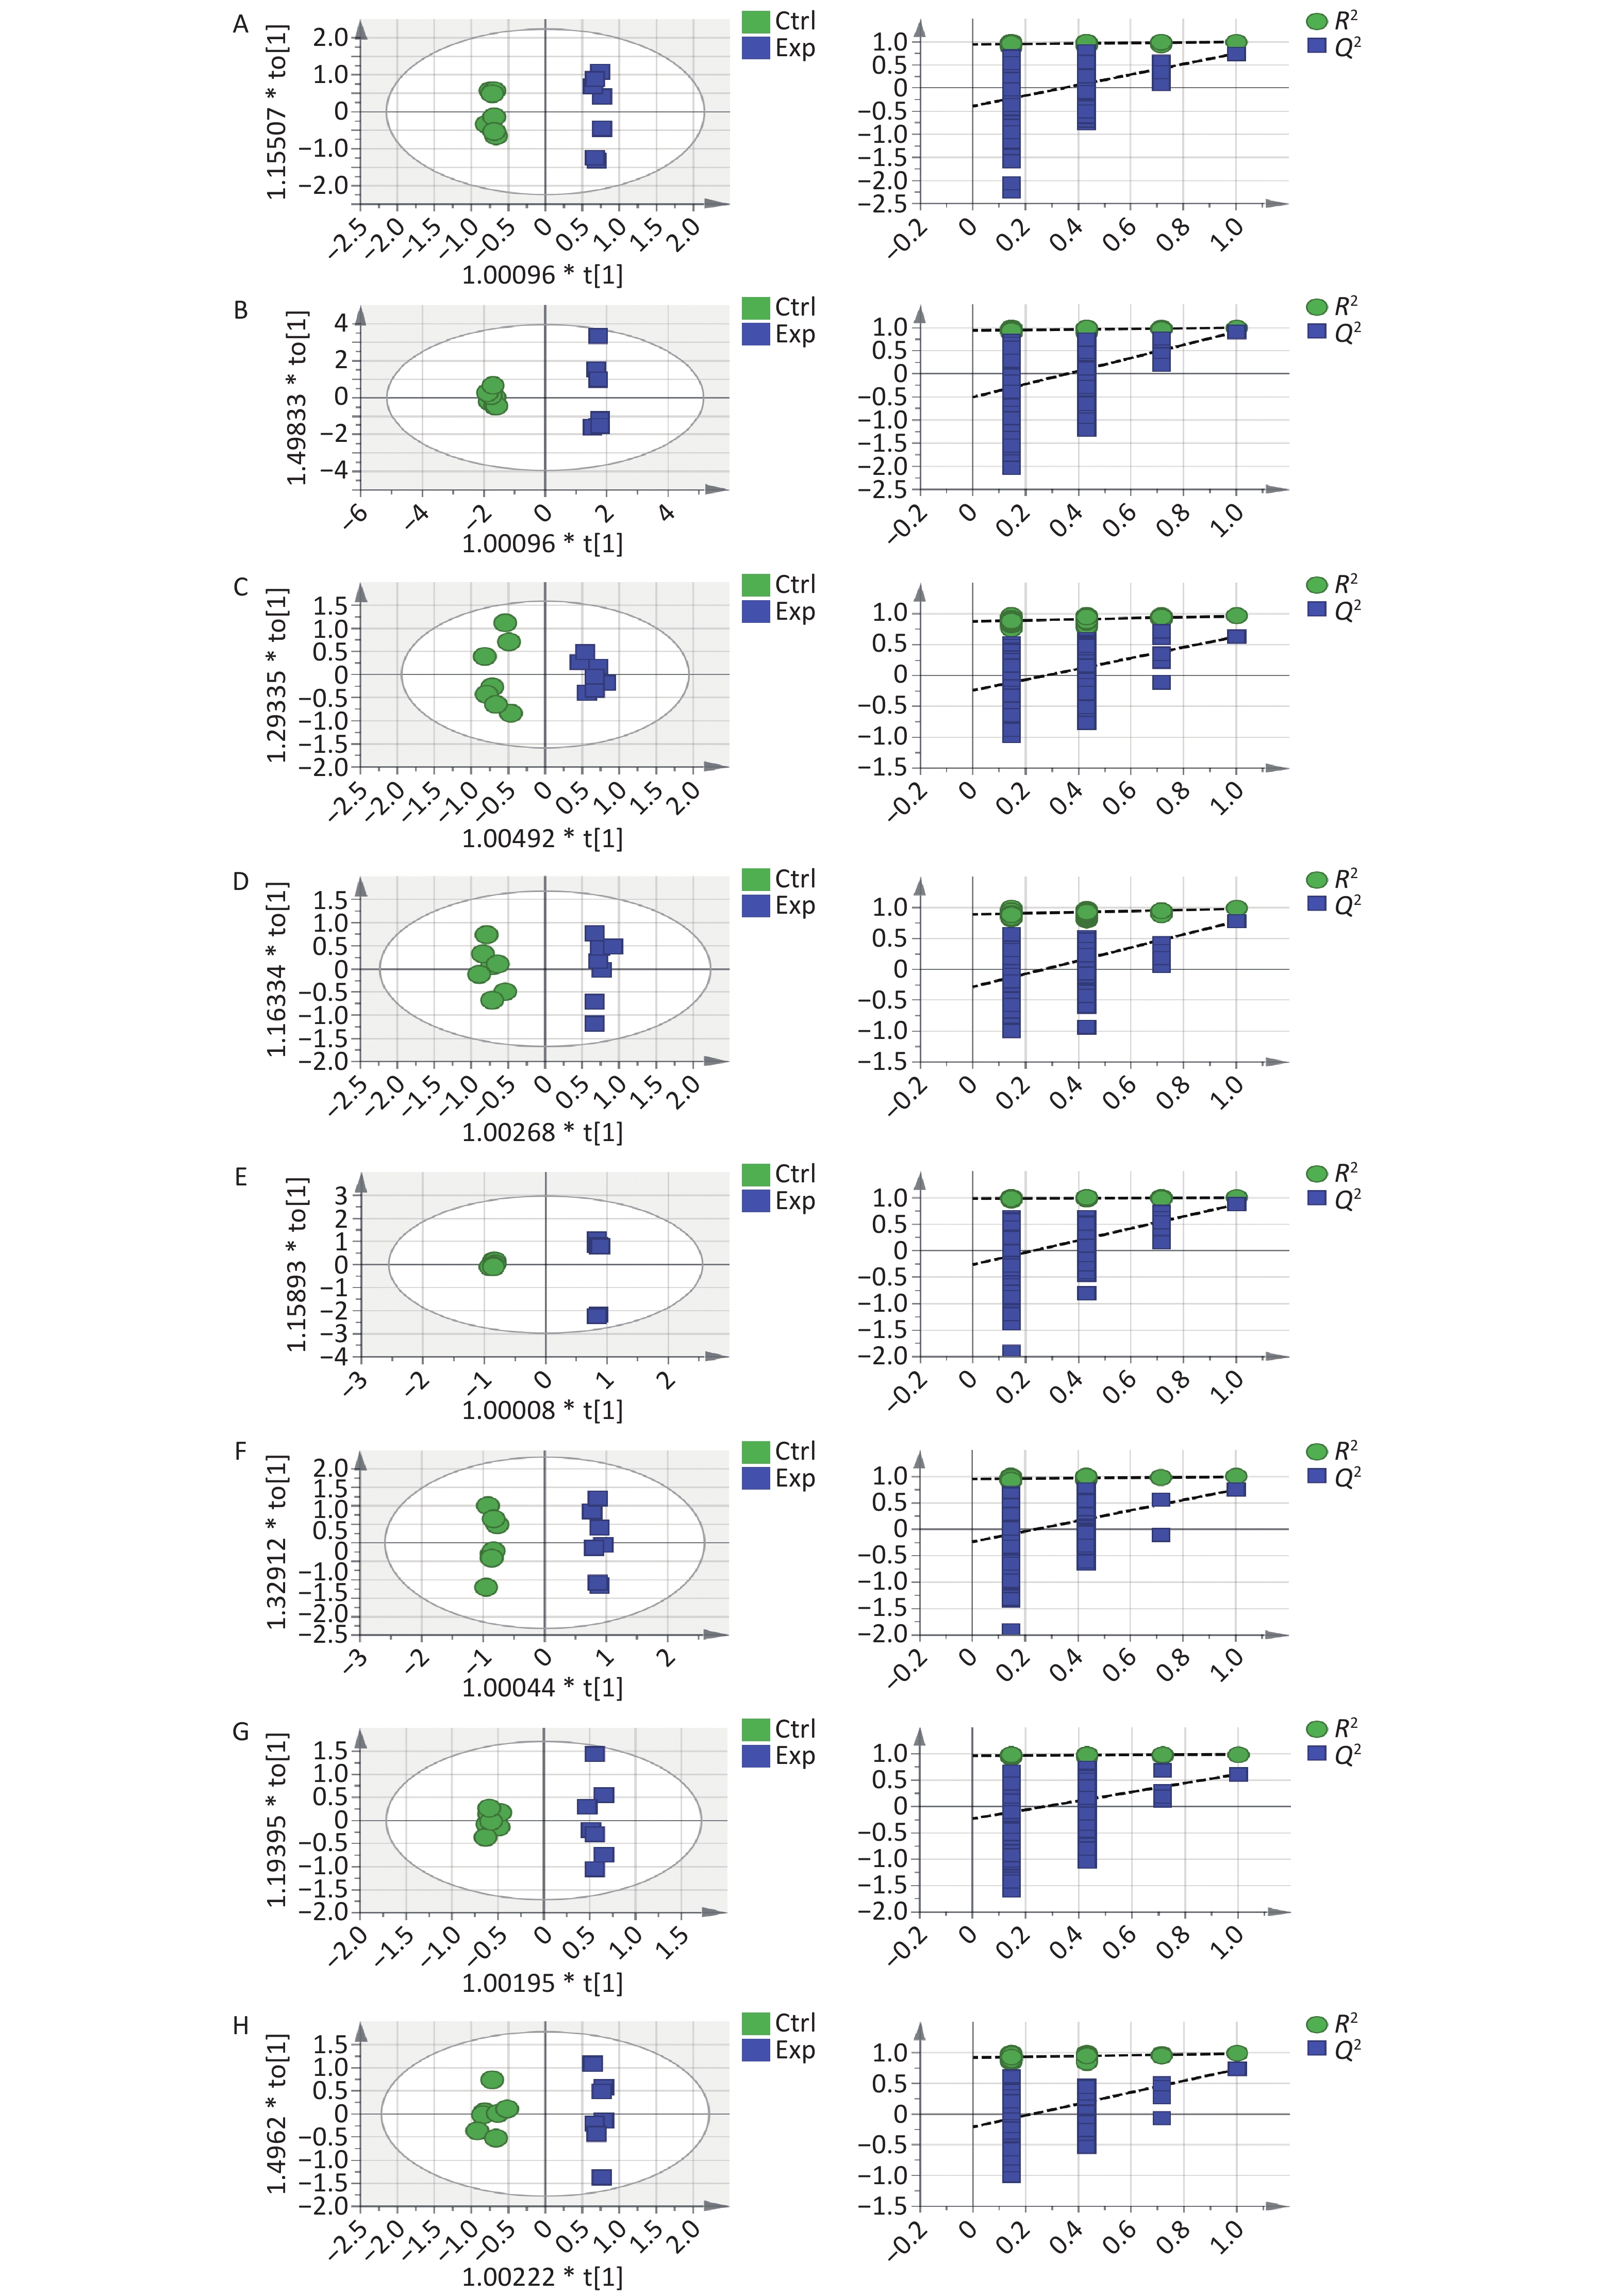
Second, to further systematically analyze and explore the toxicity mechanism of Cu, we used GC-MS to quantitatively analyze the metabolite content of serum and different tissue samples. The chromatograms of each sample extracted from the GC-MS data showed excellent signal response and reproducibility (Figure 1E). OPLS-DA analysis using SIMCA-P (version 14.1) software observed that the two groups of samples were independently separated and clustered within the group, indicating that the metabolite differences between the groups were significant and the differences within the group were small. Supplementary Table S1 (available in www.besjournal.com) introduces the coefficient of determination (R²) and predictive ability (Q²) of serum and various tissues and organs. When the R² value was closer to 1, the model fit the data better. Q² values greater than 0.5 are generally considered to have good predictive ability. The higher the value, the better is the prediction effect of the model. Through 200 permutation tests, it was observed that the intercept of the Q2 regression line on the y-axis was less than zero, and all Q2 values on the left were lower than the original points on the right, which reflected the reliability of the model and further supported the conclusion of differences between the groups (Supplementary Figure S1, available in www.besjournal.com).
Table S1. The OPLS-DA parameters in the target main tissues
Tissue R² (cum) Q² (cum) Liver 0.998 0.911 Serum 0.996 0.746 Kidney 0.999 0.875 Cortex 0.982 0.777 Hippocampus 0.964 0.631 Muscle 0.983 0.73 Lung 0.989 0.614 Pancreas 0.996 0.753 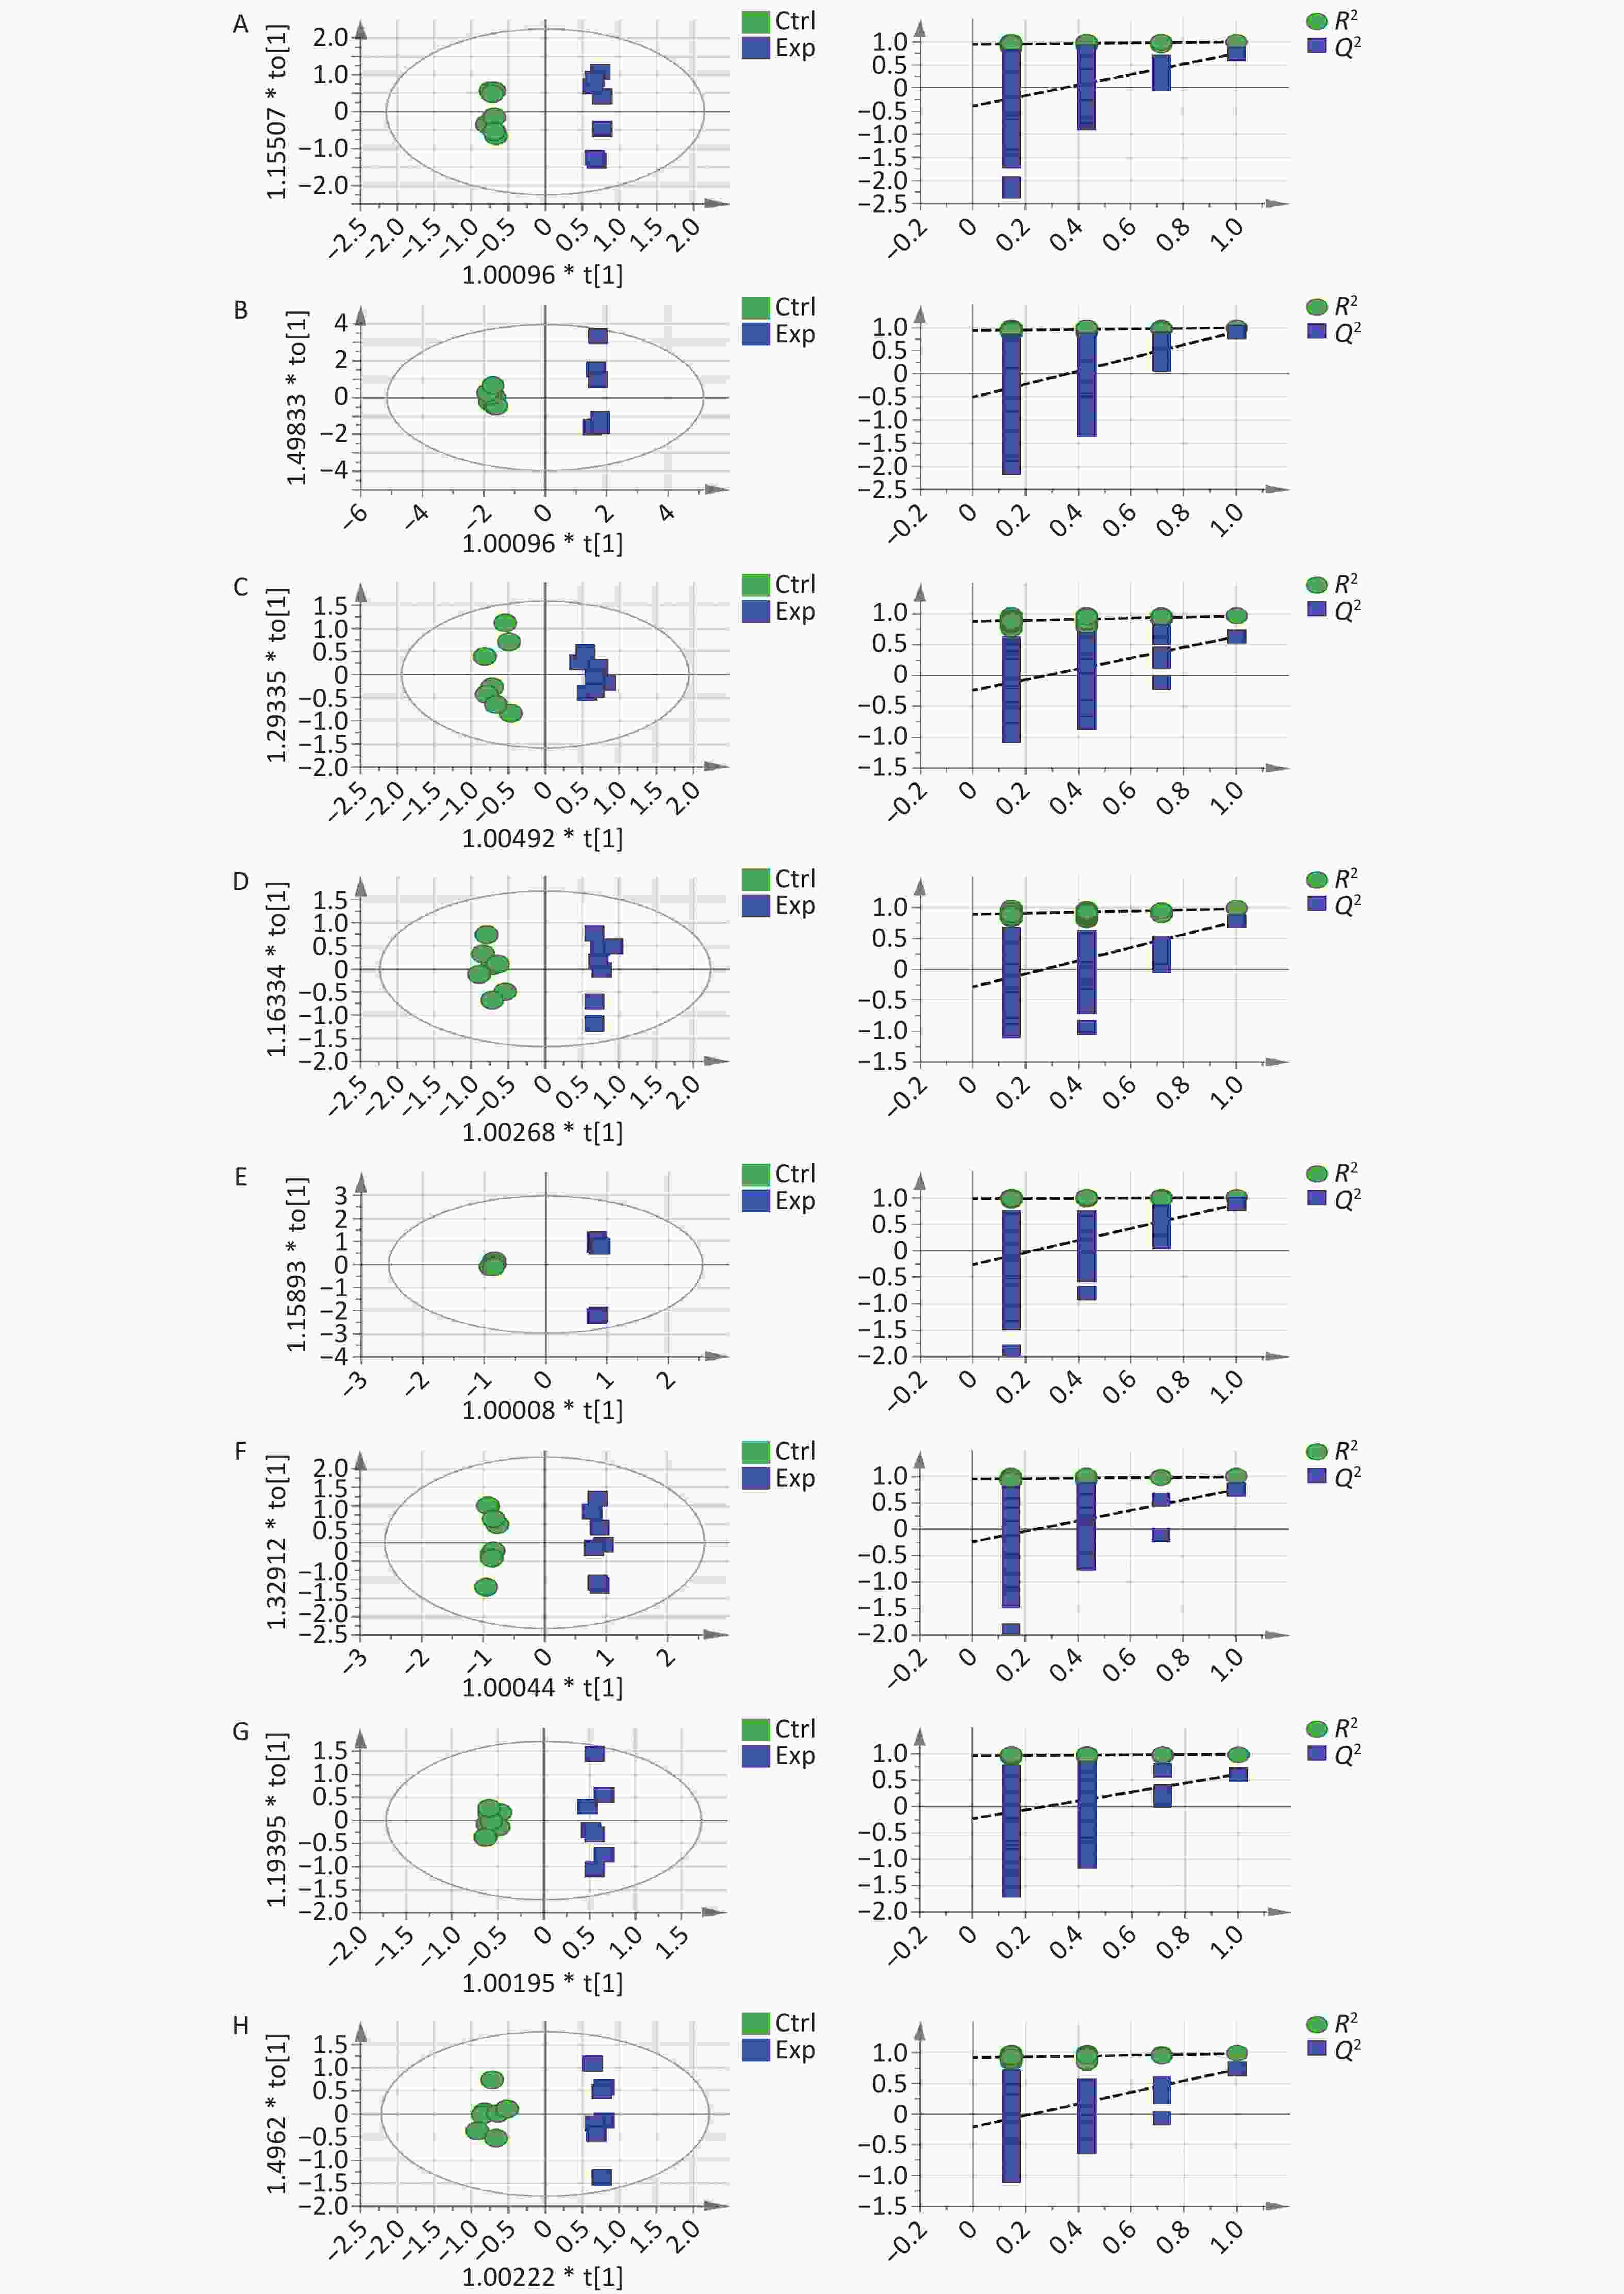
Figure S1. OPLS-DA score plots and 200 permutation tests tables: (A) serum, (B) liver, (C) hippocampus, (D) cortex, (E) kidney, (F) pancreas, (G) lung, and (H) muscle.
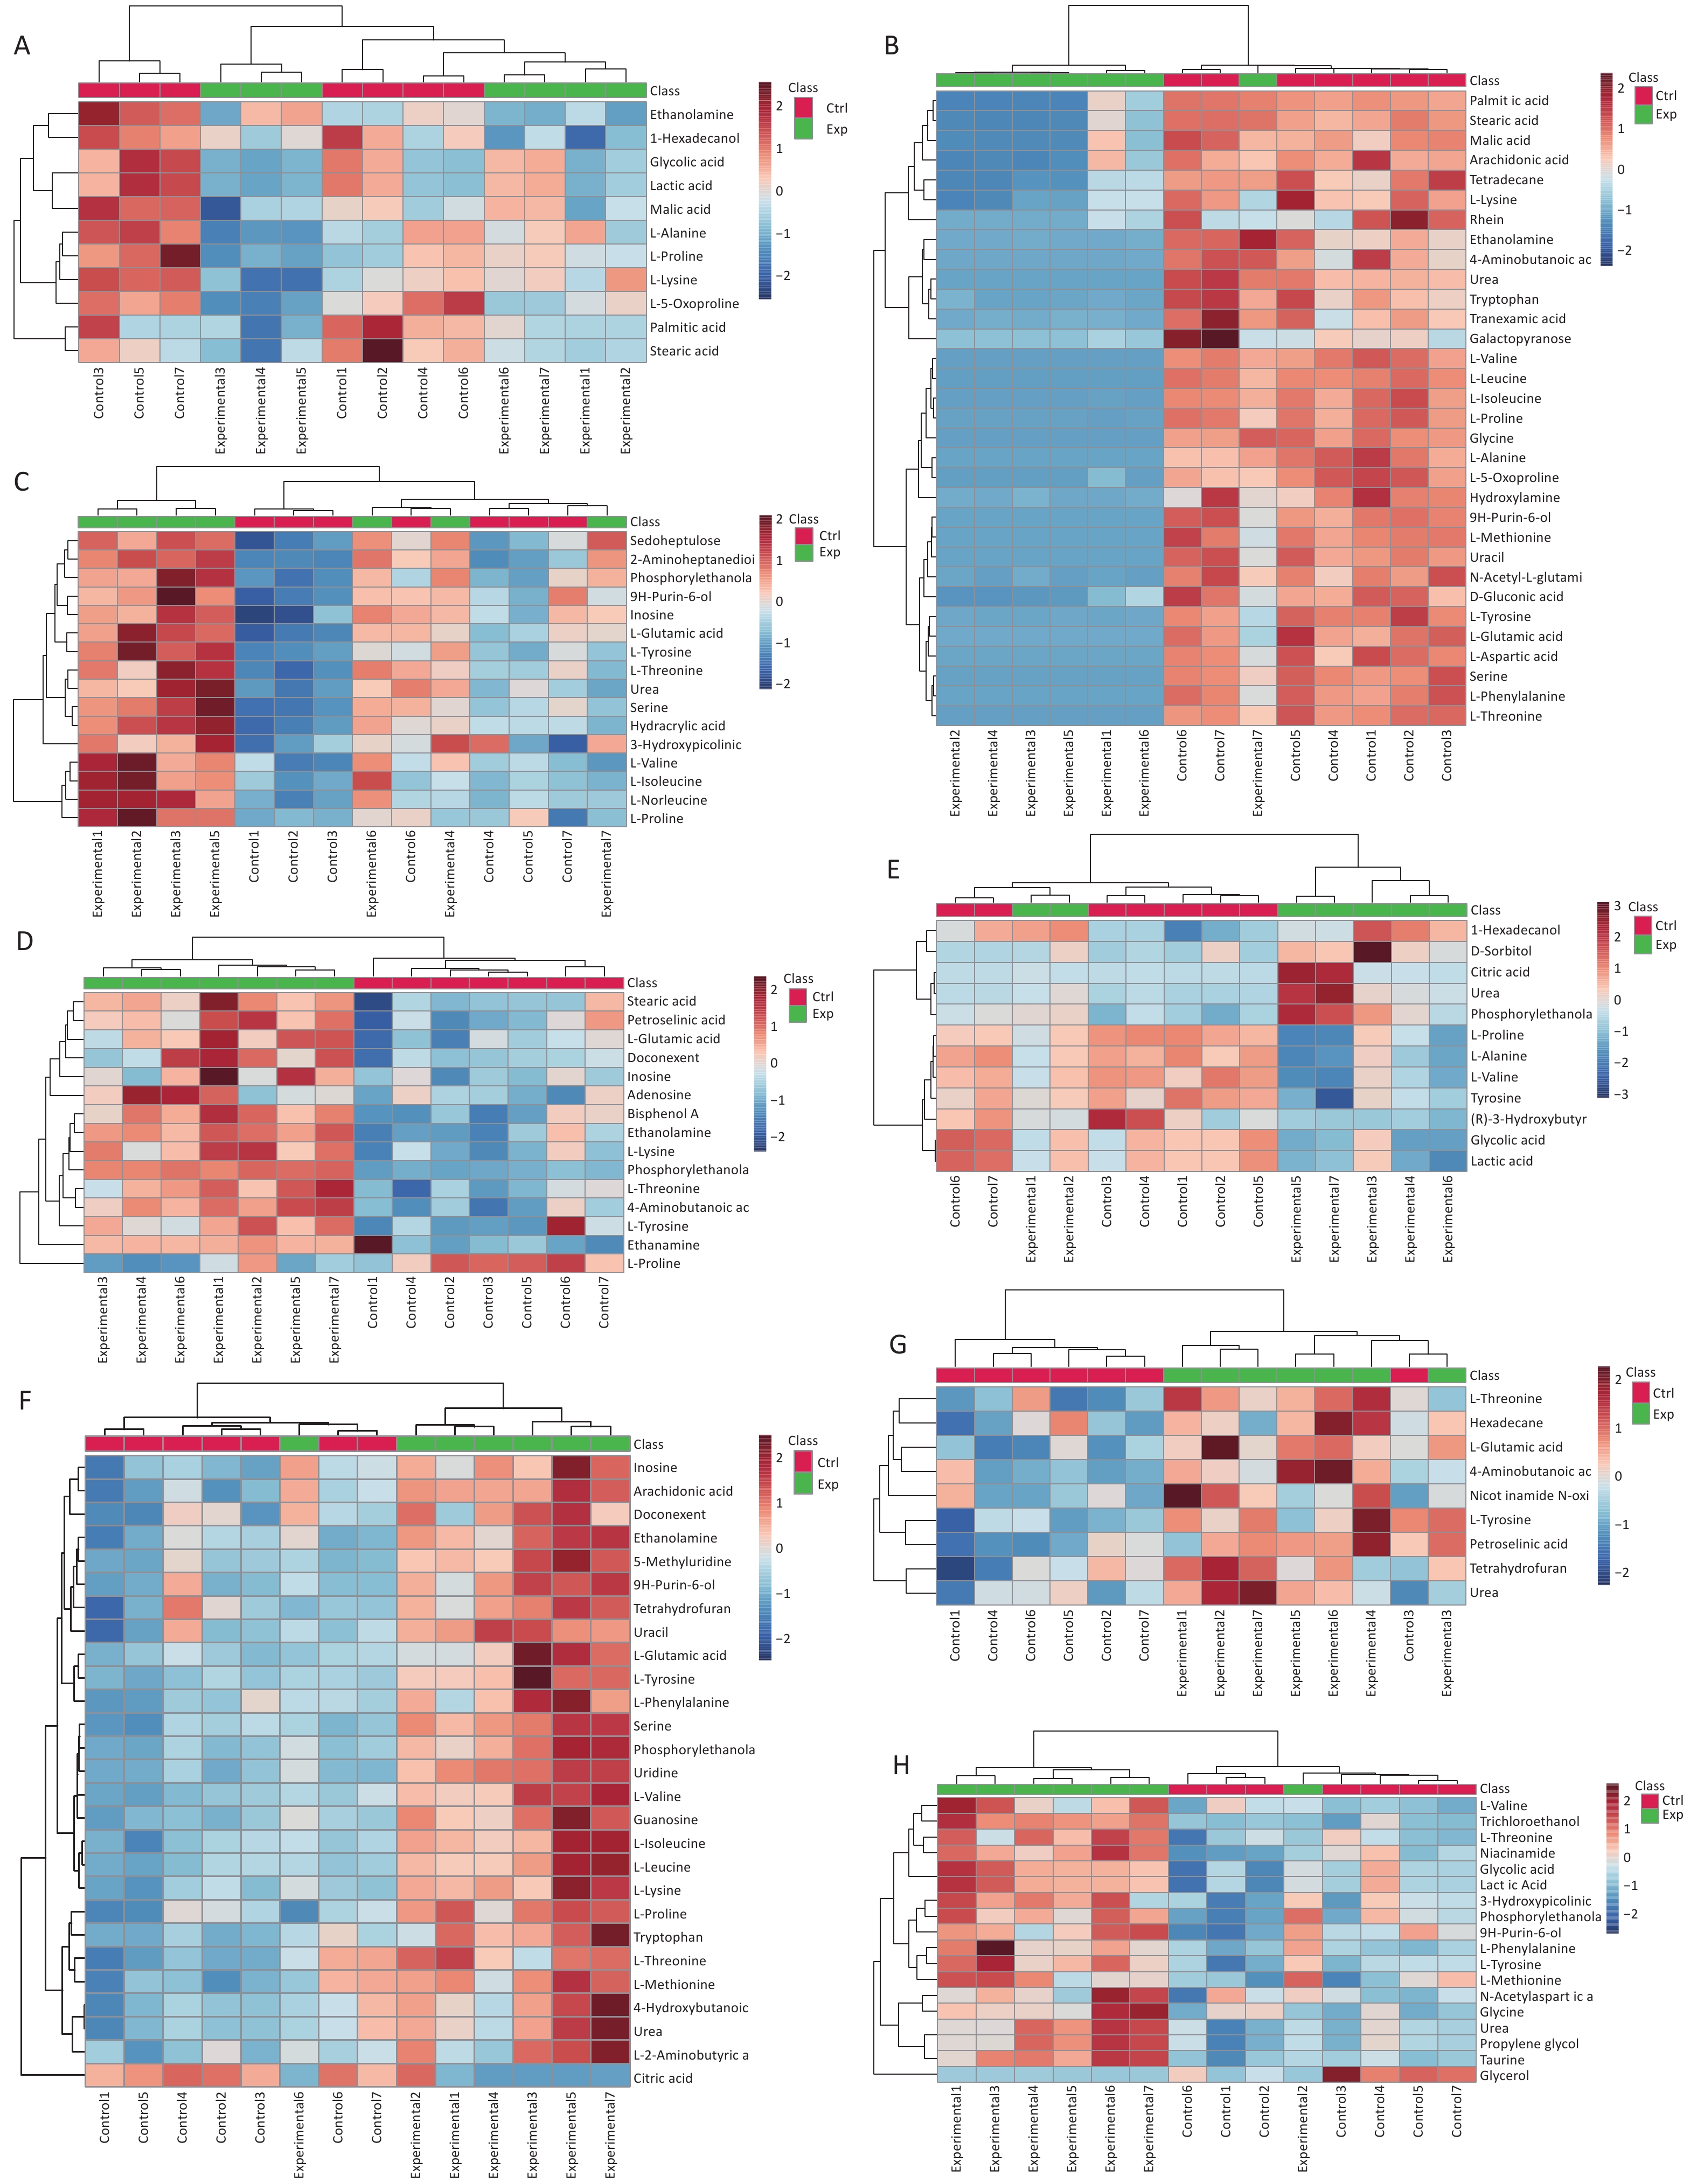
A t-test was performed using SPSS 27.0 to identify potential metabolites with significant differences in expression between the two groups. The primary differential metabolites screened according to VIP > 1, P < 0.05 criteria were imported into MetaboAnalyst 5.0, and it was finally determined that 65 metabolites were significantly different between the control group and the Cu exposure group (Supplementary Table S2, available in www.besjournal.com). Heat maps and cluster analyses were used to more intuitively display the differences in metabolite levels between the two groups (Figure 2).
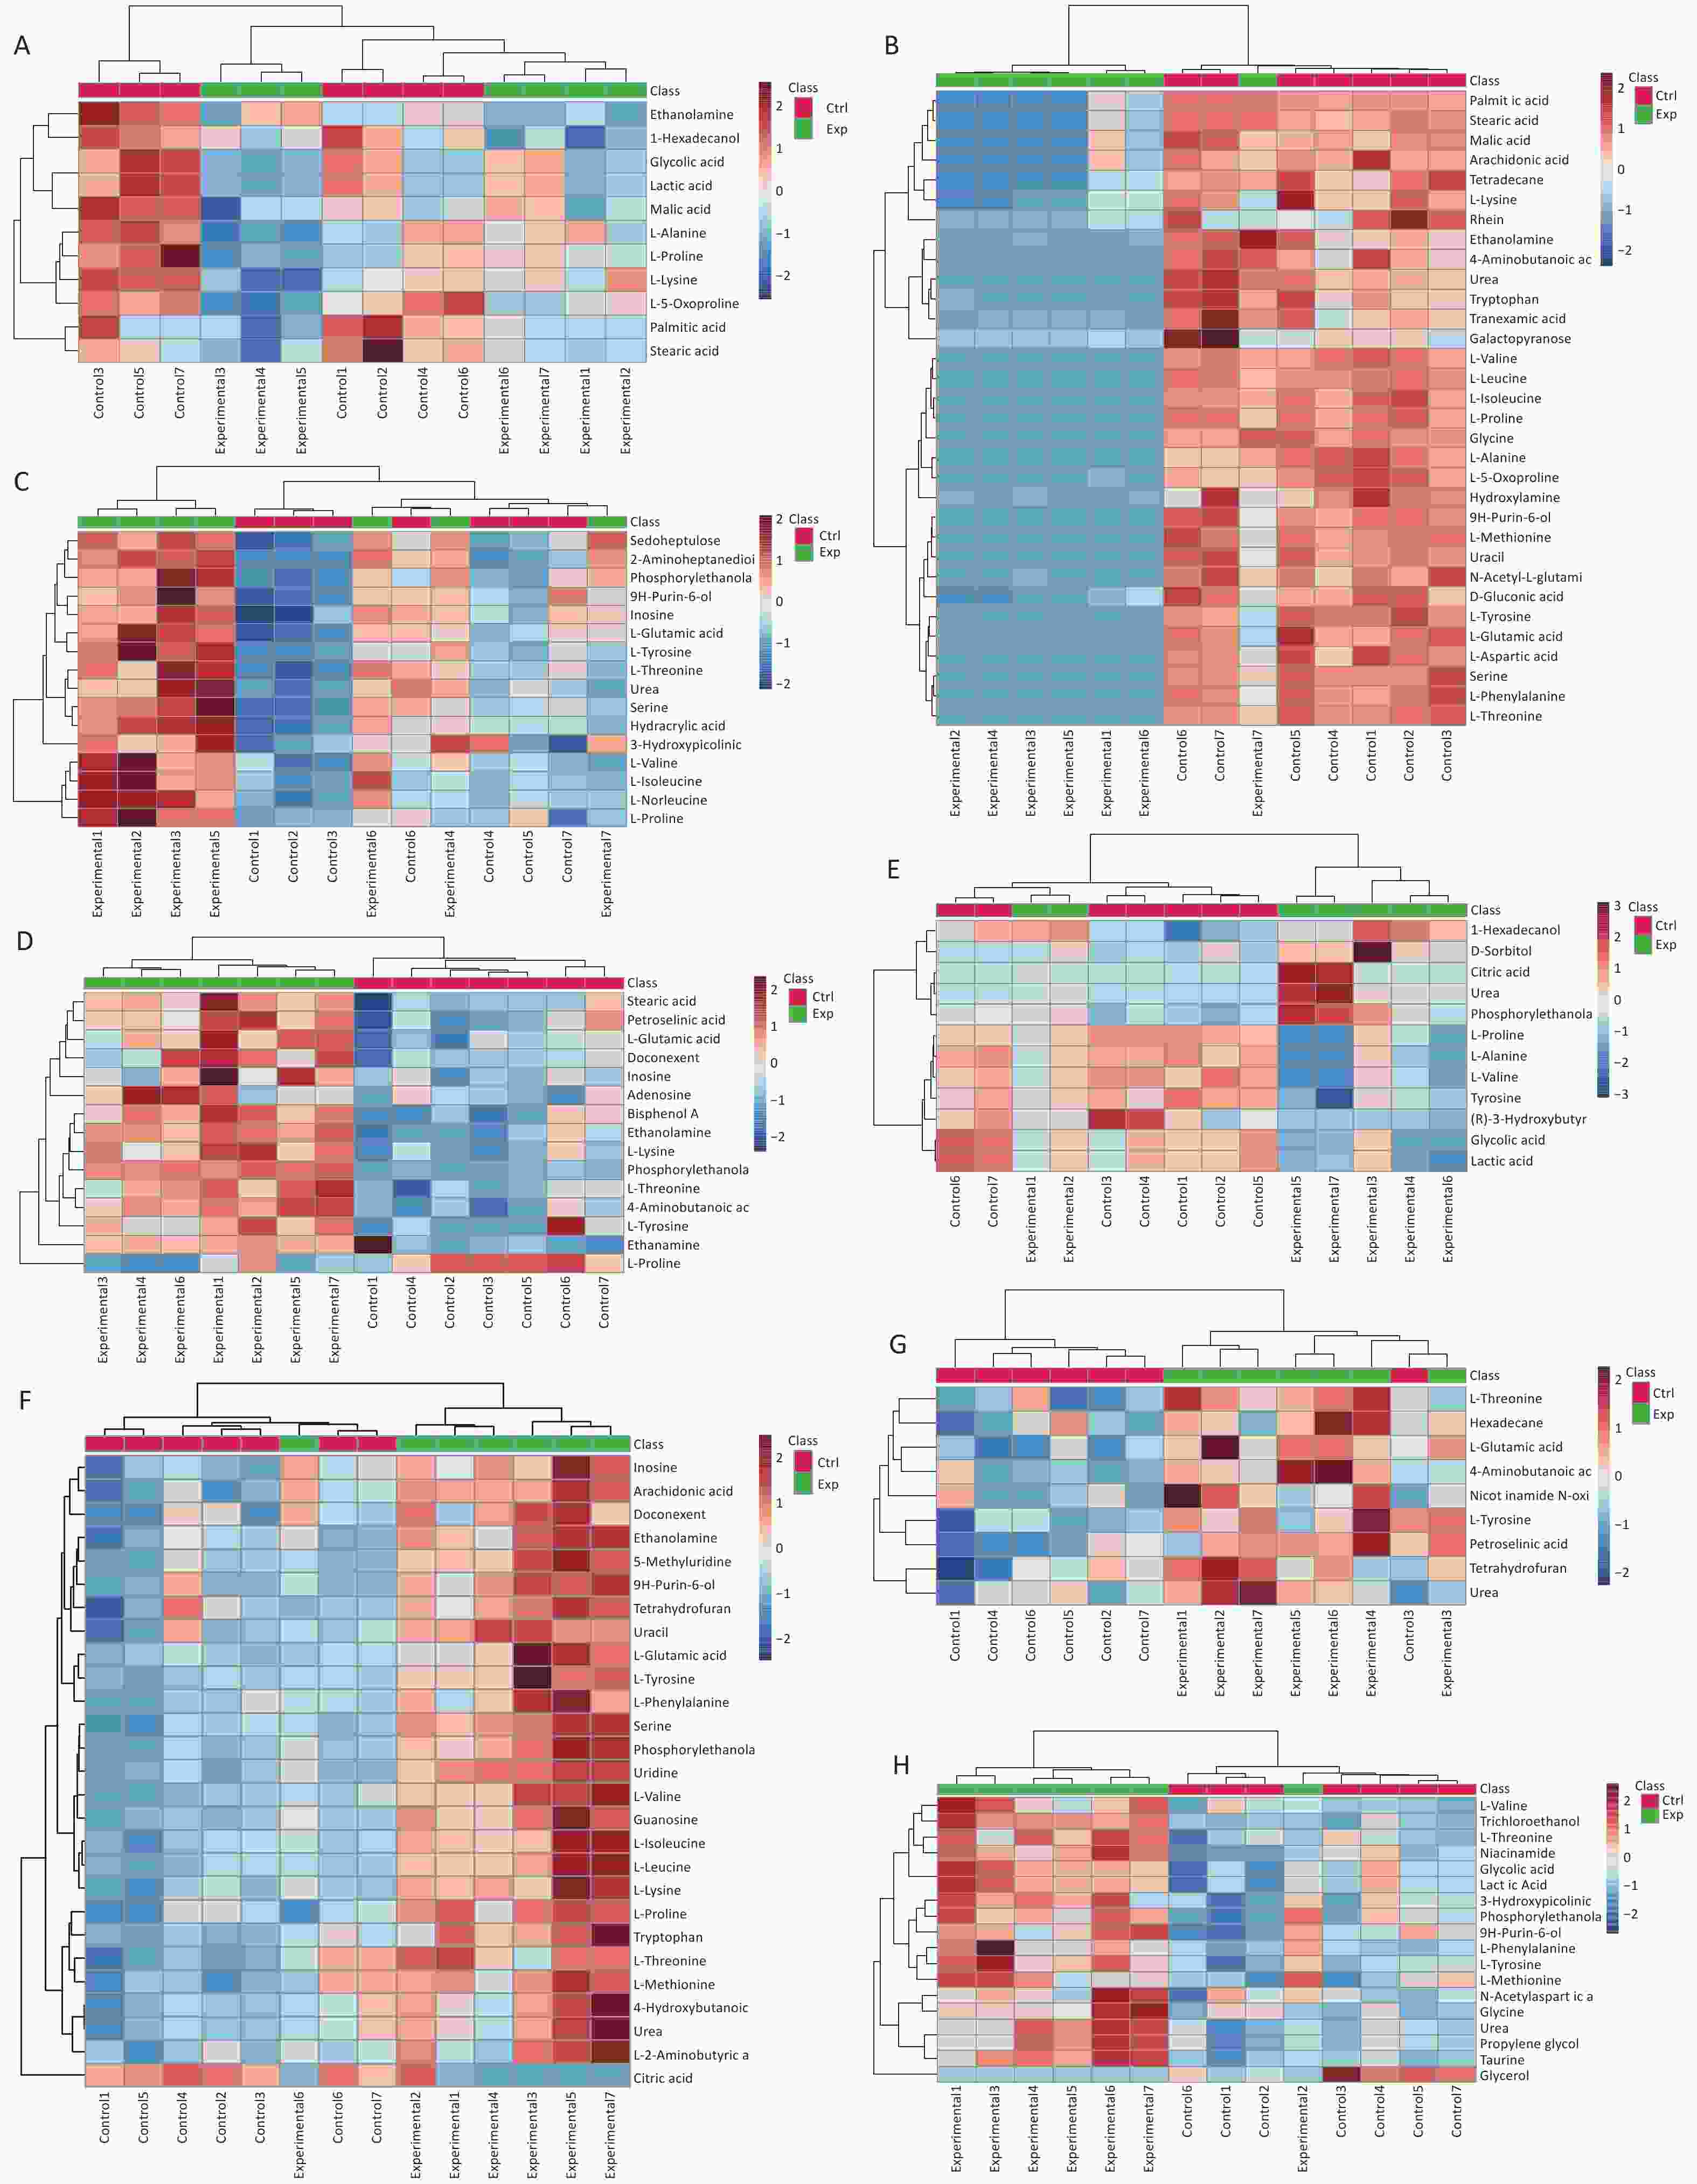
Figure 2. Differential metabolites identified in (A) serum, (B) liver, (C) hippocampus, (D) cortex, (E) kidney, (F) pancreas, (G) lung, and (H) muscle samples through cluster analysis and heatmap representation, comparing the Cu-exposed group with the control group. The heatmap colors indicate the metabolite regulation levels (blue for downregulation, red for upregulation). In this representation, the rows correspond to individual samples, whereas the columns represent specific metabolites.
Table S2. List of metabolites altered in the serum, liver, hippocampus, cortex, kidney, pancreas, lung, and muscle after copper exposure
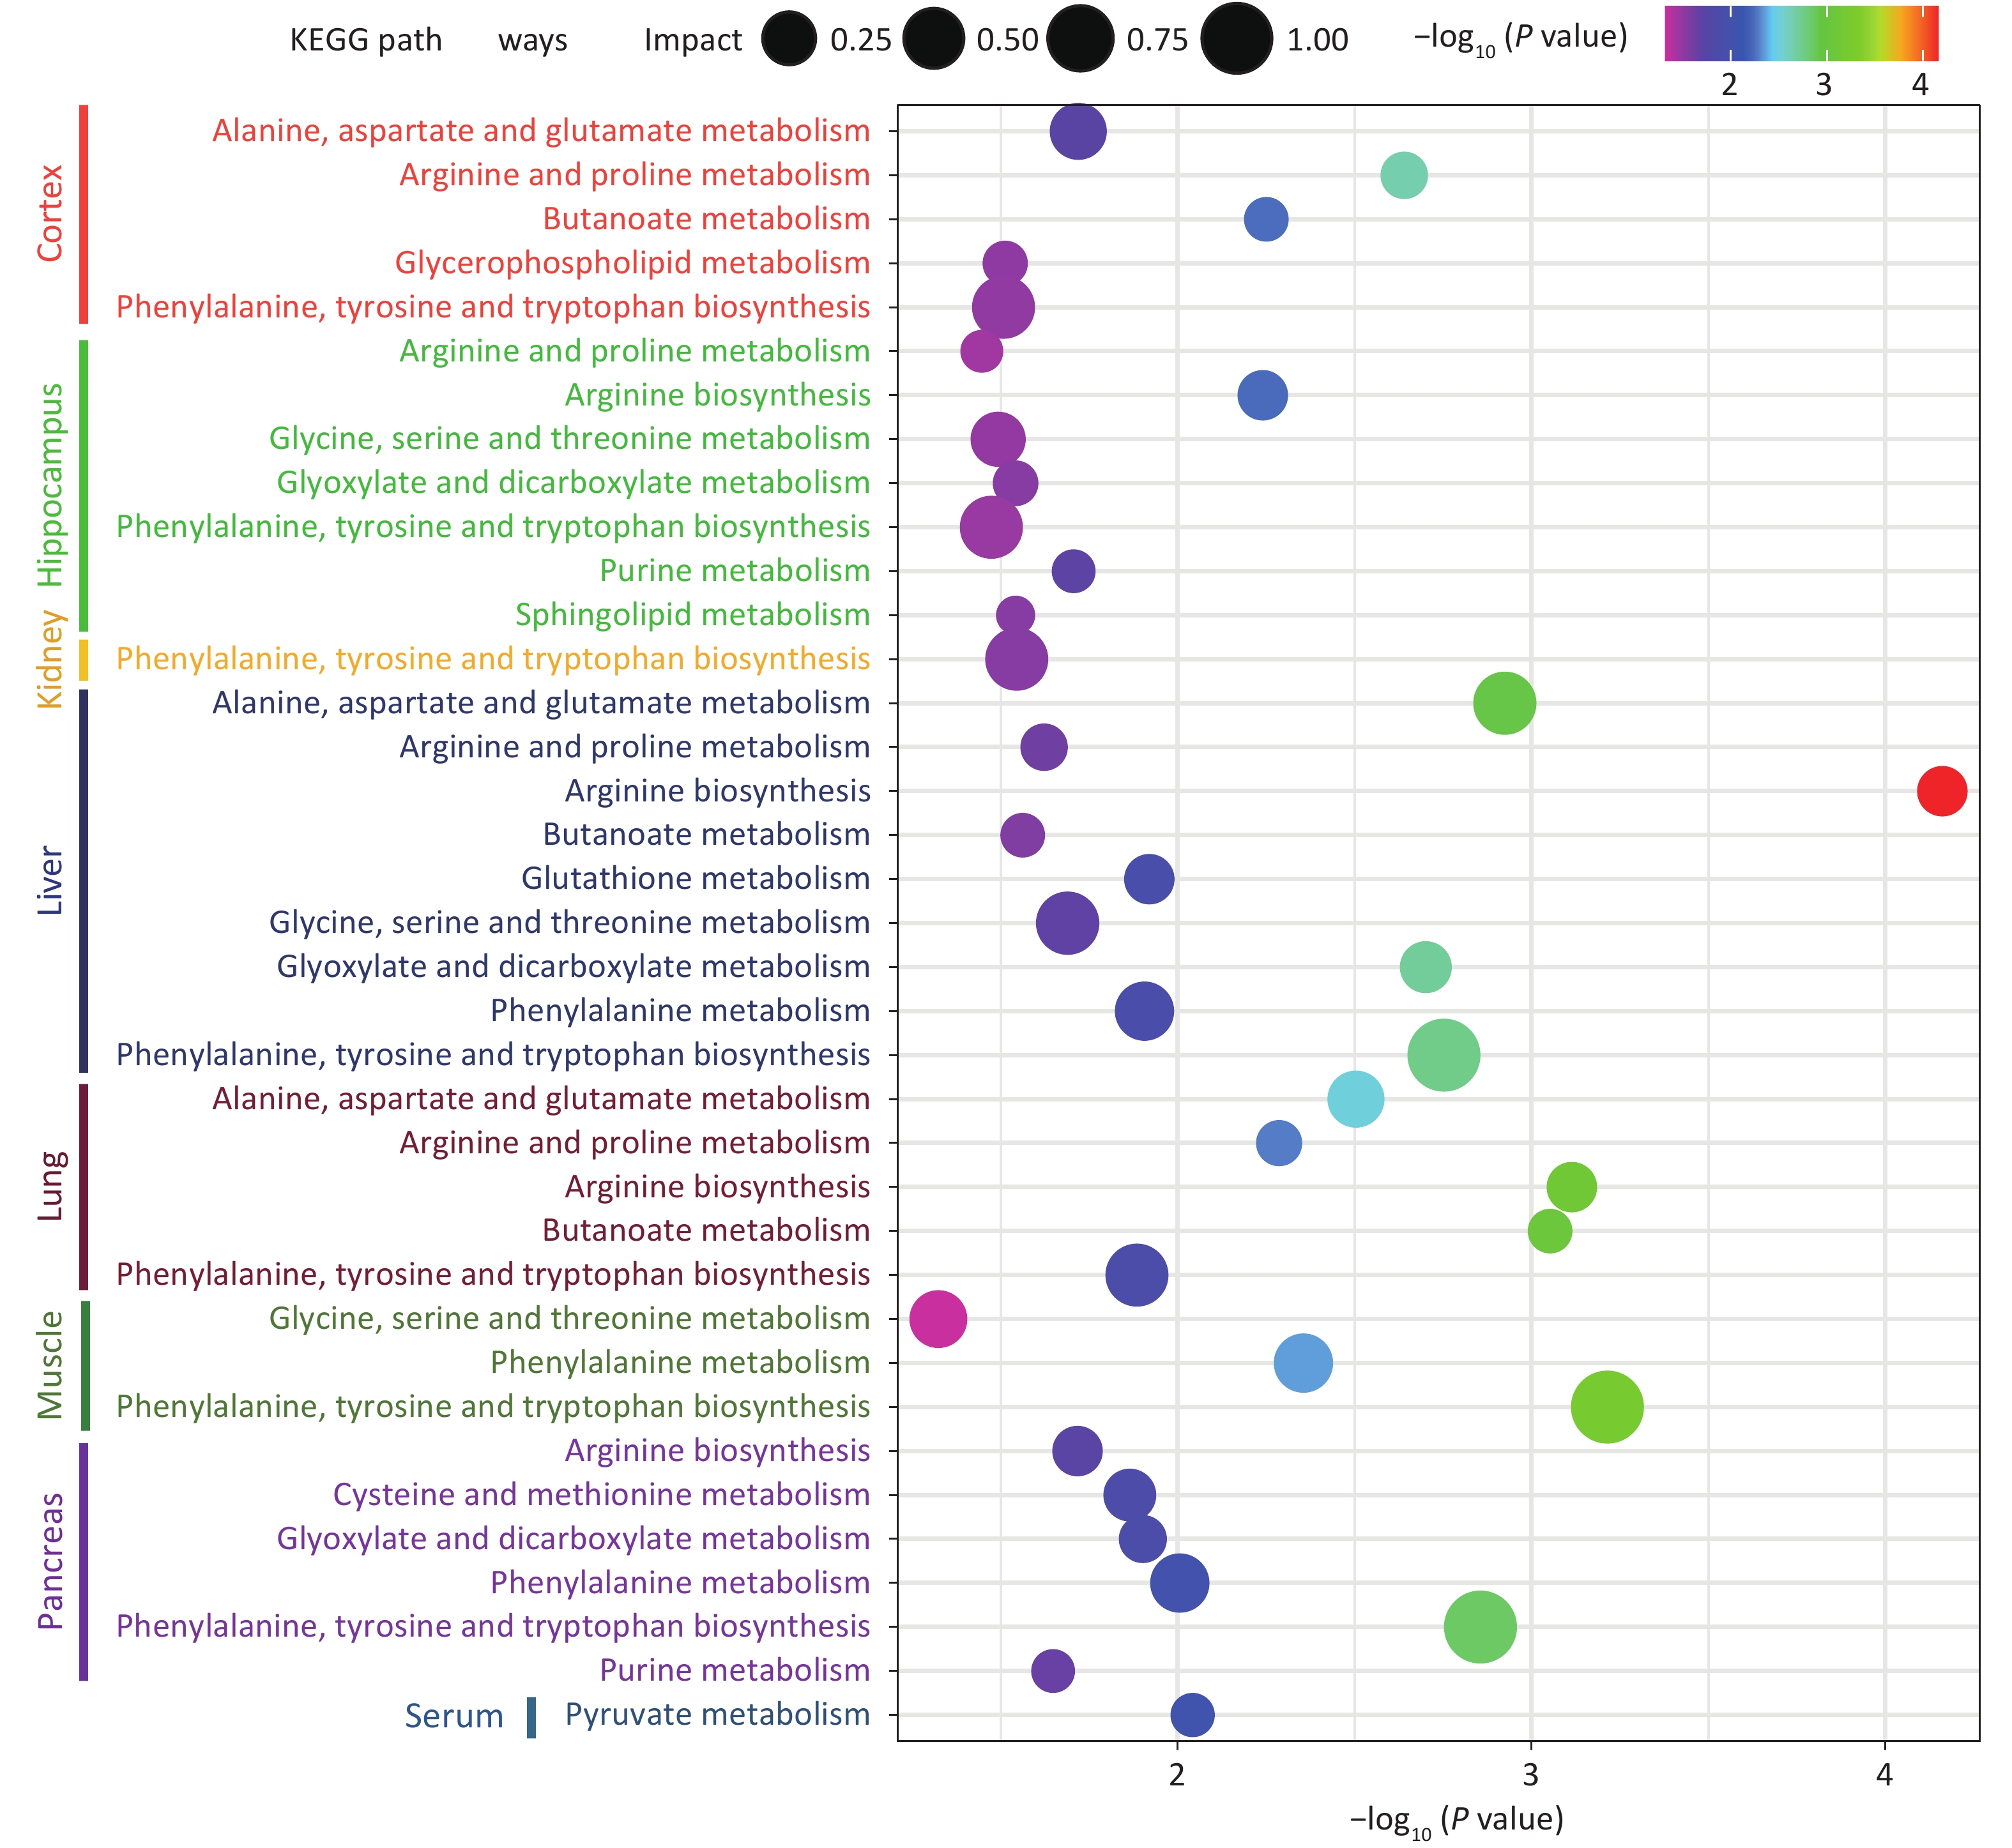
Tissue Metabolite HMDB Trend VIP Liver L-Glutamic acid HMDB0000148 down 1.61597 L-Tyrosine HMDB0000158 down 1.60227 L-Methionine HMDB0000696 down 1.57527 L-Phenylalanine HMDB0000159 down 1.55521 9H-Purin-6-ol HMDB0000157 down 1.55288 L-Aspartic acid HMDB0000191 down 1.55008 Uracil HMDB0000300 down 1.54992 Serine HMDB0000187 down 1.50908 L-Proline HMDB0000162 down 1.50397 L-Threonine HMDB0000167 down 1.49156 L-Leucine HMDB0000687 down 1.4677 L-Isoleucine HMDB0000172 down 1.44514 L-Valine HMDB0000883 down 1.43082 L-5-Oxoproline HMDB0000267 down 1.42757 Hydroxylamine HMDB0003338 down 1.40376 N-Acetyl-L-glutamic acid HMDB0001138 down 1.40868 L-Alanine HMDB0000161 down 1.38332 D-Gluconic acid HMDB0000625 down 1.37427 Tryptophan HMDB0000929 down 1.33961 Urea HMDB0000294 down 1.31395 Glycine HMDB0000123 down 1.27889 Galactopyranose HMDB0033704 down 1.26461 Tranexamic acid HMDB0014447 down 1.24953 Rhein HMDB0032876 down 1.24747 L-Lysine HMDB0000182 down 1.23094 4-Aminobutanoic acid HMDB0000112 down 1.199 Arachidonic acid HMDB0001043 down 1.12572 Stearic acid HMDB0000827 down 1.0994 Palmitic Acid HMDB0000220 down 1.09487 Malic acid HMDB0000156 down 1.09471 Tetradecane HMDB0059907 down 1.09205 Ethanolamine HMDB0000149 down 1.02754 Serum L-5-Oxoproline HMDB0000267 down 1.75536 L-Lysine HMDB0000182 down 1.50729 L-Proline HMDB0000162 down 1.40356 L-Alanine HMDB0000161 down 1.38453 1-Hexadecanol HMDB0003424 down 1.45635 Lactic Acid HMDB0000190 down 1.43843 Glycolic acid HMDB0000115 down 1.43697 Malic acid HMDB0000156 down 1.23037 Stearic acid HMDB0000827 down 1.13665 Ethanolamine HMDB0000149 down 1.11081 Palmitic Acid HMDB0000220 down 1.0163 Kidney Urea HMDB0000294 up 2.20158 Citric acid HMDB0000094 up 2.19117 D-Sorbitol HMDB0000247 up 1.63046 Phosphorylethanolamine HMDB0000224 up 1.58902 Tyrosine HMDB0000158 down 1.39751 L-Alanine HMDB0000161 down 1.32831 Lactic Acid HMDB0000190 down 1.25985 (R)-3-Hydroxybutyric acid HMDB0000011 down 1.25733 Glycolic acid HMDB0000115 down 1.22594 L-Valine HMDB0000883 down 1.14369 L-Proline HMDB0000162 down 1.10525 1-Hexadecanol HMDB0003424 up 1.00702 Cortex Phosphorylethanolamine HMDB0000224 up 2.97731 Adenosine HMDB0000050 up 1.7031 Doconexent HMDB0002183 up 1.38099 Ethanamine HMDB0013231 up 1.33798 Stearic acid HMDB0000827 up 1.10307 L-Tyrosine HMDB0000158 up 1.00436 4-Aminobutanoic acid HMDB0000112 up 1.42226 Bisphenol A HMDB0032133 up 1.20559 Petroselinic acid HMDB0002080 up 1.1134 L-Threonine HMDB0000167 up 1.21537 L-Proline HMDB0000162 down 1.15092 L-Lysine HMDB0000182 up 1.54087 L-Glutamic acid HMDB0000148 up 1.22632 Inosine HMDB0000195 up 1.0359 Ethanolamine HMDB0000149 up 1.76733 Hippocampus 2-Aminoheptanedioic acid HMDB0034252 up 3.24116 L-Tyrosine HMDB0000158 up 2.7385 Sedoheptulose HMDB0003219 up 2.31117 Inosine HMDB0000195 up 1.92645 Phosphorylethanolamine HMDB0000224 up 1.85007 9H-Purin-6-ol HMDB0000157 up 1.77027 L-Glutamic acid HMDB0000148 up 1.59071 L-Norleucine HMDB0001645 up 1.5615 Hydracrylic acid HMDB0000700 up 1.49121 Urea HMDB0000294 up 1.45648 Serine HMDB0000187 up 1.44965 L-Isoleucine HMDB0000172 up 1.42257 L-Valine HMDB0000883 up 1.35593 L-Threonine HMDB0000167 up 1.27345 L-Proline HMDB0000162 up 1.23857 3-Hydroxypicolinic acid HMDB0013188 up 1.18264 Muscle Glycerol HMDB0000131 down 2.49781 Trichloroethanol HMDB0041796 up 1.96107 Taurine HMDB0000251 up 1.83839 Propylene glycol HMDB0001881 up 1.66415 Urea HMDB0000294 up 1.65546 L-Tyrosine HMDB0000158 up 1.5729 9H-Purin-6-ol HMDB0000157 up 1.48071 Phosphorylethanolamine HMDB0000224 up 1.45825 3-Hydroxypicolinic acid HMDB0013188 up 1.35822 Niacinamide HMDB0001406 up 1.35038 Glycine HMDB0000123 up 1.29333 L-Phenylalanine HMDB0000159 up 1.20685 N-Acetylaspartic acid HMDB0000812 up 1.10805 L-Methionine HMDB0000696 up 1.08662 Lactic Acid HMDB0000190 up 1.08656 Glycolic acid HMDB0000115 up 1.08531 L-Threonine HMDB0000167 up 1.07616 L-Valine HMDB0000883 up 1.01051 Lung 4-Aminobutanoic acid HMDB0000112 up 2.01789 Urea HMDB0000294 up 1.676 L-Glutamic acid HMDB0000148 up 1.53853 Tetrahydrofuran HMDB0000246 up 1.43904 Nicotinamide N-oxide HMDB0002730 up 1.2997 Petroselinic acid HMDB0002080 up 1.2299 Hexadecane HMDB0033792 up 1.1749 L-Threonine HMDB0000167 up 1.07655 L-Tyrosine HMDB0000158 up 1.03504 Pancreas Urea HMDB0000294 up 1.29529 Uracil HMDB0000300 up 1.18631 Tryptophan HMDB0000929 up 2.04969 Tetrahydrofuran HMDB0000246 up 1.02659 Serine HMDB0000187 up 1.47562 L-Threonine HMDB0000167 up 1.13707 L-Phenylalanine HMDB0000159 up 1.1867 L-Methionine HMDB0000696 up 1.20291 L-Lysine HMDB0000182 up 1.71349 L-Isoleucine HMDB0000172 up 1.42357 Inosine HMDB0000195 up 1.4328 Ethanolamine HMDB0000149 up 1.52778 Doconexent HMDB0002183 up 1.16472 4-Hydroxybutanoic acid HMDB0000549 up 1.27597 Citric acid HMDB0000094 down 2.23144 Guanosine HMDB0000133 up 2.0481 Uridine HMDB0000296 up 1.98029 Phosphorylethanolamine HMDB0000224 up 1.83576 L-Tyrosine HMDB0000158 up 1.70204 5-Methyluridine HMDB0000884 up 1.65374 9H-Purin-6-ol HMDB0000157 up 1.61238 Arachidonic acid HMDB0001043 up 1.5695 L-Valine HMDB0000883 up 1.53221 L-Leucine HMDB0000687 up 1.51643 L-Glutamic acid HMDB0000148 up 1.26123 L-Proline HMDB0000162 up 1.04339 L-2-Aminobutyric acid HMDB0000452 up 1.02798 Note. VIP, variable importance in projection. Finally, the analysis observed that 14 metabolic pathways were significantly differentially expressed between the control group and the Cu-exposed group (P < 0.05, impact > 0.05), indicating that the changes in metabolite levels in the serum, tissues, and organs caused by Cu exposure were related to toxicological processes such as oxidative stress, decreased detoxification capacity, mitochondrial dysfunction, energy metabolism disorder, and amino acid metabolism disorder. The details of the metabolic pathway analysis are summarized in Supplementary Table S3 (available in www.besjournal.com) and are supplemented with a visual representation in Figure 3. Cu exposure may cause an imbalance in oxidative and antioxidant stress responses in the body, reduce detoxification capacity, and damage tissues and organs. The results showed that the levels of L-glutamic acid, L-5-Oxoproline, and Glycine in the livers of mice in the Cu-exposed group decreased. Glutathione (GSH) is an important cellular antioxidant that can remove free radicals and peroxides and protect cells from oxidative damage[7]. Glutamate and glycine are the key precursors of the GSH metabolic pathway. Conversely, when GSH is degraded, glutamate and L-5-oxoproline are produced, and the latter can be converted into glutamate and participate in the GSH synthesis cycle. Therefore, we inferred that Cu exposure may increase the consumption of the antioxidant defense system in the liver, interfere with the normal GSH metabolic pathway, and cause the liver to suffer the toxic effects of oxidative stress damage. In addition, we observed that the tyrosine content in the kidney decreased after Cu exposure. Cu, as an oxidant, can catalyze the generation of reactive oxygen species, leading to oxidative stress, which may interfere with the activity of phenylalanine, tyrosine, and tryptophan biosynthesis, affect the conversion of phenylalanine to tyrosine, and reduce the detoxification ability of the kidney, leading to the accumulation of free radicals and other metabolic wastes in the kidney and causing nephrotoxicity.
Figure 3. KEGG enrich in serum and different organs.
Cu exposure may damage the body through toxic mechanisms such as mitochondrial damage and energy metabolism disorders. The pyruvate metabolism plays a key role in energy production. Pyruvate enters the mitochondria under aerobic conditions and is converted to acetyl-CoA through a series of reactions. The latter then enters the tricarboxylic acid cycle to produce (S)malate. (S)-Lactic acid is produced from pyruvate through lactic acid fermentation under hypoxic conditions, thereby maintaining the energy supply of cells under hypoxic conditions[8]. After Cu exposure, the levels of (S)-malate and (S)-lactate in the serum of mice decreased, which may be due to the damage caused by Cu to mitochondrial function, interfering with the pyruvate metabolic pathway and affecting overall energy metabolism. Cu exposure caused changes in the levels of metabolites in the pancreas of mice. The results showed that the citrate content in the glyoxylate and dicarboxylic acid metabolic pathways related to energy metabolism was reduced. Cu exposure can induce oxidative stress, damage mitochondrial function, and lead to toxic mechanisms such as energy metabolism disorders. Faced with the toxic effects of Cu exposure, the body may increase antioxidant defense and damage repair mechanisms, such as serine and L-glutamic acid, to cope with the toxic effects caused by oxidative stress and energy metabolism disorders.
Cu exposure has been shown to alter the amino acid profiles of various tissues and organs in mice. L-glutamate has been shown to possess antioxidant and detoxification properties and act as a primary excitatory neurotransmitter in the central nervous system. Moreover, it is involved in numerous intricate cell signaling pathways, including arginine biosynthesis, arginine and proline metabolism, and butyrate metabolism. However, excessive Glu levels can lead to excitotoxicity[9]. The elevated expression levels of related metabolites (L-glutamate, L-serine, L-proline, and 4-aminobutyrate) in our study may indicate that Cu exposure can cause damage to the cortex and hippocampus of mice through toxic mechanisms, such as disruption of the balance between related amino acid metabolism and interference with intercellular signaling. The arginine and proline metabolic pathways, which are rich in gamma-aminobutyric acid and L-glutamate, are vital for collagen synthesis. Collagen is an essential component of lung tissue structure and is associated with pulmonary fibrosis and lung injury repair processes[10]. The glycine, serine, and threonine metabolic pathways play important roles in protein synthesis and cell signaling. The increase in glycine and l-threonine content in the muscle after Cu exposure may be due to Cu interfering with normal glycine, serine, and threonine metabolic pathways, thereby affecting the synthesis and degradation of muscle proteins.
This study revealed that the toxic mechanisms of Cu exposure in different tissues and organs may include oxidative stress, decreased detoxification capacity, mitochondrial dysfunction, and energy and amino acid metabolism disorders. This study deepens our understanding of the systemic toxicity mechanism caused by Cu exposure and will help formulate strategies for the prevention and treatment of Cu poisoning.
doi: 10.3967/bes2024.179
Metabolomic Changes in Mice Induced by Copper Exposure: Systematic Analysis and Exploration of Toxicity Mechanisms
-
The authors declare that there are no conflict of interest.
This animal experiment strictly complied with the guidelines for the care and use of experimental animals of the State Science and Technology Commission of the People's Republic of China, and the study protocol was approved by Jining Medical University ethics committee (approval number: JNRM-2024-DW-003).
&These authors contributed equally to this work.
注释:1) Competing Interests: 2) Ethics: -
Figure 1. After copper exposure (A) weight, (B–C) Cu ion concentrations in serum and liver, (D) pathological examination, and (E) TIC images of QCs. Data are presented as mean ± standard deviation. *P < 0.05, **P < 0.01, and ***P < 0.001 indicate differences between different groups, respectively.
S1. OPLS-DA score plots and 200 permutation tests tables: (A) serum, (B) liver, (C) hippocampus, (D) cortex, (E) kidney, (F) pancreas, (G) lung, and (H) muscle.
Figure 2. Differential metabolites identified in (A) serum, (B) liver, (C) hippocampus, (D) cortex, (E) kidney, (F) pancreas, (G) lung, and (H) muscle samples through cluster analysis and heatmap representation, comparing the Cu-exposed group with the control group. The heatmap colors indicate the metabolite regulation levels (blue for downregulation, red for upregulation). In this representation, the rows correspond to individual samples, whereas the columns represent specific metabolites.
S1. The OPLS-DA parameters in the target main tissues
Tissue R² (cum) Q² (cum) Liver 0.998 0.911 Serum 0.996 0.746 Kidney 0.999 0.875 Cortex 0.982 0.777 Hippocampus 0.964 0.631 Muscle 0.983 0.73 Lung 0.989 0.614 Pancreas 0.996 0.753  下载: 导出CSV
S2. List of metabolites altered in the serum, liver, hippocampus, cortex, kidney, pancreas, lung, and muscle after copper exposure
Tissue Metabolite HMDB Trend VIP Liver L-Glutamic acid HMDB0000148 down 1.61597 L-Tyrosine HMDB0000158 down 1.60227 L-Methionine HMDB0000696 down 1.57527 L-Phenylalanine HMDB0000159 down 1.55521 9H-Purin-6-ol HMDB0000157 down 1.55288 L-Aspartic acid HMDB0000191 down 1.55008 Uracil HMDB0000300 down 1.54992 Serine HMDB0000187 down 1.50908 L-Proline HMDB0000162 down 1.50397 L-Threonine HMDB0000167 down 1.49156 L-Leucine HMDB0000687 down 1.4677 L-Isoleucine HMDB0000172 down 1.44514 L-Valine HMDB0000883 down 1.43082 L-5-Oxoproline HMDB0000267 down 1.42757 Hydroxylamine HMDB0003338 down 1.40376 N-Acetyl-L-glutamic acid HMDB0001138 down 1.40868 L-Alanine HMDB0000161 down 1.38332 D-Gluconic acid HMDB0000625 down 1.37427 Tryptophan HMDB0000929 down 1.33961 Urea HMDB0000294 down 1.31395 Glycine HMDB0000123 down 1.27889 Galactopyranose HMDB0033704 down 1.26461 Tranexamic acid HMDB0014447 down 1.24953 Rhein HMDB0032876 down 1.24747 L-Lysine HMDB0000182 down 1.23094 4-Aminobutanoic acid HMDB0000112 down 1.199 Arachidonic acid HMDB0001043 down 1.12572 Stearic acid HMDB0000827 down 1.0994 Palmitic Acid HMDB0000220 down 1.09487 Malic acid HMDB0000156 down 1.09471 Tetradecane HMDB0059907 down 1.09205 Ethanolamine HMDB0000149 down 1.02754 Serum L-5-Oxoproline HMDB0000267 down 1.75536 L-Lysine HMDB0000182 down 1.50729 L-Proline HMDB0000162 down 1.40356 L-Alanine HMDB0000161 down 1.38453 1-Hexadecanol HMDB0003424 down 1.45635 Lactic Acid HMDB0000190 down 1.43843 Glycolic acid HMDB0000115 down 1.43697 Malic acid HMDB0000156 down 1.23037 Stearic acid HMDB0000827 down 1.13665 Ethanolamine HMDB0000149 down 1.11081 Palmitic Acid HMDB0000220 down 1.0163 Kidney Urea HMDB0000294 up 2.20158 Citric acid HMDB0000094 up 2.19117 D-Sorbitol HMDB0000247 up 1.63046 Phosphorylethanolamine HMDB0000224 up 1.58902 Tyrosine HMDB0000158 down 1.39751 L-Alanine HMDB0000161 down 1.32831 Lactic Acid HMDB0000190 down 1.25985 (R)-3-Hydroxybutyric acid HMDB0000011 down 1.25733 Glycolic acid HMDB0000115 down 1.22594 L-Valine HMDB0000883 down 1.14369 L-Proline HMDB0000162 down 1.10525 1-Hexadecanol HMDB0003424 up 1.00702 Cortex Phosphorylethanolamine HMDB0000224 up 2.97731 Adenosine HMDB0000050 up 1.7031 Doconexent HMDB0002183 up 1.38099 Ethanamine HMDB0013231 up 1.33798 Stearic acid HMDB0000827 up 1.10307 L-Tyrosine HMDB0000158 up 1.00436 4-Aminobutanoic acid HMDB0000112 up 1.42226 Bisphenol A HMDB0032133 up 1.20559 Petroselinic acid HMDB0002080 up 1.1134 L-Threonine HMDB0000167 up 1.21537 L-Proline HMDB0000162 down 1.15092 L-Lysine HMDB0000182 up 1.54087 L-Glutamic acid HMDB0000148 up 1.22632 Inosine HMDB0000195 up 1.0359 Ethanolamine HMDB0000149 up 1.76733 Hippocampus 2-Aminoheptanedioic acid HMDB0034252 up 3.24116 L-Tyrosine HMDB0000158 up 2.7385 Sedoheptulose HMDB0003219 up 2.31117 Inosine HMDB0000195 up 1.92645 Phosphorylethanolamine HMDB0000224 up 1.85007 9H-Purin-6-ol HMDB0000157 up 1.77027 L-Glutamic acid HMDB0000148 up 1.59071 L-Norleucine HMDB0001645 up 1.5615 Hydracrylic acid HMDB0000700 up 1.49121 Urea HMDB0000294 up 1.45648 Serine HMDB0000187 up 1.44965 L-Isoleucine HMDB0000172 up 1.42257 L-Valine HMDB0000883 up 1.35593 L-Threonine HMDB0000167 up 1.27345 L-Proline HMDB0000162 up 1.23857 3-Hydroxypicolinic acid HMDB0013188 up 1.18264 Muscle Glycerol HMDB0000131 down 2.49781 Trichloroethanol HMDB0041796 up 1.96107 Taurine HMDB0000251 up 1.83839 Propylene glycol HMDB0001881 up 1.66415 Urea HMDB0000294 up 1.65546 L-Tyrosine HMDB0000158 up 1.5729 9H-Purin-6-ol HMDB0000157 up 1.48071 Phosphorylethanolamine HMDB0000224 up 1.45825 3-Hydroxypicolinic acid HMDB0013188 up 1.35822 Niacinamide HMDB0001406 up 1.35038 Glycine HMDB0000123 up 1.29333 L-Phenylalanine HMDB0000159 up 1.20685 N-Acetylaspartic acid HMDB0000812 up 1.10805 L-Methionine HMDB0000696 up 1.08662 Lactic Acid HMDB0000190 up 1.08656 Glycolic acid HMDB0000115 up 1.08531 L-Threonine HMDB0000167 up 1.07616 L-Valine HMDB0000883 up 1.01051 Lung 4-Aminobutanoic acid HMDB0000112 up 2.01789 Urea HMDB0000294 up 1.676 L-Glutamic acid HMDB0000148 up 1.53853 Tetrahydrofuran HMDB0000246 up 1.43904 Nicotinamide N-oxide HMDB0002730 up 1.2997 Petroselinic acid HMDB0002080 up 1.2299 Hexadecane HMDB0033792 up 1.1749 L-Threonine HMDB0000167 up 1.07655 L-Tyrosine HMDB0000158 up 1.03504 Pancreas Urea HMDB0000294 up 1.29529 Uracil HMDB0000300 up 1.18631 Tryptophan HMDB0000929 up 2.04969 Tetrahydrofuran HMDB0000246 up 1.02659 Serine HMDB0000187 up 1.47562 L-Threonine HMDB0000167 up 1.13707 L-Phenylalanine HMDB0000159 up 1.1867 L-Methionine HMDB0000696 up 1.20291 L-Lysine HMDB0000182 up 1.71349 L-Isoleucine HMDB0000172 up 1.42357 Inosine HMDB0000195 up 1.4328 Ethanolamine HMDB0000149 up 1.52778 Doconexent HMDB0002183 up 1.16472 4-Hydroxybutanoic acid HMDB0000549 up 1.27597 Citric acid HMDB0000094 down 2.23144 Guanosine HMDB0000133 up 2.0481 Uridine HMDB0000296 up 1.98029 Phosphorylethanolamine HMDB0000224 up 1.83576 L-Tyrosine HMDB0000158 up 1.70204 5-Methyluridine HMDB0000884 up 1.65374 9H-Purin-6-ol HMDB0000157 up 1.61238 Arachidonic acid HMDB0001043 up 1.5695 L-Valine HMDB0000883 up 1.53221 L-Leucine HMDB0000687 up 1.51643 L-Glutamic acid HMDB0000148 up 1.26123 L-Proline HMDB0000162 up 1.04339 L-2-Aminobutyric acid HMDB0000452 up 1.02798 Note. VIP, variable importance in projection.
下载: 导出CSV
-
[1] Taylor AA, Tsuji JS, Garry MR, et al. Critical review of exposure and effects: implications for setting regulatory health criteria for ingested copper. Environ Manage, 2020; 65, 131−59. doi: 10.1007/s00267-019-01234-y [2] An YM, Li SN, Huang XQ, et al. The role of copper homeostasis in brain disease. Int J Mol Sci, 2022; 23, 13850. doi: 10.3390/ijms232213850 [3] Pierson H, Yang HJ, Lutsenko S. Copper transport and disease: what can we learn from organoids? Annu Rev Nutr, 2019; 39, 75-94. [4] Liu YM, Wang HS, Cui YY, et al. Removal of copper ions from wastewater: a review. Int J Environ Res Public Health, 2023; 20, 3885. doi: 10.3390/ijerph20053885 [5] Zeki ÖC, Eylem CC, Reçber T, et al. Integration of GC-MS and LC-MS for untargeted metabolomics profiling. J Pharm Biomed Anal, 2020; 190, 113509. doi: 10.1016/j.jpba.2020.113509 [6] Gao YF, Yu T, Ai F, et al. Bacillus coagulans XY2 ameliorates copper-induced toxicity by bioadsorption, gut microbiota and lipid metabolism regulation. J Hazard Mater, 2023; 445, 130585. doi: 10.1016/j.jhazmat.2022.130585 [7] Lin HF, Wang LF, Jiang XQ, et al. Glutathione dynamics in subcellular compartments and implications for drug development. Curr Opin Chem Biol, 2024; 81, 102505. doi: 10.1016/j.cbpa.2024.102505 [8] Holeček M. Roles of malate and aspartate in gluconeogenesis in various physiological and pathological states. Metabolism, 2023; 145, 155614. doi: 10.1016/j.metabol.2023.155614 [9] Shen ZH, Xiang M, Chen C, et al. Glutamate excitotoxicity: potential therapeutic target for ischemic stroke. Biomed Pharmacother, 2022; 151, 113125. doi: 10.1016/j.biopha.2022.113125 [10] Jones MG, Andriotis OG, Roberts JJ, et al. Nanoscale dysregulation of collagen structure-function disrupts mechano-homeostasis and mediates pulmonary fibrosis. eLife, 2018; 7, e36354. doi: 10.7554/eLife.36354 -

 点击查看大图

计量
- 文章访问数: 248
- HTML全文浏览量: 110
- PDF下载量: 16
- 被引次数: 0

 Quick Links