-
Kidney cancer is the 12th most common cancer worldwide. Cases of kidney cancer account for approximately 3% of all newly diagnosed cancer cases each year[1]. The most common type of kidney cancer is renal cell carcinoma, which represents 90%-95% of all renal malignancies. Approximately 25%-30% of patients diagnosed with renal cell carcinoma suffer from metastatic disease and have median survival times of less than 1 year[2]. Given the steady increment in the annual global incidence of kidney cancer, the burden of kidney cancer is predicted to increase drastically[3].
The etiology of kidney cancer is complex and poorly understood. Genetic predisposition, smoking, obesity, and hypertension are known risk factors for kidney cancer. Accumulating evidence also suggests a possible relationship between kidney cancer and physical activity, drinking, and occupational trichloroethylene exposure[4]. The identification of novel risk factors for kidney cancer is necessary to develop preventive intervention strategies for this malignancy.
Radon gas is a colorless, odorless, radioactive noble gas that is derived from the decay of uranium and thorium[5]. Radon has a half-life of 3.8 days. It is ubiquitous and can be found in the soil, air, and water[5]. It accounts for 50% of the average dose of background radiation received by humans every year[6]. Next to smoking, the inhalation of radon and its decay products is the second most common cause of lung cancer. Ground water contains high concentrations of dissolved radon, which can be released into indoor air during domestic water use, such as cooking, showering, clothes washing, or water boiling. The release of dissolved radon through domestic water use increases the total inhalation risk of indoor radon. After inhalation into the human body, radon and its decay products damage cells and genes by releasing radioactive alpha particles[5]. Exposure to high levels of radon often occurs in poorly ventilated occupational environments, such as underground uranium mines. Residential radon is a major source of chronic exposure for the general population[7].
Chronic exposure to radon poses a crucial public health problem. Epidemiological studies have reported a positive association between exposure to radon and various types of cancers, including lung, blood, stomach, and kidney cancers. The carcinogenic effects of radon on the lung was first recognized by the International Agency for Research on Cancer in 1988 on the basis of consistent and strong evidence[8].
Epidemiological evidence for the carcinogenic effects of radon on the kidney has been controversial. An ecological study and several occupational studies involving miners reported a statistically significant correlation between kidney cancer incidence and radon concentration; however, some studies have reported nonsignificant results[9-12]. These inconsistent findings highlight the need for a review to provide an overall analysis of the potential association between radon and kidney cancer. To our knowledge, however, no such review exists.
The hypothesis that radon can also cause kidney cancer is biologically plausible. First, second only to the lungs, the kidney receives the highest dose of radon and its decay products after their entry into the human body[13]. Second, the kidney filters radon and its decay products from the blood; during this process, the radioactive alpha particles that are released from radon and its decay products interact with renal cells directly and exert carcinogenic effects on the kidney[9]. A previous rodent study reported that the incidence of kidney cancer increased in rats exposed to radon gas[14].
We systematically collected available epidemiological evidence to examine whether exposure to radon can increase the risk of kidney cancer. In addition, we performed a meta-analysis to combine results across studies and to provide a pooled association measure.
-
This systematic review and meta-analysis was performed and reported in accordance with the Preferred Reporting Items for Systematic Reviews and meta-analyses checklist[15].
-
We identified peer-reviewed articles published in English by searching PubMed database, the search was conducted until August 2018. The following search terms were used: radon, kidney, renal, cancer, neoplasm, and tumor. We first screened all titles and abstracts. Then, we carefully read the full text of relevant studies. We manually searched reference lists from relevant review articles and original studies. Given that few studies have exclusively investigated the relationship between radon exposure and kidney cancer, we conducted an exhaustive search to accumulate all available evidence at the cost of including numerous ineligible studies.
-
Studies were included if 1) their populations were miners or the general population; 2) they were designed as cohort, case-control, cross-sectional, or ecological studies; 3) they provided data on radon exposure levels; and 4) they reported association estimates between radon and kidney cancer.
Studies were excluded if 1) they were not conducted on humans; 2) they were designed as individual case reports; 3) they did not contain original data and instead provided reviews, reanalysis, or commentaries; and 4) they did not assess radon exposure separately from other radioactive substances, such as uranium and gamma.
If several studies investigated the same cohort population, we only retained the study with the longest follow-up period and the largest sample size.
-
The following data of each eligible study were extracted onto a spread sheet: first author, publication year, location, study type, follow-up period, study population, sample size, radon concentration, numbers of kidney cancer cancers, association measures and their 95% confidence intervals (CI), and controlled confounding factors.
If studies reported the incidence and mortality of kidney cancer, we extracted the increased risk of incidence for meta-analysis[16].
-
We developed a checklist for the quality assessment of the included studies in reference to a previous meta-analysis that investigated associations between radon and other cancers[17-19] (Table 1). This checklist encompassed biases from 5 aspects: study design, total sample size, endpoint ascertainment, number of adjusted confounding factors, and radon measurement. Each item was divided into different ranks on the basis of scores. Studies received high scores if they had a prospective study design, had a large sample size, used incidence rather than only mortality as an endpoint index, adjusted additional confounding factors, or employed direct radon exposure measurement. The total score was 10. Study quality was ranked on the basis of scores as low (≤ 3), moderate (4-7), or high (≥ 8).
Table 1. Quality Assessment Scale
Item Category Score Study design Pooling study 3 Cohort or case cohort study 2 Case-control study 1 Ecologic 0 Total sample size ≥ 2, 000 2 500-1, 999 1 < 500 0 Outcome index Incidence rate and Mortality 2 Incidence rate 1 Mortality 0 Covariates considered in the results Age, calendar year and others 2 Age, calendar year or none 0 Radon measurements Alpha track or other 1 Not specified, charcoal or estimated or NR 0 Total 10 -
We subjected occupational cohort studies involving miners to meta-analysis. We used the STATA mean command to synthesize the measures of association. We aggregated all relative risk estimates to ensure comprehensiveness and maximize statistical power given the low absolute risk of kidney cancer; standardized mortality ratios (SMR), standardized incidence ratios, and relative risks yielded similar estimates of relative risks[16, 20]. We applied Q test and I2 index to evaluate heterogeneity across studies. Q test P values of less than 0.1 indicate significant heterogeneity, and I2 values of near or less than 25%, near 50%, and near or higher than 75% represent low, moderate, and high heterogeneity, respectively[21]. We used random-effect models to compute the pooled association estimate regardless of the results of heterogeneity tests.
We examined publication bias by using Egger's regression test, with P values of less than 0.05 indicating significant publication bias[22]. We performed subgroup analyzes stratified on the basis of the characteristics of study designs and populations to investigate possible sources of heterogeneity. We performed a sensitive analysis to investigate the influence of a single study on the overall estimate size by successively removing 1 study and then calculating the new overall estimate risk of remaining studies.
We planned a dose-response meta-analysis if more than 1 cohort study provided data on 3 or more categories of radon levels, the number of kidney cancer cases, and the total number of participants[23].
All analyzes were performed using STATA version 14.01 (Stata Corp, College Station, TX, USA).
We subjected studies that are unsuitable for meta-analysis to qualitative analysis.
-
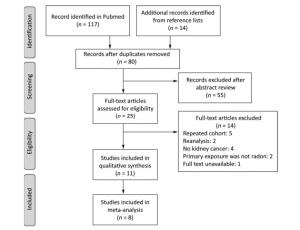
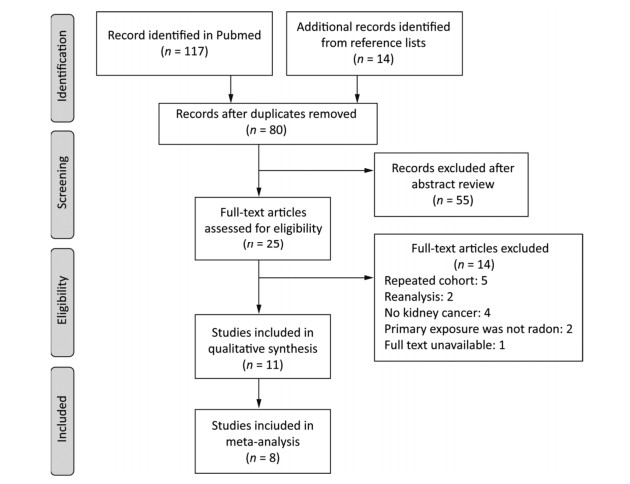
The search yielded 131 articles in total. After removing duplicates, 80 articles remained. Then, we excluded 55 articles because their abstracts were irrelevant to our topic. The references of the 25 remaining articles were searched for full-text reviews. We excluded 5 studies that investigated repeated cohort populations[24-28], 2 reanalysis studies[29-30], 4 studies that did not report the outcome of kidney cancer[31-34], 4 studies on cases of nonradon primary exposure[24, 35], and 1 study with unavailable full text[36]. The remaining 11 studies met our inclusion criteria (Figure 1).
-
As shown in Table 2, 11 of the studies that we selected for review were published between 1991 and 2017[12, 16, 37-45]. Five of these studies were conducted in North America[16, 38-39, 43-44] and 6 were conducted in Europe[12, 37, 40-42, 45]. Among the 11 studies, 9 involved miners, and 2 involved the general population[43-44]. All of the included studies were occupational epidemiological studies wherein working level months (WLM) were used to represent levels of radon exposure. The working level was defined as the concentration of short-lived radon decay products per liter of air that released 1.39 × 10⁵ MeV of alpha energy; 1 WLM represents exposure to 1 work level for 1 month (170 h)[45].
Table 2. Quality Assessment of Included Studies

-
As shown in Table 3, the quality scores of included studies ranged from 2 to 9 with an average score of 5.5 points. Three studies had high quality[12, 16, 37], and 4 studies had moderate quality[39, 42-43, 45]. Except for 1 ecological study involving children[44] and 1 case-cohort study involving miners[37], all included studies were cohort studies. The sample sizes of all included studies exceeded 500, with the sample sizes of 8 studies exceeding 2, 000[12, 16, 37, 42-45]. Only Navaranjan et al. and Kulich et al. reported kidney cancer incidence[16, 37]. Six of the included studies adjusted for age, calendar year, and other potential confounding factors[12, 16, 37, 39, 42-43]. Five studies estimated radon exposure in early years since 1949 to 1983 and then used various advanced equipment to measure direct radon exposure in later years[12, 16, 37, 40, 42]. Four studies obtained radon exposure levels through estimation[38-39, 41, 43].
Table 3. Summarize of Included Studies in Systematic Review

-
Occupational Population All included occupational cohort studies involved male miners. Most studies evaluated kidney cancer mortality and reported standardized mortality ratios. The number of observed deaths from kidney cancer was compared with the number of expected deaths in the reference population. Some studies reported relative risk or excess relative risk per 100 WLM (ERR/100 WLM).
Association estimates varied widely across the included studies, with significant positive, significant negative, and nonsignificant results. Most studies, however, reported nonsignificant results.
Only 1 study observed a statistically significant association between kidney cancer mortality and radon exposure in miners. In a French cohort of 5, 400 uranium workers followed up from 1946 to 2007, the average radon exposure was 35.1 WLM. A total of 24 workers died from kidney cancer. A marginally significant excess risk of kidney cancer mortality (SMR and 95% CI: 1.58, 1.01-2.35) was found after adjusting for age and calendar year[12].
Three studies reported a positive but nonsignificant association between kidney cancer and radon exposure. In 4, 320 uranium miners in Western Bohemia with an average radon exposure of 219 WLM over an average follow-up period of 25 years, the SMR for kidney cancer was 1.30 (95% CI: 0.77-2.06) with 18 observed cases[45]. Similarly, in 779 American Indian uranium miners from a Colorado Plateau cohort, 5 deaths from kidney cancer and a SMR of 1.65 (95% CI: 0.54-3.85) were observed[39]. A retrospective case-cohort study involving a Czech cohort of 22, 816 uranium miners observed 66 kidney cancer cases over the follow-up period of 1977 to 1996; the relative risk of kidney cancer incidence under a cumulative lifetime radon exposure of 180 WLM relative to that under 3 WLM was 1.13 (95% CI: 0.62-2.04). This study, however, failed to describe a clear dose-response relationship between radon exposure levels and increased kidney cancer risks[37]. Only this study evaluated incidence as an outcome.
Four of the included studies did not observe an increased risk of kidney cancer among miners exposed to radon. In a cohort mortality study conducted in New Mexico, 1, 867 uranium miners were followed up over the period of 1979 to 2005. Only 3 cases of kidney cancer were observed, and a SMR of 0.98 was obtained[38]. Similar results were also obtained for a Colorado Plateau cohort of 3, 358 white uranium miners (SMR = 0.76, n = 7)[39]; 1, 785 French uranium miners (SMR = 0.75, n = 3)[40]; and 1, 294 Swedish iron miners (SMR = 0.85, n = 6)[41]. A study on a German cohort presented its results in ERR/100 WLM and had an extended follow-up period spanning 1946 to 2003. This study reported 171 cases of kidney cancer with the ERR/100 WLM of 0.018 (P = 0.37)[42].
One study even reported a significant inverse relationship between kidney cancer risk and low cumulative radon exposure. A total of 100 out of 28, 546 uranium miners in a Canadian cohort with an average radon exposure of only 21 WLM were diagnosed with kidney cancer. Among these miners, 53 died of kidney cancer over the follow-up period of 1954 to 2007. With the general Canadian population as a reference, the standardized incidence rate for kidney cancer was 0.63 (95% CI: 0.51-0.76) and the standardized mortality rate was 0.74 (95% CI: 0.56-0.97). No clear dose-response relationship between kidney cancer risks and radon exposure was found[16].
General Population The 2 studies involving the general population were all mortality studies and did not report significant results. A large American Cancer Society cohort involving nearly 1.2 million subjects followed up over the period of 1982 to 2006 reported 1, 251 deaths from kidney cancer. Fully adjusted Cox proportional hazards regression models indicated that the average county-level residential radon concentration was not a risk factor for kidney cancer (hazard ratio and 95% CI: 0.94, 0.76-1.16)[43]. The second study is an old ecological study that investigated the association between groundwater concentration and cancer mortality among children. Similar to the first study, this study did not report a significant increase in kidney cancer risk [relative risk and 95% CI: 1.13 (0.74-1.70)] or a clear dose-response relationship[44].
-
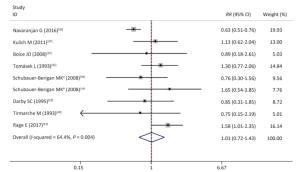
We did not obtain sufficient data for a dose-response analysis as planned. We selected 8 occupational studies involving 70, 165 miners to compute the pooled estimates relative risk[12, 16, 37-41]. One study was counted twice because it presented results separately in 2 different groups[39].
-
As expected, the weighted overall relative risk was not significant (RR = 1.01; 95% CI, 0.72-1.43) (Figure 2), with moderate to high heterogeneity across studies (I2 = 64.4%; P value for Q test < 0.1). Publication bias was not detected (P value of Egger's test = 0.156).
-
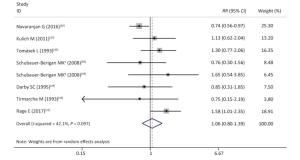
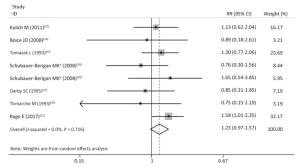
As shown in Table 4 and Supplementary Figures S1-S7 (available in www.besjournal.com), our subgroup analysis revealed a marginally statistically significant positive association between radon exposure and kidney cancer risks among studies conducted in Europe (RR, 1.29; 95% CI, 0.99-1.68)[12, 37, 40-41, 45]; studies with sample sizes of less than 2, 000 (RR, 1.29; 95% CI, 0.96-1.72; k = 6)[12, 37-41]; and studies that exclusively used mortality as outcome event (RR, 1.26; 95% CI, 0.97-1.63; k = 7)[12, 38-41]. Heterogeneity was reduced within these 3 subgroups and in studies conducted prior to the year of 2000[37, 40-41], studies with follow-up periods of less than 43 years[37-38, 40-41], studies wherein the average radon exposure of the subjects ranged from 50 WML to 100 WML[37, 40-41], and studies with moderate to high quality[12, 16, 37, 39, 45].
Table 4. Subgroup Analyses Relating Radon Exposure to Kidney Cancer by Characteristics of Study Designs and Populations
Stratified Variable No. of Kidney Cancer Ka RR (95% CI) Pb I2, %b Total 232 9 1.01 (0.72-1.43) 0.01 64 North-American studies 115 4 0.66 (0.55-0.80) 0.28 22 European studies 117 5 1.29 (0.99-1.68) 0.64 0 Sample size ≥ 2, 000 125 3 0.84 (0.50-1.40) 0.02 72 Sample size < 2, 000 107 6 1.29 (0.96-1.72) 0.70 0 Endpoint before the year 2000 27 4 1.13 (0.81-1.58) 0.58 0 Endpoint after the year 2000 205 5 1.02 (0.65-1.60) 0.01 73 Follow-up period > 43 years 154 5 1.07 (0.65-1.76) 0.00 81 Follow-up period ≤ 43 years 78 4 0.98 (0. 63-1.53) 0.92 0 Incidence 166 2 0.79 (0.45-1.37) 0.07 70 Mortality 66 7 1.26 (0.97-1.63) 0.62 0 Higher-quality studiesc 190 3 1.02 (0.53-1.94) 0.00 88 Medium-quality studiesd 30 3 1.20 (0, 81-1.77) 0.43 0 Low-quality studiese 12 3 0.83 (0.44-1.60) 0.98 0 < 50 WMLf 124 2 0.98 (0.40-2.41) 0.00 93 50-100 WMLf 74 3 1.00 (0.63-1.59) 0.79 0 > 100 WMLf 75 3 1.20 (0.81-1.77) 0.43 0 Note.Abbreviations: RR, relative risks; CI, confidential interval; WML, working month levels. aDenote the number of study with corresponding variable category. bRandom effects models were used in all subgroups. cStudies that scored more than 8 in the adopted quality assessment scale. dStudies that scored more between 4 to 7 in the adopted quality assessment scale. eStudies that scored less than 3 in the adopted quality assessment scale. fAverage radon exposure levels. 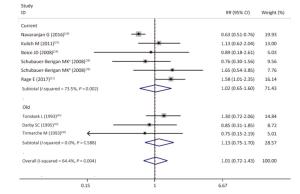
Figure Supplementary Figure S1. Subgroup analysis. old, studies published before the year of 2000; current, studies published after the year of 2000; random effects model. aWhites uranium miners; bAmerican Indians uranium miners.
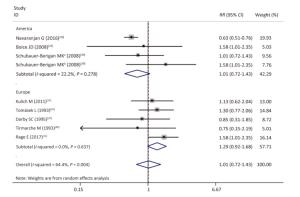
Figure Supplementary Figure S2. Subgroup analysis of studies conducted in different locations; random effects model. aWhites uranium miners; bAmerican Indians uranium miners.
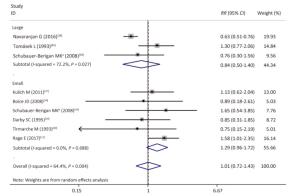
Figure Supplementary Figure S3. Subgroup analysis of studies of different sample size; large, sample size ≥ 2000; small, sample size < 2000; random effects model. aWhites uranium miners; bAmerican Indians uranium miners.
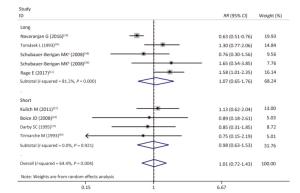
Figure Supplementary Figure S4. Subgroup analysis; long, follow-up period > 43 years; short, follow-up period ≤ 43 years; random effects model. aWhites uranium miners; bAmerican Indians uranium miners.
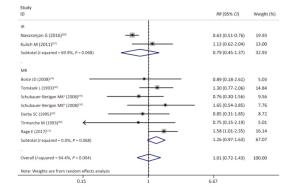
Figure Supplementary Figure S5. Subgroup analysis according to studies used incidence or mortality as outcome event; random effects model. aWhites uranium miners; bAmerican Indians uranium miners.
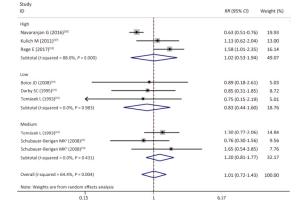
Figure Supplementary Figure S6. Subgroup analysis according to qualities of studies; studies with scores of quality scale '≤ 3', '4-7' and '≥ 8', corresponding to 'low', 'moderate' and 'high' quality; random effects model. aWhites uranium miners; bAmerican Indians uranium miners.
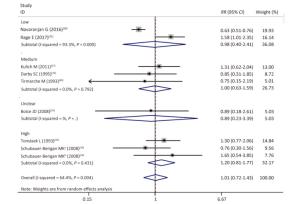
Figure Supplementary Figure S7. Subgroup analysis according to different average radon exposure levels; low, < 50 WML; medium, 50-100 WML; high, > 100 WML; random effects model. aWhites uranium miners; bAmerican Indians uranium miners.
As shown in Supplementary Figures S8-S10 (available in www.besjournal.com), sensitivity analyzes suggested that the pooled risk estimate was not significantly influenced by any single study and ranged from 0.90 (95% CI, 0.67-1.24) to 1.23 (95% CI, 0.97-1.57) after 1 study was successively removed. Notably, after omitting the study of Navaranjan et al.[16], we observed a marginally significant estimate size (RR and 95% CI: 1.23, 0.97-1.57) with reduced heterogeneity across studies (P value of Q-test = 0.71).
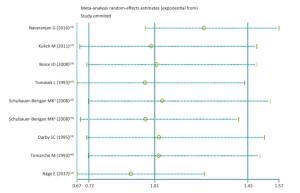
Figure Supplementary Figure S8. Sensitive analysis. aWhites uranium miners; bAmerican Indians uranium miners.
-
To our knowledge, this is the first systematic review and meta-analysis that evaluated the possible association between kidney cancer risk and radon exposure. Overall, available studies involving occupational populations and general populations found nonsignificant relationships between radon and kidney cancer. The methodological limitations and heterogeneities across the included studies should be highlighted.
Most of the included studies were occupational epidemiological studies that have been valuable for extrapolating results to general populations[46]. Nevertheless, the high heterogeneity across studies detected by tests (I2 = 64.4%; P value for Q test < 0.1) reflected the broad range of the quality assessment scores (score range: 2-9) of the included studies.
Approaches for radon exposure measurements drastically varied across and within studies. For example, in the study involving a cohort of uranium miners in Ontario, annual average radon exposure levels over the period of 1954 and 1958 were estimated through mine-specific extrapolations, and individual radon exposure levels over the period of 1958 to 1968 were determined through area sampling conducted with increasing frequency over time[16]. In the study involving a cohort of Czech uranium miners, data on the potential alpha energy of radon progeny were obtained through estimation given that approaches for the direct measurement of this index only became available in 1968[37]. Tirmarchel et al. applied a mixture of old, estimated data and new, directly measured data of radon exposure[40]. Meanwhile, improvements in safety measurements and ventilation have decreased the levels of cumulative radon exposure among miners.
Although most studies adjusted results by age and calendar year, numerous potential confounding factors remained unadjusted. In occupational settings, miners are also exposed to other carcinogens, such as arsenic, silica dust, and gamma radiation. Only Kreuzer et al., however, adjusted for these confounding factors[42]. In addition, cigaret smoking, a known risk factor of kidney cancer, was considered only by 2 studies. One of these studies only analyzed the influence of smoking on radon-induced lung cancer, and the other did not detect a significant association between smoking and kidney cancer[37, 39].
Sample size varied and ranged from 779 to 28, 546. Moreover, the generalizability of findings was poor given that the study participants were all men.
Although most miner studies involved large cohorts, the statistical powers of these studies were actually low because 1) none of them exclusively investigated the relationship between radon exposure and kidney cancer, and 2) the low incidence of kidney cancer resulted in a small number of observed kidney cancer cases.
Most studies underestimated the carcinogenic effects of radon on the kidney because they simply evaluated kidney cancer mortality rather than incidence. Kidney cancer has good survival rates. In addition, death certificate collection may have been incomplete and inaccurate, and workers with kidney cancer could also die from accidents, lung cancer, and other causes[16].
The healthy worker effect is another common bias of occupational studies. Given that workers who are severely ill or disabled are excluded from employment, the overall death rates of worker populations are lower than those of the general population. Most miner studies included in this review employed the general population as a reference. This approach, however, amplified the healthy worker effect[47].
This systematic review has several limitations. First, the quality assessment tool is not validated. Second, given that we only searched the Pubmed database and only included English papers, we may have ignored some eligible studies. Nevertheless, the addition of new studies is unlikely to reverse our present results because most of the relevant published studies reported a nonsignificant relationship between radon exposure and kidney cancer. Another limitation is that only 2 of the included studies involved general populations[43-44], and 1 of these studies was published several decades ago[44]. Although nonsignificant results were reported, the limited number of studies and the weak power of the causal inference of ecological design should be noted.
This present study has some advantages. To our knowledge, it is the first study to systematically collect available evidence on the association between radon exposure and kidney cancer. In addition, the present study was performed and reported in accordance with the guidelines of the Preferred Reporting Items for Systematic Reviews and Meta-Analyses. We performed quantitative analysis and did not detect publication bias. Although our meta-analysis appeared to be redundant and unsuitable given the predominantly nonsignificant results and high heterogeneity across the included studies, our subgroup analysis successfully identified geographical locations, sample size, and association measures as sources of heterogeneity. Moreover, a noticeable increased effect size in studies conducted in Europe was also observed in 1 previous meta-analysis that assessed the link between radon exposure and lung cancer[48]. This effect warrants further research.
In conclusion, our systematic review and meta-analysis of available epidemiological studies found no clear association between radon and kidney cancer. Nevertheless, this association cannot be excluded because of its biological plausibility and the limited number and quality of existing studies.
Additional rigorous studies that investigate the association between radon exposure and kidney cancer are needed. Large occupational cohort studies involving miners are realistic and preferable but require several improvements. First, individual radon exposure should be measured with increased precision. For example, the measurement of internal radon dosage on the basis of biomarkers is better than the estimation of external radon dosage, because biomarkers can determine whether organisms are exposed to environmental pollutants and determine the interaction between environmental pollutants and organisms. Second, kidney cancer should be identified through clinical examination, and incidence is better than mortality as the outcome event. Third, the ideal reference group should be miners who worked exclusively in open-air mines or uranium processing plant workers, not the general population[40]. General population-based data are especially needed to reveal the actual relationship between radon exposure and kidney cancer.
doi: 10.3967/bes2018.108
Exposure to Radon and Kidney Cancer:A Systematic Review and Meta-analysis of Observational Epidemiological Studies
-
Abstract:
Objective To evaluate the possible association between radon exposure and kidney cancer. Methods We performed a systematic review and a meta-analysis based on random effect models to provide a pooled association measure. Results We subjected 8 studies (overall relative risks and 95% confidence intervals: 1.01, 0.72 to 1.43, I2=64.4%) to meta-analysis. Subgroup analysis revealed a marginally significant association between radon exposure and kidney cancer in studies conducted in Europe. Two population-based studies provided no evidence for the increased risk of kidney cancer in the general population. Conclusion The association between radon and kidney cancer remains unclear but cannot be excluded because of its biological plausibility and the limited number and quality of existing studies. Additional data from the general population and well-designed miner cohort studies are needed to reveal the real relationship between radon exposure and kidney cancer. -
Key words:
- Radon /
- Kidney /
- Systematic review /
- Meta-analysis
-
Table 1. Quality Assessment Scale
Item Category Score Study design Pooling study 3 Cohort or case cohort study 2 Case-control study 1 Ecologic 0 Total sample size ≥ 2, 000 2 500-1, 999 1 < 500 0 Outcome index Incidence rate and Mortality 2 Incidence rate 1 Mortality 0 Covariates considered in the results Age, calendar year and others 2 Age, calendar year or none 0 Radon measurements Alpha track or other 1 Not specified, charcoal or estimated or NR 0 Total 10 Table 2. Quality Assessment of Included Studies

Table 3. Summarize of Included Studies in Systematic Review

Table 4. Subgroup Analyses Relating Radon Exposure to Kidney Cancer by Characteristics of Study Designs and Populations
Stratified Variable No. of Kidney Cancer Ka RR (95% CI) Pb I2, %b Total 232 9 1.01 (0.72-1.43) 0.01 64 North-American studies 115 4 0.66 (0.55-0.80) 0.28 22 European studies 117 5 1.29 (0.99-1.68) 0.64 0 Sample size ≥ 2, 000 125 3 0.84 (0.50-1.40) 0.02 72 Sample size < 2, 000 107 6 1.29 (0.96-1.72) 0.70 0 Endpoint before the year 2000 27 4 1.13 (0.81-1.58) 0.58 0 Endpoint after the year 2000 205 5 1.02 (0.65-1.60) 0.01 73 Follow-up period > 43 years 154 5 1.07 (0.65-1.76) 0.00 81 Follow-up period ≤ 43 years 78 4 0.98 (0. 63-1.53) 0.92 0 Incidence 166 2 0.79 (0.45-1.37) 0.07 70 Mortality 66 7 1.26 (0.97-1.63) 0.62 0 Higher-quality studiesc 190 3 1.02 (0.53-1.94) 0.00 88 Medium-quality studiesd 30 3 1.20 (0, 81-1.77) 0.43 0 Low-quality studiese 12 3 0.83 (0.44-1.60) 0.98 0 < 50 WMLf 124 2 0.98 (0.40-2.41) 0.00 93 50-100 WMLf 74 3 1.00 (0.63-1.59) 0.79 0 > 100 WMLf 75 3 1.20 (0.81-1.77) 0.43 0 Note.Abbreviations: RR, relative risks; CI, confidential interval; WML, working month levels. aDenote the number of study with corresponding variable category. bRandom effects models were used in all subgroups. cStudies that scored more than 8 in the adopted quality assessment scale. dStudies that scored more between 4 to 7 in the adopted quality assessment scale. eStudies that scored less than 3 in the adopted quality assessment scale. fAverage radon exposure levels. -
[1] Ferlay J, Soerjomataram I, Dikshit R, et al. Cancer incidence and mortality worldwide:sources, methods and major patterns in GLOBOCAN 2012. Int J Cancer, 2015; 136, E359. doi: 10.1002/ijc.29210 [2] Gupta K, Miller JD, Li JZ, et al. Epidemiologic and socioeconomic burden of metastatic renal cell carcinoma (mRCC):A literature review. Cancer Treat Rev, 2008; 34, 193-205. doi: 10.1016/j.ctrv.2007.12.001 [3] Wong MCS, Goggins WB, Yip BHK, et al. Incidence and mortality of kidney cancer:temporal patterns and global trends in 39 countries. Scientific reports, 2017; 7, 15698. doi: 10.1038/s41598-017-15922-4 [4] Chow WH, Dong LM, Devesa SS. Epidemiology and risk factors for kidney cancer. Nat Rev Urol, 2010; 7, 245-57. doi: 10.1038/nrurol.2010.46 [5] Harrison JD, Marsh JW. Effective dose from inhaled radon and its progeny. Annals of the ICRP, 2012; 41, 378-88. doi: 10.1016/j.icrp.2012.06.012 [6] Abrams H, Bingham E, Buffler P, et al. BEIR Ⅶ (Committee to Assess the Health Risks from Exposure to Low Levels of Ionizing Radiation) Health Risks from Exposure to Low Levels of Ionizing Radiation. 2006. [7] Yoon JY, Lee J-D, Joo SW, et al. Indoor radon exposure and lung cancer:a review of ecological studies. Ann Occup Environ Med, 2016; 28, 1-9. http://pubmedcentralcanada.ca/pmcc/articles/PMC4807540/ [8] Cancer IAFO. Man-made mineral fibres and radon. J Clin Pathol, 1988; 42, 16-23. http://d.old.wanfangdata.com.cn/OAPaper/oai_pubmedcentral.nih.gov_502100 [9] Henshaw DL, Eatough JP, Richardson RB. Radon as a causative factor in induction of myeloid leukaemia and other cancers. Lancet, 1990; 335, 1008-12. doi: 10.1016/0140-6736(90)91071-H [10] Vacquier B, Caer S, Rogel A, et al. Mortality risk in the French cohort of uranium miners:extended follow-up 1946-1999. Occup Environ Med, 2008; 65, 597. doi: 10.1136/oem.2007.034959 [11] Rage E. Mortality analyses in the updated French cohort of uranium miners (1946-2007). Int Arch Occup Environ Health, 2015; 88, 1-14. doi: 10.1007/s00420-014-0938-5 [12] Rage E, Caer-Lorho S, Laurier D. Low radon exposure and mortality among Jouac uranium miners:an update of the French cohort (1946-2007). J Radiol Prot, 2017. http://europepmc.org/abstract/MED/28925920 [13] Kendall GM, Smith TJ. Doses to organs and tissues from radon and its decay products. J Radiol Prot, 2002; 22, 389-406. doi: 10.1088/0952-4746/22/4/304 [14] Monchaux G, Morlier J, Morin M, et al. Carcinogenic and cocarcinogenic effects of radon and radon daughters in rats. Environ Health Perspect, 1994; 102, 64-73. doi: 10.1289/ehp.9410264 [15] Liberati A, Altman DG, Tetzlaff J, et al. The PRISMA statement for reporting systematic reviews and meta-analyses of studies that evaluate healthcare interventions:explanation and elaboration. Epidemiology Biostatistics & Public Health, 2009; 6, e1-e34. http://d.old.wanfangdata.com.cn/OAPaper/oai_pubmedcentral.nih.gov_2714672 [16] Navaranjan G, Berriault C, Minh D, et al. Cancer incidence and mortality from exposure to radon progeny among Ontario uranium miners. Occup Environ Med, 2016; 73, 838-45. http://oem.bmj.com/content/early/2016/09/20/oemed-2016-103836.abstract [17] Ruano-Ravina A, Dacosta-Urbieta A, Barros-Dios JM, et al. Radon exposure and tumors of the central nervous system. Gaceta Sanitaria, 2017. http://www.ncbi.nlm.nih.gov/pubmed/28318756 [18] Salgadoespinosa T, Barrosdios JM, Ruanoravina A. Radon exposure and oropharyngeal cancer risk. Cancer Letters, 2015; 369, 45-9. doi: 10.1016/j.canlet.2015.08.025 [19] Torres-Durán M, Barros-Dios JM, Fernández-Villar A, et al. Residential radon and lung cancer in never smokers. A systematic review. Cancer Letters, 2014; 345, 21. doi: 10.1016/j.canlet.2013.12.010 [20] Siristatidis C, Sergentanis TN, Kanavidis P, et al. Controlled ovarian hyperstimulation for IVF:impact on ovarian, endometrial and cervical cancer-a systematic review and meta-analysis. Hum Reprod Update, 2013; 19, 105. doi: 10.1093/humupd/dms051 [21] Higgins JP, Thompson SG, Deeks JJ, et al. Measuring inconsistency in meta-analyses. BMJ, 2003; 327, 557-60. doi: 10.1136/bmj.327.7414.557 [22] Egger M, Smith GD, Schneider M, et al. Bias in meta-analysis detected by a simple, graphical test. BMJ, 1997; 315, 629-34. doi: 10.1136/bmj.315.7109.629 [23] Greenland S, Longnecker MP. Methods for Trend Estimation from Summarized Dose-Response Data, with Applications to Meta-Analysis. Am J Epidemiol, 1992; 135, 1301-9. doi: 10.1093/oxfordjournals.aje.a116237 [24] Boice JD Jr, Cohen SS, Mumma MT, et al. Mortality among residents of Uravan, Colorado who lived near a uranium mill, 1936-84. J Radiol Prot, 2007; 27, 299-319. doi: 10.1088/0952-4746/27/3/004 [25] Kreuzer M, Walsh L, Schnelzer M, et al. Radon and risk of extrapulmonary cancers:results of the German uranium miners' cohort study, 1960-2003. Br J Cancer, 2008; 99, 1946-53. doi: 10.1038/sj.bjc.6604776 [26] Rage E, Caer-Lorho S, Drubay D, et al. Mortality analyses in the updated French cohort of uranium miners (1946-2007). Int Arch Occup Environ Health, 2015; 88, 717-30. doi: 10.1007/s00420-014-0998-6 [27] Vacquier B, Caer S, Rogel A, et al. Mortality risk in the French cohort of uranium miners:extended follow-up 1946-1999. Occup Environ Med, 2008; 65, 597-604. doi: 10.1136/oem.2007.034959 [28] Walsh L, Dufey F, Tschense A, et al. Radon and the risk of cancer mortality——internal Poisson models for the German uranium miners cohort. Health Phys, 2010; 99, 292-300. doi: 10.1097/HP.0b013e3181cd669d [29] Darby SC, Whitley E, Howe GR, et al. Radon and cancers other than lung cancer in underground miners:a collaborative analysis of 11 studies. J Natl Cancer Inst, 1995; 87, 378-84. doi: 10.1093/jnci/87.5.378 [30] Drubay D, Ancelet S, Acker A, et al. Kidney cancer mortality and ionizing radiation among French and German uranium miners. Radiat Environ Biophys, 2014; 53, 505-13. doi: 10.1007/s00411-014-0547-4 [31] Hess CT, Weiffenbach CV, Norton SA. Environmental radon and cancer correlations in Maine. Health Phys, 1983; 45, 339-48. doi: 10.1097/00004032-198308000-00006 [32] Kaletsch U, Kaatsch P, Meinert R, et al. Childhood cancer and residential radon exposure-results of a population-based case-control study in Lower Saxony (Germany). Radiat Environ Biophys, 1999; 38, 211-5. doi: 10.1007/s004110050158 [33] Morrison H, Semenciw R, Mao Y, et al. Cancer mortality among a group of fluorspar miners exposed to radon progeny. Am J Epidemiol, 1988; 128, 1266-75. doi: 10.1093/oxfordjournals.aje.a115080 [34] Ye W, Sobue T, Lee VS, et al. Mortality and cancer incidence in Misasa, Japan, a spa area with elevated radon levels. Jpn J Cancer Res, 1998; 89, 789-96. doi: 10.1111/cas.1998.89.issue-8 [35] Karpińska M, Wołkowicz S, Mnich Z, et al. Comparative studies of ealth hazard from radon (Rn-222) in two selected lithologic formations in the Suwałki region (in Poland). J Environ Radioact, 2002; 61, 149-58. doi: 10.1016/S0265-931X(01)00122-9 [36] Raaschou-Nielsen O, Andersen CE, Andersen HP, et al. Domestic radon and childhood cancer in Denmark. Epidemiology, 2008; 19, 536-43. http://www.wanfangdata.com.cn/details/detail.do?_type=perio&id=ce8c16c205549930f99cffe58c2bb945 [37] Kulich M, Rericha V, Rericha R, et al. Incidence of non-lung solid cancers in Czech uranium miners:A case-cohort study. Environ Res, 2011; 111, 400-5. doi: 10.1016/j.envres.2011.01.008 [38] Boice JD Jr, Cohen SS, Mumma MT, et al. A cohort study of uranium millers and miners of Grants, New Mexico, 1979-2005. J Radiol Prot, 2008; 28, 303-25. doi: 10.1088/0952-4746/28/3/002 [39] Schubauer-Berigan MK, Daniels RD, Pinkerton LE. Radon Exposure and Mortality Among White and American Indian Uranium Miners:An Update of the Colorado Plateau Cohort. Am J Epidemiol, 2009; 169, 718-30. doi: 10.1093/aje/kwn406 [40] Tirmarche M, Raphalen A, Allin F, et al. Mortality of a cohort of French uranium miners exposed to relatively low radon concentrations. Br J Cancer, 1993; 67, 1090-7. doi: 10.1038/bjc.1993.200 [41] Darby SC, Radford EP, Whitley E. Radon exposure and cancers other than lung cancer in Swedish iron miners. Environ Health Perspect, 1995; 103, 45-7. http://d.old.wanfangdata.com.cn/OAPaper/oai_pubmedcentral.nih.gov_1518838 [42] Kreuzer M, Grosche B, Schnelzer M, et al. Radon and risk of death from cancer and cardiovascular diseases in the German uranium miners cohort study:follow-up 1946-2003. Radiat Environ Biophys, 2010; 49, 177-85. doi: 10.1007/s00411-009-0249-5 [43] Turner MC, Krewski D, Chen Y, et al. Radon and nonrespiratory mortality in the American Cancer Society cohort. Am J Epidemiol, 2012; 176, 808-14. doi: 10.1093/aje/kws198 [44] Collman GW, Loomis DP, Sandler DP. Childhood cancer mortality and radon concentration in drinking water in North Carolina. Br J Cancer, 1991; 63, 626. doi: 10.1038/bjc.1991.143 [45] Tomásek L, Darby SC, Swerdlow AJ, et al. Radon exposure and cancers other than lung cancer among uranium miners in West Bohemia. Lancet, 1993; 341, 919. doi: 10.1016/0140-6736(93)91212-5 [46] Lubin JH, Boice JD, Edling C, et al. Lung Cancer in Radon-Exposed Miners and Estimation of Risk From Indoor Exposure. J Natl Cancer Inst, 1995; 87, 817. doi: 10.1093/jnci/87.11.817 [47] Flr W, Lloyd OL. Research Methods in Occupational Epidemiology. J Epidemiol Community Health, 1990; 44, 77. http://d.old.wanfangdata.com.cn/OAPaper/oai_pubmedcentral.nih.gov_2465767 [48] Zhang ZL, Sun J, Dong JY, et al. Residential radon and lung cancer risk:an updated meta-analysis of case-control studies. Asian Pac J Cancer Prev, 2012; 13, 2459-65. doi: 10.7314/APJCP.2012.13.6.2459 -


 下载:
下载:



 Quick Links