

 下载:
下载:

-
Hepatic encephalopathy (HE) is a common complication of both acute and chronic liver diseases, characterized by neurological and psychiatric symptoms1. Approximately 30%–45% of patients with liver cirrhosis develop significant HE2. The condition manifests with varying degrees of cognitive impairment, including deficits in psychomotor speed, working memory, and more severe neuropsychiatric symptoms. Hepatic coma, the most severe form of HE, is defined by complete unconsciousness and unresponsiveness to the external environment3. HE is associated with reduced survival in patients with liver cirrhosis4, and hepatic coma further elevates mortality risk5. Timely prognostic assessment is crucial for improving outcomes in these patients.
Critically ill patients often experience both hypochloremia and hyperchloremia due to underlying conditions or treatments6. Chloride has recently gained attention as a prognostic marker in critically ill patients, with studies demonstrating that hyperchloremia is associated with acute kidney injury (AKI) and in-hospital mortality in severe sepsis7,8. Javier et al. found that in critically ill septic patients with hyperchloremia (chloride ≥ 110 mmol/L) at intensive care unit (ICU) admission, worsening hyperchloremia within 72 hours correlated with increased hospital mortality. Similarly, Bandarn et al. reported that hyperchloremia frequently occurs in severe sepsis and septic shock and is independently associated with AKI. Even patients without initial hyperchloremia may develop AKI with a moderate increase in serum chloride (Δ chloride ≥ 5 mmol/L). Hypochloremia has also been identified as an independent prognostic factor in conditions such as hypertension9, pulmonary arterial hypertension10, AKI11, and chronic heart failure12,13. It can serve as a predictive factor for mortality in the these diseases.
However, the impact of serum chloride levels on the prognosis of patients with severe hepatic coma remains unclear. This study aims to investigate the association between serum chloride levels and 28-day and 1-year all-cause mortality in patients with hepatic coma. Additionally, we explore potential interventions that could improve outcomes and reduce the healthcare burden associated with severe hepatic coma.
-
This retrospective observational study utilized data from the Medical Information Mart for Intensive Care IV (MIMIC-IV, v2.2). MIMIC-IV is a large, publicly available single-center database that includes over 40,000 patients admitted to the Beth Israel Deaconess Medical Center's (BIDMC) intensive care units from 2008 to 201914. Although the MIMIC-IV database is no longer identifiable, it contains comprehensive records, including demographic information, physiological readings from bedside monitors, laboratory results, diagnoses, treatment information, and other clinical data collected during routine medical care. The use of this database has been approved by the Institutional Review Board of the Massachusetts Institute of Technology, located in Cambridge, Massachusetts, USA. One author of this study has completed the "Protecting Human Research Participants" course and obtained database access certification (Certificate Number: 47937607). Additionally, patients with hepatic coma who presented to the emergency department of Beijing Chaoyang Hospital between March 2022 and September 2024 were included for external validation.
-
After comprehensive screening, we included all patients with hepatic coma in our analysis. For patients with multiple admissions, only data from their first ICU admission were analyzed. The inclusion criteria were as follows: (1) Patients diagnosed with hepatic coma based on diagnostic codes, including ICD-9 codes (700, 7020, 7021, 7022, 7023, 7041, 7042, 7043, 7044, 7049, 706, 7071, 709, 5722) and ICD-10 codes (B150, B160, B162, B1711, B190, B1911, B1921, K7041, K7111, K7201, K7211, K7291); (2) Age over 16 years. Exclusion criteria included: (1) Patients with an ICU stay of less than 24 hours; (2) Patients with missing serum chloride measurements.
-
In this study, we collected comprehensive patient data, including baseline characteristics such as age and gender, vital signs including body temperature, heart rate, respiratory rate (RR), diastolic blood pressure (DBP), systolic blood pressure (SBP), mean arterial pressure (MAP), and peripheral oxygen saturation (SpO2). Comorbidities such as atrial fibrillation (AF), heart failure (HF), respiratory failure (RF), chronic kidney disease (CKD), AKI, and sepsis were also noted. Laboratory tests included albumin, alanine aminotransferase (ALT), aspartate aminotransferase (AST), blood urea nitrogen (BUN), calcium, chloride, creatinine, glucose, hematocrit, hemoglobin, international normalized ratio (INR), lactate, platelet count, potassium, prothrombin time (PT), partial thromboplastin time (PTT), lactate dehydrogenase (LDH), sodium, total bilirubin (Tbil), white blood cell count (WBC), and magnesium. Life support therapies, including continuous renal replacement therapy (CRRT) and invasive mechanical ventilation (IMV), were also recorded, along with the sequential organ failure assessment (SOFA) score. For variables with repeated measurements, only the initial values were included in the analysis.
-
The primary outcome analyzed in this study was 28-day all-cause mortality, while the secondary outcome was 1-year all-cause mortality.
-
Continuous variables were expressed as mean ± standard deviation for normally distributed data or median (interquartile range) for non-normal distributed data. Categorical variables were presented as counts and percentages. Between-group comparisons were made using Student's t-tests for normally continuous variables, Mann-Whitney U tests for non-normally continuous variables, and χ² tests for categorical variables.
We employed restricted cubic spline (RCS) Cox regression models to explore potential linear or nonlinear associations between serum chloride levels and 28-day/1-year all-cause mortality. The cohort was then stratified into subgroups based on RCS-derived optimal cut-points. Kaplan-Meier (KM) curves with log-rank tests were generated to compare survival probabilities across chloride level subgroups. Univariate and multivariate Cox proportional hazard models were employed to assess associations, with results reported as hazard ratios (HRs) and 95% confidence intervals (CIs). Model 1 represented the unadjusted univariate Cox regression analysis. Model 2 accounted for adjustments based on age and sex, while Model 3 included additional adjustments for age, sex, comorbidities, and the SOFA score.
We performed additional analyses to verify the robustness of our findings. First, we examined potential interactions between serum chloride levels and key stratification variables. Second, we conducted subgroup analyses to determine whether the association between serum chloride and 28-day mortality persisted after accounting for potential confounders. Finally, we validated the primary outcome (28-day all-cause mortality) using data from Beijing Chaoyang Hospital, reproducing both the Kaplan-Meier survival analyses and Cox regression models.
P value of <0.05 was considered statistically significant. All statistical analyses were performed using R software version 4.3.1.
-
To investigate the mechanism by which chloride ions influence hepatic encephalopathy, we extracted primary neurons from 6- to 8-week-old C57BL/6J miceand cultured them in media containing different concentrations of chloride ions. Neuronal viability was assessed, and the expression of inflammatory cytokines as well as the phosphorylation level of the NF-κB signaling pathway were measured using PCR and Western blot (WB). The detailed procedures are as follows:
C57BL/6J mice aged 6–8 weeks, 18-20g (purchased from Beijing Vital River Laboratory Animal Technology Co., Ltd.) were selected, and brain tissue was aseptically collected. After dissecting the cerebral cortex, the tissue was incubated with 0.25% trypsin (25200072, Gibco) at 37°C for 15 minutes. The digestion was terminated and neutralized with DMEM (PM150220A, Procell system) containing 10% fetal bovine serum (FBS) (10099141C, Gibco), followed by filtration through a cell strainer. After counting the cells, they were seeded into six-well plates pre-coated with poly-D-lysine (PDL) (E607014-0002, Sangon Biotech) and cultured in Neurobasal medium (PM151223, Procell system) supplemented with B27 and L-glutamine. Once the cells adhered and reached stable growth (Day 3), the medium was replaced with media containing different chloride ion concentrations:
Control group: standard Neurobasal medium(PM151223; Procell system); Low-chloride group 1: chloride concentration reduced by 10% compared to standard Neurobasal medium; Low-chloride group 2: chloride concentration reduced by 20% . Both low-chloride medium were custom-formulated by the company (PM151223; Procell system).
After 48 hours of incubation, neuronal viability was assessed using the CCK-8 (ab228554, Abcam) assay. Ten microliters of CCK-8 reagent were added to each well and incubated for 2 hours, after which absorbance was measured at 450 nm.
After 12 hours of incubation, total RNA was extracted from the cells, and cDNA was synthesized using a reverse transcription kit (ANG0818A, TAKARA). Real-time quantitative PCR using SYBR Green (11199ESO8, YEASEN) was performed to measure the mRNA expression levels of TNF-α (Fwd: 5’- AGTGGTGCCAGCCGATGGGTTGT -3’; Rev: 5’- GCTGAGTTGGTCCCCCTTCTCCAG -3’) , IL-1β (Fwd: 5’- GCCACCTTTTGACAGTGATG -3’; Rev: 5’- GCTCTTGTTGATGTGCTGCT -3’), and IL-6 (Fwd: 5’- CCCCAATTTCCAATGCTCTCC -3’; Rev: 5’- GGATGGTCTTGGTCCTTAGCC -3’). GAPDH (Fwd: 5’- CCCAGCTTAGGTTCATCAGG -3’; Rev: 5’- CCAAATCCGTTCACACCGAC -3’) served as the internal control, and relative expression levels were calculated using the 2^-ΔΔCt method. For protein analysis, total cellular protein was extracted, separated by SDS-PAGE, and transferred to membranes. The membranes were incubated with antibodies against NF-κB p65 (1:1000, ab32536, Abcam), phosphorylated p65 (p-p65) (1:1000, ab76302, Abcam), and GAPDH (1:1000, 60004-1-Ig, Proteintech). Protein expression was detected using an ECL chemiluminescence system, and grayscale intensity was analyzed with ImageJ software.
Statistical analyses were performed using GraphPad Prism 9. Comparisons between groups were conducted using t-tests, one-way ANOVA, and Tukey’s multiple comparisons test. A p-value of <0.05 was considered statistically significant.
-
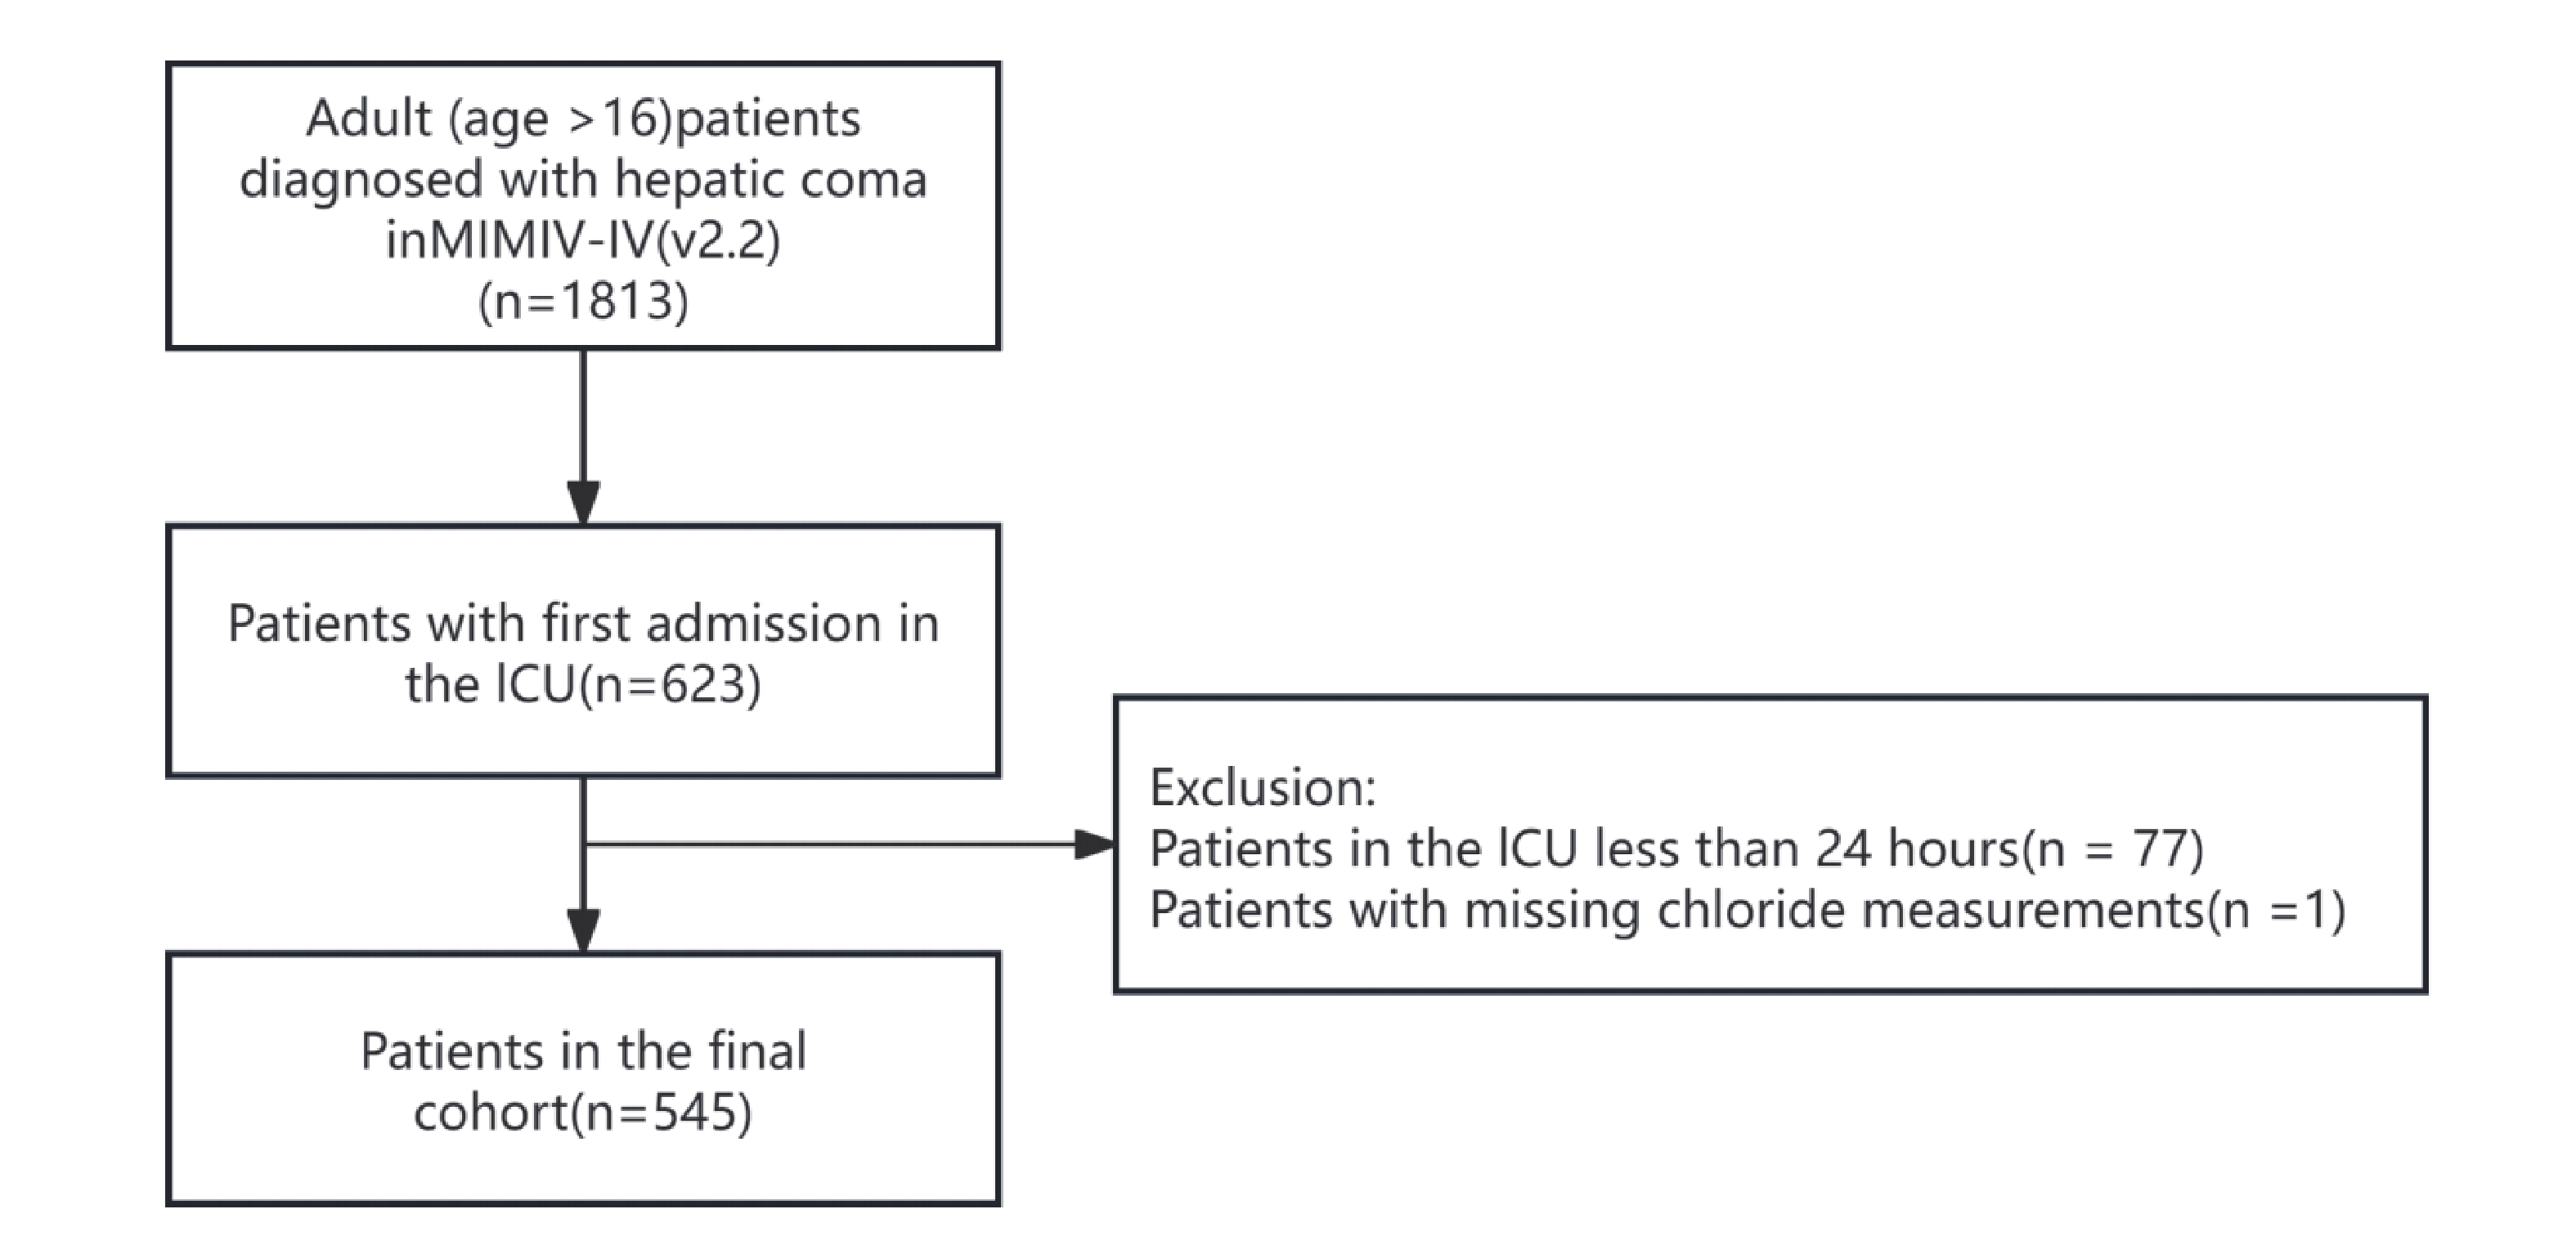
Figure 1 illustrates the participant enrollment process, showing that 545 patients diagnosed with hepatic coma were included. Among them, 333 were male and 212 were female. At the 28-day follow-up, 356 patients (65.32%) survived, while 189 (34.68%) died. At the 1-year follow-up, 245 patients (44.95%) survived, and 300 (55.05%) died. Table 1 and Table 2 display the clinical characteristics of survivors and non-survivors during the 28-day and 1-year follow-up, respectively. In both follow-up periods, the non-survivor group exhibited lower serum chloride concentrations and higher levels of BUN, creatinine, lactate, Tbil, and INR compared to the survivor group. A higher proportion of patients in the non-survivor group received CRRT and IMV, although the difference in IMV was not statistically significant (P > 0.05). Comorbidity analysis indicated significantly higher prevalence of AKI, respiratory failure, and sepsis among non-survivors at both follow-up intervals (all P > 0.05).
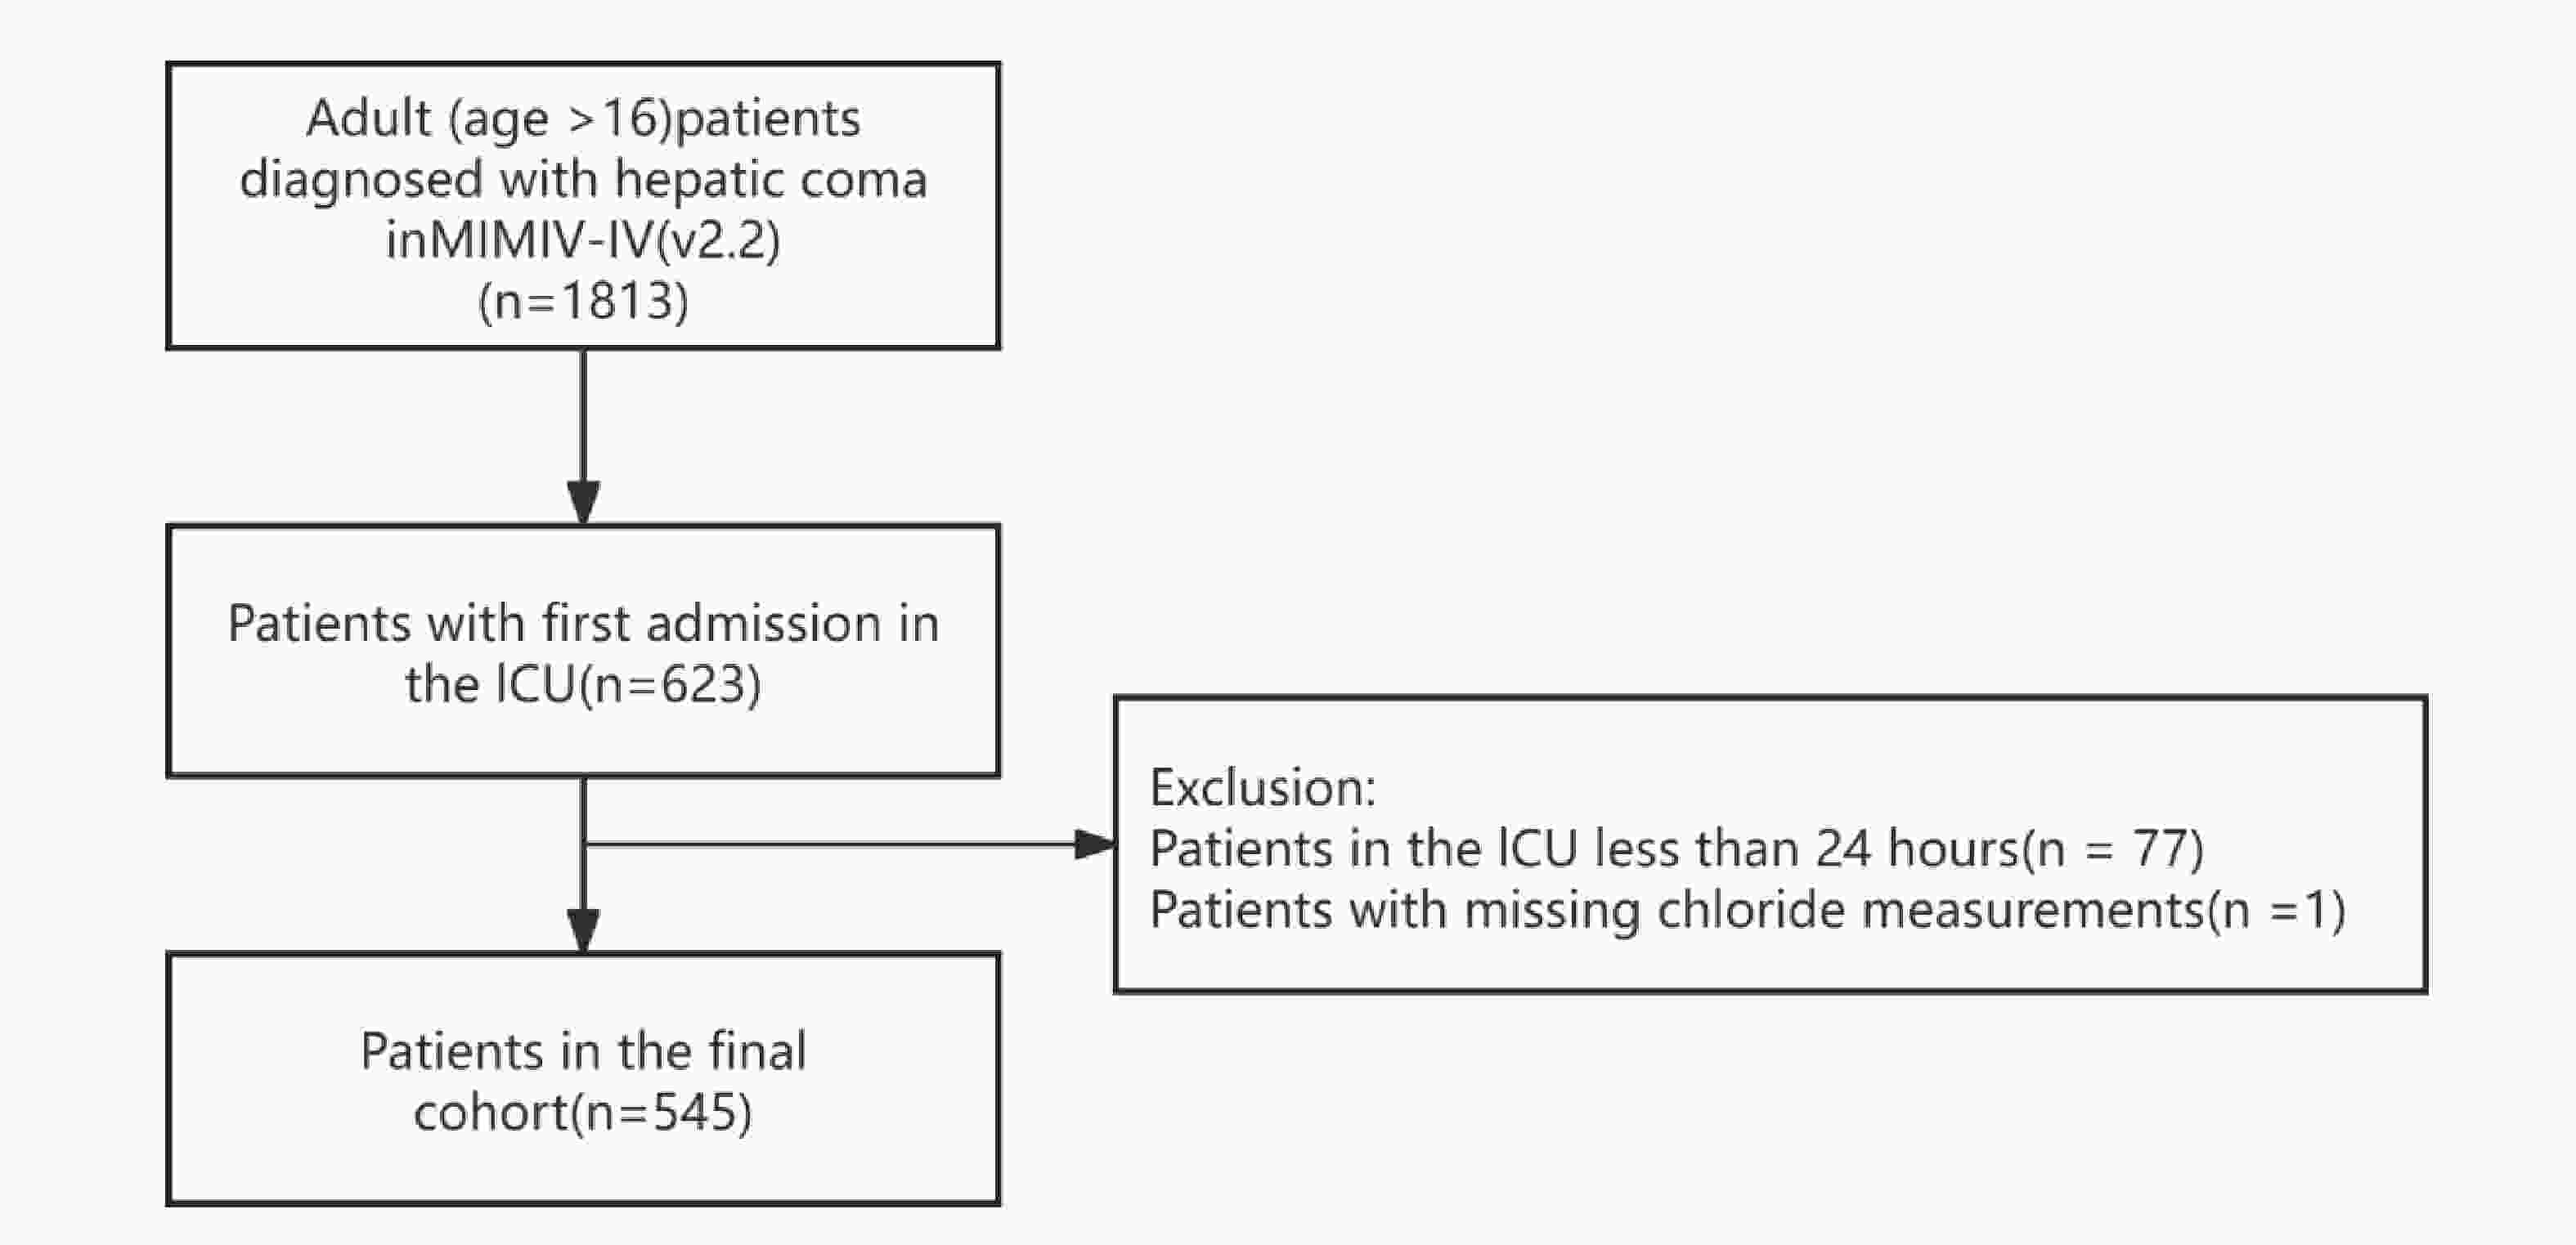
Figure 1. Patient Selection Process
Table 1. Comparisons of the Baseline Characteristics at 28-day Follow-up.
Variables Survivors Non-survivors P value N 356 189 Age, years 57.11 (12.80) 59.33 (14.52) 0.067 Albumin,g/dL 3.08 (0.73) 2.95 (0.72) 0.063 ALT * 34.00 [22.00, 101.00] 51.00 [31.00, 240.00] 0.001 AST * 72.00 [43.00, 191.00] 128.00 [64.50, 392.50] <0.001 BUN *, mg/dL 27.00 [15.00, 47.75] 37.00 [20.75, 57.00] <0.001 Calcium, mmol/L 8.29 (1.20) 8.22 (1.05) 0.520 Chloride, mmol/L 104.16 (7.20) 101.05 (9.33) <0.001 Creatinine *, mg/dL 1.20 [0.70, 2.10] 1.70 [1.00, 2.60] 0.001 DBP 66.93 (18.17) 65.95 (18.93) 0.556 Glucose *, mg/dL 122.00 [100.00, 158.00] 116.00 [91.50, 151.00] 0.065 Hematocrit (%) 29.09 (5.96) 29.80 (6.93) 0.213 Hemoglobin,g/dL 9.71 (2.04) 9.87 (2.24) 0.403 HR 92.45 (19.54) 95.64 (22.36) 0.085 INR * 1.70 [1.40, 2.20] 2.10 [1.70, 2.80] <0.001 Lactate *, mmol/L 2.30 [1.50, 3.60] 2.90 [2.00, 4.85] <0.001 Platelet *, K/μl 112.00 [64.50, 165.00] 104.00 [66.00, 183.00] 0.909 Potassium, mmol/L 4.15 (0.82) 4.32 (0.90) 0.027 PT * 18.70 [15.80, 23.42] 22.20 [18.40, 29.50] <0.001 PTT * 38.90 [32.82, 48.18] 45.50 [36.35, 57.55] <0.001 RR * 19.00 [16.00, 23.00] 20.00 [16.00, 23.00] 0.130 SBP 120.19 (23.02) 118.29 (23.28) 0.362 LDH * , U/L 280.50 [208.50, 458.75] 388.50 [246.75, 733.75] <0.001 Sodium, mmol/L 137.10 (6.09) 135.93 (8.22) 0.061 SpO2 97.32 (3.52) 96.59 (3.35) 0.019 Tbil *, umol/L 3.90 [1.70, 9.05] 5.90 [2.30, 16.90] 0.001 WBC *, K/μl 8.80 [5.70, 13.00] 11.40 [7.30, 17.50] <0.001 MAP * 78.00 [69.00, 90.50] 75.50 [65.00, 88.00] 0.116 Temperature,°C 36.72 (0.78) 36.53 (0.95) 0.016 SOFA * 8.00 [6.00, 10.25] 10.00 [8.00, 13.00] <0.001 Magnesium, mmol/L 2.01 (0.47) 2.14 (0.48) 0.002 Gender (%) 0.042 Female 150 (42.1) 62 (32.8) Male 206 (57.9) 127 (67.2) CRRT (%) 44 (12.4) 36 (19.0) 0.049 IMV (%) 216 (60.7) 126 (66.7) 0.199 AF (%) 62 (17.4) 35 (18.5) 0.839 AKI (%) 199 (55.9) 149 (78.8) <0.001 CKD (%) 55 (15.4) 23 (12.2) 0.362 HF (%) 50 (14.0) 27 (14.3) >0.999 RF (%) 128 (36.0) 104 (55.0) <0.001 Sepsis (%) 78 (21.9) 85 (45.0) <0.001 Note. * Mann–Whitney U test ALT, alanine aminotransferase; AST, aspartate aminotransferase; BUN, blood urea nitrogen; DBP, diastolic blood pressure; HR, heart rate; INR, international normalized ratio; PT, prothrombin time; PTT, partial thromboplastin time; RR, respiratory rate; SBP, systolic blood pressure; LDH, lactate dehydrogenase; SpO2, peripheral oxygen saturation; Tbil, total bilirubin; WBC, white blood cell; MAP, mean blood pressure; SOFA, sequential organ failure assessment; CRRT, continuous renal replacement therapy; IMV, invasive mechanical ventilation; AF, atrial fibrillation; AKI, acute kidney injury; CKD, chronic kidney disease; HF, heart failure; RF, respiratory failure. Table 2. Comparisons of the Baseline Characteristics at 1-year Follow-up.
Variables Survivors Non-survivors P value N 245 300 Age, years 55.34 (12.48) 59.95 (13.87) <0.001 Albumin, g/dL 3.04 (0.65) 3.02 (0.79) 0.735 ALT * 39.00 [23.00, 146.00] 42.00 [24.00, 105.00] 0.842 AST * 79.00 [45.00, 299.00] 94.00 [50.00, 235.00] 0.470 BUN *, mg/dL 24.50 [14.00, 47.00] 35.00 [19.25, 53.00] <0.001 Calcium, mmol/L 8.18 (1.25) 8.34 (1.06) 0.112 Chloride, mmol/L 104.30 (7.20) 102.09 (8.70) 0.002 Creatinine *, mg/dL 1.10 [0.70, 2.00] 1.60 [1.00, 2.50] <0.001 DBP 67.56 (18.57) 65.79 (18.30) 0.266 Glucose *, mg/dL 123.50 [100.00, 162.00] 118.00 [94.00, 150.00] 0.125 Hematocrit (%) 29.55 (6.01) 29.17 (6.56) 0.489 Hemoglobin,g/dL 9.89 (2.07) 9.67 (2.14) 0.224 HR 92.66 (19.19) 94.29 (21.68) 0.358 INR * 1.70 [1.40, 2.30] 1.90 [1.60, 2.50] 0.009 Lactate *, mmol/L 2.30 [1.50, 3.70] 2.70 [1.90, 4.50] 0.003 Platelet *, K/μl 118.50 [65.00, 173.00] 102.00 [64.75, 166.50] 0.239 Potassium, mmol/L 4.15 (0.86) 4.25 (0.85) 0.152 PT * 18.70 [16.15, 24.45] 20.65 [17.28, 26.60] 0.012 PTT * 38.40 [32.60, 48.80] 43.80 [35.32, 54.45] 0.001 RR * 19.00 [16.00, 23.00] 19.00 [16.00, 23.00] 0.459 SBP 119.91 (21.93) 119.23 (24.07) 0.735 LDH * , U/L 285.50 [213.25, 529.00] 347.00 [230.25, 540.75] 0.276 Sodium, mmol/L 137.16 (6.04) 136.31 (7.55) 0.152 SpO2 97.40 (3.29) 96.79 (3.60) 0.041 Tbil *, umol/L 3.50 [1.70, 8.00] 5.20 [2.20, 13.20] <0.001 WBC *, K/μl 9.25 [6.10, 13.20] 9.90 [6.40, 15.53] 0.089 MAP * 78.00 [69.00, 92.00] 76.00 [66.00, 88.00] 0.083 Temperature,°C 36.77 (0.81) 36.56 (0.86) 0.006 SOFA * 8.00 [6.00, 11.00] 9.00 [7.00, 12.00] <0.001 Magnesium, mmol/L 2.02 (0.49) 2.09 (0.46) 0.083 Gender (%) 0.204 Female 103 (42.0) 109 (36.3) Male 142 (58.0) 191 (63.7) CRRT (%) 27 (11.0) 53 (17.7) 0.039 IMV (%) 158 (64.5) 184 (61.3) 0.503 AF (%) 38 (15.5) 59 (19.7) 0.250 AKI (%) 126 (51.4) 222 (74.0) <0.001 CKD (%) 28 (11.4) 50 (16.7) 0.107 HF (%) 32 (13.1) 45 (15.0) 0.601 RF (%) 91 (37.1) 141 (47.0) 0.026 Sepsis (%) 43 (17.6) 120 (40.0) <0.001 Note. ALT, alanine aminotransferase; AST, aspartate aminotransferase; BUN, blood urea nitrogen; DBP, diastolic blood pressure; HR, heart rate; INR, international normalized ratio; PT, prothrombin time; PTT, partial thromboplastin time; RR, respiratory rate; SBP, systolic blood pressure; LDH, lactate dehydrogenase; SpO2, peripheral oxygen saturation; Tbil, total bilirubin; WBC, white blood cell; MAP, mean blood pressure; SOFA, sequential organ failure assessment; CRRT, continuous renal replacement therapy; IMV, invasive mechanical ventilation; AF, atrial fibrillation; AKI, acute kidney injury; CKD, chronic kidney disease; HF, heart failure; RF, respiratory failure. -
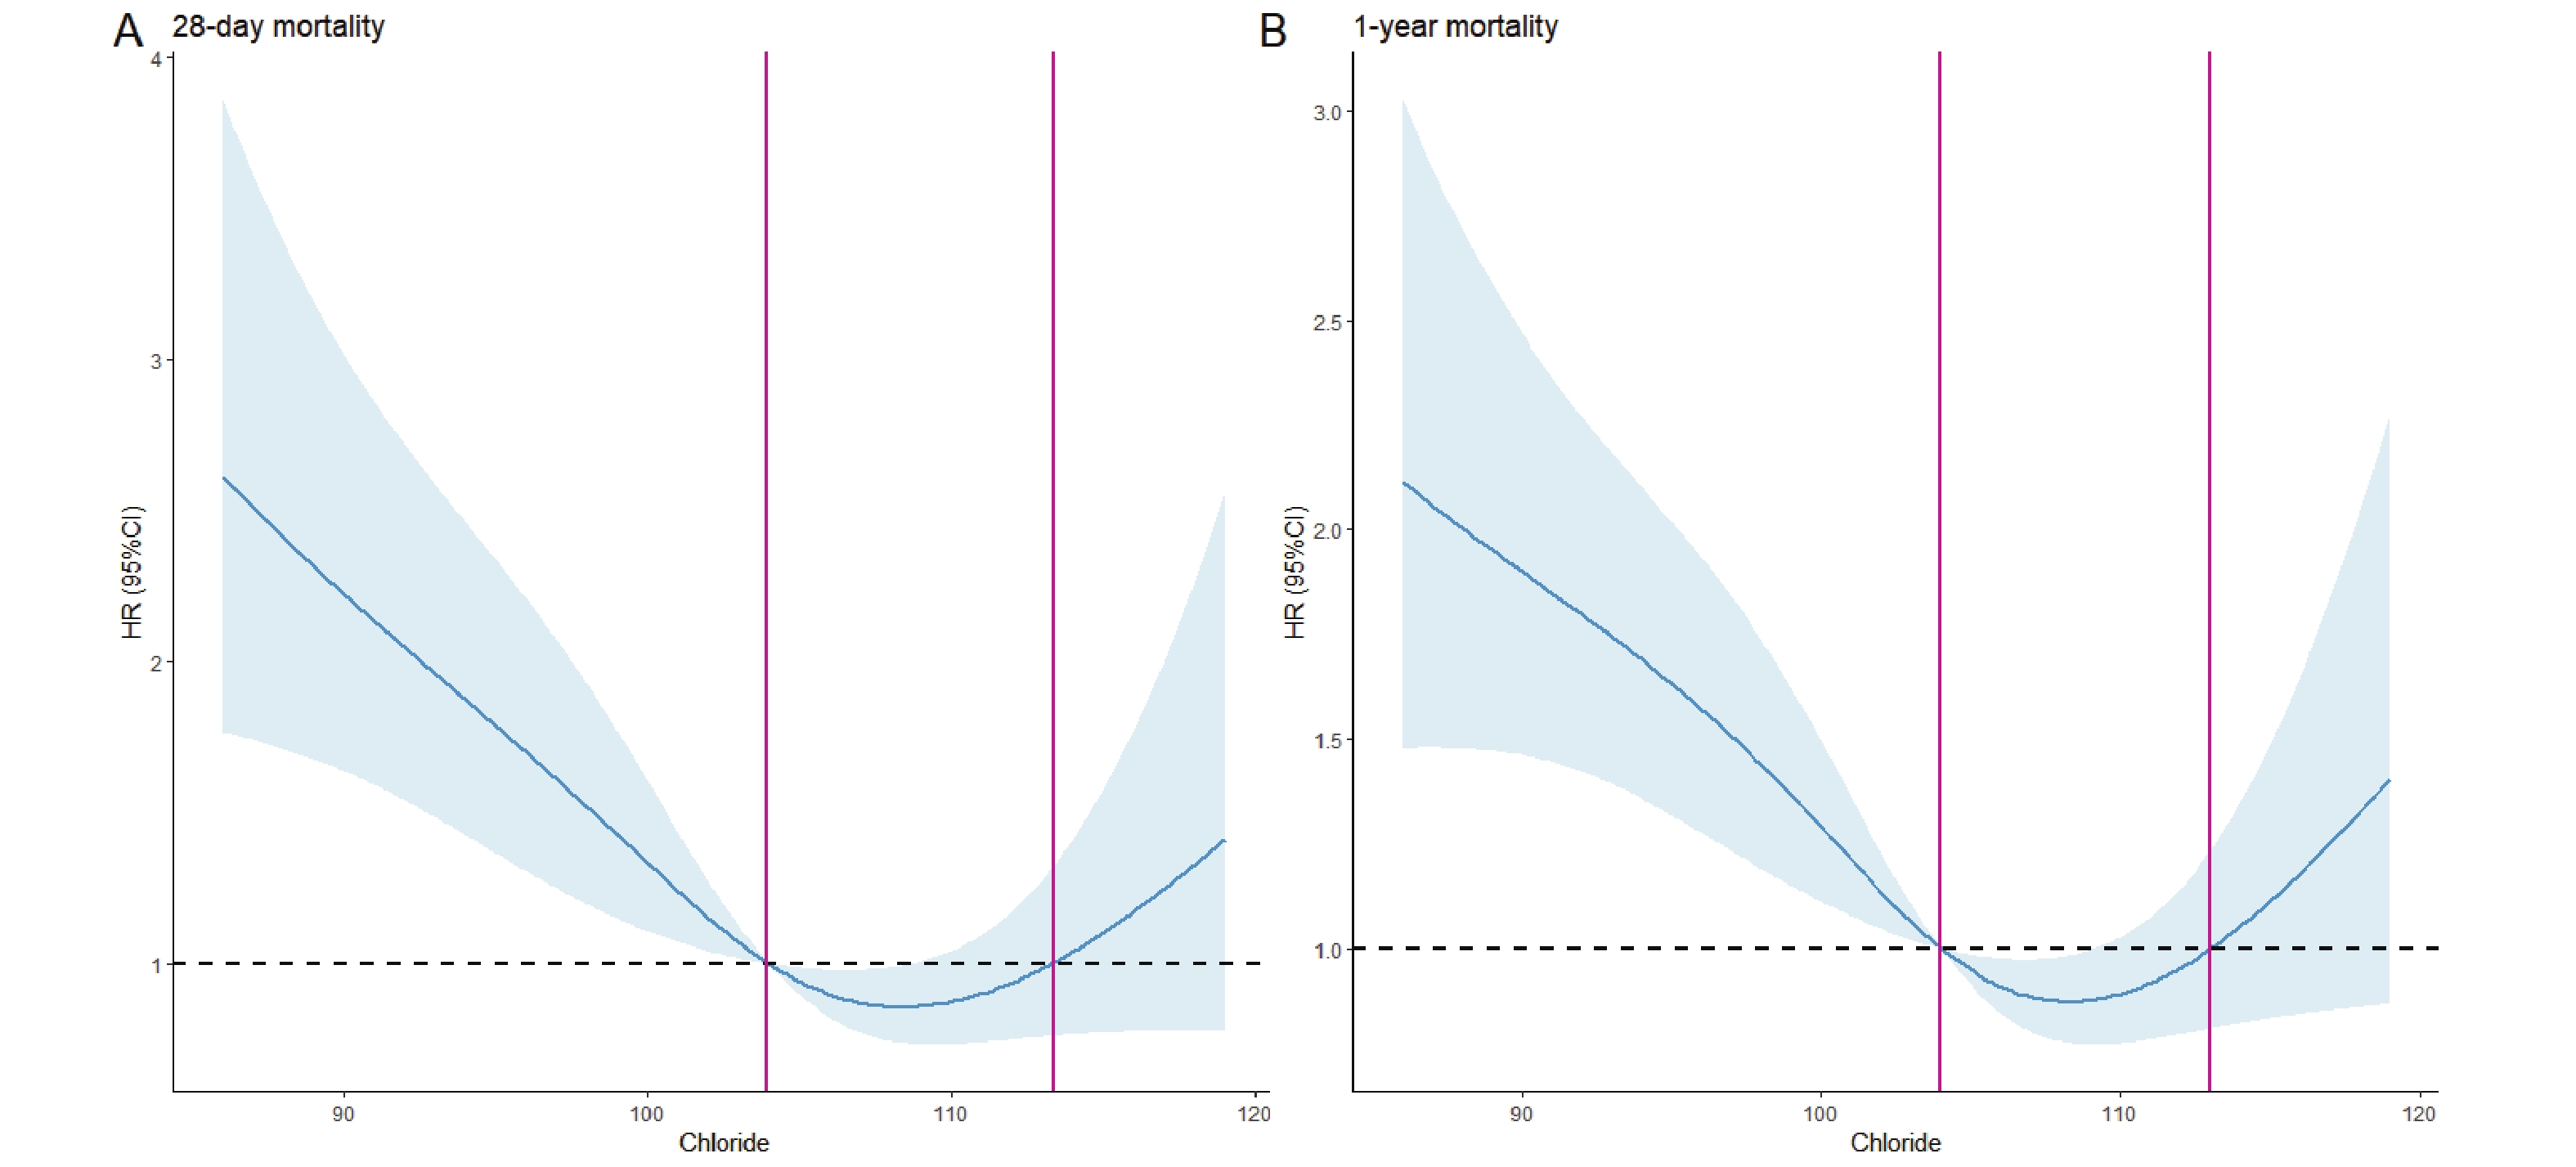
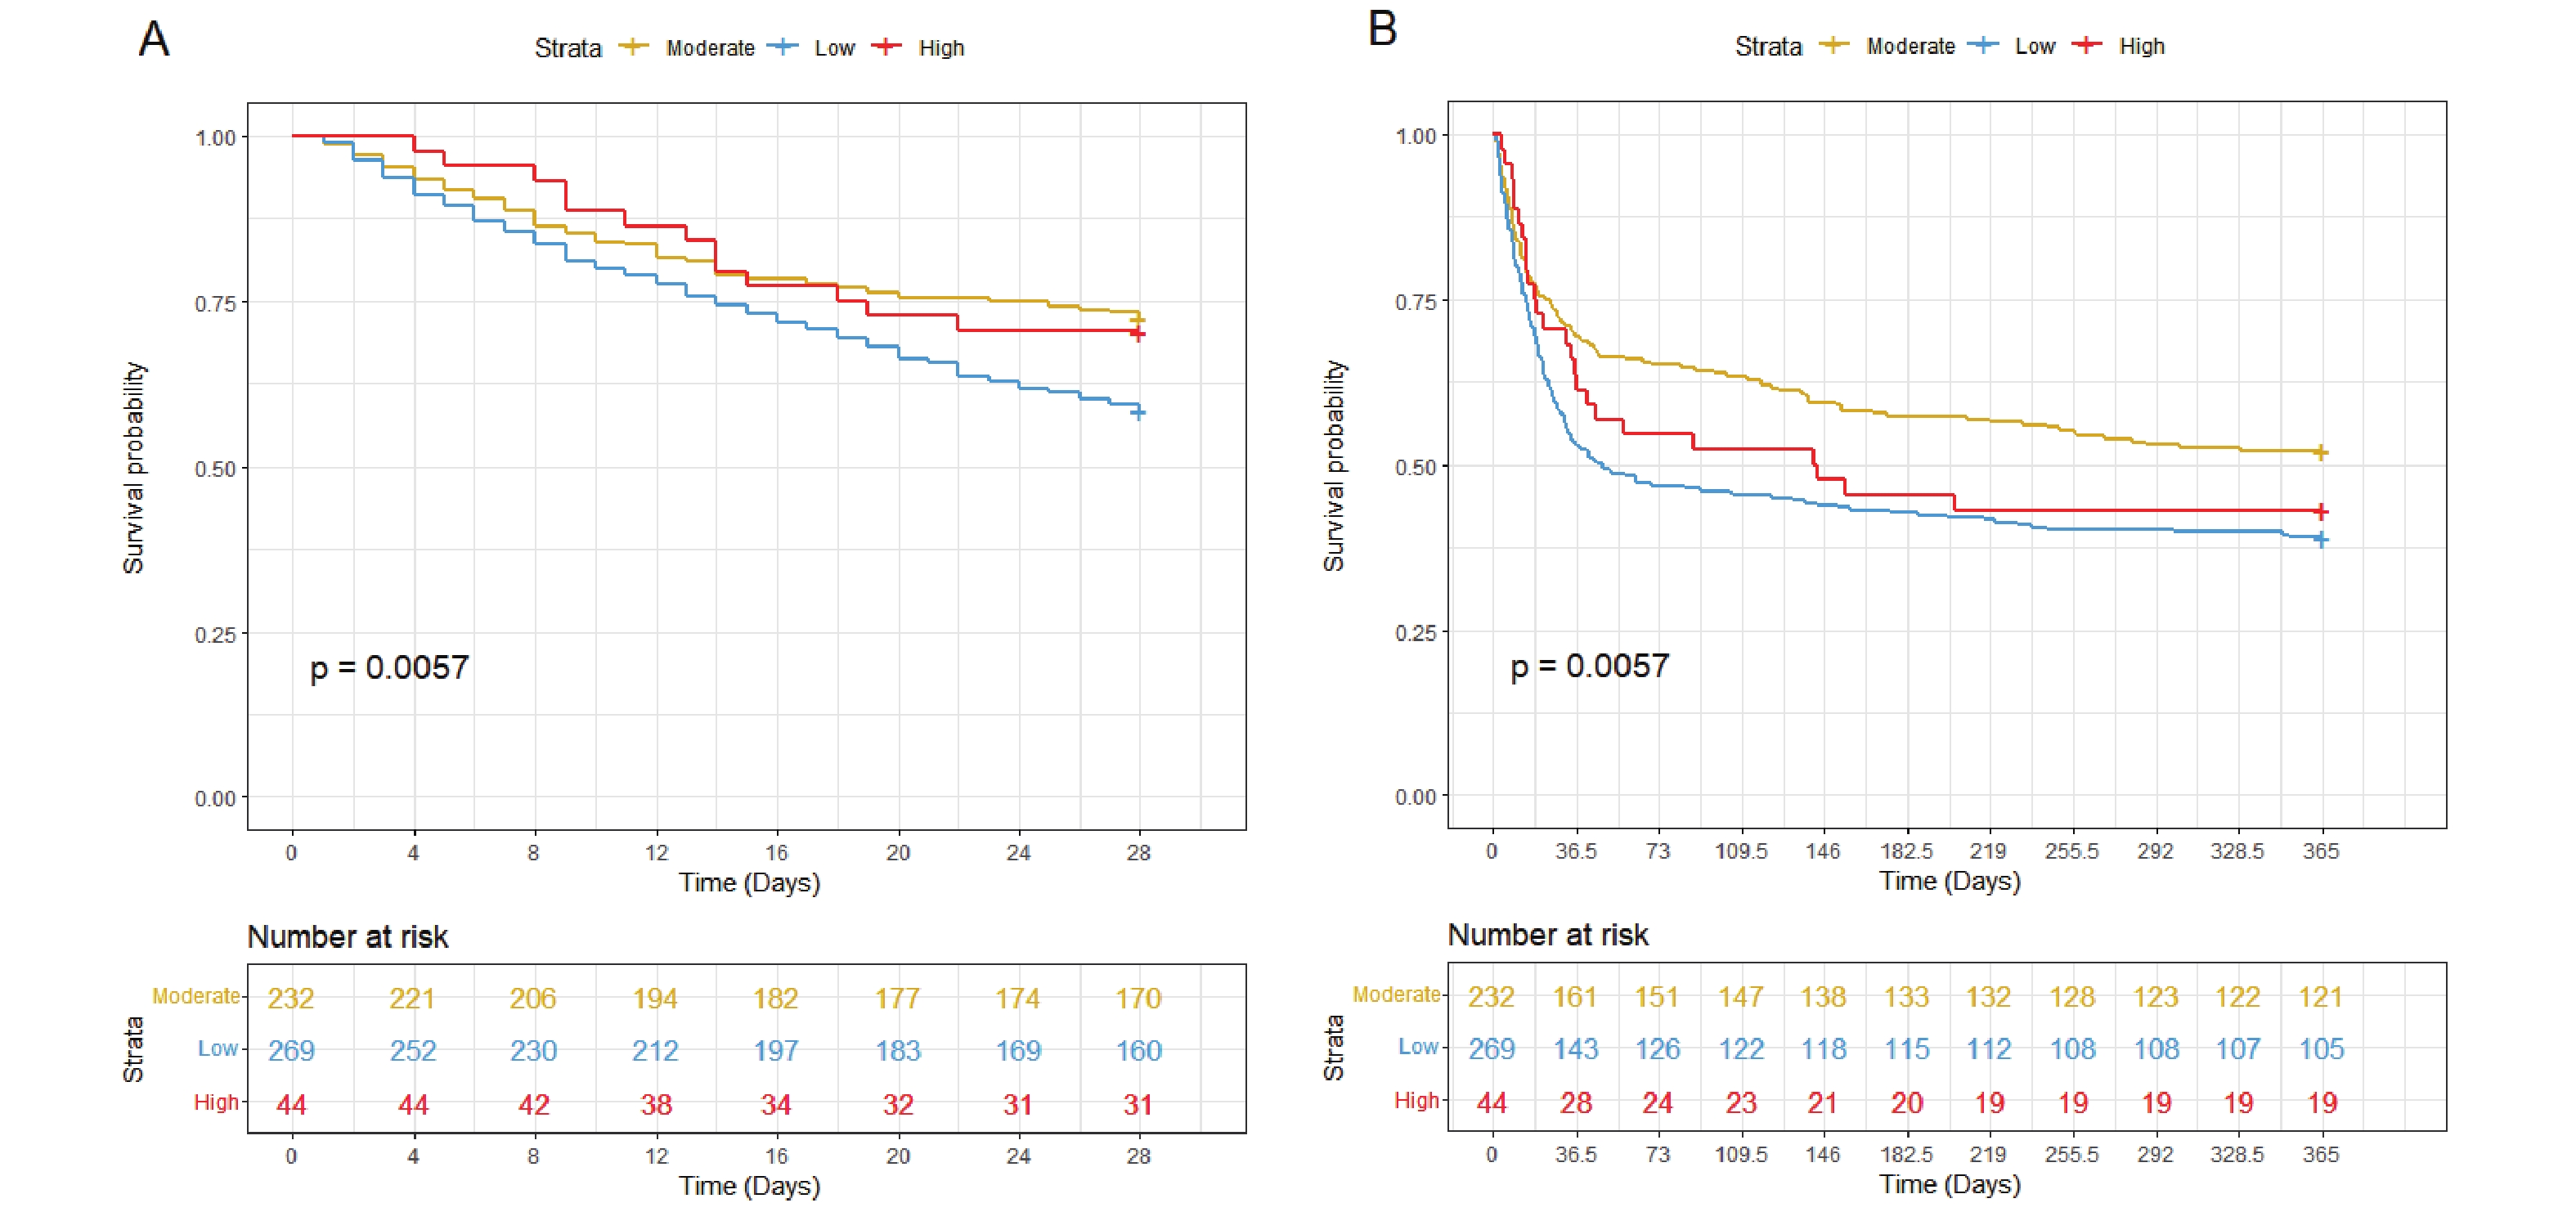
The RCS analysis revealed a significant U-shaped association between serum chloride levels and mortality, with inflection points at 103 and 113 mmol/L (Figure 2). Based on these thresholds, patients were stratified into three groups: low chloride (<103 mmol/L, n=269), moderate chloride (103-113 mmol/L, n=232), and high chloride (>113 mmol/L, n=44). Both low and high chloride groups showed elevated mortality risks (HR > 1), with KM curves confirming significantly worse 28-day and 1-year survival compared to the moderate group (P < 0.05; Figure 3A-B).
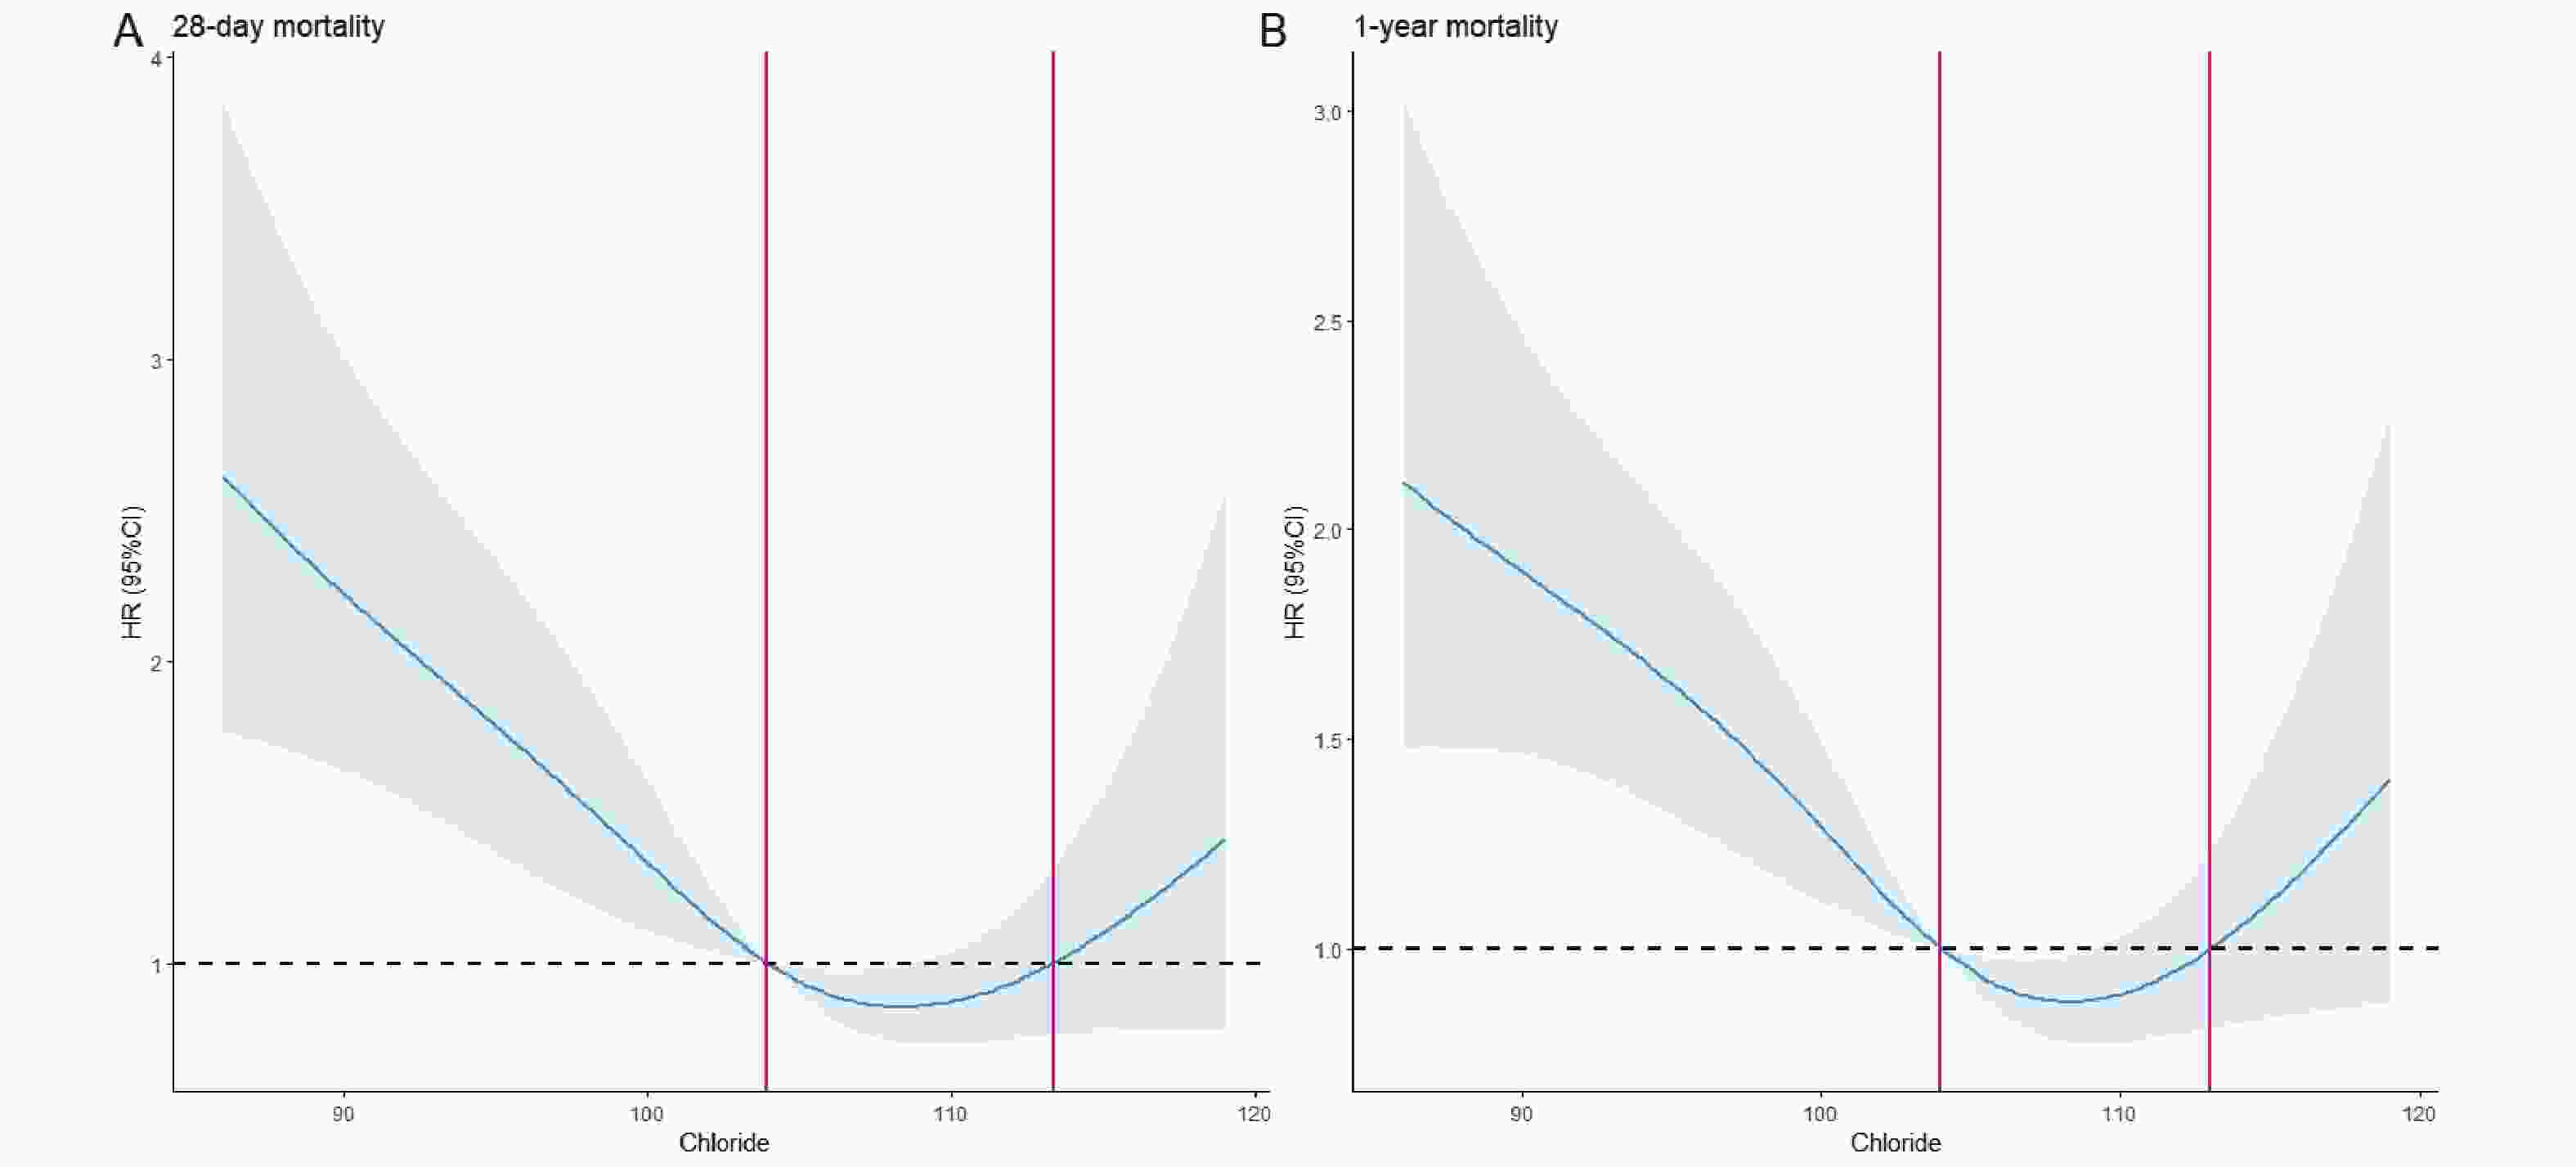
Figure 2. Association between Chloride and HR of 28-day (A) and 1-year (B) All-cause Mortality.
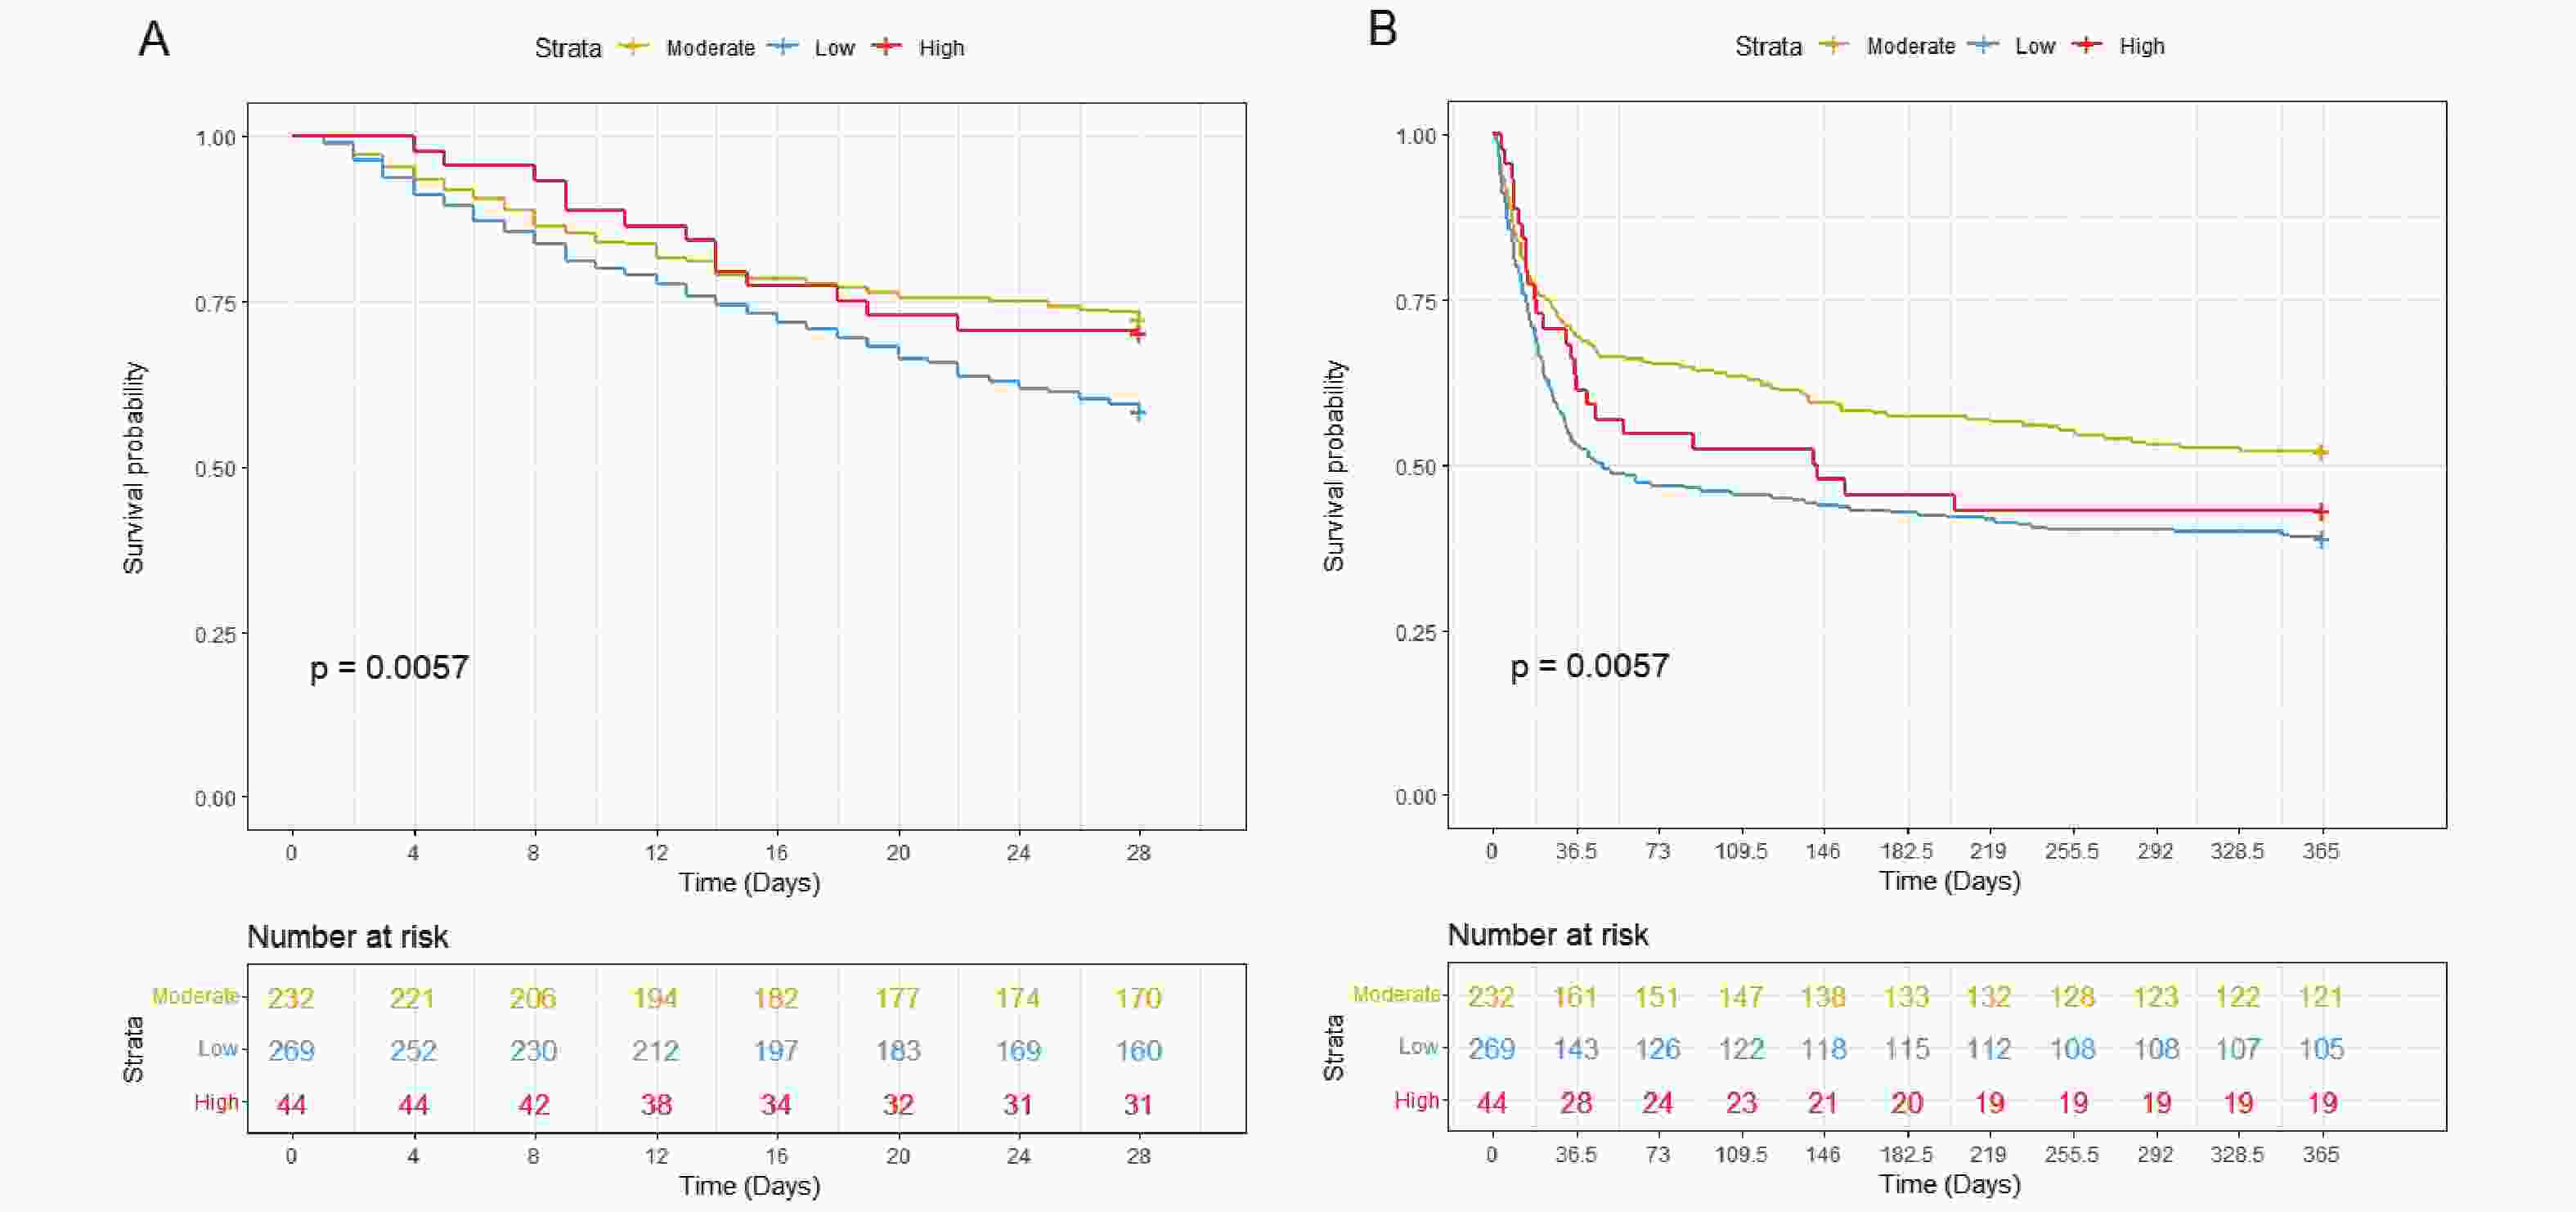
Figure 3. KM Survival Curves of Hepatic Coma Patients with Moderate (yellow, chloride 103-103mmol/L ), High (red, chloride>113mmol/L ) and Low (blue, chloride<103mmol/L) Chloride at 28-day (A) and 1-year (B) Follow-up.
We performed univariate and multivariate Cox regression analyses (Table 3). Univariate analysis revealed that the low chloride group was significantly associated with increased 28-day all-cause mortality (unadjusted HR = 1.615; 95% CI = 1.188–2.195) and 1-year all-cause mortality (unadjusted HR = 1.482; 95% CI = 1.164–1.887) in patients with hepatic coma. After adjusting for age and gender, the low chloride group remained significantly associated with higher 28-day all-cause mortality (adjusted HR = 1.624; 95% CI = 1.194-2.209) and 1-year all-cause mortality (adjusted HR = 1.509; 95% CI = 1.185-1.921). After adjusting for age and gender, the association remained significant for both 28-day all-cause mortality (adjusted HR = 1.624; 95% CI = 1.194–2.209) and 1-year all-cause mortality (adjusted HR = 1.509; 95% CI = 1.185–1.921). Further adjustment for age, gender, SOFA score, CRRT, IMV, AKI, RF, and sepsis did not alter this trend, with the low chloride group remaining significantly associated with higher 28-day (adjusted HR = 1.424; 95% CI = 1.041–1.949) and 1-year all-cause mortality (adjusted HR = 1.313; 95% CI = 1.026–1.679). In contrast, the high chloride group showed no significant mortality association in either univariate or multivariate analyses (P > 0.05).
Table 3. The Findings of Univariate and Multivariable Analyses
Chloride Model 1 HR, 95%CI, P value Model 2 HR, 95%CI, P value Model 3HR, 95%CI, P value 28-day death Continuous 0.964 (0.948, 0.981), <0.001 0.962 (0.946, 0.979), <0.001 0.964 (0.948, 0.982), <0.001 Categorical Moderate Reference Reference Reference High 1.052 (0.580, 1.911), 0.866 1.126 (0.619,2.049), 0.697 0.867 (0.471, 1.594), 0.646 Low 1.615 (1.188, 2.195), 0.002 1.624 (1.194,2.209), 0.002 1.424 (1.041, 1.949), 0.027 1-year death Continuous 0.973 (0.959, 0.987), <0.001 0.970 (0.956, 0.984), <0.001 0.974 (0.960, 0.989), 0.001 Categorical Moderate Reference Reference Reference High 1.246 (0.807, 1.923), 0.321 1.335 (0.863,2.065), 0.195 1.071 (0.686, 1.672), 0.764 Low 1.482 (1.164, 1.887), 0.001 1.509 (1.185,1.921), 0.001 1.313 (1.026, 1.679), 0.031 External28-day death Non-Low Reference Reference Reference Low 2.673 (1.085, 6.560), 0.032 2.626 (1.044,6.603), 0.040 4.311 (1.495, 12.432), 0.007 Note. Model 1: Unadjusted.Model 2: Adjusted for gender and ageModel 3: Adjusted for gender, age, SOFA score, CRRT, IMV, AKI, RF, and sepsis -
Based on above findings, we stratified patients into two distinct groups: a low chloride group and a combined non-low chloride group (incorporating both moderate and high chloride categories). To further investigate these associations, we performed comprehensive interaction tests and subgroup analyses to examine potential effect modifications and differential associations across clinically relevant patient subgroups.
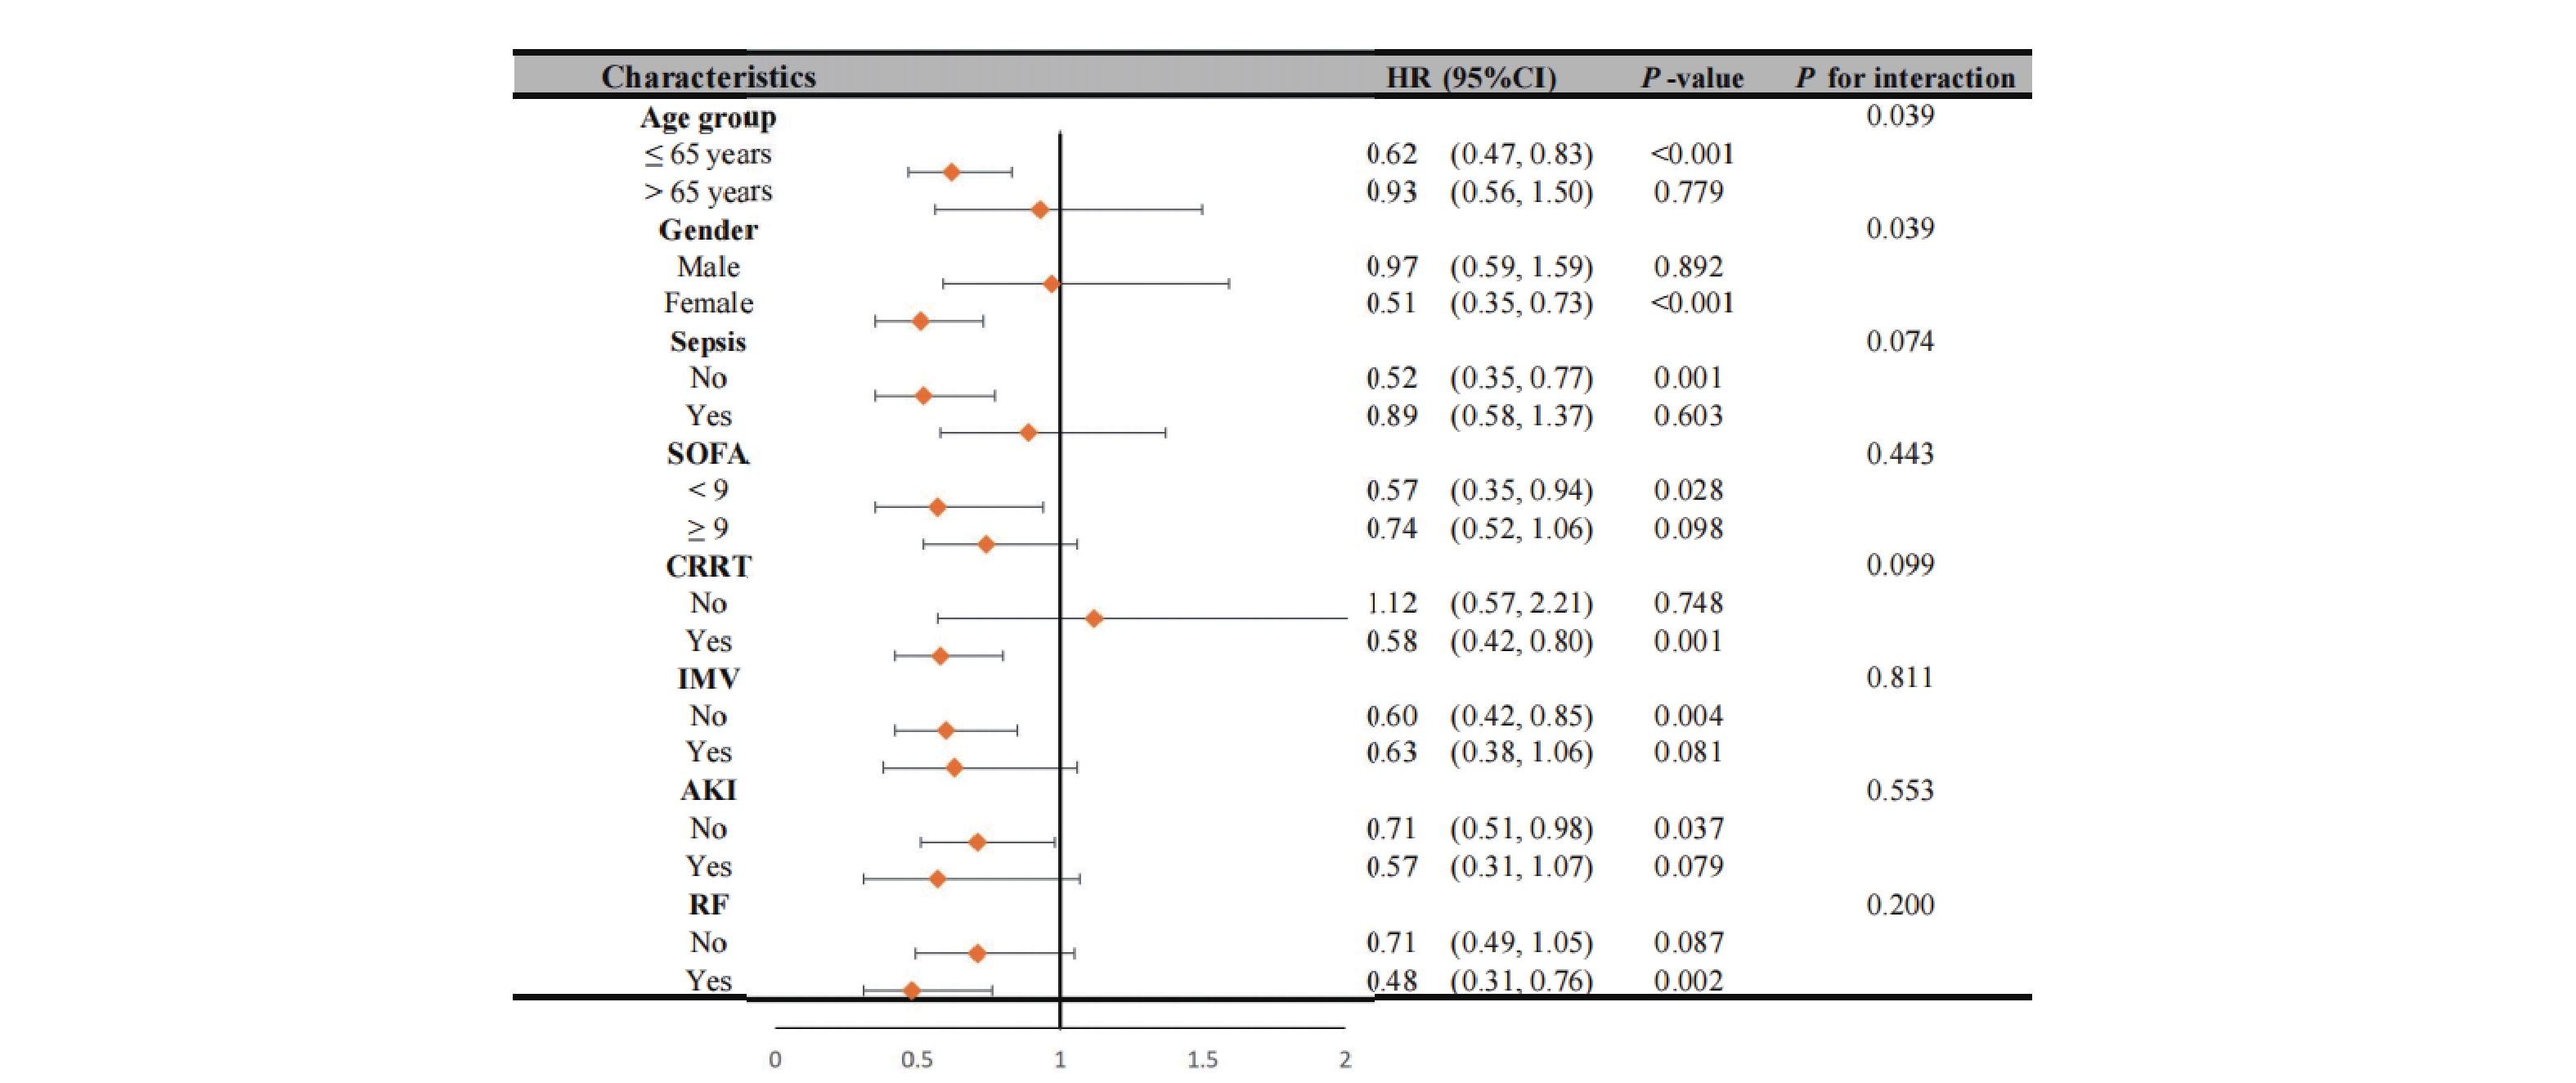
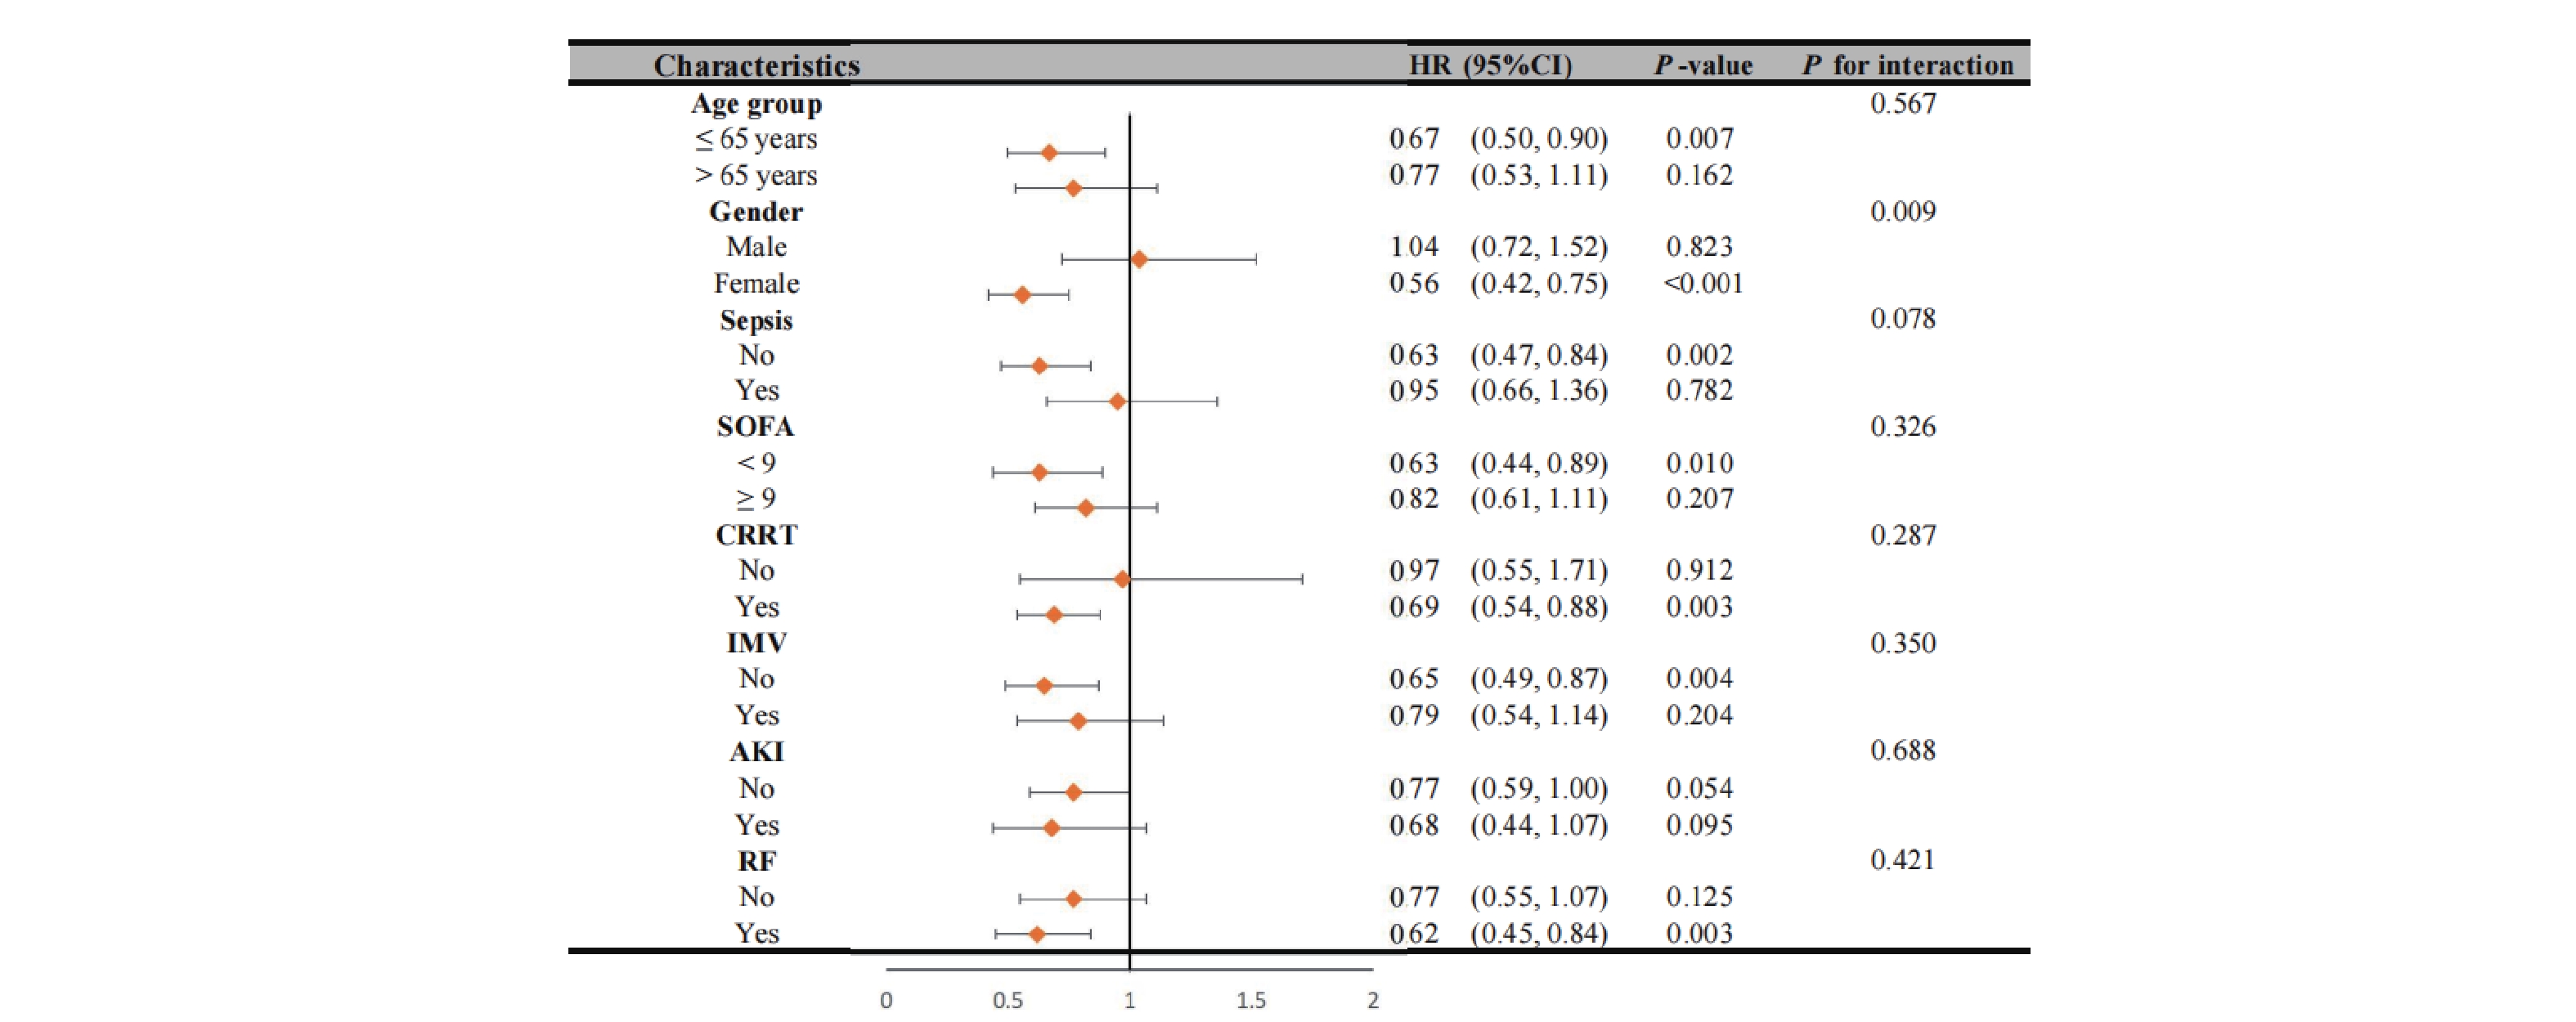
Our analysis revealed significant interaction effects between chloride levels and demographic factors (Figure 4). During the 28-day follow-up, we observed a notable age-dependent interaction (P interaction = 0.039), where patients aged ≤65 years with non-low chloride levels exhibited a significantly reduced mortality risk (HR = 0.62, 95% CI 0.47-0.83, P < 0.001). A similar gender-based interaction was observed (P interaction = 0.039), with female patients showing a strong inverse association between chloride levels and 28-day mortality (HR = 0.51, 95% CI 0.35-0.73, P < 0.001). These patterns persisted at 1-year follow-up (Figure 5), with an even more pronounced gender interaction (P interaction = 0.009). While female patients continued to show a protective association of non-low chloride levels (HR = 0.56, 95% CI 0.42-0.75, P < 0.001), no significant association was found among male patients (HR = 1.04, 95% CI 0.72-1.52, P = 0.823), highlighting a striking gender-based difference in the prognostic value of serum chloride.
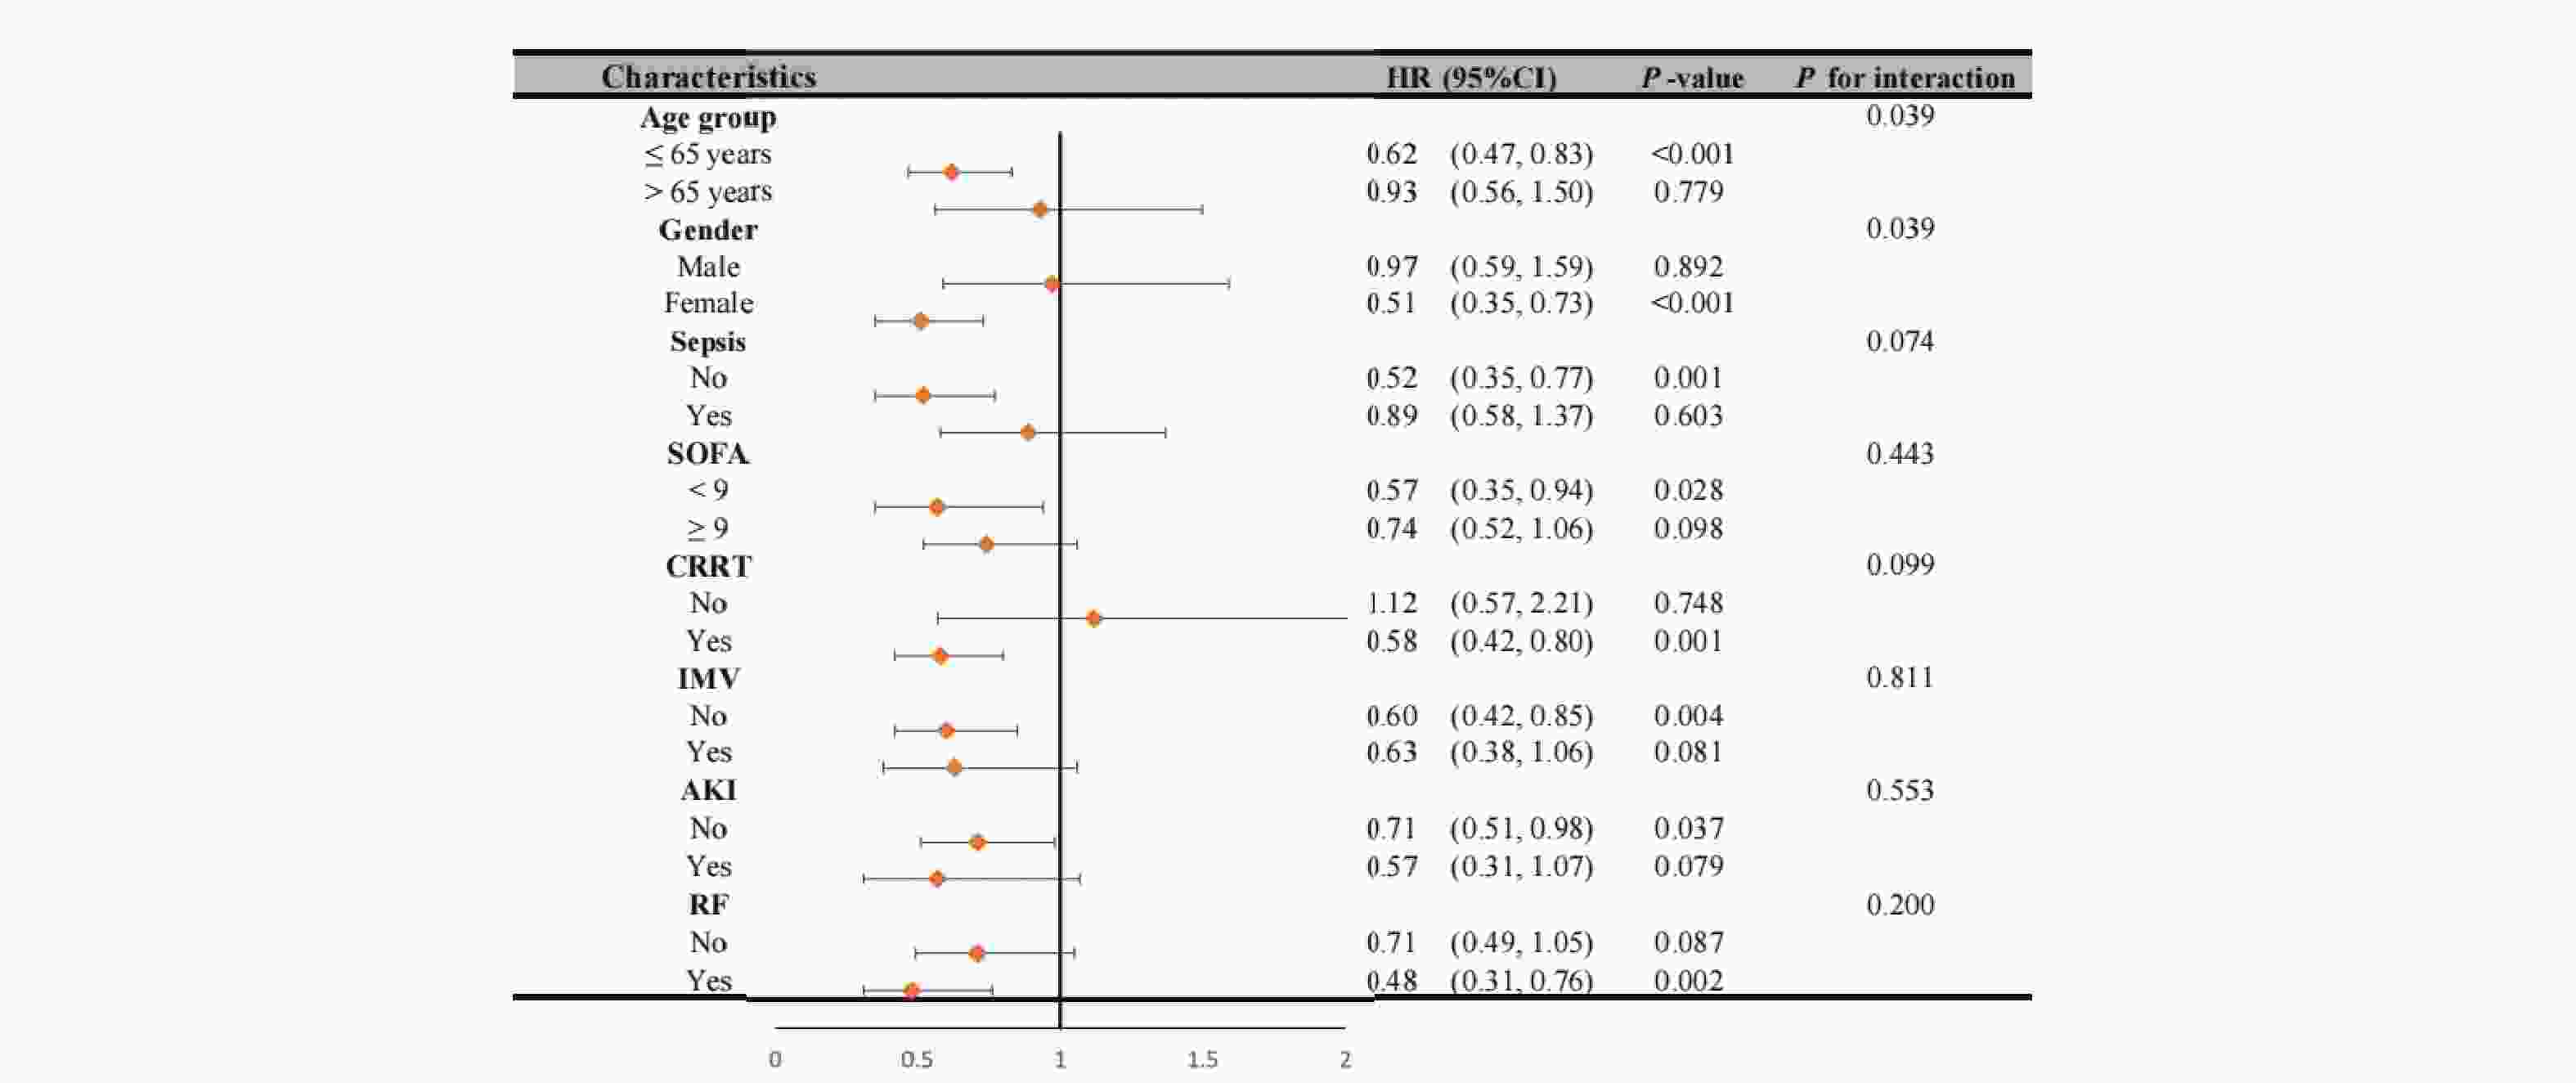
Figure 4. Subgroup Analysis of the Patients with Hepatic Coma for 28-day Death
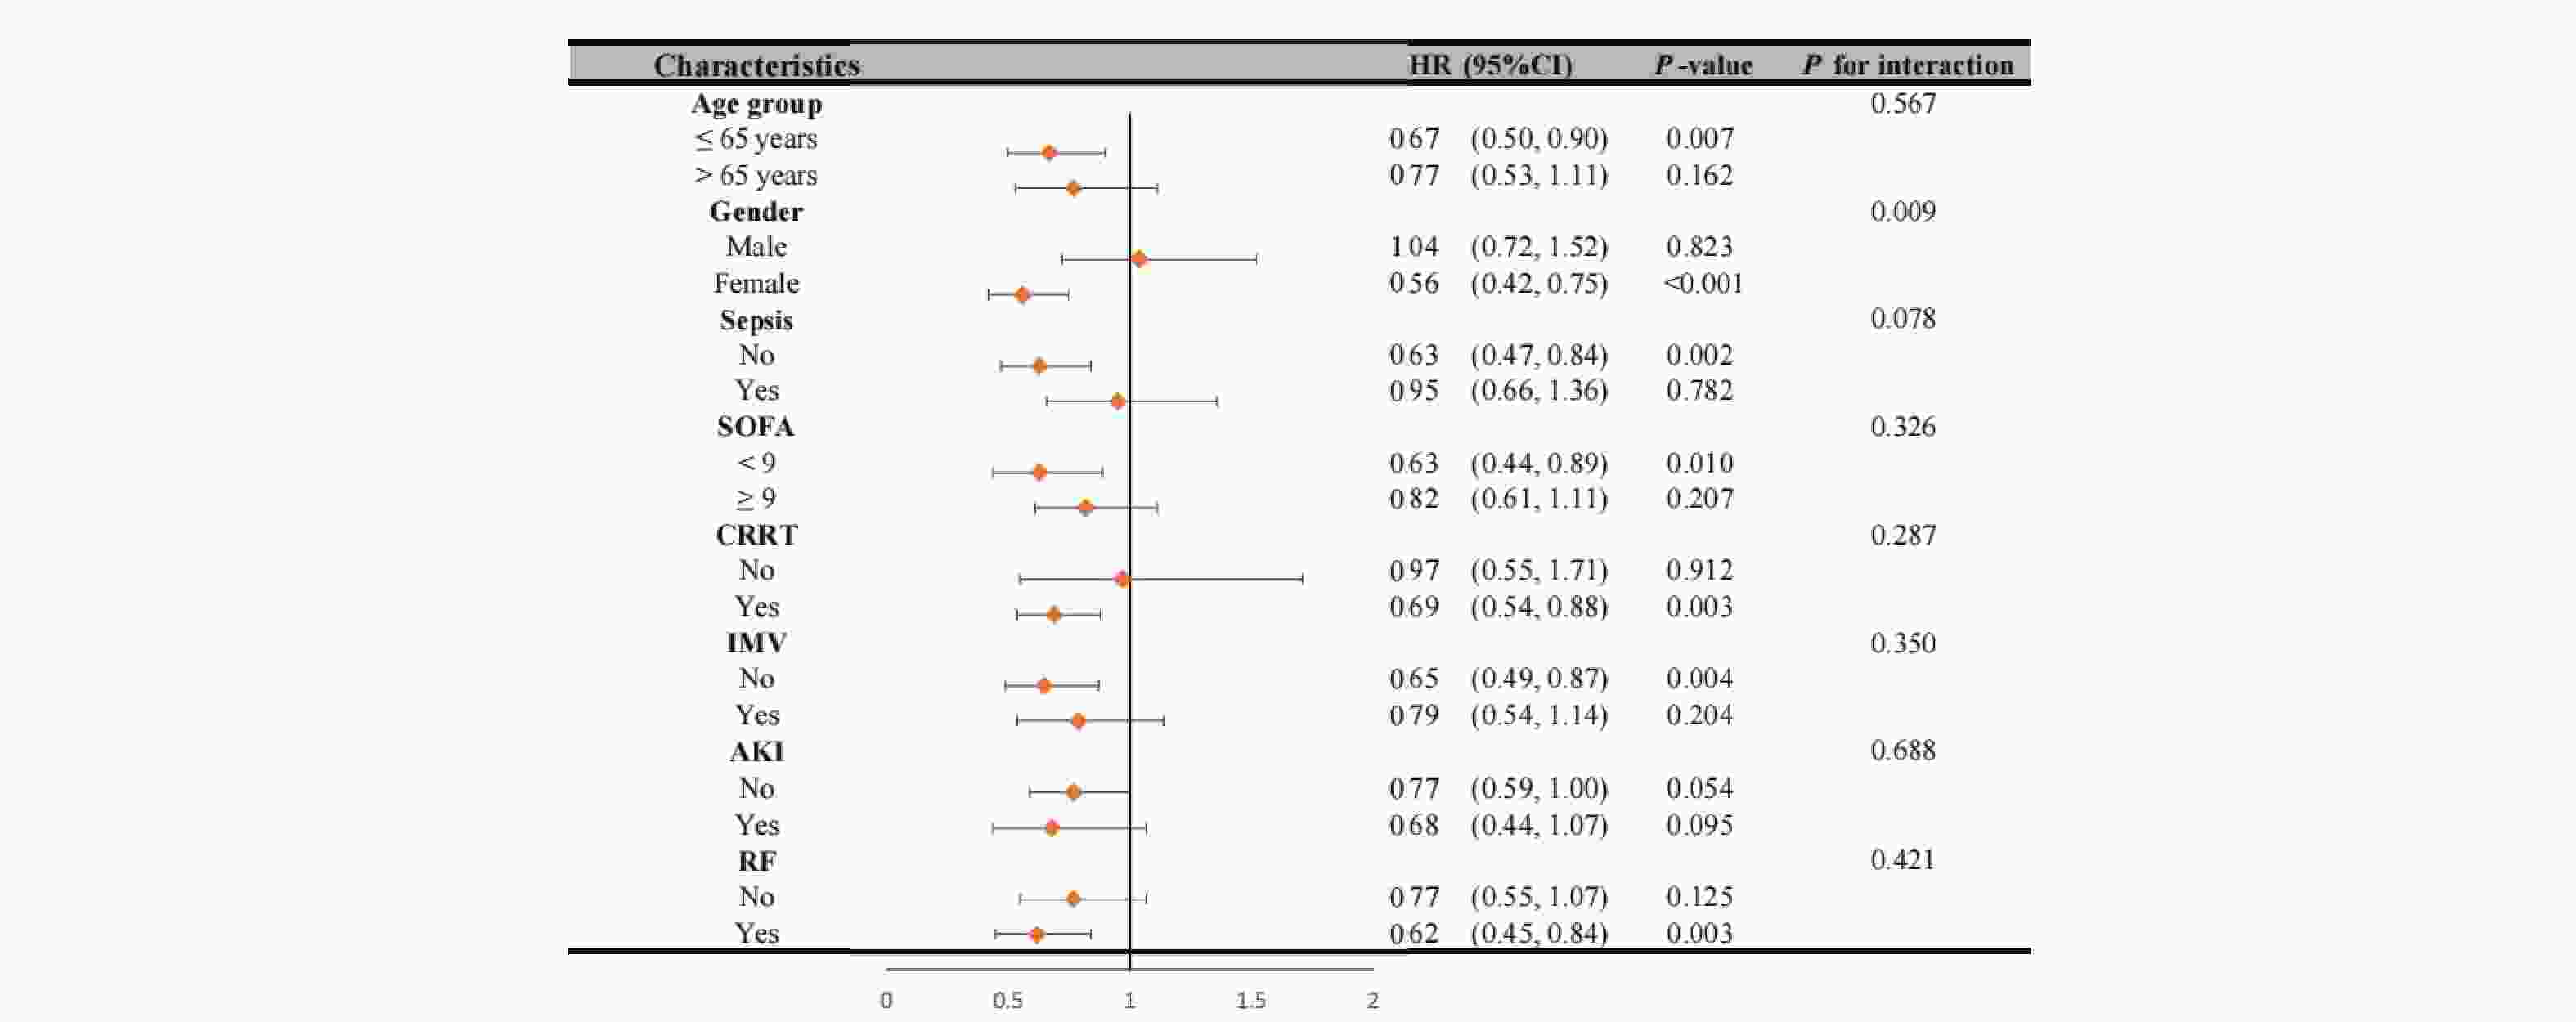
Figure 5. Subgroup Analysis of the Patients with Hepatic Coma for 1-year Death
-
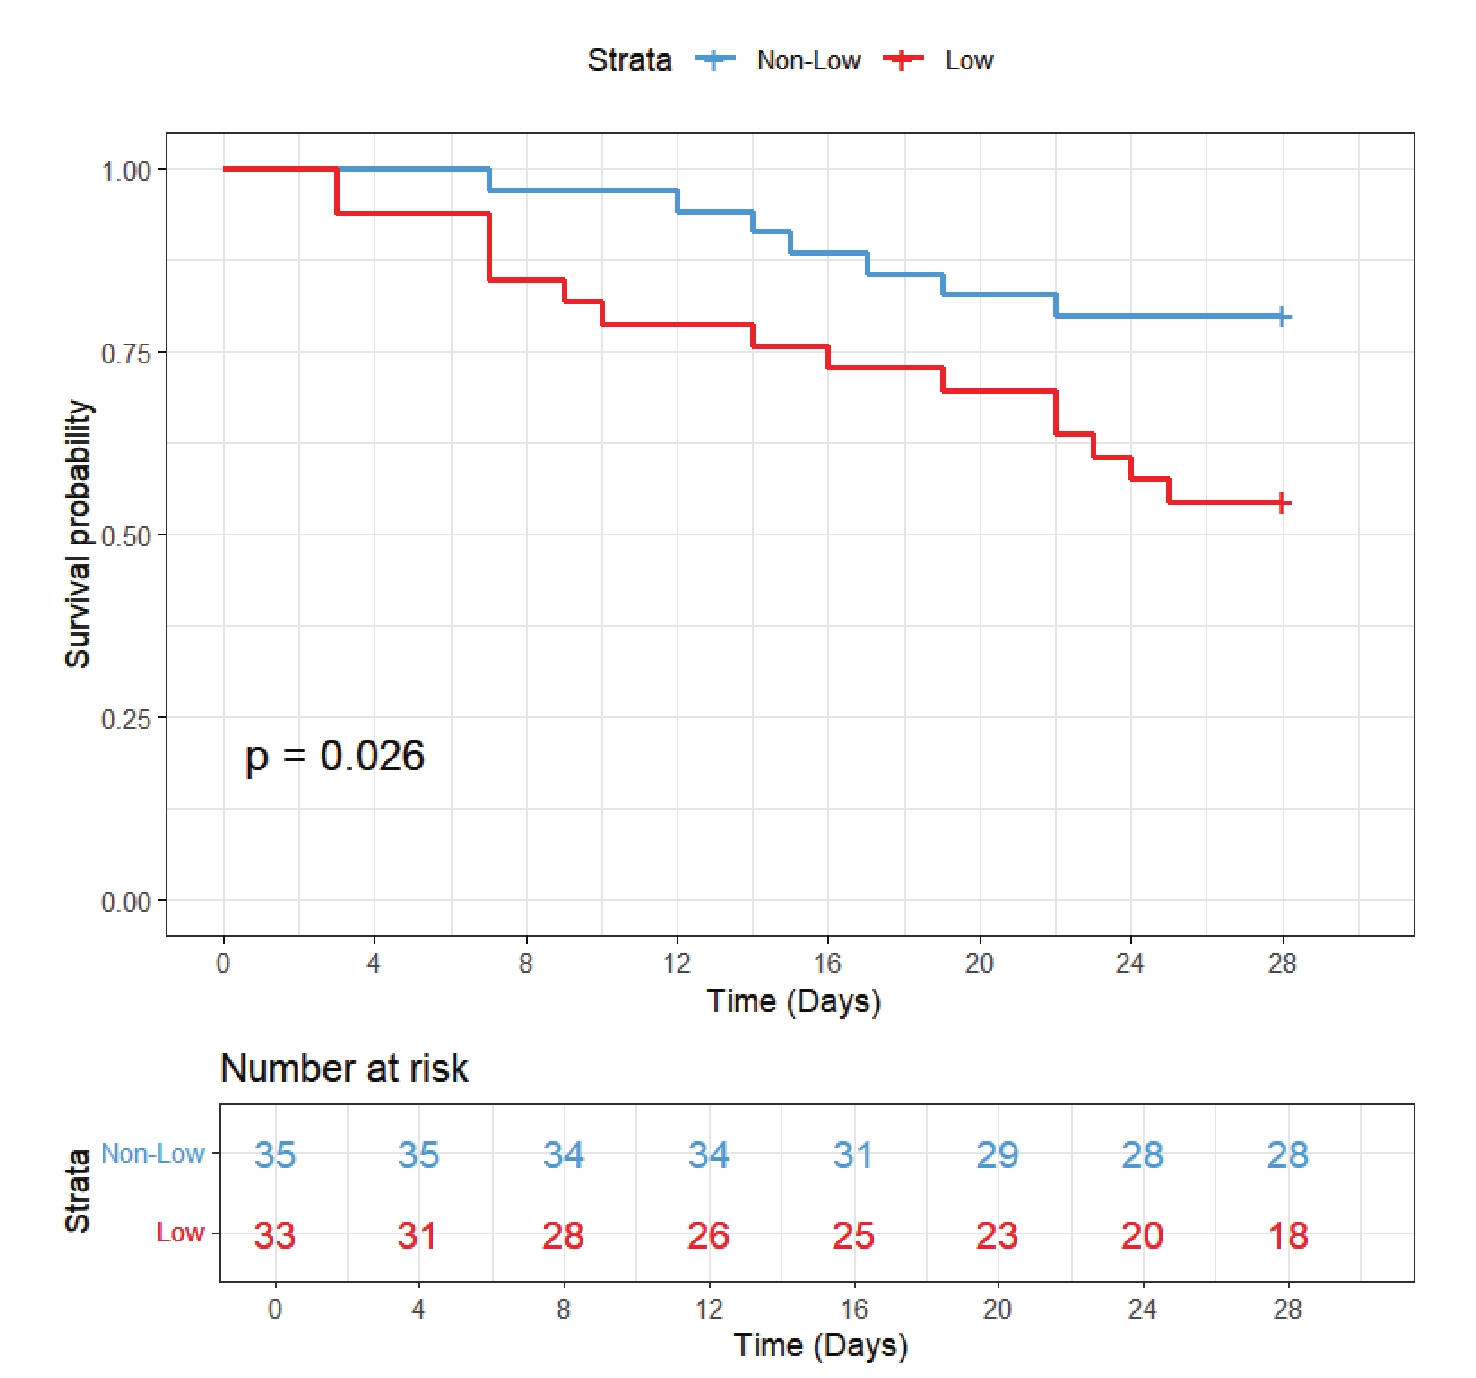
The validation cohort included 68 patients. In addition to chloride levels, data were collected on gender, age, SOFA score, CRRT, IMV, and comorbidities including AKI, RF, and sepsis. Baseline characteristics are presented in Table 4. The cohort included 46 survivors (67.6%) and 22 non-survivors (32.4%). Notably, non-survivors had significantly lower serum chloride levels (100.18 ± 5.76 mmol/L vs 105.93 ± 6.35 mmol/L in survivors, P = 0.001) and higher disease severity as reflected by SOFA scores (10.00 [7.25-14.00] vs 7.50 [5.00-10.00], P = 0.004). However, no significant differences were found between groups regarding age, gender, IMV, CRRT, or the distribution of comorbidities (AKI, RF, or sepsis) (P > 0.05). KM curve (Figure 6) demonstrated significantly worse survival in the hypochloremia group (log-rank P = 0.026). Cox regression models consistently showed increased mortality risk in the low chloride group across all three models (Model 1-3), with HRs consistently exceeding 1 (Table 3).
Table 4. Comparisons of the Baseline Characteristics at 28-day Follow-up of External Cohort.
Survivors Non-survivors P value N 46 22 Age, years 59.13 (13.78) 62.09 (10.19) 0.374 Chloride, mmol/L 105.93 (6.35) 100.18 (5.76) 0.001 SOFA 7.50 [5.00, 10.00] 10.00 [7.25, 14.00] 0.004 Gender (%) >0.999 Female 20 (43.5) 9 (40.9) Male 26 (56.5) 13 (59.1) CRRT (%) 6 (13.0) 1 ( 4.5) 0.514 IMV (%) 13 (28.3) 12 (54.5) 0.067 AKI (%) 17 (37.0) 14 (63.6) 0.071 RF (%) 24 (52.2) 10 (45.5) 0.795 Sepsis (%) 13 (28.3) 6 (27.3) >0.999 Note. SOFA, sequential organ failure assessment; CRRT, continuous renal replacement therapy; IMV, invasive mechanical ventilation; AKI, acute kidney injury; RF, respiratory failure. 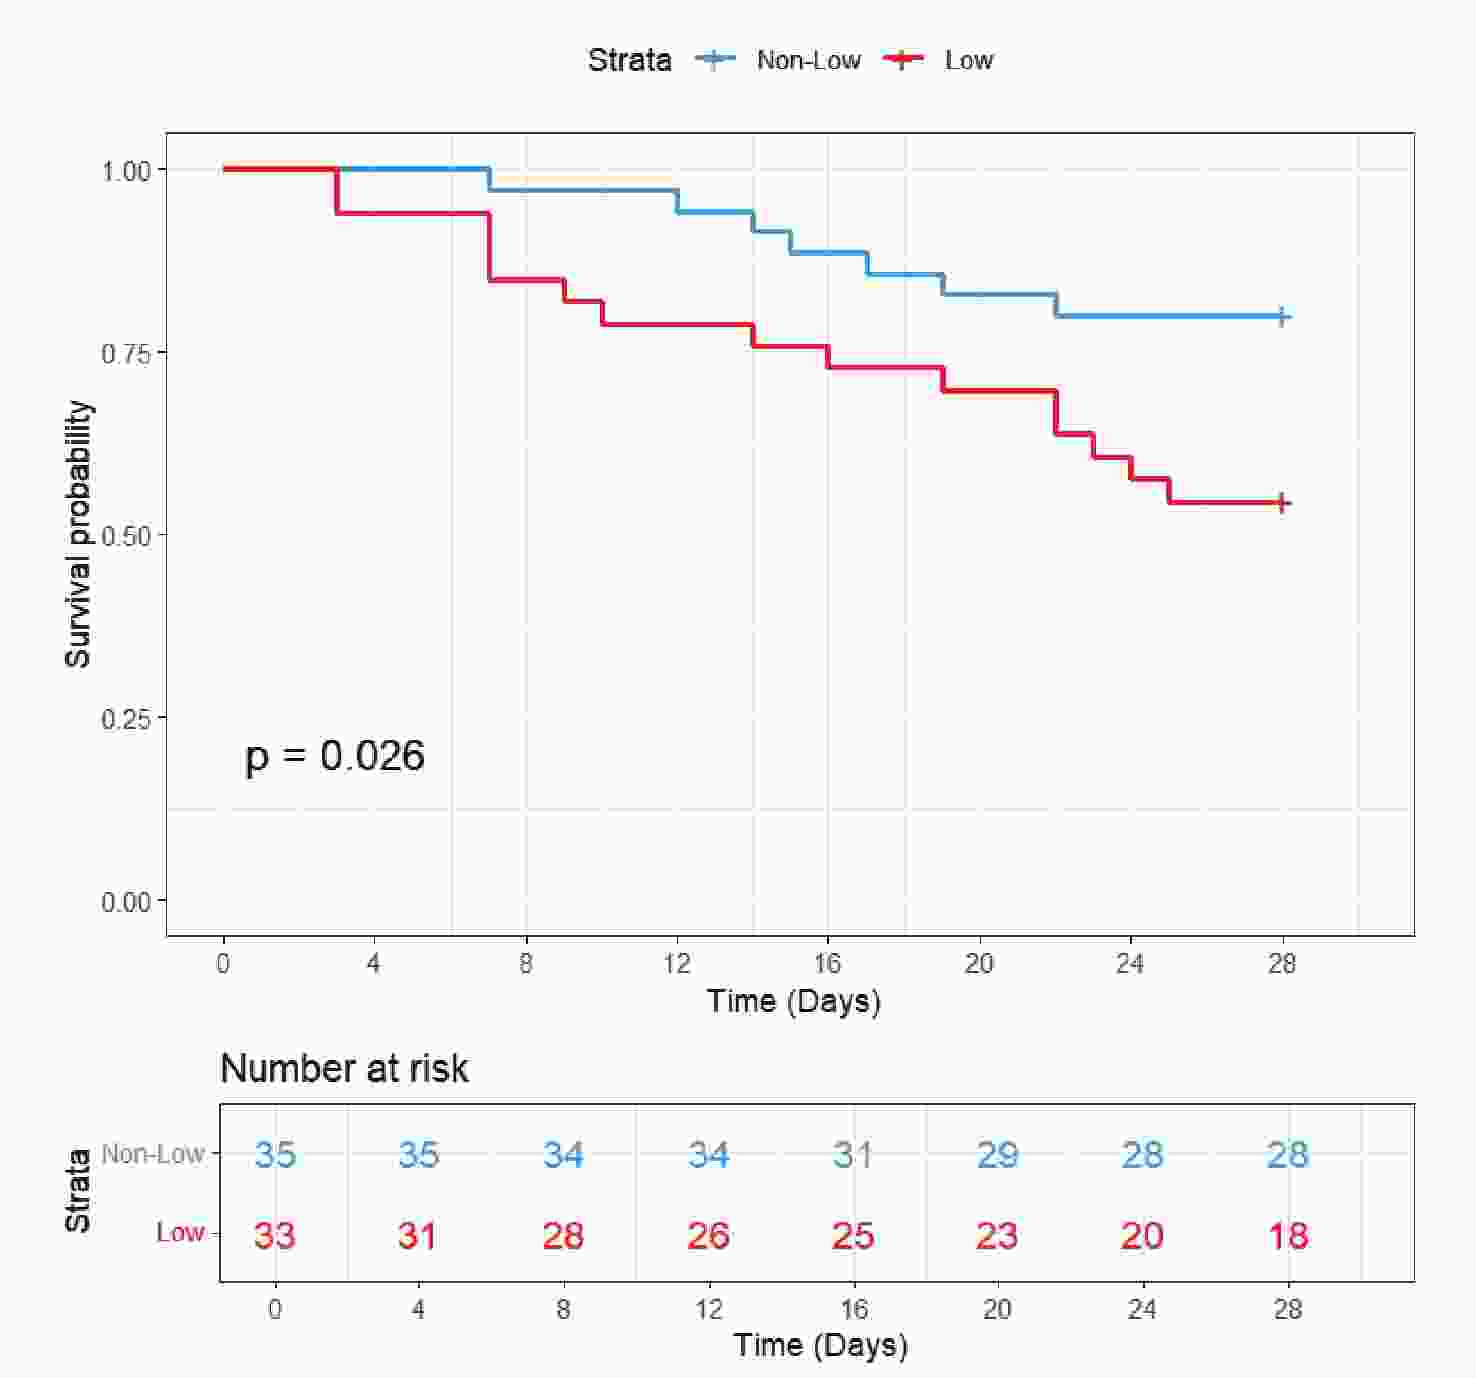
Figure 6. KM Survival Curves of Hepatic Coma Patients with Low (red, chloride < 103mmol/L) and Non-Low Chloride (blue, chloride≥103mmol/L) at 28-day Follow-up.
-
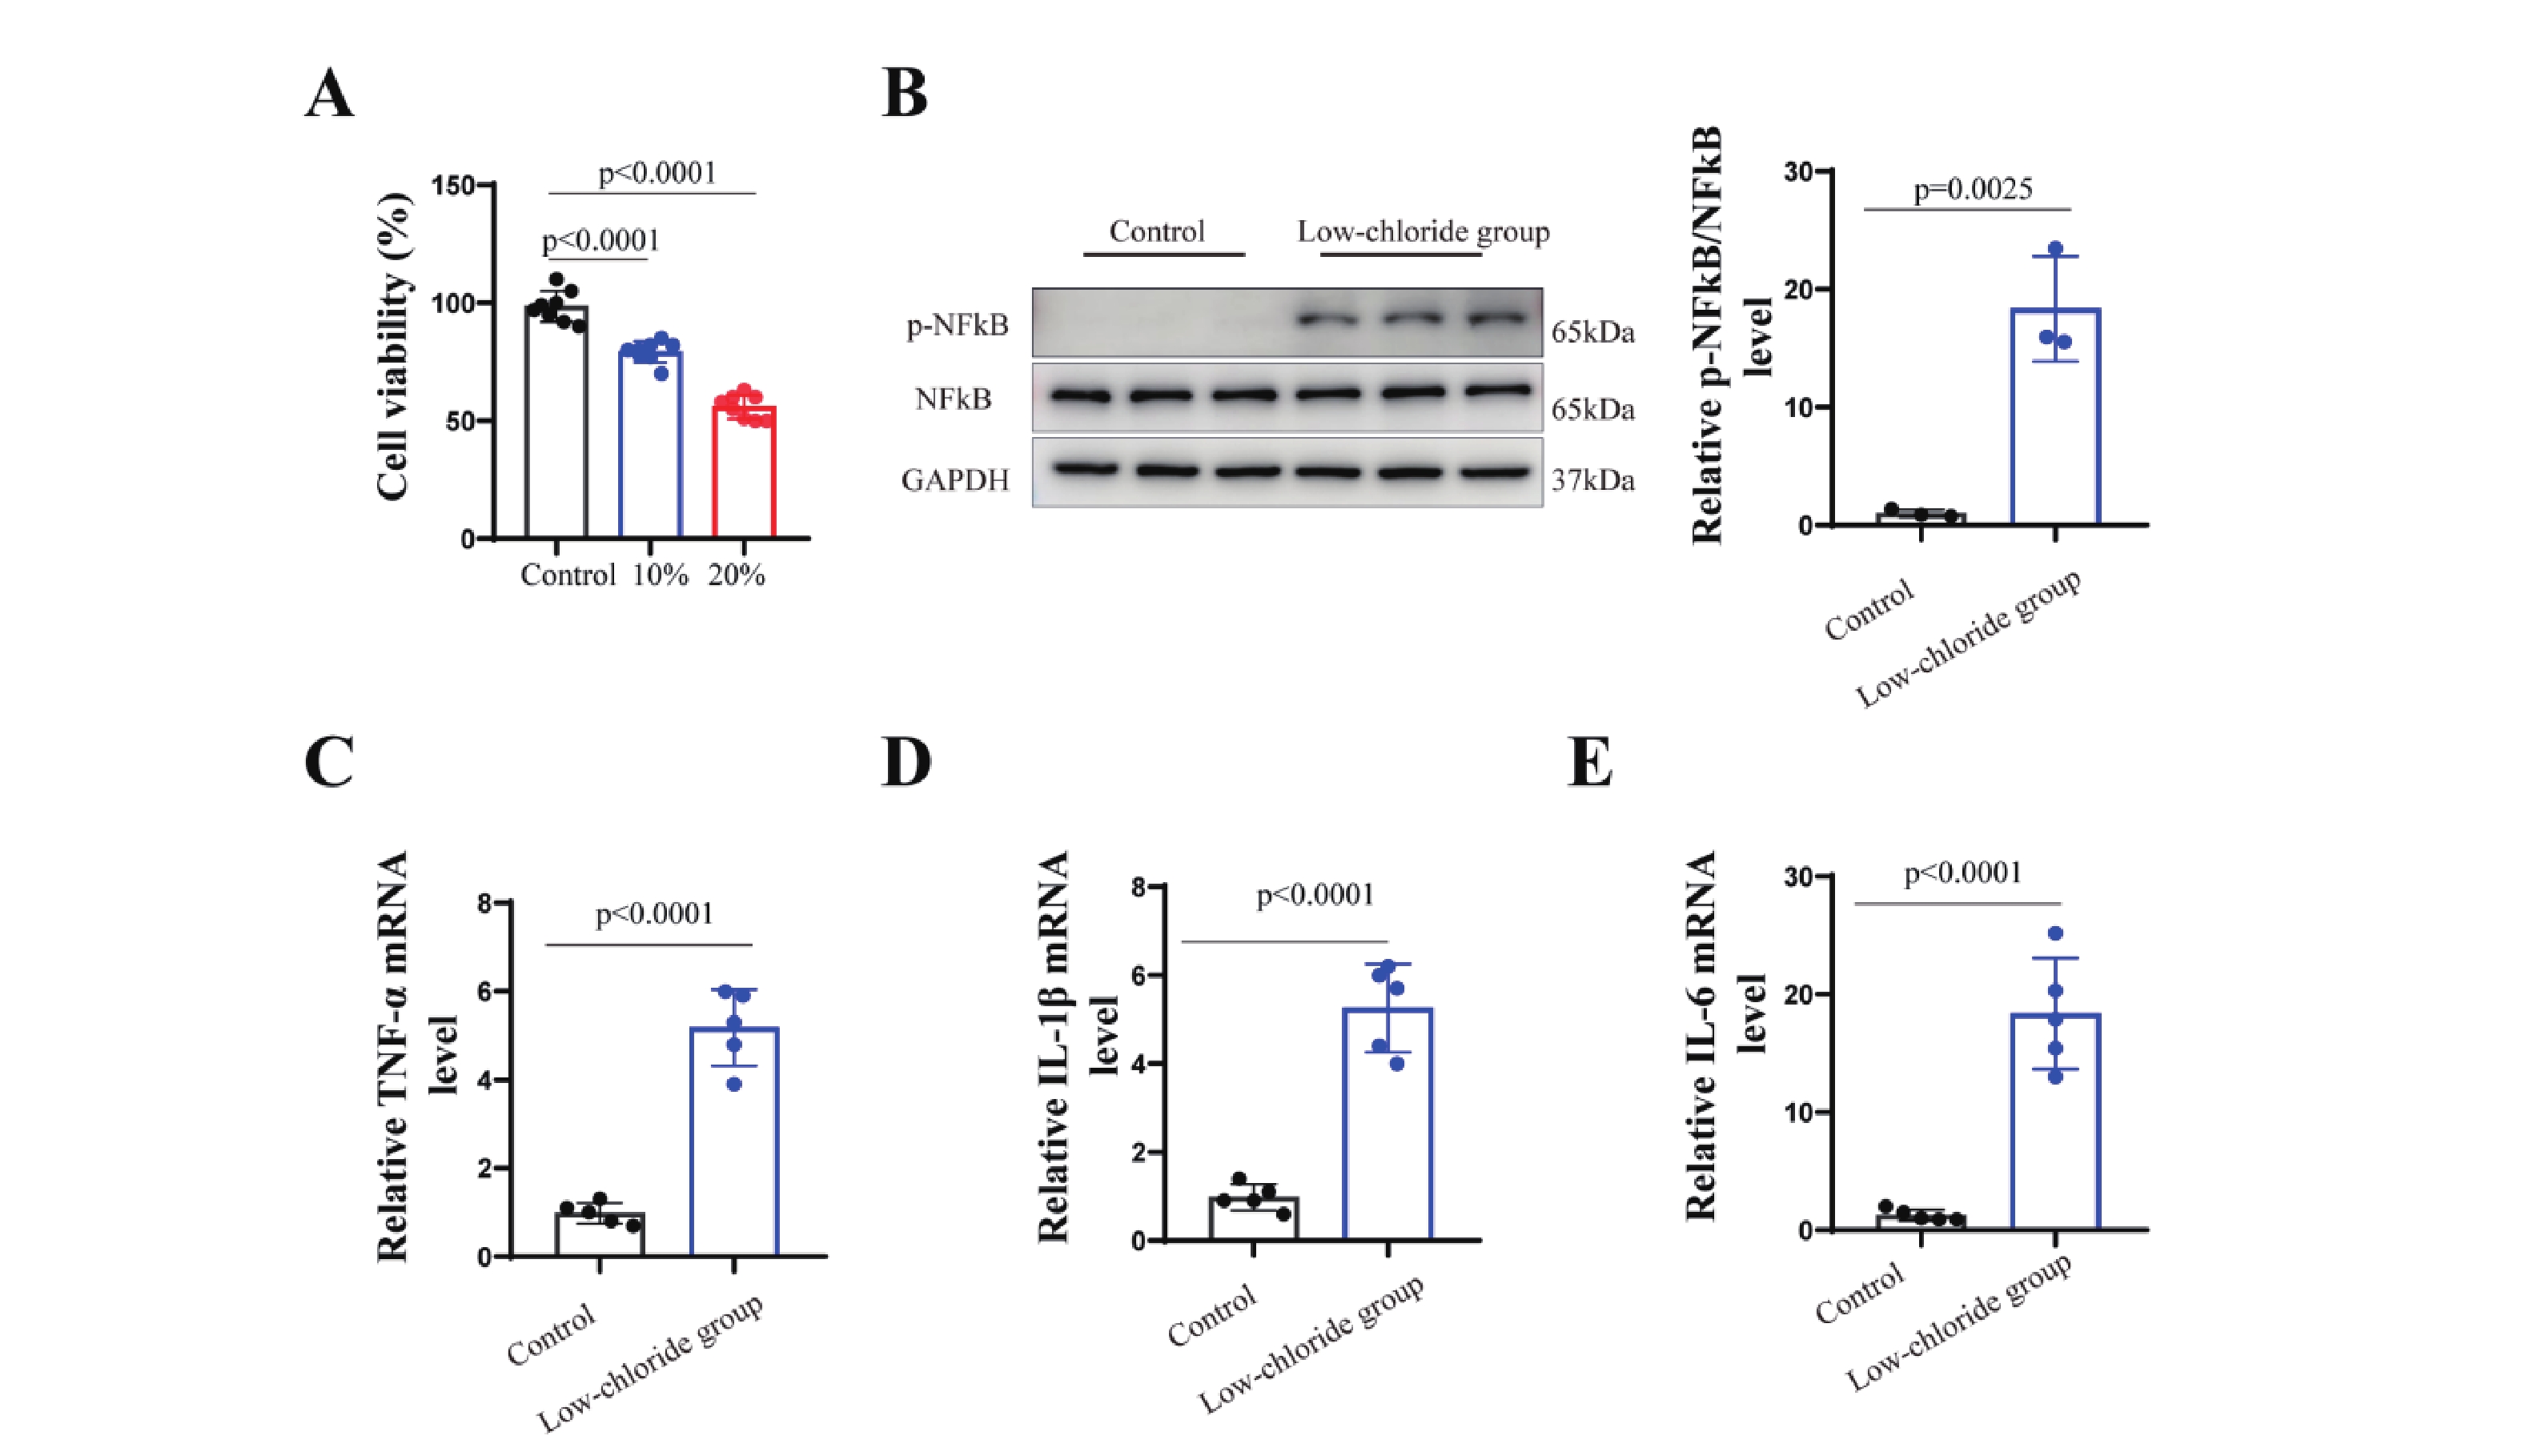
The results (Figure7) showed that neuronal cell viability was significantly reduced in the group with a 20% reduction in chloride concentration compared to the standard medium (p<0.001). This group also exhibited markedly increased phosphorylation of NF-κB (p<0.001) and elevated mRNA levels of pro-inflammatory cytokines TNF-α, IL-1β, and IL-6 (p<0.001). These findings suggest that lowchloride levels may activate NF-κB pathway phosphorylation, promote the expression ofpro-inflammatory cytokines, and reduce neuronal cell viability.
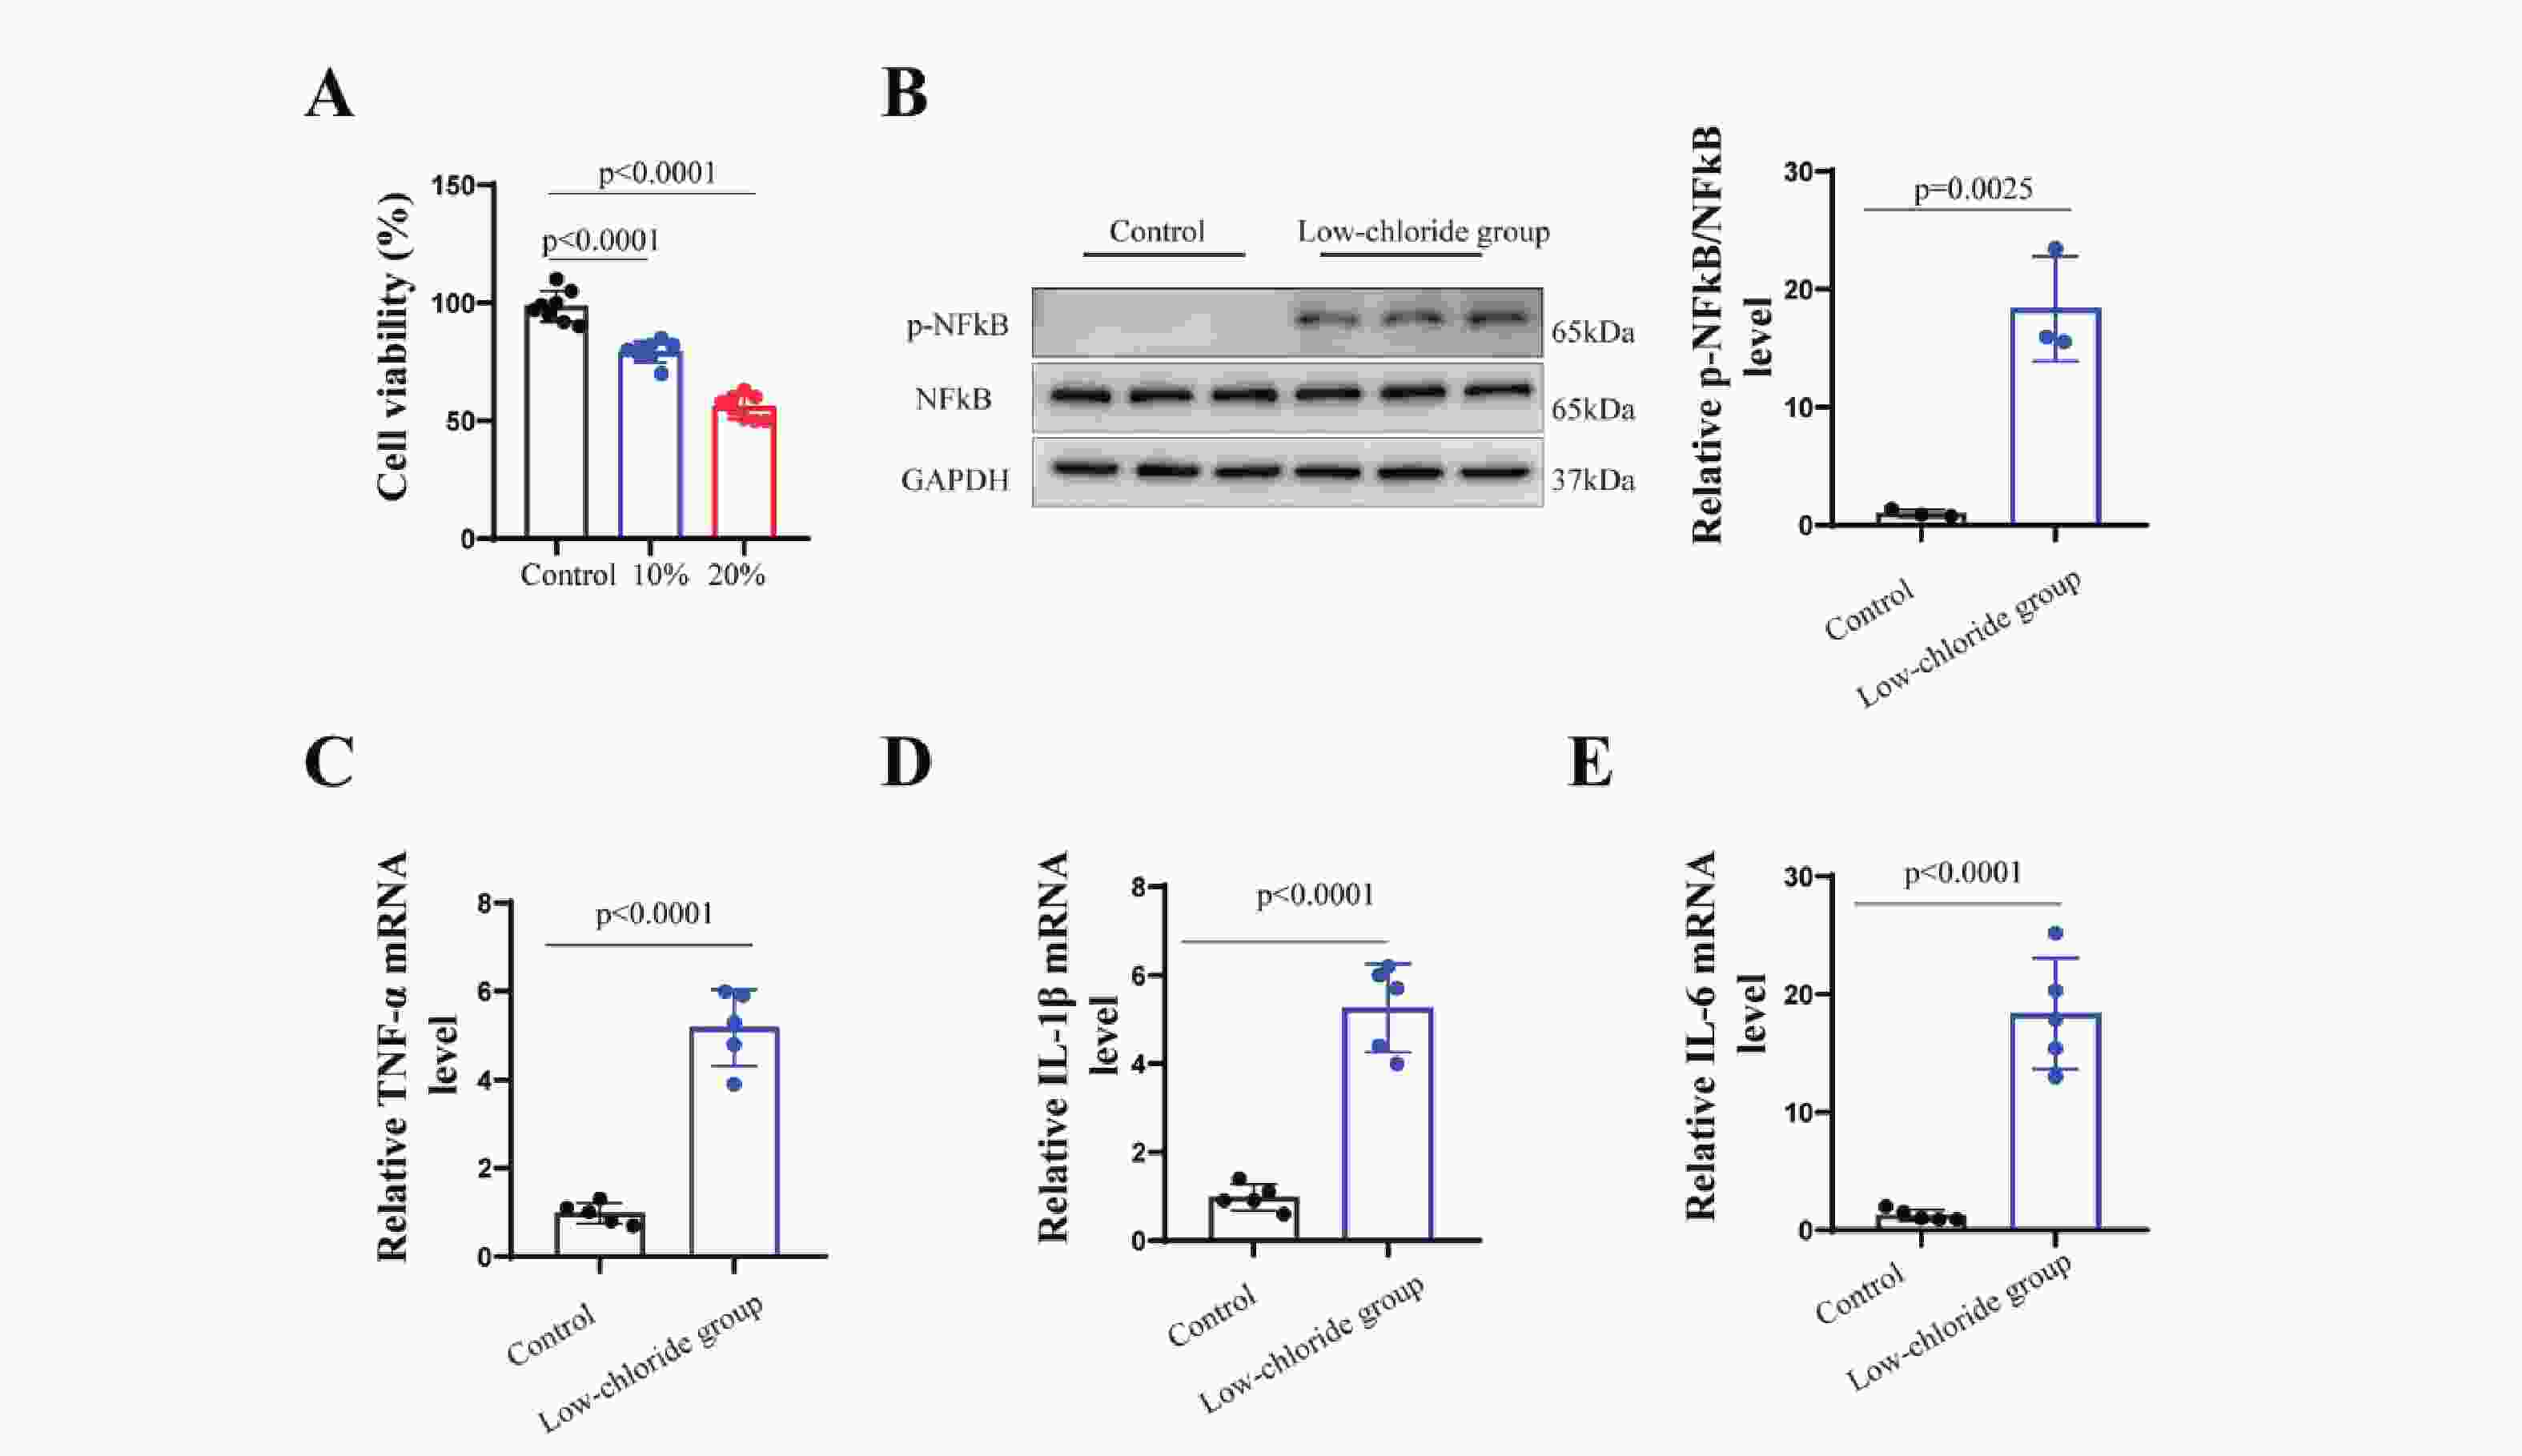
Figure 7. Effects of Low-Chloride Environment on Cell Viability and the NF-κB Inflammatory Pathway.
-
This study represents the first investigation into the correlation between serum chloride levels and both short-term and long-term all-cause mortality among ICU patients diagnosed with hepatic coma. The primary finding of this study highlights that diminished serum chloride levels serve as a significant and independent predictor of increased 28-day and 1-year all-cause mortality in patients with hepatic coma. Notably, this association remains consistent even after controlling for various other variables. The findings of this research provide a simple and effective biomarker for accurately assessing the short-term and long-term prognosis of hepatic coma. In addition, the cell experiments further validated the potential mechanism by which low chloride affect neuronal cells, providing evidence for the impact of hypochloremia on the prognosis of patients with hepatic encephalopathy.
According to the results shown by the RCS curve, there is a "U"-shaped correlation between serum chloride and 28-day and 1-year all-cause mortality in patients with hepatic coma. Specifically, the lowest mortality is observed when chloride ion concentrations are within the range of 103-113 mmol/L. The KM survival curve demonstrates that patients in the low chloride group face the highest risk of mortality, while the high chloride group has a higher mortality risk compared to the moderate chloride group. This finding is further supported by Cox regression analysis, which indicates that patients in the low chloride group have significantly higher overall mortality than those in the moderate and high chloride groups. Subgroup analysis confirms this finding. In summary, this study underscores the utility of serum chloride in risk stratification and identification of high-risk patients with hepatic coma, thereby providing valuable insights for the clinical management of these patients.
Most studies have focused on the prognosis of patients with cirrhosis and HE. There is limited research specifically addressing the prognostic prediction for patients with hepatic coma15-17. It is important to note that hepatic coma can arise from causes other than liver cirrhosis and represents the most severe manifestation of HE. Consequently, the prognosis for patients with hepatic coma is particularly concerning compared to those with mild HE. Therefore, it is of great importance to conduct prognostic assessments that are specifically tailored for patients with hepatic coma. In our study, we carefully collected comprehensive and detailed baseline data, which included demographic information, vital signs, laboratory tests, disease severity scores, and treatment approaches. To ensure the reliability of our findings, we utilized multivariate Cox regression analysis and subgroup analysis to account for these variables. We comprehensively and robustly confirmed the prognostic value of low serum chloride in hepatic coma patients.
HE is a neuropsychiatric syndrome resulting from hepatic insufficiency and/or portosystemic shunting, representing one of the most severe complications in decompensated cirrhosis. Clinically, HE presents as a spectrum of neurological disturbances ranging from subtle cognitive impairments to profound coma. The underlying pathophysiology is multifactorial, with hyperammonemia serving as the principal pathogenic mechanism. Additional contributing factors include oxidative stress18,19, systemic inflammation20, which collectively exacerbate neuronal dysfunction. Most of the toxic metabolic products are typically produced in the intestines and, before being detoxified and cleared by the liver, enter the systemic circulation through collateral pathways, subsequently crossing the blood-brain barrier and leading to brain dysfunction20. Serum chloride is closely related to various neurological disorders21. Chloride plays a vital role in the physiological function of the central nervous system22. Changes in serum chloride have been considered potential targets for the treatment of various neurological diseases23. Studies have shown that hyperchloremia can predict early mortality in severe traumatic brain injury24. Hyperchloremia often occurs in more severe cases and is independently associated with death or disability within 90 days; avoiding hyperchloremia may reduce the mortality or disability observed in patients with cerebral hemorrhage25. However, some studies have also found that hyponatremia during hospitalization is associated with in-hospital mortality in acute stroke patients 26. Hyponatremia may be an important prognostic factor determining the risk of death in patients with severe traumatic brain injury27. In our study, we found that lower serum chloride ion concentrations are associated with poor prognosis in patients with hepatic coma. Although there is inconsistency in the research results regarding chloride and the prognosis of neurological diseases, targeted interventions to normalize serum chloride ion levels may be a potential approach to improve the prognosis of severe neurological disorders.
Multiple studies have indicated a close association between changes in serum chloride and adverse outcomes in various diseases, including liver cirrhosis. Several studies have assessed the prognostic significance of serum chloride in patients with liver cirrhosis. Sumarsono and colleagues found that serum chloride levels are independent and negatively correlated with 180-day mortality in patients with decompensated cirrhosis in the ICU28. Yun found that the mortality in the ICU is higher in patients with hypochloremia compared to those without hypochloremia. They also observed that serum chloride levels are independently correlated with ICU mortality in patients with severe liver cirrhosis29. Additionally, a study found an association between low serum chloride levels and long-term mortality in patients with advanced chronic liver disease. Low serum chloride levels were also associated with ICU mortality30. However, up to this point, no study has evaluated the significance of serum chloride as a prognostic indicator in patients with hepatic coma.
Serum chloride is often an overlooked ion, yet it is the second most abundant electrolyte in serum after sodium. It plays a crucial role in regulating fluid and electrolyte balance, maintaining electrical neutrality, and managing acid-base status. Abnormal levels of chloride in serum electrolyte evaluation often indicate more severe underlying metabolic disturbances, such as metabolic acidosis or alkalosis6. As a prognostic biomarker, chloride has several advantages. Firstly, chloride can be conveniently and rapidly measured in most hospitals, offering benefits of timeliness and low cost. Secondly, as mentioned earlier, serum chloride levels can serve as an independent prognostic factor for predicting the prognosis of patients with liver cirrhosis31-33. Additionally, it is widely recognized that patients with HE often experience electrolyte imbalances. Hence, there is a theoretical basis for using serum chloride levels as a predictor of prognosis in patients with hepatic coma. This study also demonstrates the role of low chloride levels in predicting 28-day and 1-year all-cause mortality in patients with hepatic coma.
In addition, this study explored the regulatory effects of chloride ion concentration on neuronal activity and inflammatory responses through in vitro experiments. The results demonstrated that reducing chloride concentration in the culture medium significantly suppressed neuronal viability, accompanied by activation of the NF-κB signaling pathway and upregulation of pro-inflammatory cytokines (TNF-α, IL-1β, IL-6). These findings provide new experimental evidence for understanding the potential role of chloride ions in hepatic encephalopathy. The experiment further confirmed that chloride deficiency may aggravate neuronal injury by activating inflammatory pathways, which is closely related to the pathogenesis of neurological dysfunction in hepatic encephalopathy. Moreover, activation of the NF-κB signaling pathway may be a key mechanism through which chloride ions regulate inflammation. NF-κB is a central transcription factor in the inflammatory response, and its phosphorylation promotes the transcription of pro-inflammatory cytokines such as TNF-α and IL-1β 34. However, the specific mechanisms require further investigation.
While our study confirms that low chloride levels can serve as effective prognostic factors in clinical practice, we must acknowledge certain limitations. Firstly, this is a retrospective analysis from an observational study, and thus, causal relationships cannot be definitively established. However, we employed careful, multifaceted, and rigorous statistical methods to derive valid and reliable results. Further research is needed to determine whether interventions targeting chloride concentrations have a positive impact on improving clinical outcomes. Secondly, the data were sourced from a single-center database, and further validation is required to determine its applicability in other settings. Finally, the underlying mechanism between elevated serum chloride and increased mortality in patients with hepatic coma remains unclear, and further research is necessary.
-
Chloride is independently associated with the mortality of patients with hepatic coma in the ICU. Patients who exhibit low chloride levels (chloride < 103 mmol/L) have higher 28-day and 1-year all-cause mortality. Our research findings may provide a rationale for future studies, including targeted interventions to avoid low serum chloride levels and improve outcomes in patients with hepatic coma.
doi: 10.3967/bes2025.092
The Association between Serum Chloride Levels and Prognosis in Patients with Hepatic Coma in the Intensive Care Unit.
-
Abstract:
Objective To explore the relationship between serum chloride levels and prognosis in intensive care unit (ICU) patients with hepatic coma. Methods We analyzed 545 ICU patients with hepatic coma from the MIMIC-IV database. Associations between serum chloride levels and 28-day and 1-year mortality were assessed using restricted cubic splines (RCS), Kaplan-Meier (KM) curves, and Cox regression. Subgroup analyses, external validation, and mechanistic studies were also conducted. Results A total of 545 patients were included. RCS analysis revealed a U-shaped association between serum chloride levels and mortality in hepatic coma patients. KM curves indicated lower survival rates among patients with low chloride levels (<103 mmol/L). Low chloride levels were independently linked to increased 28-day and 1-year all-cause mortality. In multivariate models, the hazard ratio (HR) for 28-day mortality in the low chloride group was 1.424 (95% CI: 1.041-1.949), while the adjusted HR for 1-year mortality was 1.313 (95% CI: 1.026-1.679). Subgroup analyses and External validation supported these findings. Cytological experiments suggest that low chloride may activate the phosphorylation of the NF-κB signaling pathway, promote the expression of pro-inflammatory cytokines, and reduce neuronal cell viability. Conclusions Low serum chloride is independently associated with increased mortality in hepatic coma patients. -
Key words:
- Hepatic coma /
- Chloride /
- Mortality /
- Intensive care unit
The authors declare that they have no conflict of interest to declare.
All methods in this study were carried out in accordance with relevant guidelines and regulations (the Declaration of Helsinki). MIMIC-IV is an anonymous public database. The project received approval from the Institutional Review Boards of both the Massachusetts Institute of Technology (MIT) and Beth Israel Deaconess Medical Center (BIDMC) with an informed consent waiver.
&These authors contributed equally to this work.
注释:1) Author contributions: 2) Conflict of interest: 3) Ethical approval and consent: -
Figure 1. Patient Selection Process
MIMIC, Medical Information Mart for Intensive Care; ICU, intensive care unit.
Figure 2. Association between Chloride and HR of 28-day (A) and 1-year (B) All-cause Mortality.
Note: HR, hazard ratio; CI, confidence interval
Figure 3. KM Survival Curves of Hepatic Coma Patients with Moderate (yellow, chloride 103-103mmol/L ), High (red, chloride>113mmol/L ) and Low (blue, chloride<103mmol/L) Chloride at 28-day (A) and 1-year (B) Follow-up.
Note: KM, Kaplan-Meier
Figure 4. Subgroup Analysis of the Patients with Hepatic Coma for 28-day Death
Note: HR, hazard ratio; CI, confidence interval; SOFA, sequential organ failure assessment; CRRT, continuous renal replacement therapy; IMV, invasive mechanical ventilation; AKI, acute kidney injury; RF, respiratory failure.
Figure 5. Subgroup Analysis of the Patients with Hepatic Coma for 1-year Death
Note: HR, hazard ratio; CI, confidence interval; SOFA, sequential organ failure assessment; CRRT, continuous renal replacement therapy; IMV, invasive mechanical ventilation; AKI, acute kidney injury; RF, respiratory failure.
Figure 6. KM Survival Curves of Hepatic Coma Patients with Low (red, chloride < 103mmol/L) and Non-Low Chloride (blue, chloride≥103mmol/L) at 28-day Follow-up.
Note: KM, Kaplan-Meier
Figure 7. Effects of Low-Chloride Environment on Cell Viability and the NF-κB Inflammatory Pathway.
Note: A: Comparison of the effects of culture media with different chloride ion concentrations on neuronal cell viability. B: Expression of p-NF-κB protein in mouse neurons cultured in medium with 20% reduced chloride ions. D: Comparison of TNF-α mRNA expression between the low-chloride group and the normal group. E: Comparison of IL-1β mRNA expression between the low-chloride group and the normal group. F: Comparison of IL-6 mRNA expression between the low-chloride group and the normal group.
Table 1. Comparisons of the Baseline Characteristics at 28-day Follow-up.
Variables Survivors Non-survivors P value N 356 189 Age, years 57.11 (12.80) 59.33 (14.52) 0.067 Albumin,g/dL 3.08 (0.73) 2.95 (0.72) 0.063 ALT * 34.00 [22.00, 101.00] 51.00 [31.00, 240.00] 0.001 AST * 72.00 [43.00, 191.00] 128.00 [64.50, 392.50] <0.001 BUN *, mg/dL 27.00 [15.00, 47.75] 37.00 [20.75, 57.00] <0.001 Calcium, mmol/L 8.29 (1.20) 8.22 (1.05) 0.520 Chloride, mmol/L 104.16 (7.20) 101.05 (9.33) <0.001 Creatinine *, mg/dL 1.20 [0.70, 2.10] 1.70 [1.00, 2.60] 0.001 DBP 66.93 (18.17) 65.95 (18.93) 0.556 Glucose *, mg/dL 122.00 [100.00, 158.00] 116.00 [91.50, 151.00] 0.065 Hematocrit (%) 29.09 (5.96) 29.80 (6.93) 0.213 Hemoglobin,g/dL 9.71 (2.04) 9.87 (2.24) 0.403 HR 92.45 (19.54) 95.64 (22.36) 0.085 INR * 1.70 [1.40, 2.20] 2.10 [1.70, 2.80] <0.001 Lactate *, mmol/L 2.30 [1.50, 3.60] 2.90 [2.00, 4.85] <0.001 Platelet *, K/μl 112.00 [64.50, 165.00] 104.00 [66.00, 183.00] 0.909 Potassium, mmol/L 4.15 (0.82) 4.32 (0.90) 0.027 PT * 18.70 [15.80, 23.42] 22.20 [18.40, 29.50] <0.001 PTT * 38.90 [32.82, 48.18] 45.50 [36.35, 57.55] <0.001 RR * 19.00 [16.00, 23.00] 20.00 [16.00, 23.00] 0.130 SBP 120.19 (23.02) 118.29 (23.28) 0.362 LDH * , U/L 280.50 [208.50, 458.75] 388.50 [246.75, 733.75] <0.001 Sodium, mmol/L 137.10 (6.09) 135.93 (8.22) 0.061 SpO2 97.32 (3.52) 96.59 (3.35) 0.019 Tbil *, umol/L 3.90 [1.70, 9.05] 5.90 [2.30, 16.90] 0.001 WBC *, K/μl 8.80 [5.70, 13.00] 11.40 [7.30, 17.50] <0.001 MAP * 78.00 [69.00, 90.50] 75.50 [65.00, 88.00] 0.116 Temperature,°C 36.72 (0.78) 36.53 (0.95) 0.016 SOFA * 8.00 [6.00, 10.25] 10.00 [8.00, 13.00] <0.001 Magnesium, mmol/L 2.01 (0.47) 2.14 (0.48) 0.002 Gender (%) 0.042 Female 150 (42.1) 62 (32.8) Male 206 (57.9) 127 (67.2) CRRT (%) 44 (12.4) 36 (19.0) 0.049 IMV (%) 216 (60.7) 126 (66.7) 0.199 AF (%) 62 (17.4) 35 (18.5) 0.839 AKI (%) 199 (55.9) 149 (78.8) <0.001 CKD (%) 55 (15.4) 23 (12.2) 0.362 HF (%) 50 (14.0) 27 (14.3) >0.999 RF (%) 128 (36.0) 104 (55.0) <0.001 Sepsis (%) 78 (21.9) 85 (45.0) <0.001 Note. * Mann–Whitney U test ALT, alanine aminotransferase; AST, aspartate aminotransferase; BUN, blood urea nitrogen; DBP, diastolic blood pressure; HR, heart rate; INR, international normalized ratio; PT, prothrombin time; PTT, partial thromboplastin time; RR, respiratory rate; SBP, systolic blood pressure; LDH, lactate dehydrogenase; SpO2, peripheral oxygen saturation; Tbil, total bilirubin; WBC, white blood cell; MAP, mean blood pressure; SOFA, sequential organ failure assessment; CRRT, continuous renal replacement therapy; IMV, invasive mechanical ventilation; AF, atrial fibrillation; AKI, acute kidney injury; CKD, chronic kidney disease; HF, heart failure; RF, respiratory failure.  下载: 导出CSV
Table 2. Comparisons of the Baseline Characteristics at 1-year Follow-up.
Variables Survivors Non-survivors P value N 245 300 Age, years 55.34 (12.48) 59.95 (13.87) <0.001 Albumin, g/dL 3.04 (0.65) 3.02 (0.79) 0.735 ALT * 39.00 [23.00, 146.00] 42.00 [24.00, 105.00] 0.842 AST * 79.00 [45.00, 299.00] 94.00 [50.00, 235.00] 0.470 BUN *, mg/dL 24.50 [14.00, 47.00] 35.00 [19.25, 53.00] <0.001 Calcium, mmol/L 8.18 (1.25) 8.34 (1.06) 0.112 Chloride, mmol/L 104.30 (7.20) 102.09 (8.70) 0.002 Creatinine *, mg/dL 1.10 [0.70, 2.00] 1.60 [1.00, 2.50] <0.001 DBP 67.56 (18.57) 65.79 (18.30) 0.266 Glucose *, mg/dL 123.50 [100.00, 162.00] 118.00 [94.00, 150.00] 0.125 Hematocrit (%) 29.55 (6.01) 29.17 (6.56) 0.489 Hemoglobin,g/dL 9.89 (2.07) 9.67 (2.14) 0.224 HR 92.66 (19.19) 94.29 (21.68) 0.358 INR * 1.70 [1.40, 2.30] 1.90 [1.60, 2.50] 0.009 Lactate *, mmol/L 2.30 [1.50, 3.70] 2.70 [1.90, 4.50] 0.003 Platelet *, K/μl 118.50 [65.00, 173.00] 102.00 [64.75, 166.50] 0.239 Potassium, mmol/L 4.15 (0.86) 4.25 (0.85) 0.152 PT * 18.70 [16.15, 24.45] 20.65 [17.28, 26.60] 0.012 PTT * 38.40 [32.60, 48.80] 43.80 [35.32, 54.45] 0.001 RR * 19.00 [16.00, 23.00] 19.00 [16.00, 23.00] 0.459 SBP 119.91 (21.93) 119.23 (24.07) 0.735 LDH * , U/L 285.50 [213.25, 529.00] 347.00 [230.25, 540.75] 0.276 Sodium, mmol/L 137.16 (6.04) 136.31 (7.55) 0.152 SpO2 97.40 (3.29) 96.79 (3.60) 0.041 Tbil *, umol/L 3.50 [1.70, 8.00] 5.20 [2.20, 13.20] <0.001 WBC *, K/μl 9.25 [6.10, 13.20] 9.90 [6.40, 15.53] 0.089 MAP * 78.00 [69.00, 92.00] 76.00 [66.00, 88.00] 0.083 Temperature,°C 36.77 (0.81) 36.56 (0.86) 0.006 SOFA * 8.00 [6.00, 11.00] 9.00 [7.00, 12.00] <0.001 Magnesium, mmol/L 2.02 (0.49) 2.09 (0.46) 0.083 Gender (%) 0.204 Female 103 (42.0) 109 (36.3) Male 142 (58.0) 191 (63.7) CRRT (%) 27 (11.0) 53 (17.7) 0.039 IMV (%) 158 (64.5) 184 (61.3) 0.503 AF (%) 38 (15.5) 59 (19.7) 0.250 AKI (%) 126 (51.4) 222 (74.0) <0.001 CKD (%) 28 (11.4) 50 (16.7) 0.107 HF (%) 32 (13.1) 45 (15.0) 0.601 RF (%) 91 (37.1) 141 (47.0) 0.026 Sepsis (%) 43 (17.6) 120 (40.0) <0.001 Note. ALT, alanine aminotransferase; AST, aspartate aminotransferase; BUN, blood urea nitrogen; DBP, diastolic blood pressure; HR, heart rate; INR, international normalized ratio; PT, prothrombin time; PTT, partial thromboplastin time; RR, respiratory rate; SBP, systolic blood pressure; LDH, lactate dehydrogenase; SpO2, peripheral oxygen saturation; Tbil, total bilirubin; WBC, white blood cell; MAP, mean blood pressure; SOFA, sequential organ failure assessment; CRRT, continuous renal replacement therapy; IMV, invasive mechanical ventilation; AF, atrial fibrillation; AKI, acute kidney injury; CKD, chronic kidney disease; HF, heart failure; RF, respiratory failure.
下载: 导出CSV
Table 3. The Findings of Univariate and Multivariable Analyses
Chloride Model 1 HR, 95%CI, P value Model 2 HR, 95%CI, P value Model 3HR, 95%CI, P value 28-day death Continuous 0.964 (0.948, 0.981), <0.001 0.962 (0.946, 0.979), <0.001 0.964 (0.948, 0.982), <0.001 Categorical Moderate Reference Reference Reference High 1.052 (0.580, 1.911), 0.866 1.126 (0.619,2.049), 0.697 0.867 (0.471, 1.594), 0.646 Low 1.615 (1.188, 2.195), 0.002 1.624 (1.194,2.209), 0.002 1.424 (1.041, 1.949), 0.027 1-year death Continuous 0.973 (0.959, 0.987), <0.001 0.970 (0.956, 0.984), <0.001 0.974 (0.960, 0.989), 0.001 Categorical Moderate Reference Reference Reference High 1.246 (0.807, 1.923), 0.321 1.335 (0.863,2.065), 0.195 1.071 (0.686, 1.672), 0.764 Low 1.482 (1.164, 1.887), 0.001 1.509 (1.185,1.921), 0.001 1.313 (1.026, 1.679), 0.031 External28-day death Non-Low Reference Reference Reference Low 2.673 (1.085, 6.560), 0.032 2.626 (1.044,6.603), 0.040 4.311 (1.495, 12.432), 0.007 Note. Model 1: Unadjusted.Model 2: Adjusted for gender and ageModel 3: Adjusted for gender, age, SOFA score, CRRT, IMV, AKI, RF, and sepsis
下载: 导出CSV
Table 4. Comparisons of the Baseline Characteristics at 28-day Follow-up of External Cohort.
Survivors Non-survivors P value N 46 22 Age, years 59.13 (13.78) 62.09 (10.19) 0.374 Chloride, mmol/L 105.93 (6.35) 100.18 (5.76) 0.001 SOFA 7.50 [5.00, 10.00] 10.00 [7.25, 14.00] 0.004 Gender (%) >0.999 Female 20 (43.5) 9 (40.9) Male 26 (56.5) 13 (59.1) CRRT (%) 6 (13.0) 1 ( 4.5) 0.514 IMV (%) 13 (28.3) 12 (54.5) 0.067 AKI (%) 17 (37.0) 14 (63.6) 0.071 RF (%) 24 (52.2) 10 (45.5) 0.795 Sepsis (%) 13 (28.3) 6 (27.3) >0.999 Note. SOFA, sequential organ failure assessment; CRRT, continuous renal replacement therapy; IMV, invasive mechanical ventilation; AKI, acute kidney injury; RF, respiratory failure.
下载: 导出CSV
-
[1] Prakash R, Mullen KD. Mechanisms, diagnosis and management of hepatic encephalopathy. Nat Rev Gastroenterol Hepatol, 2010; 7, 515−25. doi: 10.1038/nrgastro.2010.116 [2] Rudler M, Weiss N, Bouzbib C, et al. Diagnosis and management of hepatic encephalopathy. Clin Liver Dis, 2021; 25, 393−417. doi: 10.1016/j.cld.2021.01.008 [3] Vilstrup H, Amodio P, Bajaj J, et al. Hepatic encephalopathy in chronic liver disease: 2014 practice guideline by the American association for the study of liver diseases and the European association for the study of the liver. Hepatology, 2014; 60, 715−35. [4] Elsaid MI, Rustgi VK. Epidemiology of hepatic encephalopathy. Clin Liver Dis, 2020; 24, 157−74. doi: 10.1016/j.cld.2020.01.001 [5] Romero-Gómez M, Montagnese S, Jalan R. Hepatic encephalopathy in patients with acute decompensation of cirrhosis and acute-on-chronic liver failure. J Hepatol, 2015; 62, 437−47. doi: 10.1016/j.jhep.2014.09.005 [6] Berend K, Van Hulsteijn LH, Gans ROB. Chloride: the queen of electrolytes?. Eur J Intern Med, 2012; 23, 203−11. doi: 10.1016/j.ejim.2011.11.013 [7] Neyra JA, Canepa-Escaro F, Li XL, et al. Association of hyperchloremia with hospital mortality in critically ill septic patients. Crit Care Med, 2015; 43, 1938−44. doi: 10.1097/CCM.0000000000001161 [8] Suetrong B, Pisitsak C, Boyd JH, et al. Hyperchloremia and moderate increase in serum chloride are associated with acute kidney injury in severe sepsis and septic shock patients. Crit Care, 2016; 20, 315. doi: 10.1186/s13054-016-1499-7 [9] McCallum L, Jeemon P, Hastie CE, et al. Serum chloride is an independent predictor of mortality in hypertensive patients. Hypertension, 2013; 62, 836−43. doi: 10.1161/HYPERTENSIONAHA.113.01793 [10] Prins KW, Kalra R, Rose L, et al. Hypochloremia is a noninvasive predictor of mortality in pulmonary arterial hypertension. J Am Heart Assoc, 2020; 9, e015221. doi: 10.1161/JAHA.119.015221 [11] Li RG, Chen YX, Liang QH, et al. Lower serum chloride concentrations are associated with an increased risk of death in ICU patients with acute kidney injury: an analysis of the MIMIC-IV database. Minerva Anestesiol, 2023; 89, 166−74. [12] Cuthbert JJ, Bhandari S, Clark AL. Hypochloraemia in patients with heart failure: causes and consequences. Cardiol Ther, 2020; 9, 333−47. doi: 10.1007/s40119-020-00194-3 [13] Cuthbert JJ, Pellicori P, Rigby A, et al. Low serum chloride in patients with chronic heart failure: clinical associations and prognostic significance. Eur J Heart Fail, 2018; 20, 1426−35. doi: 10.1002/ejhf.1247 [14] Johnson AEW, Bulgarelli L, Shen L, et al. MIMIC-IV, a freely accessible electronic health record dataset. Sci Data, 2023; 10, 1. doi: 10.1038/s41597-022-01899-x [15] Chen C, Zhu AH, Ye SK, et al. A new dyslipidemia-based scoring model to predict transplant-free survival in patients with hepatitis E-triggered acute-on-chronic liver failure. Lipids Health Dis, 2023; 22, 80. doi: 10.1186/s12944-023-01826-y [16] Hu XP, Gao J. International normalized ratio and model for end-stage liver disease score predict short-term outcome in cirrhotic patients after the resolution of hepatic encephalopathy. World J Gastroenterol, 2019; 25, 3426−37. doi: 10.3748/wjg.v25.i26.3426 [17] Riggio O, Celsa C, Calvaruso V, et al. Hepatic encephalopathy increases the risk for mortality and hospital readmission in decompensated cirrhotic patients: a prospective multicenter study. Front Med, 2023; 10, 1184860. doi: 10.3389/fmed.2023.1184860 [18] Gallego-Durán R, Hadjihambi A, Ampuero J, et al. Ammonia-induced stress response in liver disease progression and hepatic encephalopathy. Nat Rev Gastroenterol Hepatol, 2024; 21, 774−91. doi: 10.1038/s41575-024-00970-9 [19] Geng C, Xue Y, Yang JH, et al. SIRT1 mediates sestrin1-induced improvement in hepatic insulin resistance. Biomed Environ Sci, 2022; 35, 79−83. [20] Häussinger D, Dhiman RK, Felipo V, et al. Hepatic encephalopathy. Nat Rev Dis Primers, 2022; 8, 43. doi: 10.1038/s41572-022-00366-6 [21] Doyon N, Vinay L, Prescott SA, et al. Chloride regulation: a dynamic equilibrium crucial for synaptic inhibition. Neuron, 2016; 89, 1157−72. doi: 10.1016/j.neuron.2016.02.030 [22] Wang ZY, Choi K. Pharmacological modulation of chloride channels as a therapeutic strategy for neurological disorders. Front Physiol, 2023; 14, 1122444. doi: 10.3389/fphys.2023.1122444 [23] De Koninck Y. Altered chloride homeostasis in neurological disorders: a new target. Curr Opin Pharmacol, 2007; 7, 93−9. doi: 10.1016/j.coph.2006.11.005 [24] Ditch KL, Flahive JM, West AM, et al. Hyperchloremia, not concomitant hypernatremia, independently predicts early mortality in critically ill moderate-severe traumatic brain injury patients. Neurocrit Care, 2020; 33, 533−41. doi: 10.1007/s12028-020-00928-0 [25] Huang KB, Hu YH, Wu YM, et al. Hyperchloremia is associated with poorer outcome in critically ill stroke patients. Front Neurol, 2018; 9, 485. doi: 10.3389/fneur.2018.00485 [26] Bei HZ, You SJ, Zheng D, et al. Prognostic role of hypochloremia in acute ischemic stroke patients. Acta Neurol Scand, 2017; 136, 672−9. doi: 10.1111/ane.12785 [27] Rodríguez-Triviño CY, Castro IT, Dueñas Z. Hypochloremia in patients with severe traumatic brain injury: a possible risk factor for increased mortality. World Neurosurg, 2019; 124, e783−8. doi: 10.1016/j.wneu.2019.01.025 [28] Sumarsono A, Wang JX, Xie LY, et al. Prognostic value of hypochloremia in critically ill patients with decompensated cirrhosis. Crit Care Med, 2020; 48, e1054−61. doi: 10.1097/CCM.0000000000004620 [29] Ji Y, Li LB. Lower serum chloride concentrations are associated with increased risk of mortality in critically ill cirrhotic patients: an analysis of the MIMIC-III database. BMC Gastroenterol, 2021; 21, 200. doi: 10.1186/s12876-021-01797-3 [30] Semmler G, Scheiner B, Balcar L, et al. Disturbances in sodium and chloride homeostasis predict outcome in stable and critically ill patients with cirrhosis. Aliment Pharm Ther, 2023; 58, 71−9. doi: 10.1111/apt.17507 [31] Eliakim R, Shouval D, Eliakim M. Pathophysiological changes associated with increasing grade of hepatic encephalopathy. J Natl Med Assoc, 1988; 80, 986−91. [32] Iwasa M, Sugimoto R, Mifuji-Moroka R, et al. Factors contributing to the development of overt encephalopathy in liver cirrhosis patients. Metab Brain Dis, 2016; 31, 1151−6. doi: 10.1007/s11011-016-9862-6 [33] Wunsch E, Naprawa G, Koziarska D, et al. Serum natremia affects health-related quality of life in patients with liver cirrhosis: a prospective, single centre study. Ann Hepatol, 2013; 12, 448−55. [34] Jiang R, Tang J, Zhang X, et al. CCN1 Promotes inflammation by inducing IL-6 Production viaα6β1/PI3K/Akt/NF-κB pathway in autoimmune hepatitis. Front Immunol, 2022; 13, 810671. doi: 10.3389/fimmu.2022.810671 -

 点击查看大图
计量
- 文章访问数: 91
- HTML全文浏览量: 45
- PDF下载量: 4
- 被引次数: 0

 Quick Links