

 下载:
下载:


-
Varicella, a highly contagious respiratory infection caused by the varicella-zoster virus (VZV), predominantly affects children and is characterized by symptoms such as low-grade fever and vesicular rash[1,2]. In China, varicella remains prevalent, with a steady increase in incidence, peaking at 70.14 cases per 100,000 individuals in 2019[3]. Although the number of reported outbreaks and cases from 2020 to 2022 was lower than those from 2006 to 2012 and 2013 to 2019, varicella continues to pose a significant public health challenge[3]. Major cities such as Beijing, Tianjin, and Shanghai have incorporated the varicella vaccine into their routine immunization programs, resulting in a notable reduction in disease burden and demonstrating cost-effectiveness[4]. In contrast, Fujian Province exerts a high prevalence of varicella, with 58,934 cases and 3 deaths recorded between 2014 and 2018, leading to an annual incidence of 30.65 per 100,000, which has shown an upward trend[5]. In recent years, a two-dose varicella vaccination strategy has been implemented for children aged 12−24 months and 3−4 years in Fujian Province. However, the vaccine has not yet been included in provincial immunization programs, and data on population-level immunity are limited. This study presents a brief analysis of the epidemiological characteristics of varicella in Fujian Province from 2018 to 2024 and introduces a large-scale cross-sectional survey of varicella antibodies conducted in 2023, thereby providing evidence to support varicella prevention and control strategies.
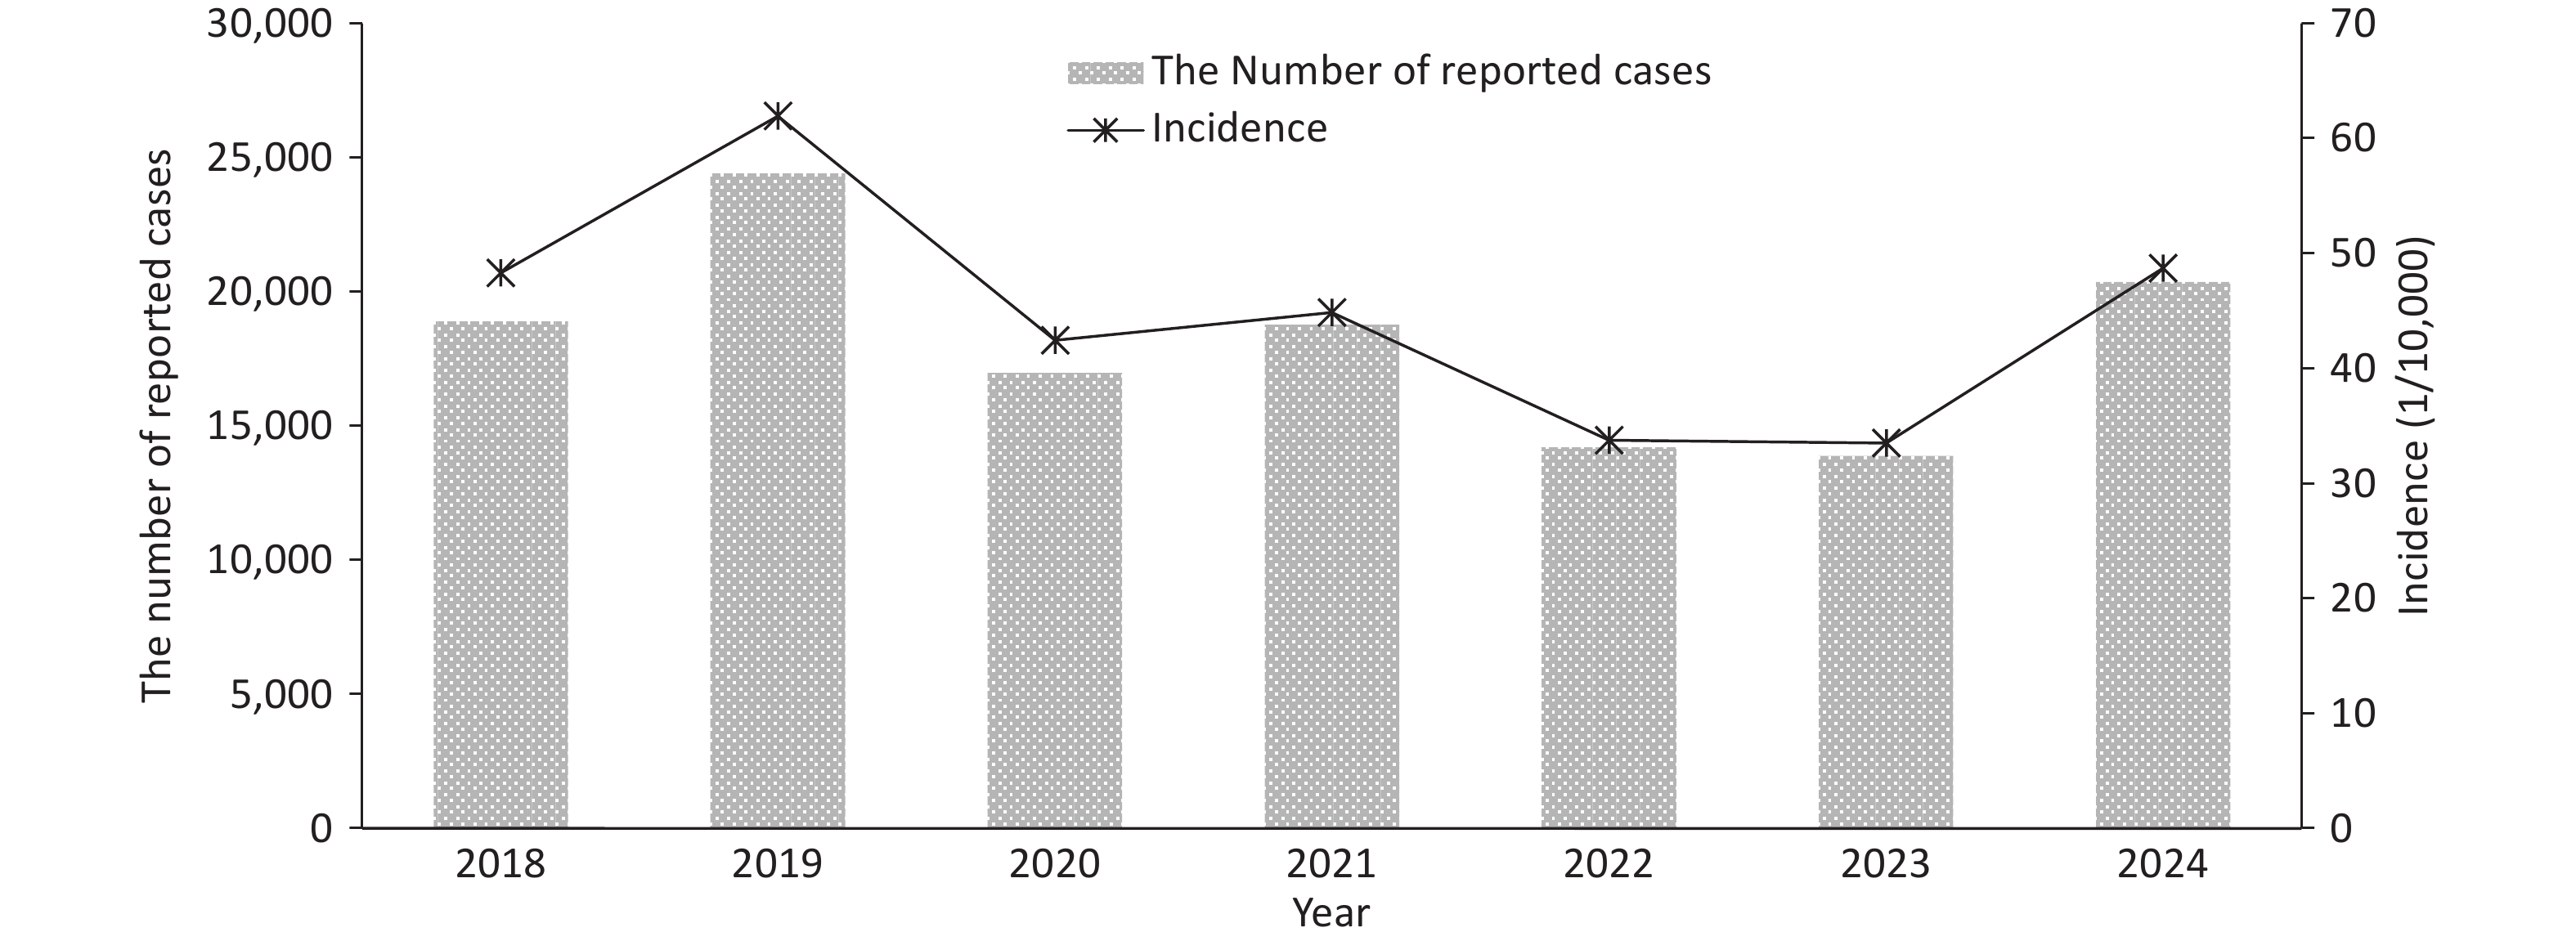
According to surveillance data, 127,478 varicella cases, including two fatalities, were reported in Fujian Province from 2018 to 2024, yielding an average annual incidence of 44.78 per 100,000 individuals. Figure 1 presents that the annual incidence peaked in 2019 (61.93 per 100,000), which remained lower than the national and neighboring provincial rates during the same period[3,6]. Following a gradual decline to 33.50 per 100,000 by 2023, a resurgence was observed in 2024, with an incidence of 48.69 per 100,000. This temporal fluctuation correlated with the COVID-19 containment measures, which non-pharmacological interventions, such as wearing mask and social distancing, effectively reduced the transmission of respiratory pathogens[6,7]. The resurgence observed post-2024 indicates a return to baseline transmission patterns characteristic of VZV epidemiology.

Figure 1. Reported cases of varicella in Fujian Province, 2018-2024.
Consistent with previous studies, the incidence of varicella in Fujian Province from 2018 to 2024 exhibited distinct temporal distribution characteristics.[3,5] The primary peak occurred between October and January of the following year, and the secondary peak was observed from May to July. This pattern likely reflects environmental factors, such as temperature and humidity, as well as population mixing behaviors associated with school terms.[8] Among the reported cases, 69,620 were male and 57,858 female. In the 0−19 years age group, males exhibited significantly higher annual incidence than females (P < 0.001). Conversely, among the individuals aged ≥20 years, females demonstrated higher annual incidences than males (P < 0.001; Figure 2). The predominance among male adolescents may reflect sex-related differences in outdoor activities, hygiene practices, and social exposure risks.[1] In contrast, the predominance among adult females requires further investigation, particularly regarding immunological factors and occupational exposure.
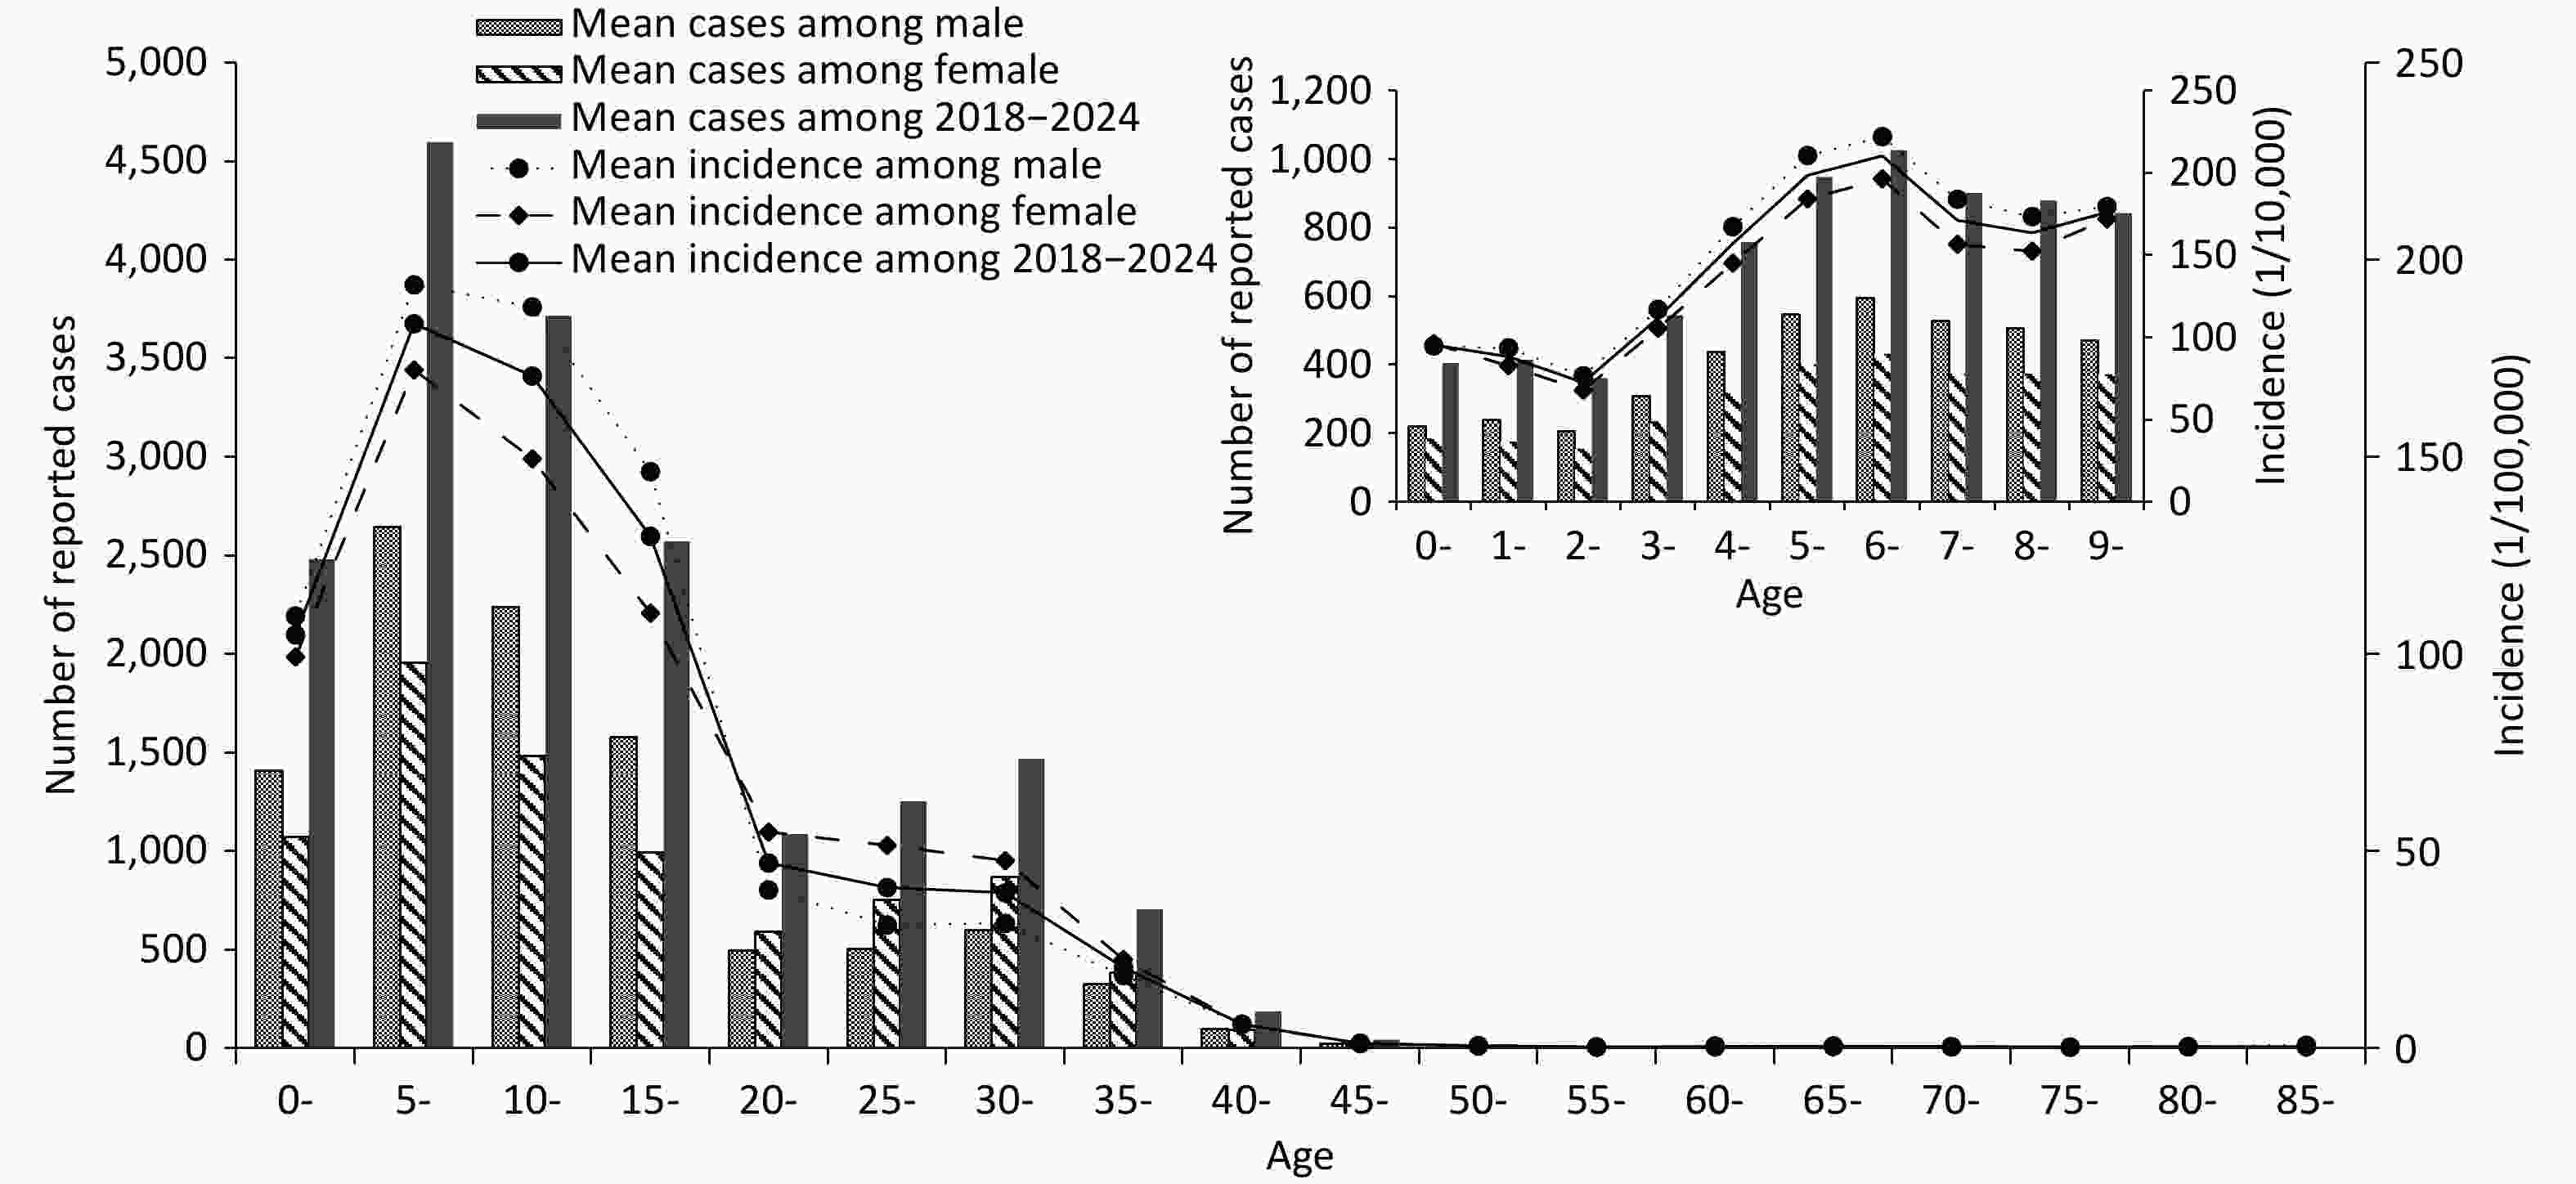
Figure 2. Sex and age distributions of reported varicella cases in Fujian Province, 2018-2024.
From 2018 to 2024, the reported cases of varicella in Fujian Province exhibited the following age distributions: 13.65% in the 0−4 years age group, 25.30% in the 5−9 years group, 20.45% in the 10−14 years group, and 14.15% in the 15−19 years group. Significant differences in the annual incidence were observed across these age groups (P < 0.001). The lowest incidence was recorded among children aged 2 years (72.46 per 100,000), whereas the highest incidence occurred among6-year-olds (210.28 per 100,000). Subsequent fluctuations indicated decreased rates in 7- and 8-year-olds, followed by a secondary peak at 9 years (175.85 per 100,000). A progressive decrease was observed after the age of 10 years, with the incidence falling below 1.0 per 100,000 in individuals aged ≥45 years (Figure 2). Notably, 73.55% of cases occurred in individuals under 20 years, contributing to a considerable economic burden.[1,3] Therefore, children and adolescents should remain the primary focus of varicella prevention and control measures in Fujian Province.
Varicella cases were reported across all prefecture-level cities in Fujian Province, revealing significant regional variations in both cumulative case numbers and incidence rates (P < 0.001). The highest cumulative number of cases were recorded in Xiamen City (35,618), followed by Quanzhou City (22,834), Zhangzhou City (21,794), and Ningde City (13,906). In contrast, Putian City reported the fewest number of cases (3,013). The annual average incidence ranged from 13.92 per 100,000 in Putian to 109.67 per 100,000 in Xiamen. The three regions with the highest incidence rates were Xiamen (109.67 per100,000), Ningde (65.57 per 100,000), and Zhangzhou (61.00 per 100,000), whereas the lowest incidences were observed in Putian, Fuzhou (16.36 per 100,000), and Nanping (22.32 per100,000). These disparities may be attributed to regional factors, such as population density, economic activity, and population mobility.[2,6] Similarly, a study from Chongqing[8] noted a non-random spatial distribution of varicella, with hotspots associated with dense populations, high economic activity, and frequent migration. Comparable conditions in high-incidence cities, such as Xiamen and Quanzhou, which are characterized by substantial immigration and population movement, likely contributed to enhanced disease transmission.
To elucidate the underlying factors contributing to the prevalence of varicella in Fujian Province, a cross-sectional survey was conducted from March to June 2023 across nine randomly selected counties and districts within the province, with two townships selected per county. A total of 5,263 serum samples were collected from participants with a mean age of 17 years, comprising 2,585 males and 2,678 females. Detailed information is presented in Table 1. VZV IgG antibodies were detected using a commercial enzyme-linked immunosorbent assay (ELISA) kit (Virion/Serion, Germany). Seroprevalence and geometric mean concentrations (GMC) were analyzed by region, sex, and age group using SPSS 20.0. Statistical analyses were performed using Pearson’s χ2 and non-parametric tests (Mann-Whitney U), with a significance level set at P < 0.05.
Table 1. VZV IgG seroprevalence and GMC by demographic characteristics (Fujian, 2023)
Characteristics Sample size Seroprevalence, n (%, 95% CI) GMC (mIU/mL) (95% CI) Age (years) 0− 259 33 (12.7, 8.7−16.8) 30.8 (27.1−35.5) 1− 299 8 (27.1, 22.1−32.1) 48.2 (41.8−56.1) 2− 281 139 (49.5, 43.6−55.3) 86.6 (74.0−101.0) 3− 274 153 (55.8, 50.0−61.7) 111.1 (95.8−129.1) 4− 295 158 (53.6, 47.9−59.3) 97.0 (83.3−113.3) 5− 299 152 (50.8, 45.2−56.5) 104.9 (92.1−120.5) 6− 371 190 (51.2, 46.1−56.3) 115.5 (102−130.1) 12− 294 129 (43.9, 38.2−49.6) 91.8 (78.7−108.1) 15− 303 154 (50.8, 45.2−56.4) 115.4 (97.6−137.0) 18− 290 168 (57.9, 52.2−63.6) 139.3 (116.3−168.6) 20− 281 172 (61.2, 55.5−66.9) 146.1 (121.0−177.4) 25− 279 209 (74.9, 69.8−79.9) 244.8 (205.2−293.4) 30− 395 330 (83.5,79.8−87.2) 297.9 (261.4−340.5) 40− 412 393 (95.4, 93.3−97.4) 428.5 (396.4−461.7) 50− 399 387 (97.0, 95.3−98.6) 431.6 (399.4−461.8) ≥60 532 516 (97.0, 95.5−98.4) 486.6 (456.8−516.7) χ2/H − 1,343.3 1,456.9 P value − <0.001 <0.001 Sex (Age,years) Male (≤19) 2,321 1043 (44.9, 42.9−46.9) 84.7(80.1−89.9) Female (≤19) 644 314 (48.8, 44.9−52.6) 103.7(92.9−115.4) χ2/Z − 3.0 4.4 P value − 0.089 <0.001 Male (≥20) 1,004 871 (86.8, 84.7−88.8) 349.1(322.6−377.7) Female (≥20) 1,294 1,136 (87.8, 86.0−89.6) 333.1(311.3−356.7) χ2/Z − 0.6 −3.2 P value − 0.487 0.002 Region Fuzhou 730 448 (61.4, 58.0−65.0) 141.8(127.6−158.3) Longyan 489 330 (67.5, 63.3−71.6) 179.1(157.0−201.4) Nanping 439 224 (51.0, 46.3−55.7) 107.1(93.1−122.0) Ningde 538 332 (61.7, 57.6−65.8) 148.7(131.6−168.0) Putian 519 295 (56.8, 52.6−61.1) 134.0(117.5−153.4) Quanzhou 498 315 (63.3, 59.0−67.5) 148.0(129.7−167.4) Sanming 773 536 (69.3, 66.1−72.6) 181.4(164.4−201.2) Xiamen 711 536 (75.4, 72.2−78.6) 246.8(221.8−273.4) Zhangzhou 566 348 (61.5, 57.3−65.3) 147.2(129.0−168.0) χ2/H − 100.8 122.5 P value − < 0.001 < 0.001 Total 5,263 3,364 (63.9, 62.6−65.2) 157.7(151.3−164.4) Number of vaccine doses 0 737 140 (19.0, 16.2−21.8) 35.2(32.1−38.8) 1 1,336 674 (50.4, 47.8−53.1) 110.7(104.4−117.6) 2 421 318 (75.5, 71.4−79.6) 208.6(189.5−229.3) Unknown 284 136 (47.9, 42.1−53.7) 108.3(88.7−130.2) χ2/H − 375.6 582.8 P value − <0.001 0.001 Total 2,778 1,268 (45.6, 43.8−47.5) 81.3(77.0−85.9) The results (Table 1) demonstrated that, in 2023, the overall seroprevalence of VZV IgG was 63.9%, with a GMC of 157.7 mIU/mL. These values were lower than those reported in cities such as Beijing and Harbin,[2] indicating the need for improvement in population immunity. Significant age-dependent variations were observed in both seroprevalence and GMC levels (P < 0.001). Infants under 1 year exhibited the lowest seroprevalence (12.7%) and GMC (30.8 mIU/mL), likely resulting from waning maternal antibodies[1]. A sharp increase was noted among 1-to 2-year-olds (49.5%, 86.6 mIU/mL), coinciding with the recommended first dose of the varicella vaccine at age 1. Seroprevalence stabilized between 43.9% and 53.6% among 4-17-year-olds (P = 0.115), whereas GMC increased steadily from 115.4 mIU/mL at age 15 to 486.6 mIU/mL after age 60. The high seroprevalence and GMC in older adults reflect cumulative natural exposure and persistence of durable antibodies[2,9]. The incidence was highest in children aged 5–14 years, peaking at the age of 6 years (210.28/100,000), which is consistent with previously reported local epidemiological trends[5]. The relatively low seroprevalence (51.2%) and GMC (115.5 mIU/mL) in this age group may explain its high disease burden. The decline in incidence after the age of 7 years is likely attributable to preschool booster vaccinations.[10]
No significant sex-based difference in seroprevalence was found in the 0–19 years age group (P = 0.089), although females had a higher GMC (P < 0.001). In adults ≥20 years, no difference in seroprevalence was observed (P = 0.487); However, males showed higher GMC (P = 0.002). This result is partly related to the difference in incidence between men and women before and after 20 years, and GMC was negatively correlated with incidence. The biological and behavioral factors underlying these patterns require further investigation.
Xiamen, Sanming, and Longyan exhibited the highest seroprevalence (75.4%, 69.3%, and 67.5%, respectively) and GMC (246.8, 181.4, and 179.1 mIU/mL, respectively), whereas Nanping, Putian, and Fuzhou had the lowest. These differences may have been influenced by varying vaccination coverage driven by economic factors and vaccine awareness. For instance, the first-dose vaccination coverage among eligible children in Xiamen, Sanming, and Longyan exceeded 73%. However, the province-wide second-dose rate remained low at 30%, which is significantly below the 80% threshold recommended by the World Health Organization (WHO) to achieve herd immunity.[1] Additionally, the increased incidence of varicella in Xiamen and the surrounding areas may also contribute to the observed elevated seroprevalence and GMC.
Numerous studies have demonstrated that receiving two doses of the varicella vaccine provides significantly stronger protective effect than a single dose[1,9,10]. This finding is consistent with data from Fujian Province in 2023, based on a study of 2,778 children aged 0–17 years, among whom 63.2% received at least one dose of the vaccine. The results (Table 1) demonstrated a significantly higher seroprevalence and GMC in two-dose recipients than in those who received only one dose (P < 0.001). These findings suggest that a two-dose schedule may provide enhanced protection. Additionally, children with unknown vaccination histories exhibited intermediate values.
This study has several limitations. First, it relied primarily on epidemiological data from 2018 to 2024, and the serosurvey conducted in 2023 provided only a cross-sectional snapshot of antibody levels at a single time point without assessing antibody waning over time or differentiating between naturally acquired and vaccine-induced immunity. Second, the study did not clearly distinguish between the effects of natural infection and vaccination on seroprevalence, which may have led to an underestimation of the long-term protective efficacy of the vaccine. Nevertheless, this study offers a comprehensive description of the epidemiology and seroimmunity of varicella in Fujian Province, providing valuable insights for prevention and control strategies.
doi: 10.3967/bes2025.142
Epidemiological Characteristics of Varicella and Population Immunity Against Varicella-Zoster Virus in Fujian Province, China, from 2018 to 2024
-
Dong Li conceived the design, and Shijia Wu, Zhifei Chen, Suhan Zhang, and Hairong Zhang performed the ELISA experiments and analyzed the data. Dong Li and Shijia Wu wrote the manuscript. Weiyi Pan, Xiuhui Yang, and Yong Zhou supervised the study and reviewed the manuscript. We would like to express our deepest gratitude to all the unnamed participants in the study. In particular, the CDC staff at all levels were involved in the serosurvey.
The authors declare no conflicts of interest.
The survey was conducted by public health agencies as part of their statutory mandate for routine surveillance and was therefore classified as minimal-risk research. No confidential information was collected, and the study was exempted from ethical approval by the Medical Ethics Committee of the Fujian Provincial Center for Disease Control and Prevention.
&These authors contributed equally to this work.
注释:1) Authors’ Contributions: 2) Competing Interests: 3) Ethics: -
Figure 2. Sex and age distributions of reported varicella cases in Fujian Province, 2018-2024.
Table 1. VZV IgG seroprevalence and GMC by demographic characteristics (Fujian, 2023)
Characteristics Sample size Seroprevalence, n (%, 95% CI) GMC (mIU/mL) (95% CI) Age (years) 0− 259 33 (12.7, 8.7−16.8) 30.8 (27.1−35.5) 1− 299 8 (27.1, 22.1−32.1) 48.2 (41.8−56.1) 2− 281 139 (49.5, 43.6−55.3) 86.6 (74.0−101.0) 3− 274 153 (55.8, 50.0−61.7) 111.1 (95.8−129.1) 4− 295 158 (53.6, 47.9−59.3) 97.0 (83.3−113.3) 5− 299 152 (50.8, 45.2−56.5) 104.9 (92.1−120.5) 6− 371 190 (51.2, 46.1−56.3) 115.5 (102−130.1) 12− 294 129 (43.9, 38.2−49.6) 91.8 (78.7−108.1) 15− 303 154 (50.8, 45.2−56.4) 115.4 (97.6−137.0) 18− 290 168 (57.9, 52.2−63.6) 139.3 (116.3−168.6) 20− 281 172 (61.2, 55.5−66.9) 146.1 (121.0−177.4) 25− 279 209 (74.9, 69.8−79.9) 244.8 (205.2−293.4) 30− 395 330 (83.5,79.8−87.2) 297.9 (261.4−340.5) 40− 412 393 (95.4, 93.3−97.4) 428.5 (396.4−461.7) 50− 399 387 (97.0, 95.3−98.6) 431.6 (399.4−461.8) ≥60 532 516 (97.0, 95.5−98.4) 486.6 (456.8−516.7) χ2/H − 1,343.3 1,456.9 P value − <0.001 <0.001 Sex (Age,years) Male (≤19) 2,321 1043 (44.9, 42.9−46.9) 84.7(80.1−89.9) Female (≤19) 644 314 (48.8, 44.9−52.6) 103.7(92.9−115.4) χ2/Z − 3.0 4.4 P value − 0.089 <0.001 Male (≥20) 1,004 871 (86.8, 84.7−88.8) 349.1(322.6−377.7) Female (≥20) 1,294 1,136 (87.8, 86.0−89.6) 333.1(311.3−356.7) χ2/Z − 0.6 −3.2 P value − 0.487 0.002 Region Fuzhou 730 448 (61.4, 58.0−65.0) 141.8(127.6−158.3) Longyan 489 330 (67.5, 63.3−71.6) 179.1(157.0−201.4) Nanping 439 224 (51.0, 46.3−55.7) 107.1(93.1−122.0) Ningde 538 332 (61.7, 57.6−65.8) 148.7(131.6−168.0) Putian 519 295 (56.8, 52.6−61.1) 134.0(117.5−153.4) Quanzhou 498 315 (63.3, 59.0−67.5) 148.0(129.7−167.4) Sanming 773 536 (69.3, 66.1−72.6) 181.4(164.4−201.2) Xiamen 711 536 (75.4, 72.2−78.6) 246.8(221.8−273.4) Zhangzhou 566 348 (61.5, 57.3−65.3) 147.2(129.0−168.0) χ2/H − 100.8 122.5 P value − < 0.001 < 0.001 Total 5,263 3,364 (63.9, 62.6−65.2) 157.7(151.3−164.4) Number of vaccine doses 0 737 140 (19.0, 16.2−21.8) 35.2(32.1−38.8) 1 1,336 674 (50.4, 47.8−53.1) 110.7(104.4−117.6) 2 421 318 (75.5, 71.4−79.6) 208.6(189.5−229.3) Unknown 284 136 (47.9, 42.1−53.7) 108.3(88.7−130.2) χ2/H − 375.6 582.8 P value − <0.001 0.001 Total 2,778 1,268 (45.6, 43.8−47.5) 81.3(77.0−85.9)  下载: 导出CSV
-
[1] Leung J, Broder KR, Marin M. Severe varicella in persons vaccinated with varicella vaccine (breakthrough varicella): a systematic literature review. Expert Rev Vaccin, 2017; 16, 391−400. doi: 10.1080/14760584.2017.1294069 [2] Meng QH, Cheng XP, Liu DD, et al. One single-center cross-sectional investigation on varicella antibody level of all age groups in Chinese people. Hum Vaccin Immunother, 2021; 17, 358−62. doi: 10.1080/21645515.2020.1784653 [3] Wang MM, Li XD, You MY, et al. Epidemiological characteristics of varicella outbreaks - China, 2006-2022. China CDC Wkly, 2023; 5, 1161−6. doi: 10.46234/ccdcw2023.218 [4] Sui HT, Guo Y, Wang B, et al. Global varicella vaccination strategy in children and research progress. Chin J Viral Dis, 2023; 13, 294−8. (In Chinese) [5] Qi XQ, Zhu HS, Chen W, et al. Epidemiological characteristics and trend prediction of varicella in Fujian Province from 2014 to 2018. Chin J Dis Control Prev, 2021; 25, 43−7,112. (In Chinese) [6] Xuan K, Zhang N, Li T, et al. Epidemiological characteristics of varicella in Anhui Province, China, 2012-2021: surveillance study. JMIR Public Health Surveill, 2024; 10, e50673. doi: 10.2196/50673 [7] Hirae K, Hoshina T, Koga H. Impact of the COVID-19 pandemic on the epidemiology of other communicable diseases in Japan. Int J Infect Dis, 2023; 128, 265−71. doi: 10.1016/j.ijid.2023.01.013 [8] Zhu H, Zhao H, Ou R, et al. Spatiotemporal epidemiology of varicella in Chongqing, China, 2014-2018. Int J Environ Res Public Health, 2020; 17, 662. doi: 10.3390/ijerph17020662 [9] Shapiro ED, Marin M. The effectiveness of varicella vaccine: 25 years of postlicensure experience in the United States. J Infect Dis, 2022; 226, S425−30. doi: 10.1093/infdis/jiac299 [10] Wang M, Zeng X, Zhang YP, et al. Epidemiological characteristics of varicella public health emergency events in China, 2007-2021. Chin J Vaccin Immun, 2023; 29, 274−9. (In Chinese) -

 点击查看大图
图(2) / 表ll (1)
计量
- 文章访问数: 5
- HTML全文浏览量: 2
- PDF下载量: 0
- 被引次数: 0

 Quick Links