

 下载:
下载:

-
In 2021, approximately 537 million people suffered from diabetes mellitus (DM) globally, and this figure will increase to approximately 783 million within the next quarter-century. The increasing burden of DM is a pressing global public health issue. Therefore, the early identification of high-risk groups and implementation of effective intervention measures is imperative.
Heavy metals (HMs), such as barium (Ba), cadmium (Cd), cobalt (Co), strontium (Sr), and thallium (Tl), are widely distributed in the environment. Epidemiological studies have reported positive associations between DM and Ba, Cd, and Sr in the general population, whereas Co has shown no significant association. In contrast, research in pregnant women has found that Co and Tl are positively associated with gestational diabetes mellitus (GDM)[1]. Evidence on these HMs, particularly in older populations, remains inconsistent or scarce. Therefore, it is essential to investigate the combined effects of HM mixtures on DM in older adults. Apolipoprotein E (APOE) plays a central role in lipid metabolism. Its association with DM is inconsistent across epidemiological studies, with reports ranging from no association or protective effects to an increased risk. Despite evidence linking APOE ε4 to higher body burdens of HMs[2], and findings that Cd upregulates APOE expression to synergistically worsen vascular damage in ε4-carrying mice[3], whether APOE ε4 interacts with single or combined HM exposures to influence DM risk remains unclear.
Therefore, we conducted a 1:1 matched case-control study to explore whether the relationship between individual HMs, their mixture, and DM is modified by the APOE ε4 allele among Chinese older adults, aiming to provide novel insights for prevention.
This study utilized baseline data from the Older Adults Health and Modifiable Factors cohort study conducted in Lu'an and Fuyang City, Anhui Province, China. Detailed sampling methods, sample testing, genotyping procedures, and results are described in the supplementary material and in previous studies (Supplementary Table S2 and S3). DM was defined by a prior physician diagnosis, active use of glucose-lowering medication (insulin or oral agents), or a fasting plasma glucose level of ≥ 7.0 mmol/L based on the Standards of Medical Care in Diabetes. All cases of DM were diagnosed within the past year. All study procedures were approved by the Research Ethics Committee of Anhui Medical University (Approval Nos. 20170284 and 20170261). Written informed consent was obtained from all participants. Conditional logistic regression models were applied to evaluate the associations between individual HMs, APOE genotypes, and DM. Generalized additive models (GAMs) were fitted using smoothing splines with knots (10th, 50th, and 90th percentiles). The combined effects of the five HMs were evaluated by quantile g-computation (QGC) and Bayesian kernel machine regression (BKMR). We excluded patients with chronic kidney disease or chronic liver disease from the sensitivity analysis. When a significant interaction was detected (Pinteraction < 0.1), subgroup analyses were conducted stratified by APOE ε4 status, and results were visualized using BKMR. For main effects, P < 0.05 were considered statistically significant. For interaction terms, P < 0.1 were considered statistically significant[4].
Supplementary Table S1 presents the baseline characteristics of the participants. The average age of the participants was 71.04 ± 5.75 years. The limits of detection and detection rates of all HMs are presented (Supplementary Table S4). Correlation analysis between HMs revealed significant pairwise correlations (Supplementary Table S5). In our study, 17.5% and 82.5% were carriers (APOE ε4+) and non-carriers (APOE ε4–) of the APOE ε4 allele, respectively (Supplementary Table S6).
The significant positive associations with DM were observed for Cd [odd ratio (OR) = 1.31, 95% confidence interval (CI): 1.09–1.59] and Tl (OR = 1.17, 95% CI: 1.02–1.35, P = 0.024, but P = 0.060 after Franklin Delano Roosevelt [FDR] multiple correction). Dose-response analysis further confirmed a significant linear association between DM and Cd (Ptrend = 0.005) and Tl (Ptrend = 0.016) (Table 1). GAMs supported linear exposure-response relationships for HMs (Supplementary Figure S1). The APOE ε4 genotype was not significantly associated with DM (OR = 1.14, 95% CI: 0.78–1.66) (Table 2).
Table 1. Associations between heavy metals (HMs) and diabetes mellitus based on conditional logistic regression (n = 1000)
HMs a Continuous OR (95% CI) FDR Q1 Q2 OR (95% CI) Q3 OR (95% CI) Q4 OR (95% CI) P-value for trend b Ba Model 1 1.08 (0.92–1.28) 0.410 Ref 1.01 (0.71–1.44) 1.12 (0.79–1.58) 1.06 (0.75–1.50) 0.645 Model 2 1.19 (0.96–1.49) 0.153 Ref 1.10 (0.72–1.67) 1.08 (0.70–1.68) 1.27 (0.80–2.00) 0.329 Model 3 1.07 (0.84–1.36) 0.745 Ref 1.07 (0.68–1.67) 0.93 (0.58–1.51) 1.00 (0.59–1.70) 0.771 Cd Model 1 1.15 (0.99–1.32) 0.098 Ref 0.95 (0.67–1.36) 1.48 (1.04–2.10) 1.55 (1.08–2.23) 0.003 Model 2 1.31 (1.09–1.59) 0.025 Ref 1.12 (0.73–1.72) 1.65 (1.07–2.55) 1.80 (1.12–2.92) 0.005 Model 3 1.28 (1.05–1.56) 0.073 Ref 1.09 (0.70–1.71) 1.77 (1.12–2.82) 1.81 (1.08–3.03) 0.017 Co Model 1 1.22 (1.06–1.40) 0.013 Ref 1.16 (0.82–1.65) 1.53 (1.06–2.21) 1.34 (0.95–1.90) 0.058 Model 2 1.14 (0.97–1.35) 0.153 Ref 0.89 (0.58–1.36) 1.30 (0.84–2.03) 1.13 (0.74–1.71) 0.376 Model 3 1.02 (0.85–1.23) 0.794 Ref 0.80 (0.51–1.27) 1.22 (0.76–1.95) 0.86 (0.54–1.36) 0.766 Sr Model 1 1.40 (1.18–1.65) 0.001 Ref 1.66 (1.16–2.38) 1.62 (1.13–2.33) 2.10 (1.46–3.02) < 0.001 Model 2 1.15 (0.93–1.44) 0.194 Ref 1.22 (0.78–1.91) 0.97 (0.61–1.56) 1.47 (0.92–2.34) 0.185 Model 3 1.09 (0.85–1.40) 0.745 Ref 1.31 (0.82–2.11) 0.90 (0.55–1.47) 1.49 (0.89–2.51) 0.203 Tl Model 1 1.05 (0.94–1.17) 0.410 Ref 1.14 (0.80–1.63) 1.03 (0.73–1.45) 1.03 (0.73–1.46) 0.997 Model 2 1.17 (1.02–1.35) 0.060 Ref 0.86 (0.55–1.33) 0.85 (0.55–.32) 1.67 (1.08–2.57) 0.016 Model 3 1.16 (0.99–1.36) 0.157 Ref 0.82 (0.51–1.31) 0.82 (0.51–1.32) 1.71 (1.03–2.82) 0.026 Note. OR, odds ratio; CI, confidence interval; FDR, Franklin Delano Roosevelt; HMs, heavy metals; Ref, reference; Ba, barium; Cd, cadmium; Co, cobalt; Sr, strontium; Tl, thallium; Q, quartile. Bold values indicate statistical significance. a Concentrations of HMs were ln-transformed and standardized for analysis. b P-value for trend was calculated using the median values of each quartile, standardized after ln transformation, as a continuous variable in the conditional logistic regression model. Model 1 was unadjusted. Model 2 was adjusted for age, residence, marital status, education level, family economy, occupation, physical activity, alcohol consumption, smoking, BMI, dietary habits, hypertension, liver disease, kidney disease, and city of residence.In Model 3, the covariates from Model 2 were included along with the other HMs. Table 2. Association between APOE genotype and diabetes mellitus (n = 1000)
Genotype a Model 1 Model 2 OR (95% CI) P-value OR (95% CI) P-value APOE- Ref Ref APOE+ 1.10 (0.80–1.51) 0.569 1.14 (0.78–1.66) 0.498 Note. OR, odds ratio; CI, confidence interval; Ref, reference; APOE, apolipoprotein E.
a APOE genotype was classified into two categories: APOE- (individuals without the ε4 allele) and APOE+ (individuals with the ε4 allele).
Model 1 was unadjusted.
Model 2 was adjusted for age, residence, marital status, education level, family economy, occupation, physical activity, alcohol consumption, smoking, BMI, dietary habits, hypertension, liver disease, kidney disease, and city of residence.The QGC model indicated a significant positive combined effect, with a simultaneous one-quantile increase in all HMs resulting in an OR of 1.44 (95% CI: 1.13–1.84) for DM, corresponding to a 44% increase in odds (Supplementary Figure S2A). All HMs except Co exhibited positive weights, with Cd contributing the most (weight = 0.489), followed by Tl, Ba, and Sr. Furthermore, cumulative exposure to the HM mixture showed a significant linear dose-response relationship with DM (Supplementary Figure S2B). BKMR demonstrated results similar to those of QGC (Supplementary Figures S3A–S3C). Specifically, Cd was identified as the primary driver, exhibiting the steepest exposure-response curves when the other HMs were fixed at their medians (Supplementary Figure S3A). This is consistent with the high posterior inclusion probability (PIP: Cd = 0.707) (Supplementary Figure S3C). Supplementary Figure S3B shows that when all HM concentrations increased simultaneously from the 25th to the 75th percentiles, the HM mixture was positively associated with DM. Supplementary Figure S4 further suggests the possible interactions between the HMs.
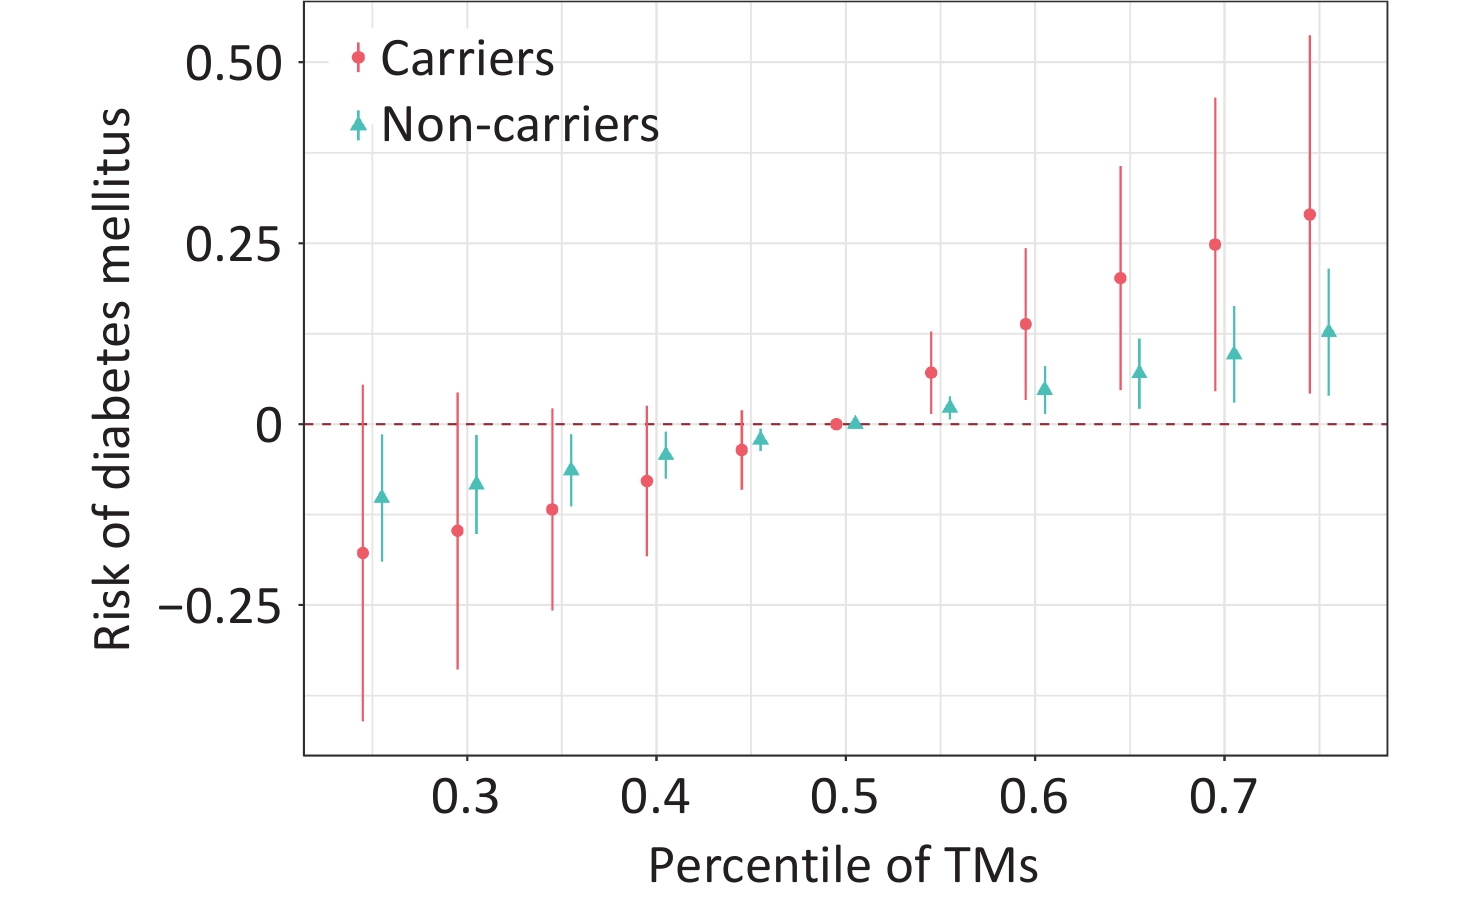
The interaction effects between individual HMs and the APOE ε4 genotype are presented in Supplementary Table S7. A significant interactive effect between HM mixture and APOE ε4 on DM was observed (Pinteraction = 0.070) (Supplementary Figure S5). In stratified analyses, the association between HM mixture and DM was more pronounced among APOE ε4 carriers (OR = 2.05) and weaker among non-carriers (OR = 1.42). Consistently, the BKMR model demonstrates that APOE ε4 carriers exhibited a more pronounced increase in DM prevalence at higher percentiles of the HM mixture (Figure 1). The results of the sensitivity analyses are presented in Supplementary Table S8 and S9, Supplementary Figure S6 and S7, and are consistent with the main analysis.
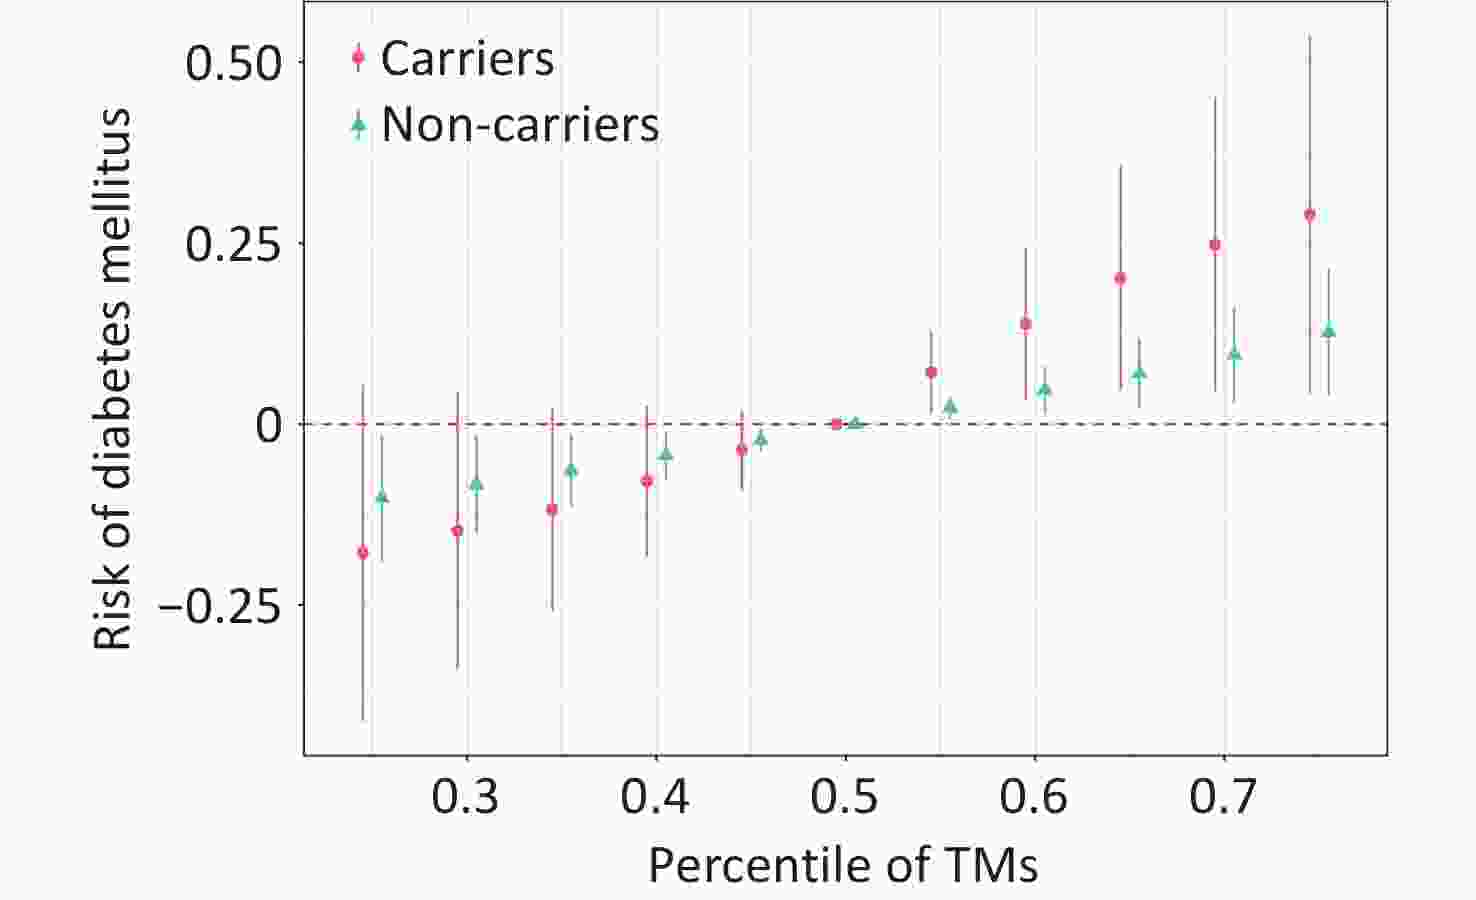
Figure 1. The overall association estimates for the heavy metal (HM) mixture and diabetes mellitus (DM), stratified by APOE genotype, were derived using Bayesian kernel machine regression (BKMR) models, with 95% confidence intervals. Comparisons were made between HMs at specific percentiles (from 0.25 to 0.75, incremented by 0.05) and their values at the 50th percentile. The model was adjusted for age, residence, marital status, education level, family economy, occupation, physical activity, alcohol consumption, smoking, BMI, dietary habits, hypertension, liver disease, kidney disease, and city of residence. APOE genotype was categorized as APOE- vs. APOE+ depending on the ε4 allele. HMs were ln-transformed and standardized. Abbreviations: CI, confidence interval; APOE, apolipoprotein E; HMs, heavy metals.
Our findings offer novel evidence regarding the joint effects of the APOE genetic background and environmental HM exposure on DM. Both the QGC and BKMR models identified an overall positive association between the HM mixture and DM, with Cd emerging as the most prominent contributor within the mixture. Furthermore, compared to non-carriers, individuals carrying the APOE ε4 allele exhibited an elevated odd of DM when exposed to the HM mixture, highlighting a potential gene-environment interaction.
The median blood concentrations of Ba (42.21 µg/L), Cd (1.07 µg/L), Co (0.14 µg/L), and Tl (0.06 µg/L) were consistent with those reported in other studies. The blood Sr concentration (25.69 µg/L) was slightly higher than previously reported median ranges (16.60–23.5 µg/L)[5]. Blood biomarkers offer certain advantages in the assessment of HM exposure. First, the blood HM levels are not influenced by renal function or hydration status. Second, blood sampling is standardized and is less affected by external factors, ensuring higher analytical reliability.
Our results from the single-HM analysis are consistent with existing evidence. Notably, Cd showed a robust dose-dependent positive association with DM, a finding supported by extensive literature. Animal studies have demonstrated that Cd induces insulin resistance, damages the pancreatic beta cells, and disrupts insulin secretion[3]. Additionally, Cd impairs mitochondrial function, promotes lipid peroxidation, and triggers inflammatory responses involving neutrophil activation and release of pro-inflammatory cytokines. Collectively, these findings suggest that Cd influences DM via pathways involving metabolic disruption, oxidative stress, and inflammation.
Tl was significantly and positively associated with DM (P = 0.024). However, after correcting for multiple comparisons, the statistical strength of this association decreased (PFDR = 0.060). The association between Tl and DM may not be as robust as that between Cd and DM. However, this does not eliminate the potential adverse effects of Tl. In the QGC and BKMR models, Tl was identified as a key contributor to DM. Recent population studies reported a positive correlation between Tl and DM, which is potentially related to the induction of mitochondrial oxidative stress. Therefore, although the evidence from single models appears less stable under strict multiple testing correction, the role of Tl in HM mixture-driven DM remains noteworthy when considering the dose-response relationship and mixture analysis results.
No significant associations were observed between Ba, Sr, and Co and DM. However, the GAM indicated a statistically significant nonlinear relationship between Ba and DM, suggesting that Ba may exhibit a complex dose-response pattern that is not captured by linear models. Previous studies have reported positive correlations between Ba, Sr, and Co and DM. These differences may arise from variations in population characteristics and biomarker assessment methods. Notably, the age-related decline in renal function may affect metal excretion. Therefore, blood biomarkers may be more suitable for use in older populations.
Given that environmental exposure inherently involves the coexistence of multiple pollutants, assessing their combined effects is crucial for understanding the real health risks. Our QGC and BKMR results demonstrated a positive association between the HM mixture and DM in older individuals. These models clarify the dominant role of Cd. Ba and Tl were considered to be important contributors in the mixture model, showing inconsistent significance in QGC and BKMR. This finding suggests that Ba and Tl may not act as strong independent factors, but rather as important synergistic components within the HM mixture. Co-exposure to multiple HMs may lead to additive or synergistic effects, amplifying toxicity beyond the impact of the individual HMs. Nguyen (2023) highlighted the “AGE-RAGE signaling pathway in diabetic complications” and specific microRNAs (including has-miR-98-5p, hsa-let-7a-5p, and hsa-miR-34a-5p) as the central mechanisms underlying the association between mixed metal exposure and DM[6]. The interactions between HMs are critical for understanding their health impacts. Future studies, particularly large-scale prospective investigations, should prioritize the evaluation of such interactions to better elucidate the complex relationships between co-exposure and disease risk.
In contrast to previous studies, our results did not identify a statistically significant association between APOE ε4 and DM. These differences can be attributed to several factors. First, the genetic backgrounds and characteristics of the study population may have varied. The effect of APOE ε4 on metabolism may differ due to factors such as ethnicity, age, baseline metabolic health status, and coexisting environmental exposures. Most importantly, growing evidence suggests that APOE polymorphism may not act as an independent risk factor for DM; rather, its effects appear to be modulated by environmental exposure. The main finding of this study that APOE ε4 significantly modifies the association between HMs and DM strongly supports this perspective.
Moreover, our results demonstrated an interaction between the APOE ε4 allele and exposure to an HM mixture (particularly one driven by Cd) on DM. The allele itself showed no independent association with DM; however, its presence enhanced the positive association between the HM mixture and DM. This suggests that APOE ε4 may amplify the metabolic disturbances associated with these environmental exposures. Although direct evidence linking APOE ε4 and HM co-exposure to DM remains limited, several biological mechanisms support this finding, particularly in key pathways such as oxidative stress and inflammation. On one hand, the APOE ε4 allele is associated with pro-oxidative and pro-inflammatory states. Compared to other isoforms, the APOE ε4 protein is less efficient in regulating lipid metabolism and clearance, which is more likely to lead to cellular lipid accumulation and lipid peroxidation, thereby exacerbating oxidative stress and triggering stronger neuroinflammation and systemic inflammatory responses[7], as well as interfering with insulin signaling pathways[8]. On the other hand, Cd is a potent inducer of oxidative stress. Cd can directly induce mitochondrial dysfunction, leading to a significant generation of reactive oxygen species. Moreover, animal studies have shown that Cd upregulates APOE expression and induces oxidative stress[3]. Furthermore, the HM mixture can interact with APOE and other genes, triggering apoptosis, inflammatory responses, and the disruption of glucose metabolism. Therefore, we hypothesize that in APOE ε4 carriers, Cd-induced upregulation of APOE results in functionally defective ε4 protein, which not only fails to effectively counteract oxidative damage but may also exacerbate intracellular lipid disorder and stress signaling, forming a harmful positive feedback loop that ultimately impairs glucose metabolism and contributes to the onset of DM[9]. For individuals carrying the APOE ε4 allele, whose antioxidant defense capacity is already relatively weak, the additional oxidative burden imposed by Cd-dominated HM is more likely to exceed critical thresholds, thereby triggering widespread apoptosis and inflammatory cascade responses. Oxidative stress and chronic inflammation are the central drivers of insulin resistance. These processes interfere with tyrosine phosphorylation of insulin receptor substrates by activating inflammatory signaling pathways such as c-jun N-terminal kinase and nuclear factor kappa-B, thereby blocking downstream insulin signaling[10]. Consequently, the baseline functional impairment associated with APOE ε4 and intense oxidative stress and inflammation induced by HM exposure may exert a synergistic effect through these pathways, collectively leading to the collapse of glucose metabolic homeostasis. Future research, particularly epidemiological studies combined with biomarkers (such as oxidative stress markers and inflammatory factors) and dedicated toxicological experiments, are crucial for validating this hypothesis.
A principal methodological advantage of this investigation was the utilization of integrative statistical models, such as QGC and BKMR, to assess the joint impact of co-exposure to multiple HMs on DM risk. This study has several limitations that merit consideration. 1) Owing to the case-control design of this study, causality could not be inferred from, thereby necessitating future validation. 2) A single blood measurement may misrepresent long-term exposure. We selected a limited number of HMs, which may not have adequately captured the complexity of environmental exposures. 3) Residual confounding from unmeasured metals and comorbidities could not be ruled out. 4) Although guided by a P < 0.1 threshold alongside consistency and biological plausibility, the increased risk of false positives necessitates the cautious interpretation of positive signals. 5) Generalizability may be constrained by the regional nature of the study and ethnicity-specific genetic effects. Additionally, the small number of APOE ε4 homozygotes required combining them with heterozygotes, warranting examination in larger cohorts.
In summary, this study identified Cd as a key driver of the association between HM mixture and DM, with the APOE ε4 genotype acting as an effective modifier. This provides new evidence for gene-environment interactions in DM pathogenesis. Despite these limitations, our results underscore the potential importance of implementing targeted strategies to reduce HM exposure, particularly among individuals carrying the APOE ε4 allele, for the prevention and control of DM. Future studies should adopt prospective designs with larger and more diverse cohorts to assess these results and further examine the interplay between genetic susceptibility and mixed environmental exposure.
doi: 10.3967/bes2026.004
APOE ε4 Allele Modifies the Association of Heavy Metals and their Mixture with Diabetes Mellitus among Chinese Community-dwelling Older Adults
-
Writing-original draft, Investigation, Data curation, Methodology, Formal analysis, and Validation: Lili Yao, Ying Cao, Beibei Yin, Qiang Liu; Investigation, Data curation, Validation, and Methodology: Fusheng Lin, Xuqiu Cheng, Ziwei Tian; Investigation, Data curation, Validation, Methodology, and Funding acquisition: Linsheng Yang; Investigation and Data Curation: Hongjuan Cao, Liang Sun, Fangbiao Tao; Investigation, Data Curation, Validation, and Writing-review and Editing: Li Wang; Investigation, Data curation, Validation, Funding acquisition, and Writing-review and editing: Guimei Chen.
The authors declare that they have no known competing financial interests or personal relationships that could have influenced the work reported in this paper.
All study procedures were conducted in accordance with the Declaration of Helsinki and were approved by the Research Ethics Committee of Anhui Medical University (Approval Nos. 20170284 and 20170261).
Data generated in this study is available from the corresponding authors upon reasonable request.
&These authors contributed equally to this work.
注释:1) Authors’ Contributions: 2) Competing Interests: 3) Ethics: 4) Availability of Data and Materials: -
Figure 1. The overall association estimates for the heavy metal (HM) mixture and diabetes mellitus (DM), stratified by APOE genotype, were derived using Bayesian kernel machine regression (BKMR) models, with 95% confidence intervals. Comparisons were made between HMs at specific percentiles (from 0.25 to 0.75, incremented by 0.05) and their values at the 50th percentile. The model was adjusted for age, residence, marital status, education level, family economy, occupation, physical activity, alcohol consumption, smoking, BMI, dietary habits, hypertension, liver disease, kidney disease, and city of residence. APOE genotype was categorized as APOE- vs. APOE+ depending on the ε4 allele. HMs were ln-transformed and standardized. Abbreviations: CI, confidence interval; APOE, apolipoprotein E; HMs, heavy metals.
Table 1. Associations between heavy metals (HMs) and diabetes mellitus based on conditional logistic regression (n = 1000)
HMs a Continuous OR (95% CI) FDR Q1 Q2 OR (95% CI) Q3 OR (95% CI) Q4 OR (95% CI) P-value for trend b Ba Model 1 1.08 (0.92–1.28) 0.410 Ref 1.01 (0.71–1.44) 1.12 (0.79–1.58) 1.06 (0.75–1.50) 0.645 Model 2 1.19 (0.96–1.49) 0.153 Ref 1.10 (0.72–1.67) 1.08 (0.70–1.68) 1.27 (0.80–2.00) 0.329 Model 3 1.07 (0.84–1.36) 0.745 Ref 1.07 (0.68–1.67) 0.93 (0.58–1.51) 1.00 (0.59–1.70) 0.771 Cd Model 1 1.15 (0.99–1.32) 0.098 Ref 0.95 (0.67–1.36) 1.48 (1.04–2.10) 1.55 (1.08–2.23) 0.003 Model 2 1.31 (1.09–1.59) 0.025 Ref 1.12 (0.73–1.72) 1.65 (1.07–2.55) 1.80 (1.12–2.92) 0.005 Model 3 1.28 (1.05–1.56) 0.073 Ref 1.09 (0.70–1.71) 1.77 (1.12–2.82) 1.81 (1.08–3.03) 0.017 Co Model 1 1.22 (1.06–1.40) 0.013 Ref 1.16 (0.82–1.65) 1.53 (1.06–2.21) 1.34 (0.95–1.90) 0.058 Model 2 1.14 (0.97–1.35) 0.153 Ref 0.89 (0.58–1.36) 1.30 (0.84–2.03) 1.13 (0.74–1.71) 0.376 Model 3 1.02 (0.85–1.23) 0.794 Ref 0.80 (0.51–1.27) 1.22 (0.76–1.95) 0.86 (0.54–1.36) 0.766 Sr Model 1 1.40 (1.18–1.65) 0.001 Ref 1.66 (1.16–2.38) 1.62 (1.13–2.33) 2.10 (1.46–3.02) < 0.001 Model 2 1.15 (0.93–1.44) 0.194 Ref 1.22 (0.78–1.91) 0.97 (0.61–1.56) 1.47 (0.92–2.34) 0.185 Model 3 1.09 (0.85–1.40) 0.745 Ref 1.31 (0.82–2.11) 0.90 (0.55–1.47) 1.49 (0.89–2.51) 0.203 Tl Model 1 1.05 (0.94–1.17) 0.410 Ref 1.14 (0.80–1.63) 1.03 (0.73–1.45) 1.03 (0.73–1.46) 0.997 Model 2 1.17 (1.02–1.35) 0.060 Ref 0.86 (0.55–1.33) 0.85 (0.55–.32) 1.67 (1.08–2.57) 0.016 Model 3 1.16 (0.99–1.36) 0.157 Ref 0.82 (0.51–1.31) 0.82 (0.51–1.32) 1.71 (1.03–2.82) 0.026 Note. OR, odds ratio; CI, confidence interval; FDR, Franklin Delano Roosevelt; HMs, heavy metals; Ref, reference; Ba, barium; Cd, cadmium; Co, cobalt; Sr, strontium; Tl, thallium; Q, quartile. Bold values indicate statistical significance. a Concentrations of HMs were ln-transformed and standardized for analysis. b P-value for trend was calculated using the median values of each quartile, standardized after ln transformation, as a continuous variable in the conditional logistic regression model. Model 1 was unadjusted. Model 2 was adjusted for age, residence, marital status, education level, family economy, occupation, physical activity, alcohol consumption, smoking, BMI, dietary habits, hypertension, liver disease, kidney disease, and city of residence.In Model 3, the covariates from Model 2 were included along with the other HMs.  下载: 导出CSV
Table 2. Association between APOE genotype and diabetes mellitus (n = 1000)
Genotype a Model 1 Model 2 OR (95% CI) P-value OR (95% CI) P-value APOE- Ref Ref APOE+ 1.10 (0.80–1.51) 0.569 1.14 (0.78–1.66) 0.498 Note. OR, odds ratio; CI, confidence interval; Ref, reference; APOE, apolipoprotein E.
a APOE genotype was classified into two categories: APOE- (individuals without the ε4 allele) and APOE+ (individuals with the ε4 allele).
Model 1 was unadjusted.
Model 2 was adjusted for age, residence, marital status, education level, family economy, occupation, physical activity, alcohol consumption, smoking, BMI, dietary habits, hypertension, liver disease, kidney disease, and city of residence.
下载: 导出CSV
-
[1] Zhu BB, Liang CM, Yan SQ, et al. Association between serum thallium in early pregnancy and risk of gestational diabetes mellitus: the Ma’anshan birth cohort study. J Trace Elem Med Biol, 2019; 52, 151−6. doi: 10.1016/j.jtemb.2018.12.011 [2] Hasani Nourian Y, Beh-Pajooh A, Aliomrani M, et al. Changes in DNA methylation in APOE and ACKR3 genes in multiple sclerosis patients and the relationship with their heavy metal blood levels. NeuroToxicology, 2021; 87, 182−7. doi: 10.1016/j.neuro.2021.09.008 [3] Oliveira TF, Batista PR, Leal MA, et al. Chronic cadmium exposure accelerates the development of atherosclerosis and induces vascular dysfunction in the aorta of ApoE-/- mice. Biol Trace Elem Res, 2019; 187, 163−71. doi: 10.1007/s12011-018-1359-1 [4] Lash TL, VanderWeele TJ, Haneuse S, et al. Modern epidemiology. 4th ed. Wolters Kluwer. 2021. [5] Ding CG, Pan YJ, Zhang AH, et al. Distribution of rubidium, cesium, beryllium, strontium, and barium in blood and urine in general Chinese population. Chin J Ind Hyg Occup Dis, 2015; 33, 894−9. (In Chinese) [6] Nguyen HD. An evaluation of the effects of mixed heavy metals on prediabetes and type 2 diabetes: epidemiological and toxicogenomic analysis. Environ Sci Pollut Res Int, 2023; 30, 82437−57. doi: 10.1007/s11356-023-28037-3 [7] Duong MT, Nasrallah IM, Wolk DA, et al. Cholesterol, atherosclerosis, and APOE in vascular contributions to cognitive impairment and dementia (VCID): potential mechanisms and therapy. Front Aging Neurosci, 2021; 13, 647990. doi: 10.3389/fnagi.2021.647990 [8] Zhao N, Liu CC, Van Ingelgom AJ, et al. Apolipoprotein E4 impairs neuronal insulin signaling by trapping insulin receptor in the endosomes. Neuron, 2017; 96, 115-29. e5. [9] Unsal V, Dalkıran T, Çiçek M, et al. The role of natural antioxidants against reactive oxygen species produced by cadmium toxicity: a review. Adv Pharm Bull, 2020; 10, 184−202. doi: 10.34172/apb.2020.023 [10] Han MS, Jung DY, Morel C, et al. JNK expression by macrophages promotes obesity-induced insulin resistance and inflammation. Science, 2013; 339, 218−22. doi: 10.1126/science.1227568 -

 点击查看大图
计量
- 文章访问数: 28
- HTML全文浏览量: 11
- PDF下载量: 2
- 被引次数: 0

 Quick Links