

 下载:
下载:

-
The isolation and propagation of viruses in cell lines are cornerstone techniques in virology and provide a foundational method for virus identification from clinical specimens, particularly for studies of pathogenic mechanisms and for vaccine and antiviral drug development requiring live virus isolates. A classic cytopathic effect (CPE) manifests as morphologic changes observable by microscopy in virus-infected cells, including cell rounding, syncytium formation, cytoplasmic vacuolization, cell lysis, detachment, within 3–7 days post-inoculation. Confirmation of virus growth can be achieved by immunofluorescence or by molecular analysis[1]. However, certain strains induce subtler CPE, necessitating the generation of engineered cell lines for enhanced viral growth to make cell culture useful and informative. Approaches that increase expression of enzymes involved in the synthesis of cell-surface receptors are promising for creating sensitive cell lines for different viruses. The LLC-MK2 cell line with stable expression of transmembrane protease serine 2 (TMPRSS2) is an example of a cell line developed to support the culture of human parainfluenza virus (HPIV)[2].
HPIV is second only to respiratory syncytial virus (RSV) among major viral pathogens causing acute respiratory infections (ARIs) in children under 5 years of age. Globally, HPIV is responsible for approximately 13% of ARIs and 4% to 14% of ARI-related hospitalizations in children[3-5]. As an enveloped, single-stranded, negative-sense RNA virus in the genus Parainfluenza virus and the family Paramyxoviridae, HPIV is categorized into types 1–4 on the basis of antigenic and genetic diversity[6]. Among the four types, HPIV3 exhibits a higher affinity for respiratory mucosa in infants and young children, rendering it more prone to invade the lower respiratory tract and elicit severe inflammatory responses. Accordingly, HPIV3 accounts for the majority of HPIV infections and is more likely to cause pneumonia, especially in transplant recipients, with an acute mortality rate of 35%[7]. A surveillance study in China from 2009 to 2019 demonstrated that HPIV3 consistently ranked among the top three pathogens responsible for acute respiratory infections in children[8]. Despite its clinical burden, neither vaccines nor specific antivirals are widely available, partly due to the scarcity of virus strains with high titer and obvious CPE in highly sensitive cell lines.
Traditionally, cell lines such as Madin-Darby Canine Kidney (MDCK) and Rhesus Monkey Kidney (LLC-MK2) have been widely employed for HPIV3 isolation and cultivation[9], and trypsin is typically added to the maintenance medium to enhance HPIV3 replication. However, high concentrations of trypsin can seriously damage cells, which hinders the harvest of high viral titers. To overcome the trypsin-associated cytotoxicity, Li et al. developed a modified LLC-MK2 cell line stably expressing TMPRSS2, which can cleave viral fusion (F) protein from F0 to F1 and F2, and enhance the entrance of HPIV3 into host cells and need no trypsin[2]. In the study, we evaluated the isolation efficacy of trypsin-free LLC-MK2/TMPRSS2 cells for the isolation of HPIV3 from clinical respiratory specimens by comparing with that of MDCK with trypsin.
-
A total of 50 pediatric patients diagnosed with ARIs were consecutively enrolled at the Capital Center for Children’s Health, Capital Medical University, between February and April 2025. The cohort consisted of 26 male and 24 female patients, with the following age stratification: 19 patients were less than 1.5 years old, 14 were from 1.5 to 3 years old, and 17 were from 3 to 10 years old. The predominant clinical manifestations included fever, cough, nasal congestion, and other associated upper respiratory tract symptoms, with 15 patients presenting with concurrent wheezing. Throat swabs were collected for respiratory pathogen screening using six-respiratory-virus nucleic acid detection kit by quantitative real-time PCR assay (qPCR) (Beijing Applied Biological Technologies CO. LTD, China), which detected the nucleic acid of human adenovirus (HAdV), RSV, influenza virus (Flu) A and B, and HPIV1 and 3. These swabs were soaked in 2.5 mL of viral transport medium (Yocon Biotech, Beijing Co., Ltd., Beijing, China) and were immediately sent to the laboratory. For specimens positive for HPIV3 determined by qPCR, a portion of each specimen was used for virus isolation, while the remaining was stored at –80 °C for future use.
-
LLC-MK2/TMPRSS2 cells were kindly provided by the WHO WPRO Regional Reference Measles and Rubella Laboratory, National Institute for Viral Disease Control and Prevention, Chinese Center for Disease Control and Prevention, and MDCK cells were obtained from the National Experimental Cell Resource Sharing Service Platform.
Cell culture and passaging were performed in T25 flasks using Dulbecco’s Modified Eagle Medium (DMEM) supplemented with 10% fetal bovine serum (FBS), 1% penicillin-streptomycin, and 2.5% HEPES (growth medium). The cells were subcultured into tubes at a density of 1 × 10⁵ cells/mL, with 0.5 mL per tube, and incubated at 37 °C with 5% CO2 for 24 h. The growth medium was then discarded, and 0.2 mL of specimens were inoculated and incubated at 37 °C with 5% CO2 for 2 h. The cells were gently rinsed three times with 0.5 mL of PBS, with each rinsing step lasting 1 minute. Then 1 mL of maintenance medium containing 1% penicillin-streptomycin, and 2.5% HEPES were added, with trypsin in a final concentration of 2 μg/mL to MDCK cells.
The tubes inoculated with clinical specimens were incubated at 37 °C with 5% CO2 for 5 days, and CPE was observed and recorded daily under microscopy, which were named as passage 1 (P1). For those without CPE, 0.2 mL supernatant of P1 was subclutured into another tube containing cells and CPE was observed and recorded daily for another 5 days, and these were named as P2. The CPE was graded as follows “+” with 25% cytopathic cells, “++” with 50% , “+++” with 75% and “++++” with 100% cytopathic cells.
The virus cultures of P1 and P2 were collected and centrifuged at 500×g for 5 minutes. The supernatants were collected for subsequent qPCR, and cell pellets were resuspended in 0.5 mL of PBS and spotted onto slides for DFA.
-
DFA detection (Diagnostic Hybrids, Athens, O H, USA) for antigen testing was performed on slides coated with acetone-immobilized cells, using monoclonal antibody reagents labeled with fluorescein isothiocyanate against HAdV, RSV, Flu A and B and HPIV 1, 2 and 3, according to the manufacturer’s protocol. Meanwhile, the proportion of virus-positive cells was also counted, and defined as “+” with 25% virus-positive cells, “++” with 50% virus-positive cells, “+++” with 75% virus-positive cells, and “++++” with 100% virus-positive cells.
-
Total nucleic acid was extracted from 140 µL supernatant of each virus culture using the QIAamp MinElute Virus Spin Kit (Qiagen GmbH, Germany), following the manufacturer’s instructions.
Then the viral infection dynamics of HPIV3 isolates were assessed via qPCR using the six respiratory viruses' nucleic acid detection kit. In brief, a 20 µL amplification system was established and the qPCR was carried out in an Applied Biosystems 7500 Real-Time PCR System (Thermo Fisher Scientific, Massachusetts, USA) under an initial denaturation step at 45 °C for 10 minutes, and 95 °C for 5 minutes, followed by 45 cycles of denaturation at 95 °C for 15 seconds and annealing/extension and fluorescence acquisition at 60 °C for 45 seconds. Specimens with a cycle threshold (Ct) value ≤ 36 in the fluorescent signals of FAM were positive for HPIV3.
-
A continuity-corrected chi-square test was applied to compare the performance of the two cell lines in HPIV3 isolation using IBM SPSS Statistics version 29.0 (IBM Corporation, Armonk, NY, USA). A two-tailed P - value ≤ 0.05 was considered statistically significant.
-
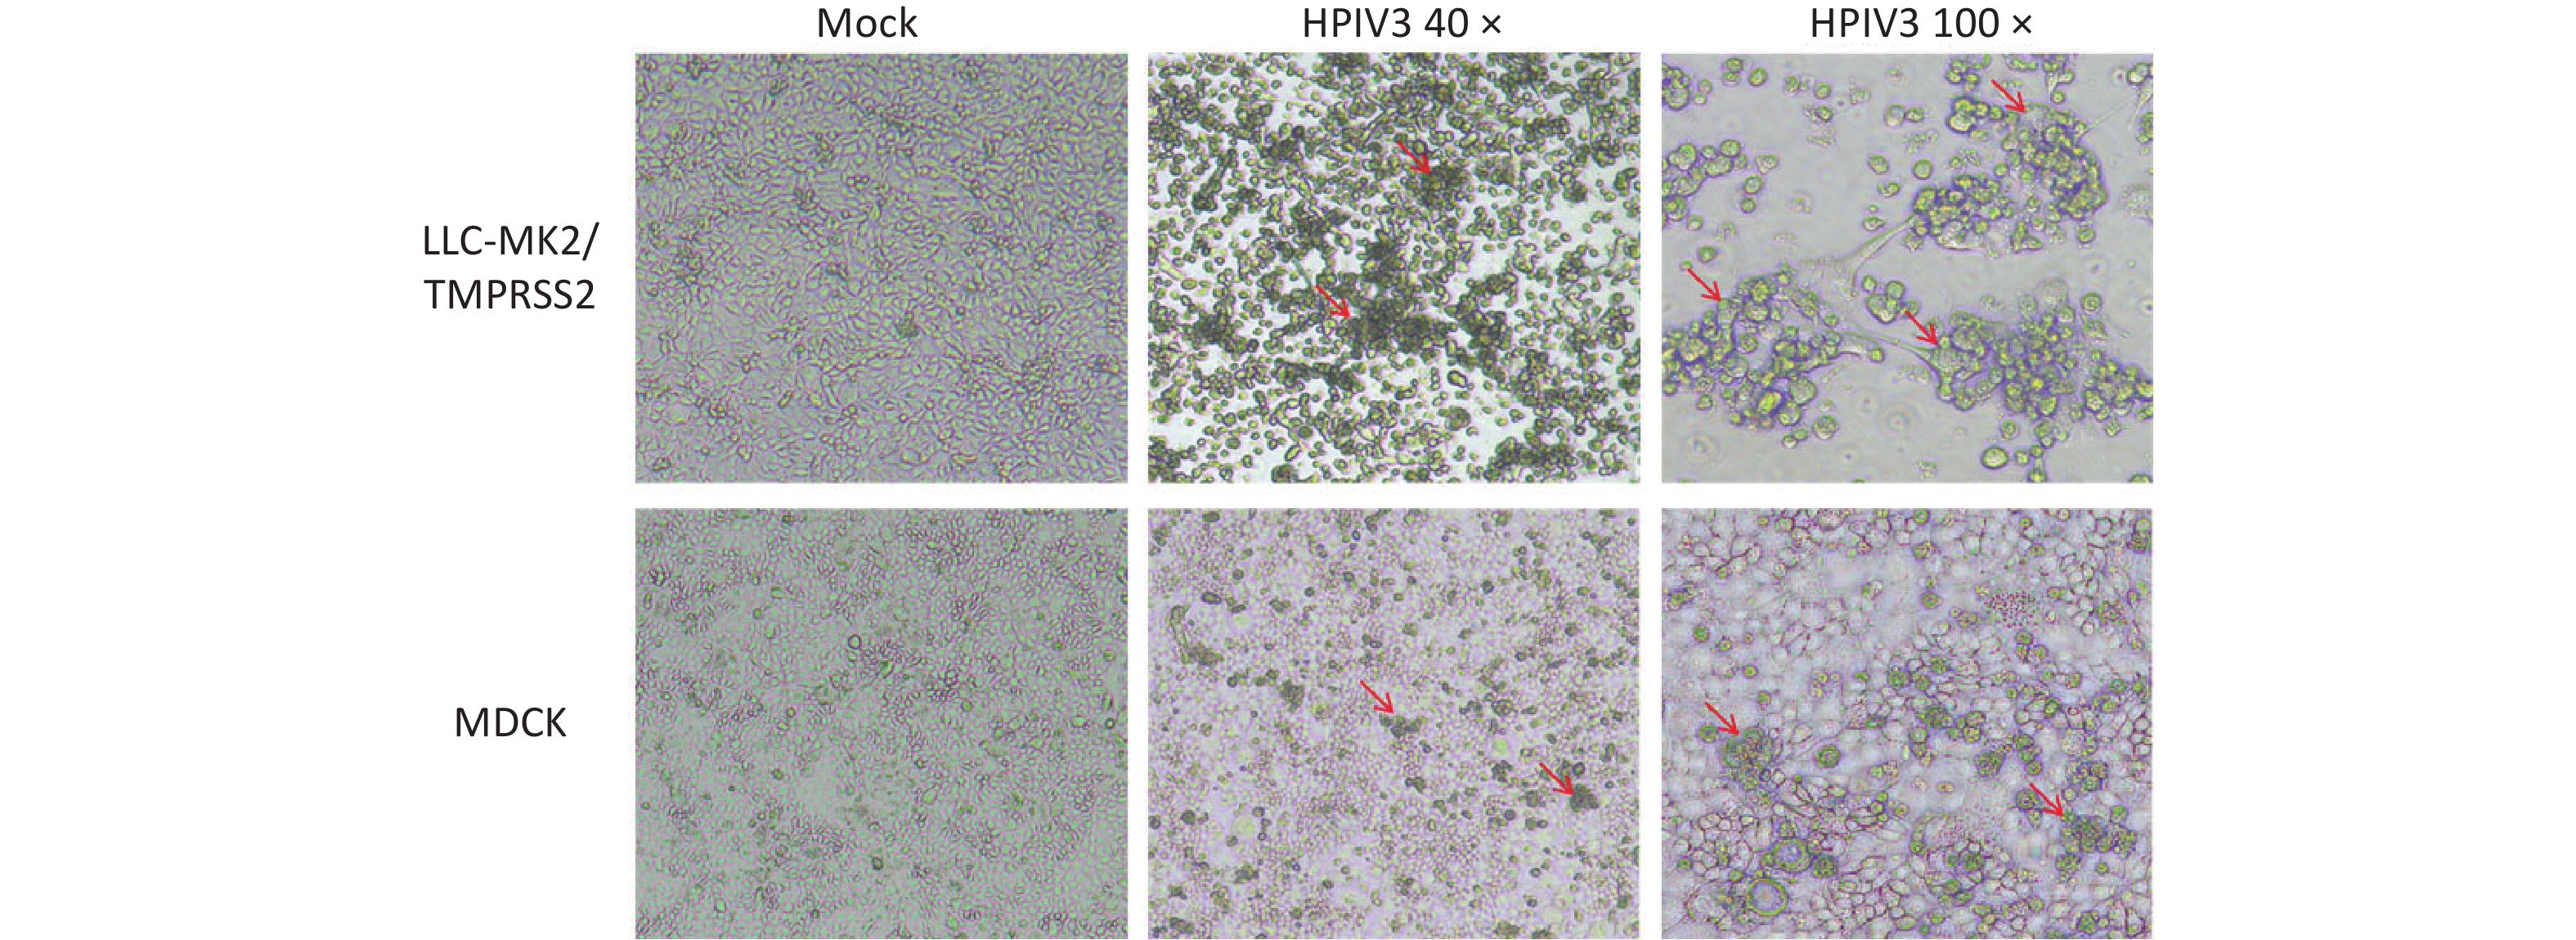
There were 50 respiratory specimens determined to be HPIV3 positive by qPCR and inoculated into LLC-MK2/TMPRSS2 and MDCK cells, respectively. CPEs were monitored daily under microscopy. Compared to the morphology of control cells, which appeared as flat polygonal cells in control LLC-MK2/TMPRSS2 cells on the 5th day post-inoculation, morphologic changes, including detachment, cell rounding, fusion, shrinkage, and other changes, were readily observed in LLC-MK2/TMPRSS2 cultures of 35 clinical specimens (70.0%, 35/50), which were suspected with HPIV3 infection. However, only subtle morphologic changes were observed in MDCK on the 5th day post-inoculation of 14 clinical specimens (28.0%, 14/50), such as detachment, forming clusters and undergoing shrinkage (Figure 1). The positive isolation rate in LLC-MK2/TMPRSS2 cells (70.0%, 35/50) was higher than that in MDCK (28.0%, 14/50) (P < 0.001). Furthermore, more specimens showed 75% and 100% CPEs in LLC-MK2/TMPRSS2 (62.9%, 22/35), though the distribution of different degree of CPEs showed no significant differences in two cells types (P = 0.809) (Table 1).
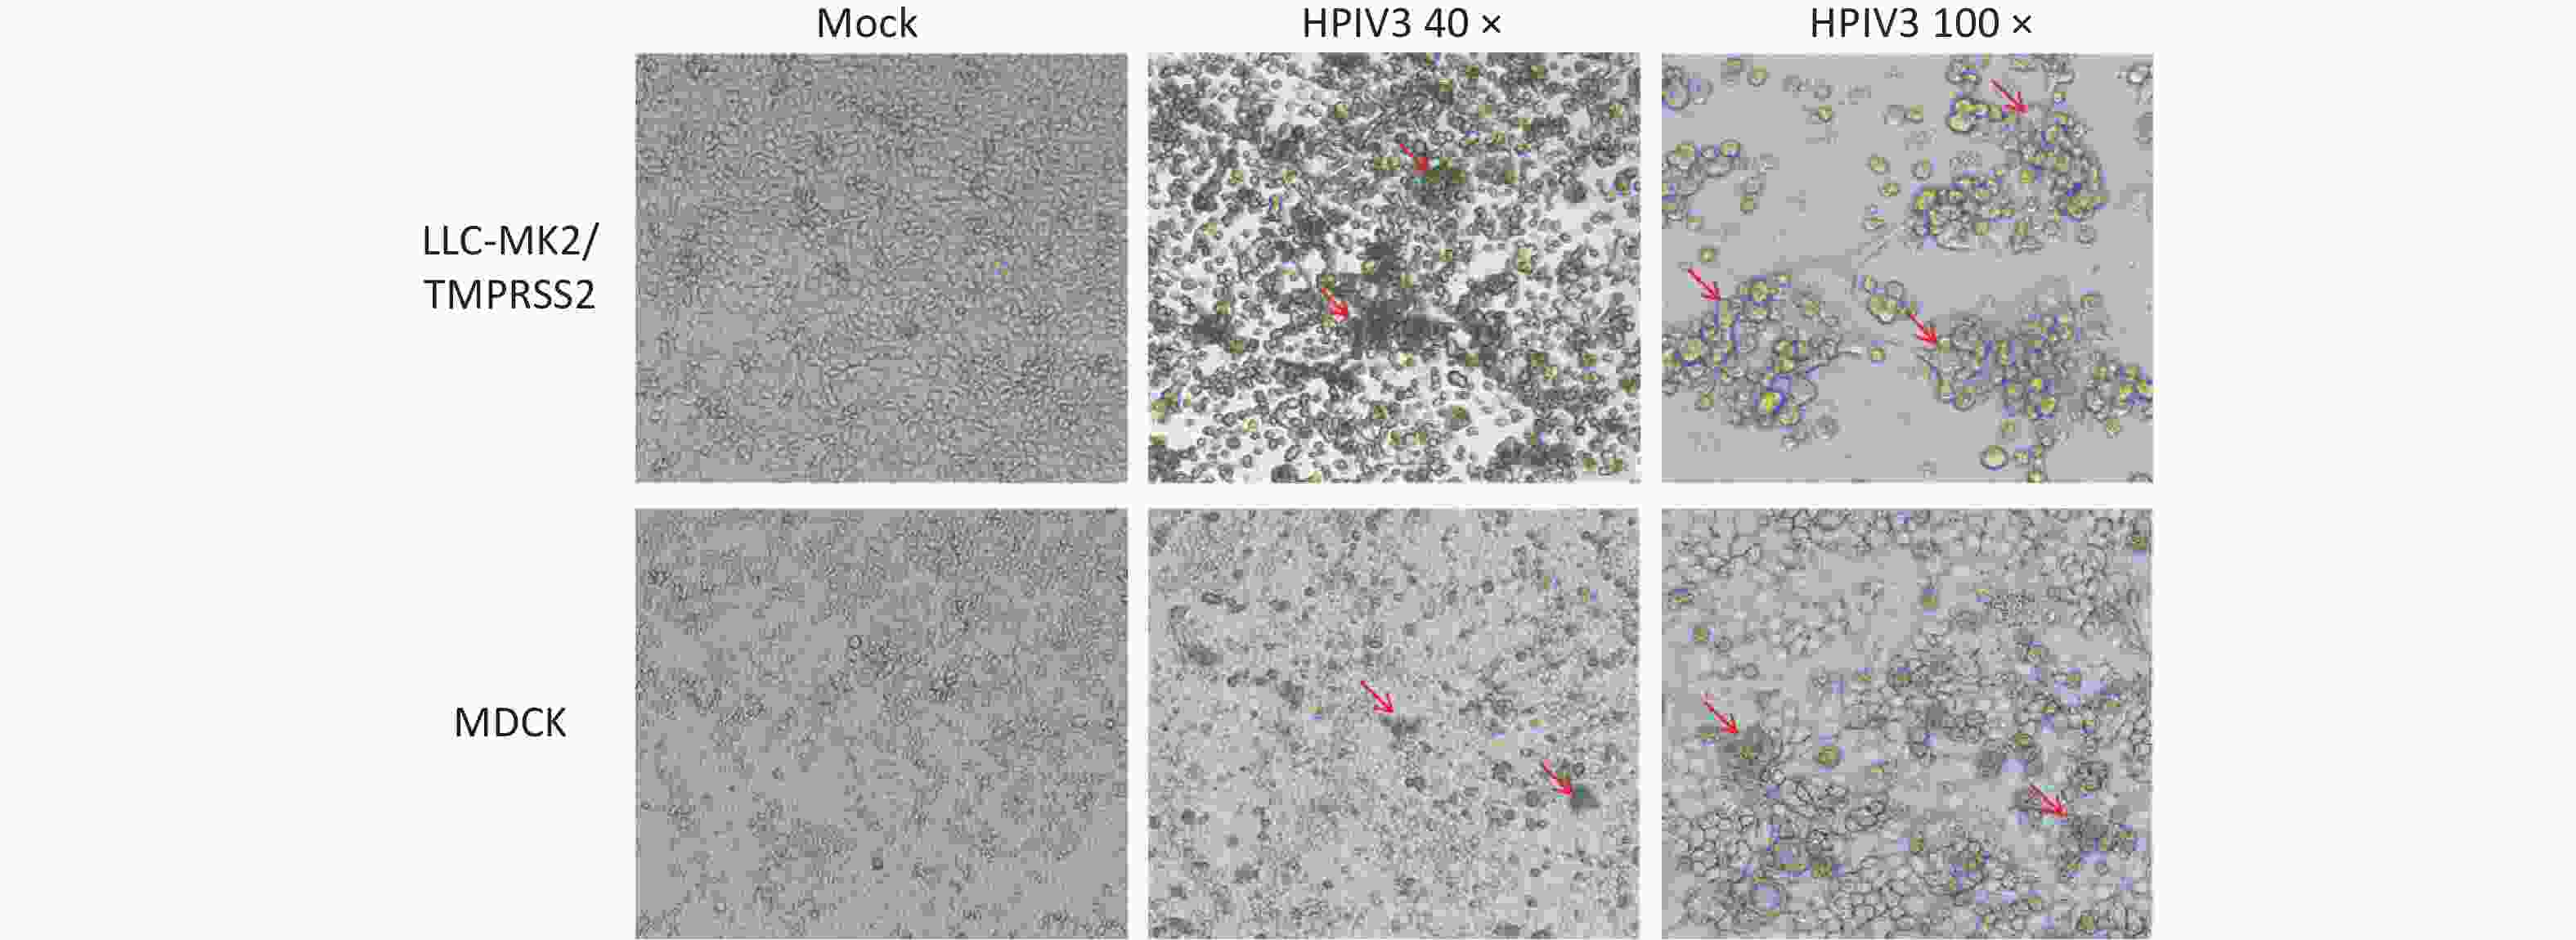
Figure 1. Cytopathic effects in LLC-MK2/TMPRSS2 or MDCK cells on the 5 day post-inoculation, which were induced by respiratory specimens positive for HPIV3 determined by qPCR.
Table 1. Cytopathic effects in LLC-MK2/TMPRSS2 versus MDCK cells
Cell types specimens inoculated (n) isolations confirmed by CPE (n, %) x2 P Cytopathic effects (n, %) x2 P 25% 50% 75% 100% LLC-MK2/TMPRSS2 50 35 (70.0) 17.647 < 0.001 7 (20.0) 6 (17.1) 10 (28.6) 12 (34.3) 0.967 0.809 MDCK 50 14 (28.0) 4 (28.6) 3 (21.4) 4 (28.6) 3 (21.4) -
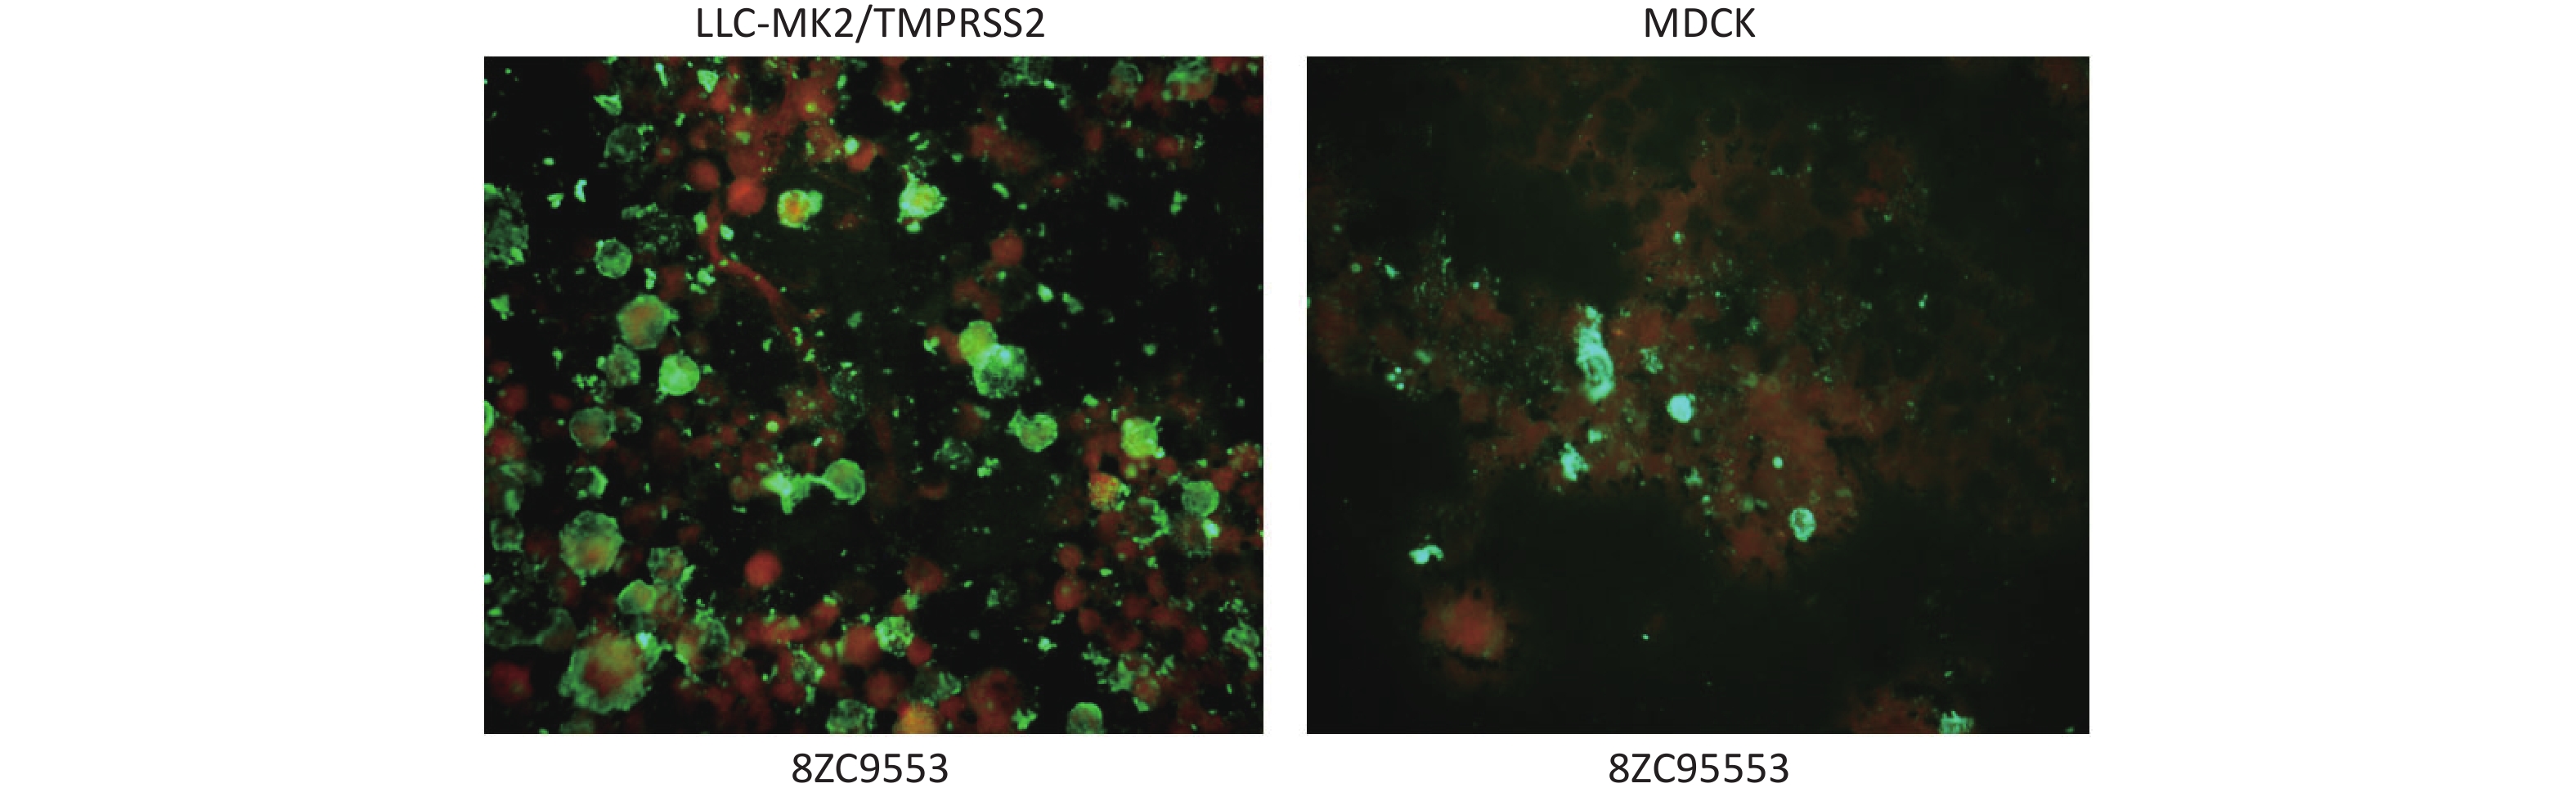
In DFA, the cell pellets from P1 and P2 harvested on day 5 post-inoculation reacted with HPIV3 specific antibodies; cells with complete morphology and clear, easily recognizable green fluorescence were confirmed as HPIV3 positive. Stronger green fluorescence was observed in the membrane of LLC-MK2/TMPRSS2 compared to that of MDCK (Figure 2).
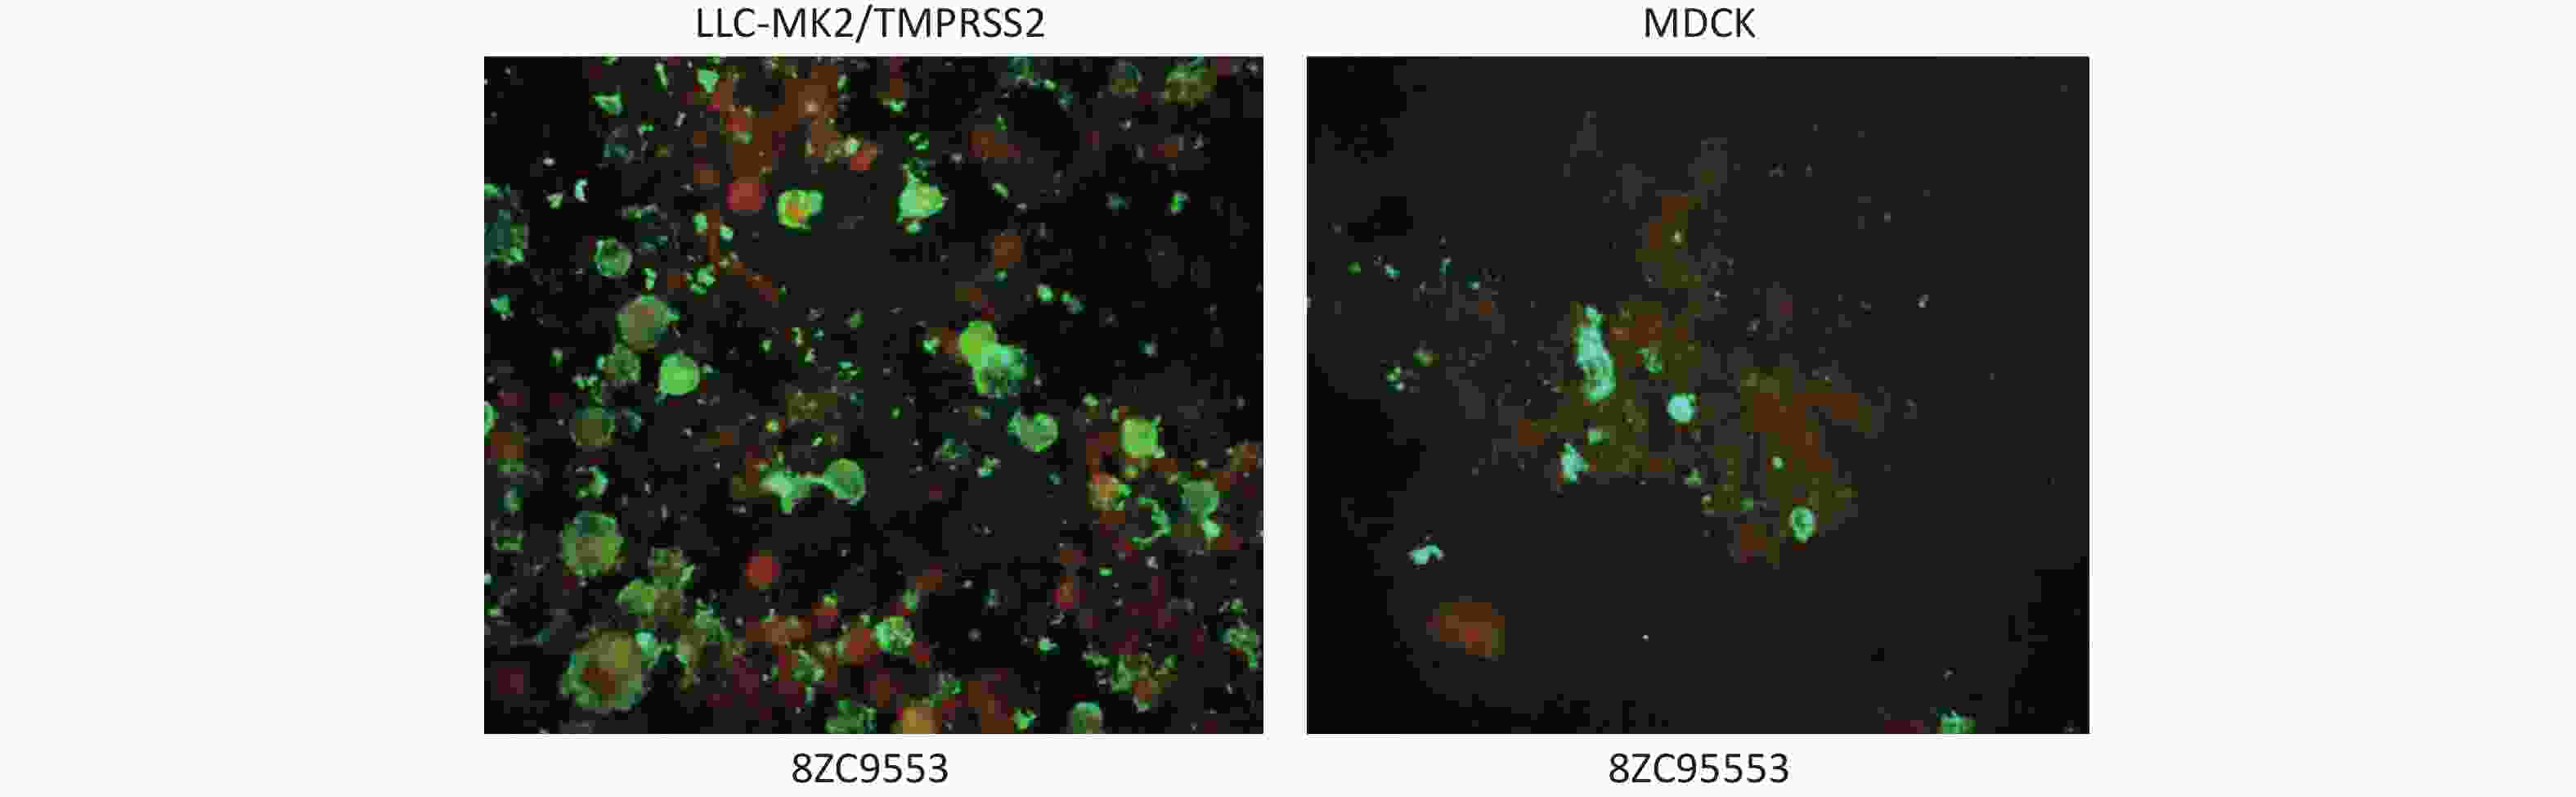
Figure 2. Green fluorescence showed in LLC-MK2/TMPRSS2 and MDCK cells, respectively, in reacting with HPIV3 specific antibodies of one clinical specimen (8ZC9553).
There were 35 (70.0%, 35/50) with specimens showing specific green fluorescence in LLC-MK2/TMPRSS2, including 34 from P1 and 1 from P2, indicating successful isolation of HPIV3. Meanwhile, there were 19 (38.0%, 19/50), all from P1, showing specific green fluorescence in MDCK. Statistical analysis revealed a significant difference in isolation efficiency between the two cell lines (P = 0.001). More specimens showed 75% and 100% positive cells in LLC-MK2/TMPRSS2 (45.7%, 16/35) than MDCK (21.1%, 4/19), though the distribution of the proportion of positive cells showed no significant differences between the two cell lines (P = 0.171) (Table 2).
Table 2. Comparison of the isolation efficacy confirmed by DFA between LC-MK2/TMPRSS2 and MDCK cells
Cell types specimens inoculated (n) isolations confirmed by DFA (n, %) x2 P The proportion of positive cells (n, %) x2 P 25% 50% 75% 100% LLC-MK2/TMPRSS2 50 35 (70.0) 10.306 0.001 12 (34.3) 7 (20.0) 8 (22.9) 8 (22.9) 5.017 0.171 MDCK 50 19 (38.0) 12 (63.2) 3(15.8) 1(5.3) 3(15.8) -
According to Ct values, the 50 respiratory specimens positive for HPIV3 were clustered into four groups: 13 with initial Ct < 23, 12 in the group with initial 23 ≤ Ct < 27 (23–27), 13 in the group with initial 27 ≤ Ct < 30 (27–30), and 12 in the group with initial Ct ≥ 30.
When the isolation results were combined with DFA, specimens in groups with initial Ct < 27 showed higher positive isolation rates, not only in LLC-MK2/TMPRSS2 (88.0%, 22/25), but also in MDCK (64.0%, 16/25). Specimens with > 75% proportion of positive cells in LLC-MK2/TMPRSS2 were in groups with initial Ct < 27 (81.3%, 13/16), while specimens with > 75% proportion of positive cells in MDCK were all in the group with initial Ct < 23 (100.0%, 4/4). However, the differences in the proportion of positive cells in different groups did not reach statistical significance between the two cell lines (Table 3).
Table 3. Association of the initial Ct values of respiratory specimens with the proportion of positive cells determined by DFA in LLC-MK2/TMPRSS2 and MDCK cells
Initial Ct value No. of specimens The proportion of positive cells in
LLC-MK2/TMPRSS2 cells (n)The proportion of positive cells in
MDCk cells (n)χ2 P Total 25% 50% 75% 100% χ2 P Total 25% 50% 75% 100% χ2 P < 23 13 12 2 2 3 5 1.315 0.726 11 5 2 1 3 2.55 0.466 5.651 0.12 23–27 12 10 3 2 3 2 5 4 1 0 0 4.992 0.172 2.08 0.556 27–30 13 9 5 2 1 1 0.88 0.83 3 3 0 0 0 None None 2.216 0.53 ≥ 30 12 4 2 1 1 0 0 0 0 0 0 When the isolation results were combined with qPCR, there were 35 (70.0%, 35/50) and 30 (60.0%, 30/50) specimens determined to be HPIV3 isolation positive in LLC-MK2/TMPRSS2 and MDCK, respectively, with no significant differences between the two type cells. In LLC-MK2/TMPRSS2, more specimens as HPIV3 isolation positive in groups with initial Ct < 27 had lower Ct values (< 27) (82.6%, 19/23), with no significant differences between groups with initial Ct < 23 (91.7%, 11/12) and 23 ≤ Ct < 27 (72.7%, 8/11). In MDCK cells, more (52.2%, 12/23) were with Ct < 27 (66.7%, 8/12) in the group with initial Ct < 23, and more (63.6%, 7/11) had Ct ≥ 27 in the group with initial 23 ≤ Ct < 27 (P = 0.003), while more specimens classified as HPIV3 isolation positive were in groups with initial Ct < 27 (76.7%, 23/30) (Table 4).
Table 4. .Association of the initial Ct values of respiratory specimens with the Ct values determined by qPCR in LLC-MK2/TMPRSS2 and MDCK cells
Initial Ct value No. of specimens Ct values determined by qPCR in
LLC-MK2/TMPRSS2 cells (n)Ct values determined by qPCR in
MDCK cells (n)x2 P Total < 23 23–27 27–30 ≥ 30 x2 P Total < 23 23–27 27–30 ≥ 30 x2 P < 23 13 12 9 2 1 0 2.56 0.46 12 2 6 1 3 2.127 0.55 13.72 0.003 23–27 12 11 6 2 1 2 11 1 3 2 5 5.51 0.14 8.22 0.04 27–30 13 8 3 2 0 3 None None 5 0 0 2 3 None None 10.94 0.012 ≥ 30 12 4 2 0 0 2 2 0 0 2 0 -
Since the first successful isolation of HPIV3 in the 1950s, researchers have continuously attempted to use different cell lines and isolation methods to improve virus isolation efficiency. LLC-MK2 and MDCK are commonly used cell lines for HPIV isolation; however, their culture process usually requires the addition of exogenous trypsin to enhance virus replication[9,10]. In a study, Maidana SS et al. isolated bovine PIV3 from buffalo nasal swabs and vaginal swabs using Madin-Darby Bovine Kidney (MDBK)[11]. Subsequently, Li et al. isolated HPIV3 from goats in China using MDBK[12]. However, the isolation of HPIV3 still faces many challenges in various aspects, such as a long isolation cycle, rapid inactivation of the virus after specimen cryopreservation, and the need to add exogenous trypsin during culture. Together these constraints have substantially limited the further development of HPIV3-related research.
In this study, 35 strains (35/50, 70.0%) were successfully isolated from 50 respiratory specimens using the LLC-MK2/TMPRSS2 cell line stably expressing TMPRSS2. Compared to only 14 strains isolated in MDCK (14/50, 28.0%) (P < 0.001), it was confirmed that LLC-MK2/TMPRSS2 is significantly superior to MDCK in terms of isolation efficiency, and represents a more efficient tool for laboratory isolation and culture of HPIV3. In LLC-MK2/TMPRSS2, TMPRSS2 can directly cleave the fusion protein of HPIV3, then promote virus entry into host cells and enhance replication, without relying on exogenous trypsin. In contrast, MDCK cells require the addition of trypsin to maintain HPIV3 replication, and high concentrations of trypsin may damage cells, which in turn limits viral propagation, and may be an important reason for its low isolation rate. HPIV3, like many paramyxoviruses, enters host cells via membrane fusion. This critical step is executed by its trimeric F protein, which undergoes a dramatic, irreversible conformational change from a pre-fusion to a post-fusion state. However, the newly synthesized F protein (F0) is inactive. It requires proteolytic cleavage by a host protease into two disulfide-linked subunits: F1 (the transmembrane subunit) and F2 (the peripheral subunit). TMPRSS2 is a type II transmembrane serine protease predominantly expressed in respiratory, gastrointestinal, and urogenital epithelia. Its role in cleaving HPIV3-F is highly specific and spatially regulated. HPIV3-F0 contains a canonical cleavage site motif at its boundary between F2 and F1. For most HPIV3 strains, this is a monobasic site (e.g., single arginine, R). TMPRSS2, with its trypsin-like specificity, preferentially cleaves after arginine or lysine residues. This cleavage results in the generation of the new N-terminus of the F1 subunit. This newly exposed region is the fusion peptide-a hydrophobic, glycine-rich sequence that is otherwise buried in the pre-fusion trimer. Once triggered, the F protein refolds into the extremely stable post-fusion state, pulling the viral and cellular membranes together to form a fusion pore. Without cleavage, this entire process cannot initiate[13]. The TMPRSS2-HPIV3-F interaction is not an isolated case. In fact, TMPRSS2 plays an indispensable role in the transmission of influenza viruses and coronaviruses. Specifically, it mediates the activation of membrane fusion by proteolytically cleaving the hemagglutinin precursor HA0 of influenza viruses and the spike protein of coronaviruses, thereby facilitating efficient viral entry into host cells[14].
Usually, CPE serves as a visual hallmark of viral infection and is widely recognized as a critical benchmark for confirming the successful isolation of viruses during viral isolation experiments[15]. In the context of antiviral drug development, the CPE inhibition assay has been routinely adopted as a key readout to assess the antiviral efficacy of candidate drugs[16,17]. A lack of prominent CPE has long been recognized as one of the major hurdles in conventional HPIV isolation. In this study, LLC-MK2/TMPRSS2 displayed more distinct typical CPE under microscopy, including detachment, shrinkage and fusion, and a higher proportion of specimens (62.9%, 22/35) exhibited 75% and 100% CPE, which indicated enhanced sensitivity for HPIV3 isolation. It has been confirmed that HPIV strain from ATCC exhibited exponential growth in both LLC-MK2 and LLCMK2/TMPRSS2 cells in culture with or without exogenous trypsin, respectively. And LLC-MK2/TMPRSS2 significantly supported the replication of clinical HPIV3 isolates, whereas LLC-MK2 cells failed to sustain their infectivity effectively[2]. Therefore, LLC-MK2/TMPRSS2 provides an excellent cell line that overcomes the restriction of unobvious CPE.
The DFA is mainly used as a tool for specific verification and rapid identification in virus isolation and culture[18]. In a pathological investigation of bovine PIV3 (BPIV3)-associated pneumonia, DFA served as a reliable confirmatory diagnostic method for BPIV3[19]. In the isolation of human metapneumovirus, the DFA-based detection allows for virus confirmation within 1 day markedly faster than conventional methods that rely on CPE morphology observation or sequencing[20]. In the study, the positive rate of HPIV3 isolation in MDCK raised from 28.0% (14/50) to 38.0% (19/50) by combining CPE with DFA. Though the positive rate of HPIV3 isolation of LLC-MK2/TMPRSS2 remained at 70% (35/50), the results of DFA provided high specificity to support CPE in HPIV3 isolation using LLC-MK2/TMPRSS2.
Specimens with initial Ct < 27 exhibited high isolation rates in both cell lines, with LLC-MK2/TMPRSS2 demonstrating more consistent performance. Notably, the Ct values of supernatants from LLC-MK2/TMPRSS2 inoculated with specimens with initial Ct ≤ 30 were significantly lower, indicating higher viral replication efficiency. Compared with the results of CPE and DFA, qPCR detection substantially improved the positive detection rate of HPIV3, particularly in MDCK which increased from 28.0% to 60.0%, suggesting that viral isolation rates may correlate with the viral load in specimens. For viral isolation from low-load specimens, qPCR detection is of great significance, as it can reduce false negatives caused by low viral load.
This study has several limitations. The size of the clinical sample cohort was limited to 50 cases, and the sampling period was restricted to February to April 2025, which was insufficient to reflect the full annual epidemiological characteristics of HPIV3 as assessed by tissue culture. In future research, the sample size will be increased and the sampling duration will be extended to verify the general applicability of LLC-MK2/TMPRSS2 cell line.
In conclusion, LLC-MK2/TMPRSS2 can improve the efficiency of HPIV3 isolation from clinical specimens, requiring no addition of trypsin, but with more typical CPE. Therefore, LLC-MK2/TMPRSS2 can be considered an ideal alternative to traditional cell lines, providing a higher-quality tool for the etiological research of HPIV3, vaccine development, and antiviral drug screening.
doi: 10.3967/bes2026.032
Enhanced Efficiency of the LLC-MK2 Cell Line with Stable Expression of TMPRSS2 in Isolating Human Parainfluenza Virus 3 from Respiratory Specimens
-
Abstract:
Objective LLC-MK2/TMPRSS2 cells constitutively express TMPRSS2, eliminating the requirement for additional trypsin during HPIV3 culture. The efficiency of LLC-MK2/TMPRSS2 for isolating HPIV3 from respiratory specimens was evaluated in comparison with Madin-Darby Canine Kidney (MDCK). Methods HPIV3-positive respiratory specimens from children with acute respiratory infections (February-June 2025) were inoculated into LLC-MK2/TMPRSS2 and MDCK. The cytopathic effect (CPE) was monitored microscopically, and the proportion of positive cells was evaluated using direct immunofluorescence assay (DFA). Viral infection dynamics were assessed using the cycle threshold (Ct) values obtained by qPCR. Results Among 50 specimens, 35 strains (35/50, 70%) were successfully isolated using LLC-MK2/TMPRSS2, while 14 strains were isolated using MDCK (14/50, 28%). More pronounced CPE and a higher number of virus-infected positive cells were shown in LLC-MK2/TMPRSS2 compared to that in MDCK (P < 0.001 and P = 0.001, respectively). Among specimens with an initial Ct < 27, the isolation rate of LLC-MK2/TMPRSS2 was higher and the Ct values were lower (< 27) (82.6%, 19/23). Among specimens with an initial Ct of 23 ≤ Ct < 27, the number of specimens with a supernatant Ct ≥ 27 (63.6%, 7/11) was significantly less than that in MDCK (P = 0.003). Conclusion LLC-MK2/TMPRSS2 exhibits superior adaptability and replication efficiency in the isolation of HPIV3 from respiratory specimens. -
Key words:
- Children /
- Human parainfluenza virus type 3 /
- LLC-MK2/TMPRSS2 /
- Respiratory specimens
No financial or nonfinancial benefits have been received or will be received from any party directly or indirectly related to this article.
This study was approved by the Ethics Committee of the Capital Institute of Pediatrics (approval number: SHERLL2022015).
Fengjie Wang and Yutong Zhou conducted the laboratory examination. Ri De directed the laboratory data analysis. Runan Zhu, Yu Sun, Dongmei Chen, Liping Jia, Qi Guo, and Yao Yao performed the clinical information collection and analysis. Zhen Zhu prepared the cell line. Fengjie Wang prepared and edited the manuscript. Naiying Mao and Linqing Zhao conceived the experiments and made the final decision on the manuscript.
&These authors contributed equally to this work.
注释:1) Funding: 2) Competing Interests: 3) Ethics: 4) Authors’ Contributions: -
Figure 1. Cytopathic effects in LLC-MK2/TMPRSS2 or MDCK cells on the 5 day post-inoculation, which were induced by respiratory specimens positive for HPIV3 determined by qPCR.
Figure 2. Green fluorescence showed in LLC-MK2/TMPRSS2 and MDCK cells, respectively, in reacting with HPIV3 specific antibodies of one clinical specimen (8ZC9553).
Table 1. Cytopathic effects in LLC-MK2/TMPRSS2 versus MDCK cells
Cell types specimens inoculated (n) isolations confirmed by CPE (n, %) x2 P Cytopathic effects (n, %) x2 P 25% 50% 75% 100% LLC-MK2/TMPRSS2 50 35 (70.0) 17.647 < 0.001 7 (20.0) 6 (17.1) 10 (28.6) 12 (34.3) 0.967 0.809 MDCK 50 14 (28.0) 4 (28.6) 3 (21.4) 4 (28.6) 3 (21.4)  下载: 导出CSV
Table 2. Comparison of the isolation efficacy confirmed by DFA between LC-MK2/TMPRSS2 and MDCK cells
Cell types specimens inoculated (n) isolations confirmed by DFA (n, %) x2 P The proportion of positive cells (n, %) x2 P 25% 50% 75% 100% LLC-MK2/TMPRSS2 50 35 (70.0) 10.306 0.001 12 (34.3) 7 (20.0) 8 (22.9) 8 (22.9) 5.017 0.171 MDCK 50 19 (38.0) 12 (63.2) 3(15.8) 1(5.3) 3(15.8)
下载: 导出CSV
Table 3. Association of the initial Ct values of respiratory specimens with the proportion of positive cells determined by DFA in LLC-MK2/TMPRSS2 and MDCK cells
Initial Ct value No. of specimens The proportion of positive cells in
LLC-MK2/TMPRSS2 cells (n)The proportion of positive cells in
MDCk cells (n)χ2 P Total 25% 50% 75% 100% χ2 P Total 25% 50% 75% 100% χ2 P < 23 13 12 2 2 3 5 1.315 0.726 11 5 2 1 3 2.55 0.466 5.651 0.12 23–27 12 10 3 2 3 2 5 4 1 0 0 4.992 0.172 2.08 0.556 27–30 13 9 5 2 1 1 0.88 0.83 3 3 0 0 0 None None 2.216 0.53 ≥ 30 12 4 2 1 1 0 0 0 0 0 0
下载: 导出CSV
Table 4. .Association of the initial Ct values of respiratory specimens with the Ct values determined by qPCR in LLC-MK2/TMPRSS2 and MDCK cells
Initial Ct value No. of specimens Ct values determined by qPCR in
LLC-MK2/TMPRSS2 cells (n)Ct values determined by qPCR in
MDCK cells (n)x2 P Total < 23 23–27 27–30 ≥ 30 x2 P Total < 23 23–27 27–30 ≥ 30 x2 P < 23 13 12 9 2 1 0 2.56 0.46 12 2 6 1 3 2.127 0.55 13.72 0.003 23–27 12 11 6 2 1 2 11 1 3 2 5 5.51 0.14 8.22 0.04 27–30 13 8 3 2 0 3 None None 5 0 0 2 3 None None 10.94 0.012 ≥ 30 12 4 2 0 0 2 2 0 0 2 0
下载: 导出CSV
-
[1] Dolskiy AA, Grishchenko IV, Yudkin DV. Cell cultures for virology: usability, advantages, and prospects. Int J Mol Sci, 2020; 21, 7978. doi: 10.3390/ijms21217978 [2] Lin YT, Li H, Zhang Y, et al. Establishment and evaluation of LLC-MK2 cell lines stably expressing transmembrane protease serine 2 (TMPRSS2). Chin J Exp Clin Virol, 2025; 39, 303−11. (In Chinese) [3] Rafeek RAM, Divarathna MVM, Noordeen F. A review on disease burden and epidemiology of childhood parainfluenza virus infections in Asian countries. Rev Med Virol, 2021; 31, e2164. doi: 10.1002/rmv.2164 [4] Abedi GR, Prill MM, Langley GE, et al. Estimates of parainfluenza virus-associated hospitalizations and cost among children aged less than 5 years in the United States, 1998–2010. J Pediatric Infect Dis Soc, 2016; 5, 7−13. doi: 10.1093/jpids/piu047 [5] Wang X, Li Y, Deloria-Knoll M, et al. Global burden of acute lower respiratory infection associated with human parainfluenza virus in children younger than 5 years for 2018: a systematic review and meta-analysis. Lancet Glob Health, 2021; 9, e1077−87. doi: 10.1016/S2214-109X(21)00218-7 [6] Henrickson KJ. Parainfluenza viruses. Clin Microbiol Rev, 2003; 16, 242−64. doi: 10.1128/CMR.16.2.242-264.2003 [7] Fontana L, Strasfeld L. Respiratory virus infections of the stem cell transplant recipient and the hematologic malignancy patient. Infect Dis Clin North Am, 2019; 33, 523−44. doi: 10.1016/j.idc.2019.02.004 [8] Li ZJ, Zhang HY, Ren LL, et al. Etiological and epidemiological features of acute respiratory infections in China. Nat Commun, 2021; 12, 5026. doi: 10.1038/s41467-021-25120-6 [9] Frank AL, Couch RB, Griffis CA, et al. Comparison of different tissue cultures for isolation and quantitation of influenza and parainfluenza viruses. J Clin Microbiol, 1979; 10, 32−6. doi: 10.1128/jcm.10.1.32-36.1979 [10] ØRSTAVIK I. Susceptibility of continuous lines of monkey kidney cells to influenza and parainfluenza viruses in the presence of trypsin. Acta Pathol Microbiol Scand B, 1981; 89, 179−83. [11] Maidana SS, Lomonaco PM, Combessies G, et al. Isolation and characterization of bovine parainfluenza virus type 3 from water buffaloes (Bubalus bubalis) in Argentina. BMC Vet Res, 2012; 8, 83. doi: 10.1186/1746-6148-8-83 [12] Li WL, Mao L, Cheng SP, et al. A novel parainfluenza virus type 3 (PIV3) identified from goat herds with respiratory diseases in eastern China. Vet Microbiol, 2014; 174, 100−6. doi: 10.1016/j.vetmic.2014.08.027 [13] Stearns K, Lampe G, Hanan R, et al. Human parainfluenza virus 3 field strains undergo extracellular fusion protein cleavage to activate entry. mBio, 2024; 15, e02327−24. doi: 10.1128/mbio.02327-24 [14] Barros de Lima G, Nencioni E, Thimoteo F, et al. TMPRSS2 as a key player in viral pathogenesis: influenza and coronaviruses. Biomolecules, 2025; 15, 75. doi: 10.3390/biom15010075 [15] Céspedes-Tenorio D, Arias-Arias JL. The virus-induced cytopathic effect. Subcell Biochem, 2023; 106, 197−210. doi: 10.1007/978-3-031-40086-5_7 [16] Yan H, Li HH, Chen XY, et al. Salvianolic acid A acts as a herpes simplex virus dual inhibitor by blocking glycoprotein B-mediated adsorption and membrane fusion. Phytomedicine, 2025; 143, 156910. doi: 10.1016/j.phymed.2025.156910 [17] Wang C, Huang YM, Zhao J, et al. Fumarprotocetraric acid and geraniin were identified as novel inhibitors of human respiratory syncytial virus infection in vitro. Front Cell Infect Microbiol, 2024; 14, 1484245. doi: 10.3389/fcimb.2024.1484245 [18] Kim RH, Brinster NK. Practical direct immunofluorescence. Am J Dermatopathol, 2020; 42, 75−85. doi: 10.1097/DAD.0000000000001516 [19] Baghezza S, Mamache B, Bennoune O, et al. Pathological study and detection of Bovine parainfluenza 3 virus in pneumonic sheep lungs using direct immunofluorescence antibody technique. Comp Clin Path, 2021; 30, 301−10. doi: 10.1007/s00580-021-03211-6 [20] Landry ML, Ferguson D, Cohen S, et al. Detection of human metapneumovirus in clinical samples by immunofluorescence staining of shell vial centrifugation cultures prepared from three different cell lines. J Clin Microbiol, 2005; 43, 1950−2. doi: 10.1128/JCM.43.4.1950-1952.2005 -

 点击查看大图
计量
- 文章访问数: 58
- HTML全文浏览量: 24
- PDF下载量: 0
- 被引次数: 0

 Quick Links