


HTML
-
The global burden and deaths from cardiovascular disease (CVD) have been increasing in recent years due to population aging and population growth[1, 2]. Therefore, clinical and epidemiological studies have been primarily focusing on the effective prevention of CVD in its early stage. In 2010, the American Heart Association established the concept of ideal cardiovascular health (CVH) for primordial prevention, aiming to reduce the burden of CVD by 20% by the year 2020 in US adults[3]. CVH includes seven health behaviors and health factors, including smoking status, physical activity, body mass index (BMI), and healthy diet score and levels of blood pressure (BP), total cholesterol (TC), and fasting blood glucose. Studies have suggested that achieving an ideal CVH is associated with a lower risk of developing CVD events[4-6] and CVD mortality[7, 8] in different populations.
From the perspective of prevention, the early stage of CVD, i.e., subclinical atherosclerosis, is of particular importance because prevention measures can be effectively implemented at this stage before the onset of clinical events[9]. Previous research has documented the relationship between ideal CVH and subclinical atherosclerosis[10-13], reporting that subjects with higher numbers of ideal CVH metrics were less likely to have arterial stiffness in both western and Chinese populations. Furthermore, cross-sectional studies have reported that microalbuminuria as a measure of endothelial dysfunction, carotid plaques and increased carotid intima-media thickness (CIMT) as a measure of local vascular lesions, and increased brachial-ankle pulse wave velocity (baPWV) as a measure of arterial stiffness were associated with ideal CVH[10, 12, 14-17]. However, prospective analyses on the association between ideal CVH and incident or progressive subclinical atherosclerosis are limited and inconsistent findings have been reported[18-20]. Moreover, previous studies had used a relatively small sample size and generally examined single subclinical atherosclerosis measures. Therefore, using data obtained from a large community-based cohort of middle-aged and elderly adults in Shanghai, we conducted a prospective analysis to assess whether ideal CVH is associated with a lower risk of developing subclinical atherosclerosis, which was comprehensively evaluated by carotid plaques, increased CIMT, increased baPWV, and microalbuminuria.
-
This cohort study aimed at examining the status of CVH and its related metabolic diseases in a community-based population of Chinese adults in the suburb of Shanghai. The baseline details and design of the study have been published elsewhere[21]. In brief, a total of 10, 375 participants aged ≥ 40 years living in Jiading district of Shanghai were screened for cardiometabolic diseases and subclinical atherosclerosis between March and August 2010. A standard questionnaire, was used by trained stalf through face-to-face interviews to collect the information about their sociodemographic characteristics, disease history, medication use, physical activity, and drinking and smoking status. Participants with any of the following criteria were excluded: 1) CVD history such as myocardial infarction, stroke, or other self-reported CVDs, 2) known kidney diseases such as kidney stone, glomerulonephritis, nephropathy, macroalbuminuria, or other self-reported kidney diseases, 3) missing data on CVH metrics such as smoking status, physical activity, BMI, BP, TC, or blood glucose level, and 4) missing data on carotid plaques, CIMT, baPWV, or urinary albumin-to- creatinine ratio (UACR). A total of 8, 395 participants with complete baseline information were included in the cross-sectional analysis. Follow-up visits were carried out between August 2014 through May 2015, and examinations of subclinical atherosclerosis measures and other related measurements were conducted a second time using the same study protocols and procedures as those at the baseline examination. We further excluded the following participants: 1) those who died during follow-up, 2) those who did not attend the follow-up visit, and 3) those who attended the follow-up visit but had missing data on subclinical atherosclerosis measures. Finally, a total of 4, 879 participants were included in the prospective analysis (Figure 1). The demographic characteristics and the metabolic factors were similar between those who did not attend the follow-up visit and those who did attend.
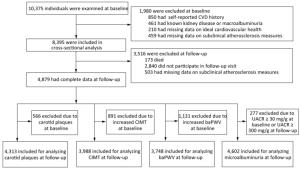
Figure 1. Flow chart of the study population.
This study was approved by the Institutional Review Board of Rui-Jin Hospital affiliated to Shanghai Jiao Tong University School of Medicine, and written informed consent was obtained from each participant.
-
BP was measured on the nondominant arm of each participant after at least 10 min of sitting rest using an automated device (OMRON Model HEM- 752 FUZZY; Omron Co., Dalian, China) three times consecutively with 1-min interval, and the mean of the three measurements was used for analysis. Body height and weight were measured with light clothes and without shoes, nearest to 0.1 cm and 0.1 kg, respectively. BMI was calculated as body weight divided by body height squared (kg/m2). Physical activity at leisure time and at work was recorded using the International Physical Activity Questionnaire[22]. Metabolic equivalent hours per week (MET-h/wk) were calculated. Information regarding smoking was acquired by asking about current and lifetime habits of smoking, age at initiation and cessation, and the number of cigarettes smoked daily.
Venous blood samples were collected after at least 10 h of overnight fasting, and post-load glucose levels were measured using a standard 75-g oral glucose tolerance test. Blood glucose level was measured on an autoanalyzer (Modular P800; Roche, Basel, Switzerland) using the glucose oxidation method. The levels of TC, high-density lipoprotein cholesterol (HDL-c), low-density lipoprotein cholesterol (LDL-c), and triglyceride (TG) were also measured on an autoanalyzer (Modular E170; Roche, Basel, Switzerland) using the chemiluminescence method. A first morning spot urine sample was obtained from each participant, and the urine albumin and creatinine levels were measured using the immunoturbidimetric method (Beijing Atom High-Tech, Beijing, China) and the Jaffe's kinetic method on an automatic analyzer (Hitachi 7600-020, Tokyo, Japan), respectively. UACR (mg/g) was calculated as the urinary albumin concentration divided by the urinary creatinine concentration.
CIMT measurements and detection of carotid plaques were performed by an experienced sonographer using a high-resolution B-mode tomographic ultrasound system (Esaote Biomedica SpA, Italy) with a linear 7.5-MHz transducer. The CIMT was measured on the far wall of the right and left common carotid arteries, 1.5 cm proximal to the bifurcation. The distance between the leading edge of the first echogenic line and that of the second echogenic line at the end of diastole was calculated as the CIMT of either side. The larger value of the right and left CIMT was used for analysis. Furthermore, the presence of carotid plaques was determined at sections of the common carotid bulb, the internal carotid, and the external carotid, defined as a focal protrusion exceeding 50% of the surrounding wall.
A Colin VP-1000 device (Model BP203RPE II, form PWV/ABI) was used to measure the baPWV of all participants after 10 min of rest. After placing the cuffs on the right and left upper arms and the right and left ankles, pulse waves were obtained simultaneously. The time delay of obtaining and the distance of the right and left upper arms to the right and left ankles were included in the calculation of the right and left baPWV. The larger value of either side was used for analysis.
-
Hypertension was defined as a systolic BP level ≥ 130 mmHg and/or a diastolic BP level ≥ 80 mmHg and/or taking any BP-lowering medications. Diabetes mellitus was defined as a fasting blood glucose level ≥ 126 mg/dL and/or a post-load glucose level ≥ 200 mg/dL and/or taking any glucose-lowering medications. Dyslipidemia was defined as a TC level ≥ 240 mg/dL and/or an LDL-c level ≥ 160 mg/dL and/or a TG level ≥ 200 mg/dL and/or an HDL-c level ≤ 40 mg/dL and/or taking any lipid-lowering medications, according to the criteria of the third report of the US National Cholesterol Education Program/Adult Treatment Panel (NCEP ATP Ⅲ).
Increased CIMT or increased baPWV was defined as levels within the upper quartile of the study population[23, 24]. Therefore, different CIMT/ baPWV cutoff points for upper quartiles at baseline and at follow-up were used because participants with increased CIMT/baPWV at baseline were excluded from the prospective analysis. Microalbuminuria was defined as a UACR of 30-299 mg/g, and macroalbuminuria was defined as a UACR ≥ 300 mg/g.
New development of major adverse cardiovascular events (MACEs) was defined as fatal or nonfatal myocardial infarction or stroke, whichever came first after baseline survey. MACEs were identified through questionnaires at the examination center or by telephone call or door-to-door visit by community health staff for those participants who were unable to attend the examination center. Therefore, the total number of participants was greater than that in the analysis for subclinical atherosclerosis.
-
Six CVH metrics, including smoking status, physical activity, BMI, BP, serum TC, and fasting blood glucose level, were used for the assessment of ideal CVH. Each metric was dichotomized into an ideal level and a nonideal level according to the American Heart Association definition[3]. In brief, smoking status at the ideal level was defined as never smoking or quit smoking for more than 12 months. Physical activity at the ideal level was defined as moderate-intensity activity ≥ 150 min/wk or vigorous-intensity activity ≥ 75 min/wk or their combination ≥ 150 min/wk. BMI at the ideal level was defined as < 25 kg/m2. BP at the ideal level was defined as a systolic BP < 120 mmHg and a diastolic BP < 80 mmHg in the absence of taking any BP-lowering medications. Serum TC at the ideal level was defined as < 200 mg/dL in the absence of taking any lipid-lowering medications. Fasting glucose at the ideal level was defined as < 100 mg/dL without any glucose-lowering medications. The number of ideal CVH metrics was calculated by adding the number of CVH metrics that were at the ideal level. For instance, if the number of ideal CVH metrics of a participant is 3, it implies that 3 CVH metrics among the overall 6 metrics are at the ideal level. In the present study, only 68 (0.81%) participants were having all the 6 ideal metrics and without CVD history, similar to that reported in previous studies in both Chinese and western populations[25-27].
-
All statistical analyses were performed using the SAS software version 9.4 (SAS Institute, Cary, NC). All continuous variables with normal distribution were expressed as mean ± standard deviation (s). Continuous variables with skewed distribution were presented as medians (interquartile ranges) and log-transformed before analysis. Categorical variables were presented as numbers (percentages). Participants were classified into groups with 0-1, 2, 3, 4, and 5-6 ideal CVH metrics. The prevalence and the incidence of different measures of subclinical atherosclerosis were calculated according to the different numbers of ideal CVH metrics at baseline. Linear regression models were used to examine the association between baseline CVH and levels of CIMT, baPWV, and UACR at follow-up. Logistic regression models were used to evaluate the association of baseline CVH and risks of developing carotid plaques, increased CIMT, increased baPWV, and microalbuminuria at follow-up. Covariates used in the fully adjusted model included sex, age, drinking status, education, and baseline values of CIMT, baPWV, and UACR. Cox regression models were used to calculate the hazard ratios and 95% confidence intervals (C ) for incident MACEs. In the sensitivity analysis, we further included systolic BP, blood glucose level, and BMI as covariates.
A two-sided P value < 0.05 was considered to be statistically significant.
Study Population
Data Collection
Definition
CVH Measurements
Statistical Analysis
-
Table 1 shows the baseline characteristics of the study population. Approximately 15.2%, 27.9%, 30.8%, 19.1%, and 7.0% of the participants had 0-1, 2, 3, 4, and 5-6 ideal CVH metrics, respectively. Of the total population, 62.4% were women, and the mean age was 57.8 ± 9.4 years. The mean age decreased and the proportions of women and participants with ≥ 9 years of education increased with increasing numbers of ideal CVH metrics.
Variables Total Numbers of Ideal CVH Metrics at Baseline P for Trend 0-1 2 3 4 5-6 Number of participants (%) 8, 395 (100) 1, 275 (15.2) 2, 342 (27.9) 2, 583 (30.8) 1, 607 (19.1) 588 (7.0) Age (years) 57.8 ± 9.4 58.7 ± 8.9 59.0 ± 9.2 58.1 ± 9.1 56.7 ± 10.2 52.9 ± 8.7 < 0.0001 Women, n (%) 5, 236 (62.4) 501 (39.3) 1, 379 (58.9) 1, 704 (66.0) 1, 172 (72.9) 480 (81.6) < 0.0001 ≥ 9 years of education, n (%) 5, 497 (65.7) 805 (63.4) 1, 443 (61.8) 1, 630 (63.4) 1, 131 (70.5) 488 (83.1) < 0.0001 Current drinkers, n (%) 863 (10.6) 247 (19.7) 253 (11.1) 230 (9.2) 108 (6.9) 25 (4.4) < 0.0001 Physical activity (METs-h/wk) 23.1 (0.0-102.3) 23.1 (0.0-92.4) 23.1 (0.0-69.3) 23.1 (0.0-92.4) 40.0 (0.0-132.0) 51.1 (0.0-153.6) < 0.0001 BMI (kg/m2) 25.1 ± 3.2 27.4 ± 2.6 26.3 ± 3.0 24.5 ± 3.0 23.2 ± 2.5 22.3 ± 2.0 < 0.0001 Systolic BP (mmHg) 140.4 ± 19.8 147.4 ± 18.5 145.9 ± 18.2 141.2 ± 18.2 133.2 ± 19.1 119.1 ± 16.5 < 0.0001 Diastolic BP (mmHg) 82.8 ± 10.3 86.6 ± 10.0 85.2 ± 9.7 83.0 ± 9.6 79.3 ± 9.9 73.3 ± 8.6 < 0.0001 Total cholesterol (mg/dL) 206.3 ± 39.2 229.5 ± 39.7 216.9 ± 37.7 202.3 ± 37.5 188.9 ± 32.2 178.3 ± 23.2 < 0.0001 Triglyceride (mg/dL) 103.0 (72.9-146.6) 133.8 (98.5-192.5) 116.5 (83.5-162.4) 98.5 (71.4-136.1) 85.0 (63.2-117.3) 72.6 (54.9-101.5) < 0.0001 LDL-c (mg/dL) 123.1 ± 33.1 140.0 ± 31.5 131.6 ± 32.9 120.1 ± 32.3 109.9 ± 28.5 101.3 ± 21.4 < 0.0001 HDL-c (mg/dL) 51.4 ± 12.3 49.2 ± 11.7 51.0 ± 12.2 52.0 ± 13.2 52.2 ± 11.7 52.9 ± 10.9 < 0.0001 FPG (mg/dL) 99.5 ± 26.6 120.4 ± 36.9 103.4 ± 28.9 94.5 ± 19.4 89.8 ± 14.0 86.5 ± 7.1 < 0.0001 2hPG (mg/dL) 146.4 ± 75.7 196.2 ± 99.8 158.0 ± 82.6 135.3 ± 62.2 121.1 ± 45.8 110.6 ± 29.5 < 0.0001 Hypertension, n (%) 6, 520 (77.7) 1, 200 (94.1) 2, 120 (90.5) 2, 093 (81.0) 980 (61.0) 127 (21.6) < 0.0001 Diabetes, n (%) 1, 415 (16.9) 542 (42.5) 512 (21.9) 274 (10.6) 76 (4.7) 11 (1.9) < 0.0001 Dyslipidemia, n (%) 3, 299 (39.3) 961 (75.4) 1, 630 (69.6) 1, 494 (57.8) 639 (39.8) 86 (14.6) < 0.0001 Subclinical atherosclerosis measures CIMT (mm) 0.58 ± 0.11 0.62 ± 0.12 0.60 ± 0.11 0.58 ± 0.10 0.56 ± 0.10 0.53 ± 0.08 < 0.0001 baPWV (cm/s) 1598.2 ± 363.3 1681.0 ± 353.4 1660.5 ± 355.8 1603.5 ± 370.2 1520.3 ± 350.2 1359.8 ± 262.1 < 0.0001 UACR (mg/g) 4.80 (2.77-8.85) 5.18 (2.84-10.40) 5.02 (2.90-9.67) 4.77 (2.67-8.73) 4.61 (2.68-8.22) 4.19 (2.77-7.15) < 0.0001 Note. CVH, cardiovascular health; MET-h/wk, metabolic equivalent hours per week; BMI, body-mass index; BP, blood pressure; LDL-c, low-density lipoprotein cholesterol; HDL-c, high-density lipoprotein cholesterol; FPG, fasting plasma glucose; 2hPG, 2-hour post-load glucose; CIMT, carotid intima-media thickness; baPWV, brachial-ankle pulse wave velocity; UACR, urinary albumin-to-creatinine ratio. All continuous variables were expressed as mean ± SD or medians (interquartile ranges). Table 1. Characteristics of the Study Population at Baseline
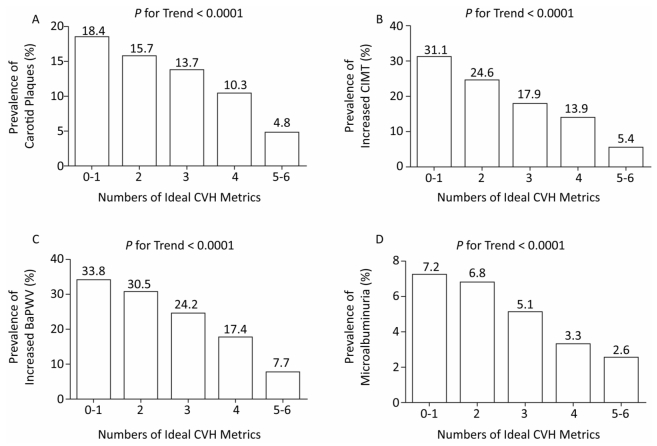
In the cross-sectional analysis of the total 8, 395 participants at baseline, the prevalence of different atherosclerosis measures is presented in Figure 2. The prevalence rates of carotid plaques, increased CIMT, increased baPWV, and microalbuminuria at baseline were found to decrease with better CVH status (all P values for trend < 0.0001). Similar findings were obtained in the subgroup analysis (Supplementary Tables S1-S4 available in www. besjournal.com), when the study population was stratified by sex or age (< 60 years or ≥ 60 years). Remarkably, participants with 5-6 ideal CVH metrics still had 4.8%, 5.4%, 7.7%, and 2.6% prevalence rates of carotid plaques, increased CIMT, increased baPWV, and microalbuminuria, respectively.
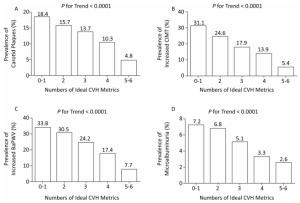
Figure 2. Prevalence of different measures of subclinical atherosclerosis according to numbers of ideal CVH metrics at baseline. P values for trend were adjusted for age and sex. CVH, cardiovascular health.
Measures of Subclinical Atherosclerosis at Baseline Total Number of Ideal CVH Metrics at Baseline P for Trend 0-1 2 3 4 5-6 Carotid plaques Cases/participants 301/5, 201 75/735 97/1, 351 83/1, 574 38/1, 065 8/476 < 0.0001 (%) (5.8) (10.2) (7.2) (5.3) (3.6) (1.7) Increased CIMT Cases/participants 577/5, 201 169/735 198/1, 351 135/1, 574 62/1, 065 13/476 < 0.0001 (%) (11.1) (23.0) (14.7) (8.6) (5.8) (2.7) Increased baPWV Cases/participants 625/5, 201 149/735 225/1, 351 173/1, 574 67/1, 065 11/476 < 0.0001 (%) (12.0) (20.3) (16.7) (11.0) (6.3) (2.3) Microalbuminuria Cases/participants 245/5, 201 46/735 81/1, 351 64/1, 574 44/1, 065 10/476 < 0.0001 (%) (4.7) (6.3) (6.0) (4.1) (4.1) (2.1) Table Supplementary Table S1. Prevalence of Different Measures of Subclinical Atherosclerosis in Middle-aged Participants (40-60 years) According to Numbers of Ideal CVH Metrics at Baseline
Measures of Subclinical Atherosclerosis at Baseline Total Number of Ideal CVH Metrics at Baseline P for Trend 0-1 2 3 4 5-6 Carotid plaques Cases/participants 849/3, 194 160/540 270/991 271/1, 009 128/542 20/112 0.0046 (%) (26.6) (29.6) (27.3) (26.9) (23.6) (17.9) Increased CIMT Cases/participants 1114/3, 194 228/540 379/991 327/1, 009 161/542 19/112 < 0.0001 (%) (34.9) (42.2) (38.2) (32.4) (29.7) (17.0) Increased baPWV Cases/participants 1470/3, 194 282/540 490/991 451/1, 009 213/542 34/112 < 0.0001 (%) (46.0) (52.2) (49.5) (44.7) (39.3) (30.4) Microalbuminuria Cases/participants 216/3, 194 46/540 78/991 68/1, 009 19/542 5/112 0.0005 (%) (6.8) (8.5) (7.9) (6.7) (3.5) (4.5) Table Supplementary Table S2. Prevalence of Different Measures of Subclinical Atherosclerosis in Elderly Participants (≥ 60 years) According to Numbers of Ideal CVH Metrics at Baseline
Measures of Subclinical Atherosclerosis at Baseline Total Number of Ideal CVH Metrics at Baseline P for Trend 0-1 2 3 4 5-6 Carotid plaques Cases/participants 550/3, 159 154/774 172/963 141/879 74/435 9/108 0.0063 (%) (17.4) (19.9) (17.9) (16.0) (17.0) (8.3) Increased CIMT Cases/participants 952/3, 159 285/774 311/963 224/879 118/435 14/108 < 0.0001 (%) (30.1) (36.8) (32.3) (25.5) (27.1) (13.0) Increased baPWV Cases/participants 767/3, 159 221/774 247/963 204/879 85/435 10/108 < 0.0001 (%) (24.3) (28.6) (25.7) (23.2) (19.5) (9.3) Microalbuminuria Cases/participants 128/3, 159 42/774 45/963 29/879 10/435 2/108 0.0012 (%) (4.1) (5.4) (4.7) (3.3) (2.3) (1.9) Table Supplementary Table S3. Prevalence of Different Measures of Subclinical Atherosclerosis in Male Participants According to Numbers of Ideal CVH Metrics at Baseline
Measures of Subclinical Atherosclerosis at Baseline Total Number of Ideal CVH Metrics at Baseline P for Trend 0-1 2 3 4 5-6 Carotid plaques Cases/participants 600/5, 236 81/501 195/1, 379 213/1, 704 92/1, 172 19/480 < 0.0001 (%) (11.5) (16.2) (14.1) (12.5) (7.9) (4.0) Increased CIMT Cases/participants 739/5, 236 112/501 266/1, 379 238/1, 704 105/1, 172 18/480 < 0.0001 (%) (14.1) (22.4) (19.3) (14.0) (9.0) (3.8) Increased baPWV Cases/participants 1328/5, 236 210/501 468/1, 379 420/1, 704 195/1, 172 35/480 < 0.0001 (%) (25.4) (41.9) (33.9) (24.7) (16.6) (7.3) Microalbuminuria Cases/participants 333/5, 236 50/501 114/1, 379 103/1, 704 53/1, 172 13/480 < 0.0001 (%) (6.4) (10.0) (8.3) (6.0) (4.5) (2.3) Table Supplementary Table S4. Prevalence of Different Measures of Subclinical Atherosclerosis in Female Participants According to Numbers of Ideal CVH Metrics at Baseline
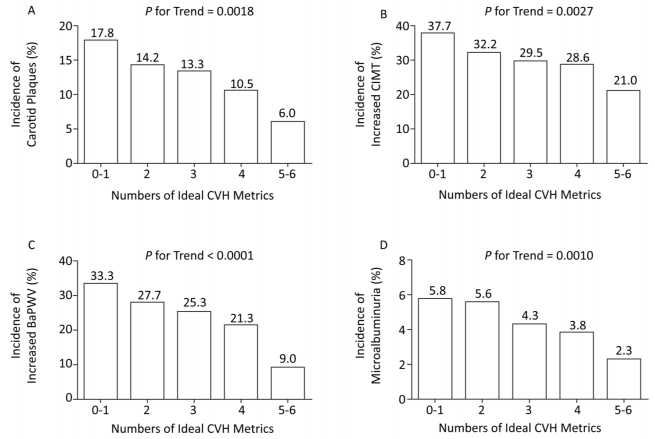
After a median 4.3-year follow-up period, a total of 571 (13.2%) among 4, 313 participants without carotid plaques at baseline had developed new plaques. In addition, 214 (4.65%) among 4, 602 participants with normal UACR at baseline had developed microalbuminuria. The incidence rates of carotid plaques and microalbuminuria were found to decrease significantly with increasing numbers of ideal CVH metrics (both P values for trend < 0.01, Figure 3). The development of increased CIMT or increased baPWV defined as the highest quartile among participants at follow-up was also found to decrease significantly (both P values for trend < 0.01, Figure 3).

Figure 3. Incidence of different measures of subclinical atherosclerosis at follow-up according to numbers of ideal CVH metrics at baseline. P values for trend were adjusted for age and sex. CVH, cardiovascular health.
As shown in Table 2, the numbers of ideal CVH metrics at baseline were inversely associated with CIMT levels at follow-up, after adjustment for baseline CIMT levels and other covariates, including age, sex, drinking status, and education. A similar decreasing trend was found for measurements of baPWV and UACR at follow-up, when the numbers of ideal CVH metrics at baseline increased. Taking participants with 0-1 ideal CVH metric as reference, participants with 2, 3, 4, and 5-6 ideal CVH metrics were found to have 19%, 20%, 34%, and 54% decreased risk of developing carotid plaques, respectively, after adjustment for age, sex, drinking status, and education level (P value for trend = 0.0016, Table 3). The corresponding proportions were 16%, 24%, 22%, and 43% for increased CIMT; 29%, 36%, 49%, and 74% for increased baPWV; and 15%, 36%, 43%, and 58% for microalbuminuria. The inverse association remained significant after further adjustment for baseline levels of CIMT and UACR in the respective analyses (both P values for trend < 0.05, Table 3), whereas it was borderline significant for baPWV after adjustment for baseline baPWV levels (P for trend = 0.0568).
Measures of Subclinical Atherosclerosis at Follow-up Numbers of Ideal CVH Metrics at Baseline P for Trend 0-1 2 β (SE) 3 β (SE) 4 β (SE) 5-6 β (SE) Model 1 CIMT 0 (ref) -0.020 (0.007) -0.028 (0.007) -0.030 (0.008) -0.059 (0.010) < 0.0001 baPWV 0 (ref) -0.310 (0.132) -0.502 (0.129) -0.843 (0.138) -2.146 (0.179) < 0.0001 Log (UACR) 0 (ref) -0.021 (0.020) -0.053 (0.019) -0.047 (0.021) -0.074 (0.029) 0.0012 Model 2 CIMT 0 (ref) -0.014 (0.007) -0.020 (0.007) -0.016 (0.007) -0.037 (0.010) 0.0016 baPWV 0 (ref) -0.372 (0.121) -0.535 (0.119) -0.785 (0.129) -1.667 (0.167) < 0.0001 Log (UACR) 0 (ref) -0.049 (0.019) -0.086 (0.019) -0.078 (0.021) -0.079 (0.029) 0.0001 Model 3 CIMT 0 (ref) -0.014 (0.007) -0.019 (0.007) -0.014 (0.008) -0.035 (0.010) 0.0049 baPWV 0 (ref) -0.306 (0.098) -0.170 (0.097) -0.213 (0.105) -0.460 (0.138) 0.0505 Log (UACR) 0 (ref) -0.032 (0.018) -0.058 (0.018) -0.049 (0.020) -0.048 (0.028) 0.0124 Note. Model 1 was unadjusted. Model 2 was adjusted for sex, age, drinking status, and education. Model 3 was further adjusted for baseline CIMT (for analysis of CIMT at follow-up), baseline baPWV (for analysis of baPWV at follow-up), and baseline UACR (for analysis of UACR at follow-up) based on model 2. β values are regression coefficients. UACR was log10-transformed in linear regression analysis. CVH, cardiovascular health; SE, standard error; CIMT, carotid intima-media thickness; baPWV, brachial-ankle pulse wave velocity; UACR, urinary albumin-to-creatinine ratio. Table 2. The Association of Numbers of Ideal CVH Metrics at Baseline with Subclinical Atherosclerosis Measures at Follow-up in Linear Regression Analysis
Incidence of Subclinical Atherosclerosis at Follow-up Numbers of Ideal CVH Metrics at Baseline P for Trend P for Interaction* P for Interaction** 0-1 2 OR (95% CI) 3 OR (95% CI) 4 OR (95% CI) 5-6 OR (95% CI) Model 1 Carotid plaque 1 (ref) 0.77 (0.59-0.99) 0.71 (0.55-0.92) 0.54 (0.40-0.73) 0.29 (0.18-0.49) < 0.0001 - - Increased CIMT 1 (ref) 0.79 (0.63-0.98) 0.69 (0.56-0.86) 0.66 (0.52-0.84) 0.44 (0.32-0.61) < 0.0001 - - Increased baPWV 1 (ref) 0.77 (0.61-0.96) 0.68 (0.54-0.85) 0.54 (0.42-0.70) 0.20 (0.13-0.31) < 0.0001 - - Microalbuminuria 1 (ref) 0.97 (0.65-1.44) 0.73 (0.49-1.10) 0.65 (0.41-1.04) 0.38 (0.17-0.87) 0.0024 - - Model 2 Carotid plaque 1 (ref) 0.81 (0.62-1.06) 0.80 (0.61-1.05) 0.66 (0.48-0.91) 0.46 (0.27-0.79) 0.0016 0.2209 0.7406 Increased CIMT 1 (ref) 0.84 (0.67-1.05) 0.76 (0.61-0.95) 0.78 (0.61-0.99) 0.57 (0.41-0.81) 0.0020 0.0326 0.9836 Increased baPWV 1 (ref) 0.71 (0.56-0.91) 0.64 (0.50-0.82) 0.51 (0.38-0.67) 0.26 (0.16-0.41) < 0.0001 < 0.0001 0.0823 Microalbuminuria 1 (ref) 0.85 (0.57-1.28) 0.64 (0.42-0.98) 0.57 (0.35-0.93) 0.42 (0.18-0.95) 0.0020 0.7880 0.4624 Model 3 Increased CIMT 1 (ref) 0.85 (0.68-1.06) 0.77 (0.62-0.96) 0.80 (0.63-1.03) 0.60 (0.42-0.84) 0.0060 0.0424 0.9947 Increased baPWV 1 (ref) 0.67 (0.51-0.89) 0.79 (0.60-1.04) 0.68 (0.50-0.93) 0.57 (0.34-0.97) 0.0568 0.0041 0.5361 Microalbuminuria 1 (ref) 0.94 (0.62-1.43) 0.74 (0.48-1.13) 0.68 (0.41-1.12) 0.49 (0.21-1.14) 0.0195 0.8011 0.5561 Note. Model 1 was unadjusted. Model 2 was adjusted for sex, age, drinking status, and education. Model 3 was further adjusted for baseline CIMT (for analysis of increased CIMT at follow-up), baseline baPWV (for analysis of increased baPWV at follow-up), and baseline UACR (for analysis of microalbuminuria at follow-up) based on model 2. CVH, cardiovascular health; OR, odds ratio; CI, confidence interval; CIMT, carotid intima-media thickness; baPWV, brachial-ankle pulse wave velocity. *Interactions between age at baseline (continuous variable) and numbers of ideal CVH metrics (0-1, 2, 3, 4, or 5-6) on subclinical atherosclerosis. **Interactions between sex (male or female) and numbers of ideal CVH metrics (0-1, 2, 3, 4, or 5-6) on subclinical atherosclerosis. Table 3. Risks of Developing Subclinical Atherosclerosis at Follow-up in Association with Numbers of Ideal CVH Metrics at Baseline
The prevalence and the incidence of different measures of subclinical atherosclerosis according to the numbers of ideal CVH metrics at baseline in the subgroups of age (40-60 vs. ≥ 60 years) and sex (men vs. women) are shown in Supplementary Tables S1-S8 (available in www.besjournal.com). Significant interactions of age and CVH were found on CIMT and baPWV progression (Table 3).
Measures of Subclinical Atherosclerosis at Follow-up Total Number of Ideal CVH Metrics at Baseline P for Trend 0-1 2 3 4 5-6 Carotid plaques cases/participants 254/2, 969 56/397 71/801 77/912 42/604 8/255 < 0.0001 (%) (8.6) (14.1) (8.9) (8.4) (7.0) (3.1) Increased CIMT cases/participants 755/2, 811 127/336 213/741 229/886 140/596 46/252 < 0.0001 (%) (26.9) (37.8) (28.7) (25.9) (23.5) (18.3) Increased baPWV cases/participants 493/2, 773 100/356 147/716 162/859 70/590 14/252 < 0.0001 (%) (17.8) (28.1) (20.5) (18.9) (11.9) (5.6) Microalbuminuria cases/participants 102/3, 007 18/420 33/815 28/925 19/595 4/252 0.0431 (%) (3.4) (4.3) (4.0) (3.0) (3.2) (1.6) Table Supplementary Table S5. Incidence of Different Measures of Subclinical Atherosclerosis at Follow-up in Middle-aged Participants (40-60 years) According to Numbers of Ideal CVH Metrics at Baseline
Measures of Subclinical Atherosclerosis at Follow-up Total Number of Ideal CVH Metrics at Baseline P for Trend 0-1 2 3 4 5-6 Carotid plaques cases/participants 313/1, 344 55/228 101/412 102/430 45/227 10/47 0.2582 (%) (23.3) (24.1) (24.5) (23.7) (19.8) (21.3) Increased CIMT cases/participants 460/1, 177 70/187 135/341 147/388 91/213 17/48 0.6290 (%) (39.1) (37.4) (39.6) (37.9) (42.7) (35.4) Increased baPWV cases/participants 442/975 71/157 129/281 134/312 96/188 12/37 0.9981 (%) (45.3) (45.2) (45.9) (43.0) (51.1) (32.4) Microalbuminuria cases/participants 112/1, 595 22/276 40/493 33/501 14/271 3/54 0.1125 (%) (7.0) (8.0) (8.1) (6.6) (5.2) (5.6) Table Supplementary Table S6. Incidence of Different Measures of Subclinical Atherosclerosis at Follow-up in Elderly Participants (≥ 60 years) According to Numbers of Ideal CVH Metrics at Baseline
Measures of Subclinical Atherosclerosis at Follow-up Total Number of Ideal CVH Metrics at Baseline P for Trend 0-1 2 3 4 5-6 Carotid plaques cases/participants 263/1, 519 68/378 91/475 72/422 27/195 5/49 0.0855 (%) (17.3) (18.0) (19.2) (17.1) (13.9) (10.2) Increased CIMT cases/participants 464/1, 278 119/296 137/381 131/378 64/176 13/47 0.1150 (%) (36.2) (40.2) (36.0) (34.7) (36.4) (27.7) Increased baPWV cases/participants 369/1, 380 104/344 106/413 98/387 56/189 5/47 0.1067 (%) (26.7) (30.2) (25.7) (25.3) (29.6) (10.6) Microalbuminuria cases/participants 59/1, 712 20/442 20/530 15/473 3/215 1/52 0.0353 (%) (3.5) (4.5) (3.8) (3.2) (1.4) (1.9) Table Supplementary Table S7. Incidence of Different Measures of Subclinical Atherosclerosis at Follow-up in Male Participants According to Numbers of Ideal CVH Metrics at Baseline
Measures of Subclinical Atherosclerosis at Follow-up Total Number of Ideal CVH Metrics at Baseline P for Trend 0-1 2 3 4 5-6 Carotid plaques cases/participants 304/2, 794 43/247 81/738 107/920 60/636 13/253 < 0.0001 (%) (10.9) (17.4) (11.0) (11.6) (9.4) (5.1) Increased CIMT cases/participants 751/2, 710 78/227 211/701 245/896 167/633 50/252 0.0002 (%) (27.7) (34.4) (30.1) (27.3) (26.4) (19.8) Increased baPWV cases/participants 566/2, 368 67/169 170/584 198/784 110/589 21/242 < 0.0001 (%) (23.9) (39.6) (29.1) (25.3) (18.7) (8.7) Microalbuminuria cases/participants 155/2, 890 20/254 53/778 46/953 30/651 6/254 0.0008 (%) (5.4) (7.9) (6.8) (4.8) (4.6) (2.4) Table Supplementary Table S8. Incidence of Different Measures of Subclinical Atherosclerosis at Follow-up in Female Participants According to Numbers of Ideal CVH Metrics at Baseline
We also examined the association between ideal CVH metrics and newly developed MACEs. A total of 385 participants had developed fatal or nonfatal myocardial infarction or stroke during the follow-up, including 2.94% of those with 5-6 ideal CVH metrics and 6.82% of those with 0-1 ideal CVH metrics at baseline (Supplementary Table S9 available in www. besjournal.com). Results of the Cox regression analysis, taking participants with 0-1 ideal CVH metrics as reference, showed that participants with 2, 3, 4, and 5-6 ideal metrics had a lower risk for MACEs, and the hazard ratios (95% CI) were 1.00 (0.76-1.33), 0.71 (0.53-0.96), 0.66 (0.49-0.93), and 0.43 (0.24-0.76), respectively, in the unadjusted model, with P for trend < 0.0001 (Supplementary Table S9). In the adjusted model of age, sex, drinking status, and education, the dose-response association was found to be still significant (P for trend = 0.0019).
Model Numbers of Ideal CVH Metrics at Baseline P for Trend 0-1 2 HR (95% CI) 3 HR (95% CI) 4 HR (95% CI) 5-6 HR (95% CI) Cases/participants (%) 74/1, 085 (6.82) 135/2, 011 (6.71) 104/2, 180 (4.77) 58/1, 326 (4.37) 14/476 (2.94) Model 1 1 (ref) 1.00 (0.76-1.33) 0.71 (0.53-0.96) 0.66 (0.49-0.93) 0.43 (0.24-0.76) < 0.0001 Model 2 1 (ref) 0.95 (0.71-1.26) 0.71 (0.52-0.96) 0.68 (0.48-0.96) 0.60 (0.33-1.07) 0.0019 Model 3 1 (ref) 1.11 (0.83-1.49) 0.95 (0.68-1.33) 1.02 (0.68-1.53) 1.01 (0.54-1.90) 0.7734 Note. Model 1 was unadjusted. Model 2 was adjusted for sex, age, drinking status, and education. Model 3 was further adjusted for systolic blood pressure, blood glucose and body mass index based on model 2. MACEs, major adverse cardiovascular events; CVH, cardiovascular health; HR, hazard ratio; CI, confidence interval. Table Supplementary Table S9. Risks of Developing MACEs During Follow-up in Association with Numbers of Ideal CVH Metrics at Baseline
BP, blood glucose level, and BMI are key factors for the development of atherosclerosis and MACEs. Although they were included in the concept of CVH, we took them into further adjustment model to test sensitivity. As shown in Supplementary Table S9 (in model 3), the association between ideal CVH and MACEs was attenuated after further adjustment of systolic BP, blood glucose level, and BMI. However, the associations of ideal CVH with the progression of CIMT and UACR were still significant in the linear regression analysis (P for trend = 0.0092 and 0.0460, respectively, Supplementary Table S10 available in www.besjournal.com) and also with the development of carotid plaques and increased CIMT in the logistic regression analysis (P for trend = 0.0166 and 0.0377, respectively, Supplementary Table S11 available in www.besjournal.com).
Measures of Subclinical Atherosclerosis at Follow-up Numbers of Ideal CVH Metrics at Baseline P for Trend 0-1 2 β (SE) 3 β (SE) 4 β (SE) 5-6 β (SE) Model 1 CIMT 0 (ref) -0.020 (0.007) -0.028 (0.007) -0.030 (0.008) -0.059 (0.010) < 0.0001 baPWV 0 (ref) -0.310 (0.132) -0.502 (0.129) -0.843 (0.138) -2.146 (0.179) < 0.0001 logUACR 0 (ref) -0.021 (0.020) -0.053 (0.019) -0.047 (0.021) -0.074 (0.029) 0.0012 Model 2 CIMT 0 (ref) -0.014 (0.007) -0.020 (0.007) -0.016 (0.007) -0.037 (0.010) 0.0016 baPWV 0 (ref) -0.372 (0.121) -0.535 (0.119) -0.785 (0.129) -1.667 (0.167) < 0.0001 logUACR 0 (ref) -0.049 (0.019) -0.086 (0.019) -0.078 (0.021) -0.079 (0.029) 0.0001 Model 3 CIMT 0 (ref) -0.014 (0.007) -0.019 (0.007) -0.014 (0.008) -0.035 (0.010) 0.0049 baPWV 0 (ref) -0.306 (0.098) -0.170 (0.097) -0.213 (0.105) -0.460(0.138) 0.0505 logUACR 0 (ref) -0.032 (0.018) -0.058 (0.018) -0.049 (0.020) -0.048 (0.028) 0.0124 Model 4 CIMT 0 (ref) -0.016 (0.007) -0.022 (0.008) -0.018 (0.009) -0.038 (0.001) 0.0092 baPWV 0 (ref) -0.201 (0.102) -0.009 (0.108) -0.007 (0.124) -0.188 (0.159) 0.7285 logUACR 0 (ref) -0.005 (0.019) -0.016 (0.020) -0.010 (0.024) -0.025 (0.032) 0.0460 Note. Model 1 was unadjusted. Model 2 was adjusted for sex, age, drinking status, and education. Model 3 was further adjusted for baseline CIMT (for analysis of CIMT at follow-up), baseline baPWV (for analysis of baPWV at follow-up), and baseline UACR (for analysis of UACR at follow-up) based on model 2. Model 4 was further adjusted for systolic blood pressure, blood glucose and body mass index based on mode 3. β values are regression coefficients. UACR was log10-transformed in linear regression analysis. CVH, cardiovascular health; SE, standard error; CIMT, carotid intima-media thickness; baPWV, brachial-ankle pulse wave velocity; UACR, urinary albumin-to-creatinine ratio. Table Supplementary Table S10. The Association of Numbers of Ideal CVH Metrics at Baseline with Subclinical Atherosclerosis Measures at Follow-up in Linear Regression Analysis
Incidence of Subclinical Atherosclerosis at Follow-up Numbers of Ideal CVH Metrics at Baseline P for Trend P for Interaction* P for Interaction** 0-1 2 OR (95% CI) 3 OR (95% CI) 4 OR (95% CI) 5-6 OR (95% CI) Model 1 Carotid plaque 1 (ref) 0.77 (0.59-0.99) 0.71 (0.55-0.92) 0.54 (0.40-0.73) 0.29 (0.18-0.49) < 0.0001 - - Increased CIMT 1 (ref) 0.79 (0.63-0.98) 0.69 (0.56-0.86) 0.66 (0.52-0.84) 0.44 (0.32-0.61) < 0.0001 - - Increased baPWV 1 (ref) 0.77 (0.61-0.96) 0.68 (0.54-0.85) 0.54 (0.42-0.70) 0.20 (0.13-0.31) < 0.0001 - - Microalbuminuria 1 (ref) 0.97 (0.65-1.44) 0.73 (0.49-1.10) 0.65 (0.41-1.04) 0.38 (0.17-0.87) 0.0024 - - Model 2 Carotid plaque 1 (ref) 0.81 (0.62-1.06) 0.80 (0.61-1.05) 0.66 (0.48-0.91) 0.46 (0.27-0.79) 0.0016 0.2209 0.7406 Increased CIMT 1 (ref) 0.84 (0.67-1.05) 0.76 (0.61-0.95) 0.78 (0.61-0.99) 0.57 (0.41-0.81) 0.0020 0.0326 0.9836 Increased baPWV 1 (ref) 0.71 (0.56-0.91) 0.64 (0.50-0.82) 0.51 (0.38-0.67) 0.26 (0.16-0.41) < 0.0001 < 0.0001 0.0823 Microalbuminuria 1 (ref) 0.85 (0.57-1.28) 0.64 (0.42-0.98) 0.57 (0.35-0.93) 0.42 (0.18-0.95) 0.0020 0.7880 0.4624 Model 3 Increased CIMT 1 (ref) 0.85 (0.68-1.06) 0.77 (0.62-0.96) 0.80 (0.63-1.03) 0.60 (0.42-0.84) 0.0060 0.0424 0.9947 Increased baPWV 1 (ref) 0.67 (0.51-0.89) 0.79 (0.60-1.04) 0.68 (0.50-0.93) 0.57 (0.34-0.97) 0.0568 0.0041 0.5361 Microalbuminuria 1 (ref) 0.94 (0.62-1.43) 0.74 (0.48-1.13) 0.68 (0.41-1.12) 0.49 (0.21-1.14) 0.0195 0.8011 0.5561 Model 4 Carotid plaque 1 (ref) 0.83 (0.62-1.09) 0.81 (0.60-1.09) 0.68 (0.47-0.99) 0.49 (0.28-0.89) 0.0166 0.2922 0.7080 Increased CIMT 1 (ref) 0.84 (0.67-1.06) 0.77 (0.60-0.99) 0.81 (0.61-1.08) 0.61 (0.42-0.90) 0.0377 0.0465 0.9521 Increased baPWV 1 (ref) 0.72 (0.54-0.96) 0.84 (0.61-1.15) 0.73 (0.50-1.05) 0.62 (0.35-1.09) 0.2014 0.0061 0.4898 Microalbuminuria 1 (ref) 1.28 (0.82-1.98) 1.26 (0.77-2.05) 1.44 (0.80-2.62) 1.21 (0.48-3.08) 0.3786 0.8479 0.3450 Note. Model 1 was unadjusted. Model 2 was adjusted for sex, age, drinking status, and education. Model 3 was further adjusted for baseline CIMT (for analysis of increased CIMT at follow-up), baseline baPWV (for analysis of increased baPWV at follow-up), and baseline UACR (for analysis of microalbuminuria at follow-up) based on model 2. Model 4 was further adjusted for systolic blood pressure, blood glucose and body mass index based on model 3. CVH, cardiovascular health; OR, odds ratio; CI, confidence interval; CIMT, carotid intima-media thickness; baPWV, brachial-ankle pulse wave velocity. *Interactions between age at baseline (continuous variable) and numbers of ideal CVH metrics (0-1, 2, 3, 4 or 5-6) on subclinical atherosclerosis. ** Interactions between sex (male or female) and numbers of ideal CVH metrics (0-1, 2, 3, 4 or 5-6) on subclinical atherosclerosis. Table Supplementary Table S11. Risks of Developing Subclinical Atherosclerosis at Follow-up in Association with Numbers of Ideal CVH metrics at Baseline
-
In this study of community-based cohort of middle-aged and elderly adults in China, we found a strong inverse association between ideal CVH and the prevalence and incidence of subclinical atherosclerosis, represented by carotid plaques, increased CIMT, increased baPWV, and microalbuminuria. Participants with better CVH showed graded smaller measurement values of CIMT, baPWV, and UACR after a median follow-up of 4.3 years. Compared with individuals with only 0-1 ideal CVH metric, those with more ideal CVH metrics had lower risks of newly developing subclinical atherosclerosis, and the relationship exhibited a dose-response effect. Further subgroup analysis demonstrated that the dose-response effect was attenuated significantly in older-aged adults (≥ 60 years) and partially weakened in male participants, which was supported by an interactive effect of age and CVH on CIMT and baPWV progression.
Only a small proportion (7.0%) of participants in this study had 5-6 ideal CVH metrics, and the majority had about 3 ideal metrics, a finding that is similar to that of previous studies in both Asian[25, 28] and western populations[4]. The prevalence of carotid plaques (4.8%), increased CIMT (5.4%), increased baPWV (7.7%), and microalbuminuria (2.55%) in participants with a relatively high level of CVH (5-6 ideal metrics) still represented a considerable proportion, which was consistent with the findings of Juan Miguel Fernández-Alvira et al. who reported that subclinical atherosclerosis was present even in the population with ideal CVH metrics[29]. We took an additional step of examining the correlation longitudinally and found that the presence of ideal CVH turned out to be a decreasing risk for the new development of subclinical atherosclerosis. This finding also explains from some aspect that the development of atherosclerosis is a comprehensive and life-perspective process and any optimization of modifiable factors might benefit for disease prevention.
High-risk plaques and the burden of atherosclerosis disease are responsible for major cardiovascular events[9]. The measures of subclinical atherosclerosis such as carotid plaques, increased CIMT, and increased baPWV used in our analysis have been commonly adopted in epidemiological studies, representing as strong predictors and also the early stage of CVD in several studies[30-33]. Microalbuminuria, which reflects endothelial dysfunction of kidneys and other vascular beds, could allow the early identification of vascular disease[34, 35]. Our knowledge regarding the association between CVH and subclinical atherosclerosis is largely based on cross-sectional studies[12, 14-17, 29]. As it has been well documented that subclinical atherosclerosis should be an underlying precursor for the life-course development of CVD[36] and ideal CVH has been identified to be associated with a much lower risk of developing CVD, it would be of great interest to confirm whether the prevention effect of ideal CVH on CVD is mediated by a reduced burden of subclinical atherosclerosis[10, 12]. Till date, only two reports have demonstrated a significant inverse association between ideal CVH and progression of coronary artery calcification[20, 37]. However, a longitudinal study conducted by Ran Sturlaugsdottir et al showed that old men with poor CVH at baseline had more extensive carotid atherosclerosis than those with better CVH at baseline, but the inferior CVH did not predict the progression of carotid atherosclerosis[18]. In addition, Guo Li et al. analyzed a Chinese cohort and found that individuals with a higher CVH score had a lower risk for incident carotid plaques after 2 years of follow-up[19]. These abovementioned studies have drawn inconsistent conclusions, which may be due to their limited sample sizes, the difference in the methodology of defining atherosclerosis, and the variety of population origin. Therefore, we adopted a longitudinal cohort of general population and defined subclinical atherosclerosis by different detection methods to further analyze the relationship between ideal CVH and subclinical atherosclerosis. To the best of our knowledge, our study is the first to examine the effect of ideal CVH on the development of carotid plaques, increased CIMT, increased baPWV, and microalbuminuria in a general population simultaneously, which might shed light on the possible disease pathways for the prevention effect of ideal CVH on CVD. In our study, we found significant interactions of age and CVH on CIMT and baPWV progression. To some extent, this finding could explain the inconsistent findings of previous studies, in which the characteristics of the study population as well as the measures of subclinical atherosclerosis differed.
There are studies that have examined the association between ideal CVH and subclinical CVD. The Framingham Offspring Cohort Study evaluated subclinical CVD symptoms such as increased CIMT, left ventricular hypertrophy, left ventricular systolic dysfunction, microalbuminuria, and decreased ankle-brachial index of 1, 842 participants and assessed their CVH score[6]. The study reported that ideal CVH was associated with lower odds of prevalent subclinical atherosclerosis in these participants of European origin. Similar findings were also demonstrated in a Chinese population undergoing regular health checkups[14]. Furthermore, Zhang Yanlei et al. recently reported that increased CIMT and carotid plaques independently predicted an elevated 5-year risk of CVD development in a population-based cohort of Chinese adults aged ≥ 55 years[38]. However, these studies lack prospective data on CVH predicting lower risks of developing subclinical CVD, and these data have been provided now by the present study. We detected an inverse association between ideal CVH at baseline and the development of subclinical atherosclerosis at follow-up, which indicates that a healthy lifestyle and strict control of metabolic factors would contribute to the prevention of atherosclerosis.
In addition, in the current study cohort, we found a significant inverse association between ideal CVH and MACEs after adjustment for age, sex, drinking status, and education. Although the association was attenuated after further adjustment for systolic BP, blood glucose level, and BMI, it indicated that these risk factors played a key role in lowering the risk for MACEs. Meanwhile, this result is consistent with the findings of Professor Gu Dongfeng that ideal CVH is inversely associated with the development of CVD events in Chinese adults when the authors used age, sex, living region, urbanization, alcohol use, education, family history of CVD, and cohort sources in their full adjustment model[5]. Our results add to the evidence that ideal CVH might lower CVD risk by reducing the burden of subclinical atherosclerosis. In addition, BP, blood glucose level, and BMI are key factors for the development of subclinical atherosclerosis and CVD and are indeed included in the concept of ideal CVH. Previous studies that have examined the association between ideal CVH and subclinical atherosclerosis (or CVD) had neither considered BP, blood glucose level, and BMI as confounding factors nor corrected them in the regression analysis model[4, 5, 7, 37]. In our study, to test sensitivity, we further corrected BP, blood glucose level, and BMI (in model 3 of Supplementary Table S9 and in model 4 of Supplementary Tables 10-11) and found that the inverse association between ideal CVH and the development of carotid plaques and increased CIMT remained robust. This further confirmed that the combined effect of CVH metrics is beneficial for the prevention of atherosclerosis.
The progression of CVD is of life-course nature, which might initiate from high-risk factors to subclinical disease and then progress to clinical CVD and serious cardiovascular events[36]. Published data from some famous cohort studies such as the Cardiovascular Risk in Young Finns Study and the Coronary Artery Risk Development in Young Adults (CARDIA) Study have demonstrated that a healthy lifestyle such as the adoption of ideal CVH in young and early life would contribute to a later benefit of prevention of subclinical atherosclerosis[39, 40]. Our data contribute to the growing evidence that not only in the young but also in the middle- and older-aged period, during which people are already at high risk of developing atherosclerosis, the adoption of ideal CVH would induce a potential preventive effect.
The strengths of this study are the large sample size of 8, 395 participants comprising both men and women and the longitudinal design with a median follow-up period of 4.3 years. It is also worth noting that the four measurements detected by different methods were all repeated at baseline and at follow-up. However, we also need to acknowledge several limitations in our study. First, we did not have information regarding dietary habits. However, as our results and those of others[6] have shown, the benefit of ideal CVH is dose-responsive and graded. Thus, missing one of CVH metrics would not skew or reverse the relationship between CVH and its outcome. Second, we did not use coronary artery calcification score to predict the early stage of CVD, which has been believed to be one of the most robust markers at present[41]. Although the progression of CVD is a complex pathologic process, a comprehensive evaluation of several other key indicators in the present study might somehow reduce the gap. Third, smoking habits and physical activity were self-reported, and recall bias could not be exempted. However, as our sample size was large and the participants were unaware of the study purpose, it was unlikely that a subjective bias could affect the outcome. Finally, although the dose-response effect was prominent and P for trend was < 0.0001 in the total study population, the significance was attenuated in the subgroup analysis, especially in older-aged participants, and a prominent interactive effect was also detected between age and CVH level on CIMT and baPWV progression.
In conclusion, in this large community-based cohort of middle-aged and elderly population, we found that the numbers of ideal CVH metrics were inversely associated with the presence and the development of subclinical atherosclerosis. The dose-response benefit of CVH was attenuated in older-aged population and partially weakened in male participants. Our results suggest that ideal CVH plays a protective role in atherosclerosis development, especially in the middle-aged population.
-
We declare that we have no conflicts of interest.
the grants from National Key R&D Program of China 2016YFC1304904
the 'Gaofeng Gaoyuan Program for Clinical Scientists' from Shanghai Jiao Tong University School of Medicine 20161307
the National Natural Science Foundation of China 81561128019
the Shanghai Municipal Commission of Health and Family Planning 15GWZK0802
the grants from National Key R&D Program of China 2016YFC1305600
the Three-year Action Plan on Public Health 15GWZK0802
the grants from National Key R&D Program of China 2017YFC1310700
the 'Gaofeng Gaoyuan Program for Clinical Scientists' from Shanghai Jiao Tong University School of Medicine 20161301
the grants from National Key R&D Program of China 2016YFC0901200
the National Natural Science Foundation of China 81622011

 Quick Links
 DownLoad: