

 下载:
下载:


-
A polipoprotein CIII (apoCIII), a protein secreted by the liver and intestines, is a component of chylomicrons, very low density lipoprotein (VLDL), and high density lipoprotein (HDL) [1-2]. The best-described function of apoCIII is the inhibition of lipoprotein lipase (LPL), and it has also been found to be involved in the clearance of triglyceride (TG)-rich lipoprotein (TRL) remnants via the hepatic LDL receptor (LDLR) [1]. Additionally, apoCIII could increase the liver synthesis and secretion of TRL and modulate intestinal lipid absorption [1, 3-4]. Moreover, it may be a potential stimulator of vascular inflammation and promote the atherogenicity of lipoproteins, including HDL, VLDL, and LDL [5].
Genetic and biological approaches coupled with population studies on apoCIII have demonstrated its role in lipid metabolism [1, 6-7]. There is a growing body of evidence indicating that apoCIII as a multifunctional protein is involved in other metabolic process such as glucose metabolism [8-10]. The APOCIII gene has been shown to affect levels of risk factors and the onset of chronic disease, including metabolic disease [11].
Metabolic syndrome (MetS) is a constellation of metabolic risk factors and is characterized by a state of chronic, low-grade inflammation [12-13]. MetS and its associated chronic diseases have been recognized as major public health concerns [14-16]. In the present study, we aimed from a clinical perspective to investigate the associations of plasma apoCIII levels with the metabolic and inflammatory traits, and, further, to detect the underlying role of apoCIII in the association of inflammation with the development of MetS by means of a mediation analysis, using a cohort of Chinese patients not treated with lipid-lowering drugs and who were undergoing coronary angiography (CAG), as described in the previous study [17].
-
From October 2012 to July 2015: a total of 1455 patients were enrolled in the study. The ethical approval and the inclusion and exclusion criteria of the present study were consistent with those of our previous study [17]. Briefly, we consecutively enrolled patients who were not treated with lipid-lowering drugs before study enrollment and who were scheduled to undergo their first CAG in our division. Patients with acute coronary syndrome, serious heart failure or arrhythmia, psychiatric disorders, infectious or systematic inflammatory disease within 1 month, significant hematologic disorders, thyroid dysfunction, severe liver dysfunction (more than 3 times the upper limits of normal aspartate aminotransferase and/or alanine aminotransferase), renal insufficiency (creatinine > 1.5 mg/dL), or malignant tumors were excluded. Because lipid-lowering medication elevates plasma apoCIII levels and lipid traits [18], confounding the associations, individuals taking any lipid-lowering agent prior to entering the study were also excluded. After the initial enrollment and the collection of clinical characteristics and blood specimens based on provision of fully informed consent, patients then received standard medical treatment from their cardiologists.
MetS was diagnosed according to the criteria of the Chinese Diabetes Society (CDS). Subjects who met three or more of the following four criteria were defined to have MetS, as reported previously [19]: 1) overweight/obesity: body mass index (BMI) ≥ 25 kg/m2; 2) hyperglycemia: fasting blood glucose (FBG) ≥ 6.1 mmol/L or receiving antidiabetic medication; 3) dyslipidemia: fasting TG ≥ 1.7 mmol/L or HDL-cholesterol (HDL-C) < 0.9 mmol/L (men) or HDL-C < 1.0 mmol/L (women); and 4) hypertension: blood pressure (BP) ≥ 140/90 mmHg or receiving antihypertensive medication.
-
The concentrations of the plasma lipid and inflammatory markers were measured as previously described [17]. Plasma apoCIII levels were measured using the RayBio® ELISA kit (RayBiotech Inc., Norcross, GA, USA), which is an in vitro enzyme- linked immunosorbent assay for quantitative measurement and employs an antibody specific for Human ApoCIII. The minimum detectable dose of Human ApoCIII was determined to be 2.5 pg/mL.
-
The values were expressed as the mean ± standard deviation (SD) or median (Q1-Q3 quartiles) or the number (percentage) where appropriate. The differences between groups were analyzed using independent samples t-test, Mann-Whitney U-test, χ2-tests, or Fisher's exact test. To investigate the associations of plasma apoCIII and inflammatory markers with the number of MetS risk components, ordered logistic regression analyses were performed without any adjustment. Correlations between continuous variables were assessed with the Pearson correlation coefficient, and log-normalizations were used for variables with positively skewed distribution [apoCIII, TG, high sensitivity C-reactive protein (hs-CRP)]. The adjusted odds ratios (ORs) and 95% confidence intervals (95% CIs) for MetS incidence by difference status of MetS risk components and apoCIII levels were calculated using multivariable logistic models with adjustment for potential confounding factors including age, gender, and hs-CRP. Additionally, to examine whether apoCIII levels were involved in the association between inflammation and MetS development, we performed mediation analyses [17], which assessed an intermediate variable as a mediator (apoCIII) in the pathway between a risk factor (inflammation) and an outcome (MetS), estimating the extent to which the effect of the risk factor occurred through the mediator. The mediation analyses were performed according to three models: one for explaining the outcome (MetS) of an exposure (inflammation), one for explaining the mediator (apoCIII) for inflammation, and the other for estimating the association of the mediator and inflammation with the MetS. The analyses were performed with adjustment for age, sex, and TG. A P-value < 0.05 was considered statistically significant. The statistical analyses were performed with SPSS version 19.0 software (SPSS Inc., Chicago, IL, USA).
-
Basic characteristics of the study population are summarized in Table [1] A total of 1455 patients were enrolled in the analyses. Among these, 561 (38.6%) patients had been determined to have MetS, while the remaining 894 patients did not have MetS. According to the presence of metabolic components (overweight/obesity, hypertension, hypertriglyc eridemia and/or hypo HDL cholesterolemia, hyperglycemia), we found only 82 patients (5.6%) who were free of any metabolic disorders.
Patients with MetS were older than those without (56.6 ± 9.9 vs. 54.2 ± 11.7 years, P < 0.001) and 64.7% and 56.6% of patients with and without MetS, respectively, were men (P = 0.002). Additionally, the rates of the presence of each MetS risk component, in turn, were hypo HDL cholesterolemia (58.0%), hypertension (53.7%), overweight/obesity (52.8%), hypertriglyceridemia (42.0%), and hyperglycemia (25.0%) in the total population; and hypertension (89.7%), overweight/obesity (86.3%), hypo HDL cholesterolemia (73.4%), hypertriglyceridemia (53.5%), and hyperglycemia (53.5%) in patients with MetS.
Table 1. Baseline Characteristics in Patients with or without MetS
Characteristics All Patients (n = 1455) With MetS (n = 561) Without MetS ( n = 894) P-value Age (years) 55.1 ± 11.1 56.6 ± 9.9 54.2 ± 11.7 < 0.001 Gender, men% (n) 59.7 (869) 64.7 (363) 56.6 (506) 0.002 Overweight/obesity, % (n) 52.8 (769) 86.3 (484) 31.9 (285) < 0.001 Hypertension, % (n) 53.7 (781) 89.7 (503) 31.1 (278) < 0.001 Hypertriglyceridemia, % (n) 42.0 (610) 53.5 (300) 34.7 (310) < 0.001 HypoHDL cholesterolemia, % (n) 58.0 (844) 73.4 (412) 48.3 (432) < 0.001 Hyperglycemia, % (n) 25.0 (364) 53.5 (300) 7.2 (64) < 0.001 BMI (kg/m2) 25.4 ± 3.5 27.5 ± 3.1 24.1 ± 3.0 < 0.001 SBP (mmHg) 129 ± 17 135±17 125±16 < 0.001 DBP (mmHg) 80 ± 11 85 ± 12 78 ± 10 < 0.001 TG (mmol/L) 1.6 (1.1-2.2) 1.9 (1.4-2.6) 1.4 (1.0-2.0) < 0.001 TC (mmol/L) 4.9 ± 1.1 5.0 ± 1.1 4.9 ± 1.1 0.112 HDL-C (mmol/L) 1.1 ± 0.3 1.0 ± 0.3 1.2 ± 0.4 < 0.001 LDL-C (mmol/L) 3.2 ± 1.0 3.3 ± 0.9 3.2 ± 1.0 0.006 Non-HDL-C (mmol/L) 3.8 ± 1.0 3.9 ± 1.0 3.7 ± 1.0 < 0.001 apoA1 (g/L) 1.4 ± 0.3 1.3 ± 0.3 1.4 ± 0.3 < 0.001 apoB (g/L) 1.1 ± 0.3 1.1 ± 0.3 1.0 ± 0.3 < 0.001 Glucose (mmol/L) 5.6 ± 1.6 6.2 ± 2.1 5.2 ± 1.0 < 0.001 HbA1C (%) 6.0 ± 1.0 6.4 ± 1.2 5.7 ± 0.7 < 0.001 hs-CRP (mg/L) 1.2 (0.6 - 2.6) 1.7 (0.8 - 3.4) 1.1 (0.5 - 2.2) < 0.001 WBC count (×109/L) 6.25 ± 1.68 6.48 ± 1.68 6.11 ± 1.67 < 0.001 apoCIII (μg/mL) 86.8 (64.0 - 121.8) 95.1 (73.1 - 131.4) 81.7 (58.6 - 112.4) < 0.001 Note. Data shown are mean ± SD, median (Q1-Q3 quartiles), or % (n). The bold values indicate statistical significance and are bolded to improve the readability of the table. BMI, body mass index; SBP, systolic blood pressure; DBP, diastolic blood pressure; TG, triglyceride; TC, total cholesterol; HDL-C, high density lipoprotein cholesterol; LDL-C, low density lipoprotein cholesterol; Non-HDL-C, non-high density lipoprotein cholesterol; apo, apolipoprotein; HbA1C, hemoglobin A1C; hs-CRP, high sensitivity C-reactive protein; WBC, white blood cell. -
Patients with MetS showed higher levels of apoCIII than those without [apoCIII 95.1 (73.1-131.4) vs. 81.7 (58.6-112.4) μg/mL, P < 0.001] (Table 1). As shown in Figure 1: according to the number of MetS risk components (overweight/obesity, hyperglycemia, hypo HDL cholesterolemia and/or hypertriglyceridemia, hypertension), patients were divided into five groups: patients with 0 risk components (n = 82), 1 component (n = 355), 2 components (n = 457), 3 components (n = 412) and 4 components (n = 149). We found that apoCIII levels increased with the number of MetS risk components [60.0 (42.9-78.2) vs. 76.6 (57.7-102.2) vs. 87.6 (63.8-125.9) vs. 91.2 (71.1-125.6) vs. 115.4 (82.2-144.9) μg/mL, P for trend < 0.001]. The logistic regression analyses showed that compared to patients with 0 risk components of MetS, the ORs (95% CIs) of apoCIII levels for patients with 1: 2: 3: and 4 components were 1.016 (1.003-1.028), 1.022 (1.010-1.035), 1.024 (1.012-1.037), and 1.030 (1.017-1.042), respectively (Table 2).
Table 2. The Regression Analysis Regarding the Association of apoCIII, hs-CRP, and WBC with Number of MetS Factors
Number of Mets Factors apoCIII (μg/mL) hs-CRP (mg/mL) WBC (×109/L) OR (95% CI) P-value OR (95% CI) P-value OR (95% CI) P-value 0 1 (reference) - 1 (reference) - 1 (reference) - 1 1.016 (1.003-1.028) 0.014 1.185 (1.023-1.372) 0.023 1.054 (0.989-1.159) 0.082 2 1.022 (1.010-1.035) < 0.001 1.207 (1.045-1.395) 0.011 1.157 (1.001-1.314) 0.041 3 1.024 (1.012-1.037) < 0.001 1.299 (1.126-1.501) < 0.001 1.243 (1.055-1.465) 0.009 4 1.030 (1.017-1.042) < 0.001 1.350 (1.164-1.566) < 0.001 1.302 (1.088-1.558) 0.004 Note. The bold values indicate statistical significance and are bolded to improve the readability of the table. 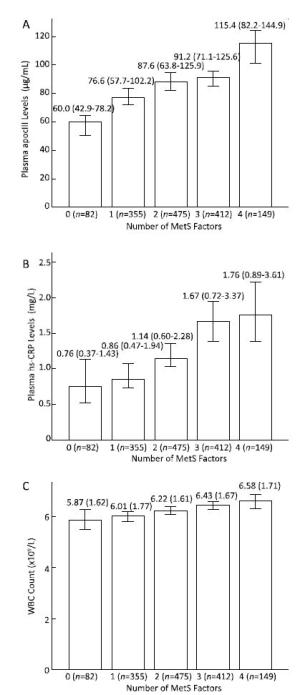
Figure 1. The associations of plasma apoCIII and inflammatory markers with the number of MetS risk components. Both levels of apoCIII (A) and inflammatory makers including hs-CRP (B), and WBC (C) increased with the number of MetS components (all P for trend < 0.001).
We additionally divided the patients according to the quartiles of apoCIII values to examine the presence of MetS in each metabolic disorder. As shown in Table 3: the prevalence of MetS rose in each MetS risk component as the levels of apoCIII increased (all P < 0.05). For example, in patients with overweight/obesity, patients who had higher apoCIII levels experienced a higher prevalence of MetS (Q1 vs. Q2 vs. Q3 vs. Q4: 53.8% vs. 59.4% vs. 66.0% vs. 70.7%, respectively, P for trend = 0.008). The same findings were also observed for apoCIII in patients with hypertension (48.9% vs. 58.2% vs. 71.5% vs. 75.7%, P for trend < 0.001), hypertriglyceridemia (17.7% vs. 37.5 vs. 51.6 vs. 55.4%, P for trend < 0.001), hypo HDL cholesterolemia (44.0% vs. 44.1% vs. 49.1% vs. 57.7%, P for trend = 0.034) and hyperglycemia (70.8% vs. 78.2% vs. 83.7% vs. 91.2%, P for trend = 0.01).
Table 3. Prevalence of MetS in Patients with Each MetS Factor according to ApoCIII Quartiles
Item Q1 Q2 Q3 Q4 P for Trend Total (N) 363 364 364 364 MetS, % (n) 27.8 (101) 36.3 (132) 42.3 (154) 47.8 (174) < 0.001 Overweight/obese (N) 173 187 194 215 MetS, % (n) 53.8 (93) 59.4 (111) 66.0 (128) 70.7 (152) 0.008 Hypertension (N) 176 184 207 214 MetS, % (n) 48.9 (86) 58.2 (107) 71.5 (148) 75.7 (162) < 0.001 Hypertriglyceridemia (N) 24 120 186 280 MetS, % (n) 17.7 (4) 37.5 (45) 51.6 (96) 55.4 (155) < 0.001 Hypo HDL cholesterolemia (N) 193 211 218 222 MetS, % (n) 44.0 (85) 44.1 (93) 49.1 (106) 57.7 (128) 0.034 Hyperglycemia (N) 65 87 98 114 MetS, % (n) 70.8 (46) 78.2 (68) 83.7 (82) 91.2 (104) 0.01 Note. The differences in prevalence between groups were analyzed using χ2-tests. Data shown are % (n). The bold values indicate statistical significance and are bolded to improve the readability of the table. MetS, metabolic syndrome; HDL-C, high density lipoprotein cholesterol; apo, apolipoprotein. In addition, we also found significant associations of apoCIII levels with virtually all MetS risk factors including BMI, systolic blood pressure (SBP), diastolic blood pressure (DBP), TG, total cholesterol (TC), LDL-C, non-HDL-C, apoA1: apoB, fasting glucose (FG), and hemoglobin A1C (HbA1C) (all P < 0.01) (Table 4).
Table 4. Correlations of apoCIII with Metabolic and Inflammatory Parameters
Variables Crude Coefficients P-value Adjusted Coefficients P-value BMI (kg/m2) 0.135 < 0.001 0.132 < 0.001 SBP (mmHg) 0.084 0.007 0.100 0.003 DBP (mmHg) 0.089 0.005 0.086 0.011 TG (mmol/L) 0.701 < 0.001 0.700 < 0.001 TC (mmol/L) 0.411 < 0.001 0.394 < 0.001 HDL-C (mmol/L) 0.015 0.569 0.012 0.624 LDL-C (mmol/L) 0.175 < 0.001 0.153 < 0.001 Non-HDL-C (mmol/L) 0.446 < 0.001 0.429 < 0.001 apoA1 (g/L) 0.160 < 0.001 0.135 < 0.001 apoB (g/L) 0.342 < 0.001 0.315 < 0.001 Glucose (mmol/L) 0.109 < 0.001 0.119 < 0.001 HbA1C (%) 0.151 < 0.001 0.134 < 0.001 WBC (×109/L) 0.100 < 0.001 0.085 0.011 hs-CRP (mg/L) 0.116 < 0.001 0.112 < 0.001 Note. The Pearson correlation coefficients are shown. Log-transformed TG, hs-CRP, and apoCIII levels were used in the analysis. The adjusted coefficients were adjusted for age and gender. The bold values indicate statistical significance and are bolded to improve the readability of the table. BMI, body mass index; SBP, systolic blood pressure; DBP, diastolic blood pressure; TG, triglyceride; TC, total cholesterol; HDL-C, high density lipoprotein cholesterol; LDL-C, low density lipoprotein cholesterol; Non-HDL-C, non-high density lipoprotein cholesterol; apo, apolipoprotein; HbA1C, hemoglobin A1C; hs-CRP, high sensitivity C-reactive protein; WBC, white blood cell. Finally, regression analyses were performed according to apoCIII levels and each MetS component to determine the extent to which apoCIII levels affected the association of MetS risk components with MetS development (Figure 2). We considered patients with levels of apoCIII ≤ 86.8 μg/mL (the median of the study population) as the low apoCIII group, and patients with levels > 86.8 μg/mL as the high apoCIII group. Patients who had low apoCIII and no MetS components were regarded as the reference group (OR = 1). Our data revealed that there were significant interactions between apoCIII levels and each MetS component in the development of MetS, since elevated risks of developing MetS were observed with high apoCIII in patients with each metabolic component. The adjusted ORs of high apoCIII (vs. low apoCIII) in overweight/obese, hypertensive, hypertriglycerid- emic, hypo HDL cholesterolemic and hyperglycemic subjects for MetS were 27.2 (vs. 14.6), 51.6 (vs. 28.1), 2.6 (vs. 1.7), 5.4 (vs. 3.9), and 29.6 (vs. 10.0), respectively.

Figure 2. The adjusted odds ratios (ORs) for MetS incidence by difference status of MetS risk components and apoCIII levels [overweight/obesity (A), hypertension (HT) (B), hypertriglyceridemia (HTG) (C), hypo HDL cholesterolemia (D), hyperglycemia (E)], (low apoCIII ≤ 86.8 μg/mL; high apoCIII > 86.8 μg/mL).
-
Consistent with the findings of previous studies [13], our data also showed that the markers of inflammation including levels of white blood cells (WBC) and high sensitivity C-reactive protein (hs-CRP) were significantly and positively correlated with the presence of MetS (Table 1), and levels of both hs-CRP and WBC were increased with the number of risk components (Figure 1). The patterns of findings in univariable and multivariable logistic regression analyses, with adjustment for age and gender, were essentially unchanged from their correlations, suggesting that WBC and hs-CRP levels were significant predictors of MetS (data not shown in Table).
Furthermore, as shown in Table 4: the levels of apoCIII were significantly and positively correlated with the inflammatory markers (WBC r = 0.100: P < 0.001, hs-CRP r = 0.116: P < 0.001, respectively). The correlations remained significant after adjustment for age and gender (WBC r = 0.085: P = 0.011, hs-CRP r = 0.112: P < 0.001, respectively).
Finally, in a model with MetS as the dependent variable, WBC or hs-CRP level as the independent variable, and apoCIII level as the mediator variable, with age, sex, and TG as covariates, the role of apoCIII level in the association of inflammation with MetS was evaluated (Table 5). Data from mediation analyses indicated that there was a 12.5% difference in MetS susceptibility that was attributed to the different hs-CRP levels (P < 0.001) and that 26.4% of this difference was mediated by increased apoCIII level (3.3% of the difference in MetS susceptibility was mediated by apoCIII level; P < 0.001 for the mediation effect). The apoCIII level had a similar mediation effect on the association between WBC and MetS incidence, and the effect size was 9.8%.
Table 5. The Role of apoCIII Level in the Association between Inflammation and MetS Development Evaluated by Mediation Analyses
Mediator Models Parameters Effect Size for MetS P-value apoCIII hs-CRP Total effect of inflammation 0.125 < 0.001 Effect not mediated by apoCIII 0.092 0.005 Effect mediated by apoCIII 0.033 < 0.001 Proportion of inflammation effect mediated by apoCIII 26.4 apoCIII WBC Total effect of inflammation 0.088 0.002 Effect not mediated by apoCIII 0.082 0.015 Effect mediated by apoCIII 0.006 0.021 Proportion of inflammation effect mediated by apoCIII 6.8 Note. Mediation analyses with apoCIII as a mediator for the associations of inflammation with MetS development were performed. The analysis is shown after adjustment for age, gender, and TG. The bold values indicate statistical significance and are bolded to improve the readability of the table. apoCIII, apolipoprotein CIII; MetS, metabolic syndrome; hs-CRP, high sensitivity C-reactive protein; WBC, white blood cell. -
From a relative large cohort of Chinese patients, who were not treated with lipid-lowering drugs before the first CAG, we examined the associations among plasma apoCIII levels, inflammation, and metabolic disorders, as well as the underlying role of plasma apoCIII levels in the effect of inflammation on the development of MetS.
Our principal findings were as summarized in Figure [3] We showed that apoCIII levels were positively associated with the metabolic factors and identified the associations between apoCIII levels and the development and severity of MetS. ApoCIII demonstrated higher levels in patients with MetS and increased with the number of MetS risk components. Remarkably, the prevalence of MetS whether in the overall population or in subgroups with each MetS risk component rose as the apoCIII levels increased. On the other hand, considering that inflammatory markers were associated with MetS development and severity, we examined whether apoCIII levels were involved in the association between inflammation and MetS. Our results showed that apoCIII levels were significantly and positively associated with the inflammatory markers including WBC and hs-CRP, and evidence from mediation analyses indicated that the effect of inflammation on MetS was partially mediated by the apoCIII level independently from TG. These findings (although observational) highlight the clinical importance of apoCIII levels in relation to metabolic health, and the potential of the protein to lower the burden of metabolic disorders in this population.
It is well recognized that MetS has become a worldwide epidemic that poses a substantial health burden to both individuals and society. In our study population, we found that the various MetS components were common. For example, 10.2% (149/1455) of the patients had all 4 risk components of MetS, 28.3% (412/1455) had 3 components, 31.4% (457/1455) had 2 components, and approximately 24.4% (355/1455) had 1 component. The prevalence of patients without any metabolic disorder (0 risk components of MetS) was only 5.6% (82/1455). Of note, previous studies reported that a progressive increase in cardiovascular risk was associated with each additional MetS component; thus, the presence of multiple components in patients would put them at high risk of disease and future complications [20-21]. The results of the current analysis might suggest a severe metabolic burden in Chinese patients undergoing CAG.
The biochemical properties of apoCIII [22] and its genetic variants [6] have been found to be significantly associated with plasma lipid traits and the sequelae [23]. Previous studies on lipid metabolism offered by lipidomics have accelerated our understanding of disease processes and identified new avenues of research into MetS [23]. In the present study, we suggested that apoCIII might be an important emerging target associated with MetS or a potent modulator of metabolic risk in our study patients. Of note, each MetS risk component, such as overweight/obesity, is strongly associated with MetS incidence, but the correlation is not always perfect [24]. Investigators have demonstrated that certain patients with obesity tend to be metabolically healthy, with obesity not clustering with other MetS risk components [24]. Although the factors determining healthy versus unhealthy obesity remain unclear, and it is also unclear how the concept of metabolically healthy obesity could be incorporated into clinical practice, the determination of other parameters related to MetS in addition to the four currently described components might be useful. The results of the present study demonstrated that apoCIII levels increased with the number of MetS risk components and contributed significantly to the risk of MetS development in patients with each MetS risk component. The data might underscore the need to consider apoCIII levels in evaluating the risk of MetS as well as the need to identify patients with higher apoCIII levels and higher numbers of MetS components as requiring more aggressive clinical management. Nevertheless, further studies are still required to confirm these findings and enable an understanding of the associations.

Figure 3. The associations of plasma apoCIII levels with metabolic and inflammatory traits.
There were several limitations of the present study. Firstly, the observational study indicated only association, but not causality, of plasma levels of apoCIII with MetS. However, the results from this study generated a hypothesis to explore the possible effect of the protein on the regulation of MetS. Moreover, considering that the enrolled patients were a highly selected group at high risk for CAD rather than a population-based cohort, the observed associations might not be generalizable across races and populations. The present study pointed out the importance of apoCIII in clinical settings, particularly in lipid clinics, but could not provide evidence for the general population.
-
In conclusion, our data firstly underlined the relationship of plasma apoCIII levels with the development and severity of MetS, as well as inflammatory markers. Further, we found that apoCIII might partially mediate the effect of inflammation on the development of MetS.
-
The authors have no conflicts of interest to disclose.
-
Wu Na Qiong and Li Sha collected and analyzed the data and wrote the manuscript; Li Jian Jun designed the research, analyzed the data, and edited and revised the manuscript; Zhu Cheng Gang, Guo Yuan Lin, Gao Ying, Qing Ping, and Dong Qian took part in the collection of data; Zhang Yan, Sun Jing, and Liu Geng contributed to collection of the blood samples.
doi: 10.3967/bes2017.001
Plasma apoCIII Levels in Relation to Inflammatory Traits and Metabolic Syndrome in Patients not Treated with Lipid-lowering Drugs Undergoing Coronary Angiography
-
Abstract:
Objective Assessment of the comprehensive relationship among apolipoprotein CIII (apoCIII) levels, inflammation, and metabolic disorders is rare. Methods A total of 1455 consecutive patients not treated with lipid-lowering drugs and undergoing coronary angiography were enrolled in this cross-sectional study. A mediation analysis was used to detect the underlying role of apoCIII in the association of inflammation with metabolic syndrome (MetS). Results Patients with MetS showed higher levels of apoCIII[95.1 (73.1-131.4) vs. 81.7 (58.6-112.4) μg/mL, P<0.001] and inflammatory markers[high sensitivity C-reactive protein, 1.7 (0.8-3.4) vs. 1.1 (0.5-2.2) mg/L; white blood cell count, (6.48±1.68) vs. (6.11±1.67)×109/L]. The levels of apoCIII and inflammatory markers increased with the number of metabolic risk components (all P<0.001). Furthermore, apoCIII levels were associated with virtually all individual MetS risk factors and inflammatory markers (all P<0.05). Importantly, the prevalence of MetS in each metabolic disorder rose as apoCIII levels increased (all P<0.05). Mediation analysis showed that apoCIII partially mediated the effect of inflammation on MetS independently from triglycerides. Conclusion Plasma apoCIII levels were significantly associated with the development and severity of MetS, and a role of apoCIII in the effect of inflammation on the development of MetS was identified. -
Key words:
- Apolipoprotein CIII /
- Inflammation /
- Metabolic syndrome
-
Figure 1. The associations of plasma apoCIII and inflammatory markers with the number of MetS risk components. Both levels of apoCIII (A) and inflammatory makers including hs-CRP (B), and WBC (C) increased with the number of MetS components (all P for trend < 0.001).
Figure 2. The adjusted odds ratios (ORs) for MetS incidence by difference status of MetS risk components and apoCIII levels [overweight/obesity (A), hypertension (HT) (B), hypertriglyceridemia (HTG) (C), hypo HDL cholesterolemia (D), hyperglycemia (E)], (low apoCIII ≤ 86.8 μg/mL; high apoCIII > 86.8 μg/mL).
Figure 3. The associations of plasma apoCIII levels with metabolic and inflammatory traits.
Table 1. Baseline Characteristics in Patients with or without MetS
Characteristics All Patients (n = 1455) With MetS (n = 561) Without MetS ( n = 894) P-value Age (years) 55.1 ± 11.1 56.6 ± 9.9 54.2 ± 11.7 < 0.001 Gender, men% (n) 59.7 (869) 64.7 (363) 56.6 (506) 0.002 Overweight/obesity, % (n) 52.8 (769) 86.3 (484) 31.9 (285) < 0.001 Hypertension, % (n) 53.7 (781) 89.7 (503) 31.1 (278) < 0.001 Hypertriglyceridemia, % (n) 42.0 (610) 53.5 (300) 34.7 (310) < 0.001 HypoHDL cholesterolemia, % (n) 58.0 (844) 73.4 (412) 48.3 (432) < 0.001 Hyperglycemia, % (n) 25.0 (364) 53.5 (300) 7.2 (64) < 0.001 BMI (kg/m2) 25.4 ± 3.5 27.5 ± 3.1 24.1 ± 3.0 < 0.001 SBP (mmHg) 129 ± 17 135±17 125±16 < 0.001 DBP (mmHg) 80 ± 11 85 ± 12 78 ± 10 < 0.001 TG (mmol/L) 1.6 (1.1-2.2) 1.9 (1.4-2.6) 1.4 (1.0-2.0) < 0.001 TC (mmol/L) 4.9 ± 1.1 5.0 ± 1.1 4.9 ± 1.1 0.112 HDL-C (mmol/L) 1.1 ± 0.3 1.0 ± 0.3 1.2 ± 0.4 < 0.001 LDL-C (mmol/L) 3.2 ± 1.0 3.3 ± 0.9 3.2 ± 1.0 0.006 Non-HDL-C (mmol/L) 3.8 ± 1.0 3.9 ± 1.0 3.7 ± 1.0 < 0.001 apoA1 (g/L) 1.4 ± 0.3 1.3 ± 0.3 1.4 ± 0.3 < 0.001 apoB (g/L) 1.1 ± 0.3 1.1 ± 0.3 1.0 ± 0.3 < 0.001 Glucose (mmol/L) 5.6 ± 1.6 6.2 ± 2.1 5.2 ± 1.0 < 0.001 HbA1C (%) 6.0 ± 1.0 6.4 ± 1.2 5.7 ± 0.7 < 0.001 hs-CRP (mg/L) 1.2 (0.6 - 2.6) 1.7 (0.8 - 3.4) 1.1 (0.5 - 2.2) < 0.001 WBC count (×109/L) 6.25 ± 1.68 6.48 ± 1.68 6.11 ± 1.67 < 0.001 apoCIII (μg/mL) 86.8 (64.0 - 121.8) 95.1 (73.1 - 131.4) 81.7 (58.6 - 112.4) < 0.001 Note. Data shown are mean ± SD, median (Q1-Q3 quartiles), or % (n). The bold values indicate statistical significance and are bolded to improve the readability of the table. BMI, body mass index; SBP, systolic blood pressure; DBP, diastolic blood pressure; TG, triglyceride; TC, total cholesterol; HDL-C, high density lipoprotein cholesterol; LDL-C, low density lipoprotein cholesterol; Non-HDL-C, non-high density lipoprotein cholesterol; apo, apolipoprotein; HbA1C, hemoglobin A1C; hs-CRP, high sensitivity C-reactive protein; WBC, white blood cell.  下载: 导出CSV
Table 2. The Regression Analysis Regarding the Association of apoCIII, hs-CRP, and WBC with Number of MetS Factors
Number of Mets Factors apoCIII (μg/mL) hs-CRP (mg/mL) WBC (×109/L) OR (95% CI) P-value OR (95% CI) P-value OR (95% CI) P-value 0 1 (reference) - 1 (reference) - 1 (reference) - 1 1.016 (1.003-1.028) 0.014 1.185 (1.023-1.372) 0.023 1.054 (0.989-1.159) 0.082 2 1.022 (1.010-1.035) < 0.001 1.207 (1.045-1.395) 0.011 1.157 (1.001-1.314) 0.041 3 1.024 (1.012-1.037) < 0.001 1.299 (1.126-1.501) < 0.001 1.243 (1.055-1.465) 0.009 4 1.030 (1.017-1.042) < 0.001 1.350 (1.164-1.566) < 0.001 1.302 (1.088-1.558) 0.004 Note. The bold values indicate statistical significance and are bolded to improve the readability of the table.
下载: 导出CSV
Table 3. Prevalence of MetS in Patients with Each MetS Factor according to ApoCIII Quartiles
Item Q1 Q2 Q3 Q4 P for Trend Total (N) 363 364 364 364 MetS, % (n) 27.8 (101) 36.3 (132) 42.3 (154) 47.8 (174) < 0.001 Overweight/obese (N) 173 187 194 215 MetS, % (n) 53.8 (93) 59.4 (111) 66.0 (128) 70.7 (152) 0.008 Hypertension (N) 176 184 207 214 MetS, % (n) 48.9 (86) 58.2 (107) 71.5 (148) 75.7 (162) < 0.001 Hypertriglyceridemia (N) 24 120 186 280 MetS, % (n) 17.7 (4) 37.5 (45) 51.6 (96) 55.4 (155) < 0.001 Hypo HDL cholesterolemia (N) 193 211 218 222 MetS, % (n) 44.0 (85) 44.1 (93) 49.1 (106) 57.7 (128) 0.034 Hyperglycemia (N) 65 87 98 114 MetS, % (n) 70.8 (46) 78.2 (68) 83.7 (82) 91.2 (104) 0.01 Note. The differences in prevalence between groups were analyzed using χ2-tests. Data shown are % (n). The bold values indicate statistical significance and are bolded to improve the readability of the table. MetS, metabolic syndrome; HDL-C, high density lipoprotein cholesterol; apo, apolipoprotein.
下载: 导出CSV
Table 4. Correlations of apoCIII with Metabolic and Inflammatory Parameters
Variables Crude Coefficients P-value Adjusted Coefficients P-value BMI (kg/m2) 0.135 < 0.001 0.132 < 0.001 SBP (mmHg) 0.084 0.007 0.100 0.003 DBP (mmHg) 0.089 0.005 0.086 0.011 TG (mmol/L) 0.701 < 0.001 0.700 < 0.001 TC (mmol/L) 0.411 < 0.001 0.394 < 0.001 HDL-C (mmol/L) 0.015 0.569 0.012 0.624 LDL-C (mmol/L) 0.175 < 0.001 0.153 < 0.001 Non-HDL-C (mmol/L) 0.446 < 0.001 0.429 < 0.001 apoA1 (g/L) 0.160 < 0.001 0.135 < 0.001 apoB (g/L) 0.342 < 0.001 0.315 < 0.001 Glucose (mmol/L) 0.109 < 0.001 0.119 < 0.001 HbA1C (%) 0.151 < 0.001 0.134 < 0.001 WBC (×109/L) 0.100 < 0.001 0.085 0.011 hs-CRP (mg/L) 0.116 < 0.001 0.112 < 0.001 Note. The Pearson correlation coefficients are shown. Log-transformed TG, hs-CRP, and apoCIII levels were used in the analysis. The adjusted coefficients were adjusted for age and gender. The bold values indicate statistical significance and are bolded to improve the readability of the table. BMI, body mass index; SBP, systolic blood pressure; DBP, diastolic blood pressure; TG, triglyceride; TC, total cholesterol; HDL-C, high density lipoprotein cholesterol; LDL-C, low density lipoprotein cholesterol; Non-HDL-C, non-high density lipoprotein cholesterol; apo, apolipoprotein; HbA1C, hemoglobin A1C; hs-CRP, high sensitivity C-reactive protein; WBC, white blood cell.
下载: 导出CSV
Table 5. The Role of apoCIII Level in the Association between Inflammation and MetS Development Evaluated by Mediation Analyses
Mediator Models Parameters Effect Size for MetS P-value apoCIII hs-CRP Total effect of inflammation 0.125 < 0.001 Effect not mediated by apoCIII 0.092 0.005 Effect mediated by apoCIII 0.033 < 0.001 Proportion of inflammation effect mediated by apoCIII 26.4 apoCIII WBC Total effect of inflammation 0.088 0.002 Effect not mediated by apoCIII 0.082 0.015 Effect mediated by apoCIII 0.006 0.021 Proportion of inflammation effect mediated by apoCIII 6.8 Note. Mediation analyses with apoCIII as a mediator for the associations of inflammation with MetS development were performed. The analysis is shown after adjustment for age, gender, and TG. The bold values indicate statistical significance and are bolded to improve the readability of the table. apoCIII, apolipoprotein CIII; MetS, metabolic syndrome; hs-CRP, high sensitivity C-reactive protein; WBC, white blood cell.
下载: 导出CSV
-
[1] Kohan AB. Apolipoprotein C-III:a potent modulator of hypertriglyceridemia and cardiovascular disease. Curr Opin Endocrinol Diabetes Obes, 2015; 22, 119-25. doi: 10.1097/MED.0000000000000136 [2] Mahley RW, Innerarity TL, Rall SC Jr, et al. Plasma lipoproteins:apolipoprotein structure and function. J Lipid Res, 1984; 25, 1277-94. [3] Sundaram M, Zhong S, Bou Khalil M, et al. Expression of apolipoprotein C-III in McA-RH7777 cells enhances VLDL assembly and secretion under lipid-rich conditions. J Lipid Res, 2010; 51, 150-61. doi: 10.1194/M900346-JLR200 [4] Wang F, Kohan AB, Dong HH, et al. Overexpression of apolipoprotein C-III decreases secretion of dietary triglyceride into lymph. Physiol Rep, 2014; 2, e00247. https://www.researchgate.net/publication/260532130_Overexpression_of_apolipoprotein_C-III_decreases_secretion_of_dietary_triglyceride_into_lymph [5] Kawakami A, Aikawa M, Alcaide P, et al. Apolipoprotein CIII induces expression of vascular cell adhesion molecule-1 in vascular endothelial cells and increases adhesion of monocytic cells. Circulation, 2006; 114, 681-7. doi: 10.1161/CIRCULATIONAHA.106.622514 [6] Crosby J, Peloso GM, Auer PL, et al. Loss-of-function mutations in APOC3, triglycerides, and coronary disease. New Engl J Med, 2014; 371, 22-31. doi: 10.1056/NEJMoa1307095 [7] Qamar A, Khetarpal SA, Khera AV, et al. Plasma apolipoprotein C-III levels, triglycerides, and coronary artery calcification in type 2 diabetics. Arterioscler Thromb Vasc Biol, 2015; 35, 1880-8. doi: 10.1161/ATVBAHA.115.305415 [8] Hokanson JE, Kinney GL, Cheng S, et al. Susceptibility to type 1 diabetes is associated with ApoCIII gene haplotypes. Diabetes, 2006; 55, 834-8. doi: 10.2337/diabetes.55.03.06.db05-1380 [9] Caron S, Verrijken A, Mertens I, et al. Transcriptional activation of apolipoprotein CIII expression by glucose may contribute to diabetic dyslipidemia. Arterioscler Thromb Vasc Biol, 2011; 31, 513-9. doi: 10.1161/ATVBAHA.110.220723 [10] Holmberg R, Refai E, Hoog A, et al. Lowering apolipoprotein CIII delays onset of type 1 diabetes. Proc Natl Acad Sci USA, 2011; 108, 10685-9. doi: 10.1073/pnas.1019553108 [11] Li AH, Morrison AC, Kovar C, et al. Analysis of loss-of-function variants and 20 risk factor phenotypes in 8,554 individuals identifies loci influencing chronic disease. Nat Genet, 2015; 47, 640-2. doi: 10.1038/ng.3270 [12] Welty FK, Alfaddagh A, Elajami TK. Targeting inflammation in metabolic syndrome. Transl Res, 2016; 167, 257-80. doi: 10.1016/j.trsl.2015.06.017 [13] Mori N, McEvoy JP, Miller BJ. Total and differential white blood cell counts, inflammatory markers, adipokines, and the metabolic syndrome in phase 1 of the clinical antipsychotic trials of intervention effectiveness study. Schizophr Res, 2015; 169, 30-5. doi: 10.1016/j.schres.2015.10.001 [14] Zimmet P, KG MMA, Serrano Rios M. A new international diabetes federation worldwide definition of the metabolic syndrome:the rationale and the results. Rev Esp Cardiol, 2005; 58, 1371-6. doi: 10.1016/S0300-8932(05)74065-3 [15] Balkau B, Eschwege E. The metabolic syndrome. Lancet, 2005; 366, 1921. doi: 10.1016/S0140-6736(05)67778-1 [16] Bays HE, Jones PH, Brown WV, et al. National Lipid Association Annual Summary of Clinical Lipidology [2015] J Clin Lipidol, 2014; 8, S1-36. https://www.researchgate.net/profile/Peter_Jones32/publication/295099132_National_Lipid_Association_Annual_Summary_of_Clinical_Lipidology_2016/links/56cb14ce08ae5488f0dadd34.pdf?origin=publication_detail [17] Li S, Zhang Y, Xu RX, et al. Proprotein convertase subtilisin-kexin type 9 as a biomarker for the severity of coronary artery disease. Ann Med, 2015; 47, 386-93. doi: 10.3109/07853890.2015.1042908 [18] Zheng C, Azcutia V, Aikawa E, et al. Statins suppress apolipoprotein CIII-induced vascular endothelial cell activation and monocyte adhesion. Eur Heart J, 2013; 34, 615-24. doi: 10.1093/eurheartj/ehs271 [19] Liu Y, Wu M, Ling J, et al. Serum IGFBP7 levels associate with insulin resistance and the risk of metabolic syndrome in a Chinese population. Sci Rep, 2015; 5, 10227. doi: 10.1038/srep10227 [20] Solymoss BC, Bourassa MG, Campeau L, et al. Effect of increasing metabolic syndrome score on atherosclerotic risk profile and coronary artery disease angiographic severity. Am J Cardiol, 2004; 93, 159-64. doi: 10.1016/j.amjcard.2003.09.032 [21] Eberly LE, Prineas R, Cohen JD, et al. Metabolic syndrome:risk factor distribution and 18-year mortality in the multiple risk factor intervention trial. Diabetes Care, 2006; 29, 123-30. doi: 10.2337/diacare.29.01.06.dc05-1320 [22] Wang CS, McConathy WJ, Kloer HU, et al. Modulation of lipoprotein lipase activity by apolipoproteins. Effect of apolipoprotein C-III. J Clin Invest, 1985; 75, 384-90. doi: 10.1172/JCI111711 [23] Meikle PJ, Christopher MJ. Lipidomics is providing new insight into the metabolic syndrome and its sequelae. Curr Opin Lipidol, 2011; 22, 210-5. doi: 10.1097/MOL.0b013e3283453dbe [24] Stefan N, Haring HU, Hu FB, et al. Metabolically healthy obesity:epidemiology, mechanisms, and clinical implications. Lancet Diabetes Endocrinol, 2013; 1, 152-62. doi: 10.1016/S2213-8587(13)70062-7 -

 点击查看大图

计量
- 文章访问数: 1686
- HTML全文浏览量: 607
- PDF下载量: 170
- 被引次数: 0

 Quick Links