

 下载:
下载:

-
Prostate cancer (PCa) is the most common malignant tumor in men, being the second leading cause of deaths from cancer in men[1]. According to cancer statistics from the National Institutes of Health (NIH), PCa is most frequently diagnosed among men aged 65-74 years[2]. PCa patients are initially treated with androgen ablation therapy that causes regression of androgen-dependent tumors. However, prolonged androgen deprivation generally results in relapse of androgen-independent tumors and is inevitably fatal[3].
Patients undergoing various medical procedures are inevitably exposed to di (2-ethylhexyl) phthalate [also known as Bis (2-ethylhexyl) benzene-1, 2-dicarboxylate, DEHP], a major plasticizer compound that is added to polyvinyl chloride (PVC)-based medical materials. The Food and Drug Administration (FDA) has assessed the safety of DEHP released from PVC-based medical devices and pointed out the necessity to consider the potential adverse effects of DEHP in exposed patients. It has been pointed out that an adult undergoing extracorporeal membrane oxygenation (ECMO) could receive a DEHP dose ≥ 4 mg·kg-1·d-1, which is much higher than the tolerable intake of external exposure (0.6 mg·kg-1·d-1)[4]. Further, mono (2-ethylhexyl) phthalate (MEHP, the primary toxic metabolite of DEHP) can affect steroidogenesis, decrease the activity of androgen, and induce apoptosis in Leydig cells; it can also induce DNA oxidative damage through the activation of ROS production[5-8]. Moreover, MEHP has been shown to induce matrix metalloproteinase 2 (MMP2) expression that was strongly associated with tumor metastasis and progression in testicular embryonal carcinoma NT2/D1 cells[9]. Exposure of male rats to DEHP has been shown to induce the increase in prostatic volumes and weight, as well as the prostate index with expanded glands, and the degree of prostatic hyperplasia showed a positive correlation with the DEHP dose[10]. Our previous findings showed that MEHP (1-25 μmol/L) activated the expression of critical genes (patched homolog 1, PTCH1; and smoothened homolog, SMO) in the Hedgehog signaling pathway in androgen-sensitive human prostate adenocarcinoma LNCaP cells derived from a metastatic lesion of a human prostatic carcinoma, indicating that MEHP might advance the progression of PCa[11].
It is commonly believed that DNA methylation is the major epigenetic regulatory mechanism of gene expression and is involved in the progression of PCa[12]. For the present study, genome-wide DNA methylation and methylation of specific genes was considered. A reduction in genomic methylation intermediates, such as 5-methylcytosine (5-mC) and 5-hydroxymethylcytosine (5-hmC), can result in tumor heterogeneity and relapse[13-14]. Moreover, the abnormal methylation status of specific genes can induce gene overexpression or silencing, accelerating the proliferation and metastasis of cancer. There is a great deal of evidence supporting that DNA methylation of PTCH and SMO in the Hedgehog pathway is involved in the progression of cancers[15-17].
Therefore, this study was designed to investigate the effect of MEHP on DNA methylation through ELISA and pyrosequencing assays, including an assessment of the relationship between 5-mC and 5-hmC content in genomic DNA and the methylation status of specific genes, PTCH and SMO. Further, the aims of the study included exploring whether MEHP can affect DNA methylation in LNCaP cells, as well as the potential role of DNA methylation in the progression of PCa.
-
The human PCa cell line LNCaP (Cat. No. TCHu173) was obtained from the Chinese Academy of Science Cell Bank (Shanghai, China). Fetal bovine serum (FBS), charcoal-stripped FBS (CS-FBS), RPMI1640 (phenol-red free), and 0.25% Trypsin-EDTA were bought from Gibco (Grand Island, NY). MEHP and dimethylsulfoxide (DMSO) were obtained from Sigma (St. Louis, MO) and TRC (Toronto, Canada) respectively. Gene primers were synthesized by Sangon Biotech (Shanghai, China). The QIAamp® DNA Mini Kitwas from Qiagen (Hilden, Germany). The 5-mC DNA ELISA Kit, Quest 5-hmC™ DNA ELISA Kit, and EZ DNA MethylationTM Kit were from Zymo Research (Orange, California). GoTaq® Hot Start was obtained from Promega (Madison, USA). PyroMark® Gold Q96 Reagents were bought from Qiagen (Germany).
-
LNCaP cells were cultured in RPMI1640 containing 10% FBS in a humidified atmosphere of 5% CO2 at 37 ℃. The cells were seeded in 100-mm dishes at a density of 1 × 10⁶ cells per dish and treated with MEHP (0, 1, 5, 10, and 25 μmol/L) in CS-FBS medium for 3 days, as described previously[11]. The equivalent volume of DMSO (final concentration ≤ 0.1%) served as the vehicle.
-
Genomic DNA was extracted using the QIAamp® DNA Mini Kit according to the manufacturer's recommended protocol. The concentration and quality of DNA were assayed with a NanoDrop 2000 spectrophotometer (Thermo Fisher, Inc.). The obtained DNA was stored at -80 ℃ until further use.
-
The percentage of 5-mC (%) and 5-hmC (%) in genomic DNA was assessed using the 5-mC DNA ELISA Kit and Quest 5-hmC™ DNA ELISA Kit respectively according to the manufacturer's protocol. Briefly, 100 ng of genomic DNA was denatured and incubated with a mix consisting of anti-5-mC or anti-5-hmC monoclonal antibodies and the corresponding secondary antibodies. The absorbance at 405 nm was measured using an ELISA plate reader. The percentage of 5-mC (%) and 5-hmC (%) was separately calculated using the standard curve equation and the DNA controls in the same experiment.
-
DNA methylation was evaluated using bisulfite-converted DNA by pyrosequencing, a quantitative assay based on PCR. A total of 500 ng DNA was modified by using the Zymo EZ DNA Methylation Kit. The bisulfite-converted DNA was eluted in 30 μL of M-Elution buffer and stored at -20 ℃ until analysis. Then the DNA was amplified using GoTaqR Hot Start Polymerase to generate PCR-amplified templates; the primers are shown in Table 1. The bisulfite-converted DNA of SMO was amplified by nested PCR. The primers, SMObis1 and SMObis2, were used for the outer and inner PCRs respectively. The biotinylated PCR product underwent pyrosequencing using PyroMark Gold Q96 Reagents in the PyroMark Q96 ID Pyrosequencing System (Qiagen, Germany). The methylation value was calculated as the percentage of cytosine bases that are methylated at each CpG site. The percentage of methylated cytosines was quantified for four CpG sites in PTCH and six CpG sites in SMO. The methylation (%) of each CpG site and the average methylation (%) of all studied CpG sites were calculated.
Table 1. PCR and Pyrosequencing Primers for PTCH/SMO CpG Site Amplification and Analysis (5'-3')
Items PTCH[18] SMO[19] PCR primers F:GGGGATAGAATGGTTTAG
R:Biotin-ACTCCAAAAACTACTACTSMObis1 F:GAYGATTTTAGATTAAGTAAGGTGTT
R:TCCCACCATTAAAACCACCT
SMObis2 F:TTYGTGTATTTTAGAGAGTTTAG
R:Biotin-TCCCACCATTAAAACCACCTAnnealing
temperatures52.0 ℃ 55.6 ℃ (SMObis1)
53.6 ℃ (SMObis2)Pyrosequencing
primersAGGAGTATAAGAAAGTAGAGTT GAGTTAGAGTAATAAAGGAGT Analyzed sequences
and regionsAGTAGTTATYGYGAATTTAGTAGTTAGAGTTYGAGTA
GTTYGA (from -310 to -269 bp)aGGTYGTYGGYGGGGAGAGTTYGGGGGGTTGYGGYG
(from -479 to -445 bp)aNote. aThe transcription initiation sites of PTCH and SMO were separately designated as 0. YG indicates the detected CpG site. -
The methylation levels (%) were presented as the mean ± standard deviation (SD) values from triplicate experiments. For group comparisons, one-way analysis of variance (ANOVA) followed by Bonferroni's test was performed using SPSS Statistics software (version 19.0, IBM, Inc.) for statistical data analysis. The correlations between the DNA methylation of PTCH and SMO and gene expression were tested separately using Pearson correlation. Differences were considered significant at P values < 0.05. Plotting of the figures was performed using the GraphPad Prim 5 software package (GraphPad Software, Inc.).
-
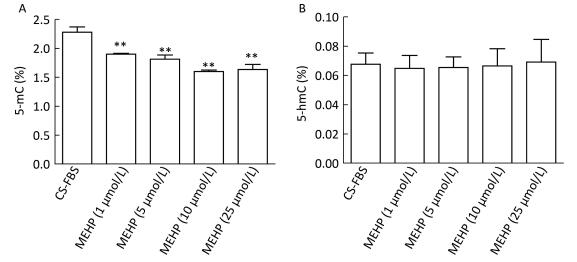
The methylation status of LNCaP cells treated with MEHP was detected for 3 days because our previous findings showed that MEHP can regulate the expression of PTCH and SMO after 3 days of treatment. The effects of MEHP on genomic methylation (including the content of 5-mC and 5-hmC) in LNCaP cells were also tested. The proportion of 5-mC (%) detected in the control group was 2.28% ± 0.09%. Compared to that in the control, the amount of 5-mC (%) significantly decreased in the groups treated with MEHP (1, 5, 10, and 25 μmol/L) for 3 days (P < 0.01), decreasing by 28.16% in the group treated with 25 μmol/L MEHP (Figure 1A). However, the proportion of 5-hmC (%) in the control group was 0.06% ± 0.01%. Compared to after the control treatment, there was no significant difference in the percentage of 5-hmC (%) after treatment with MEHP (1, 5, 10, and 25 μmol/L) for 3 days (Figure 1B).
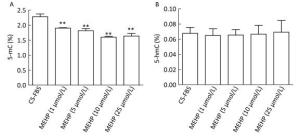
Figure 1. Effect of MEHP on the amount of 5-mC and 5-hmC in LNCaP cells. Cells were treated with MEHP (0, 1, 5, 10, and 25 μmol/L) for 3 days. Then the proportion of cytosines with 5-mC (A) and 5-hmC (B) was assessed in LNCaP cells. Bars represent the mean ± SD values from triplicate experiments. (**P < 0.01, compared to the CS-FBS control group).
-
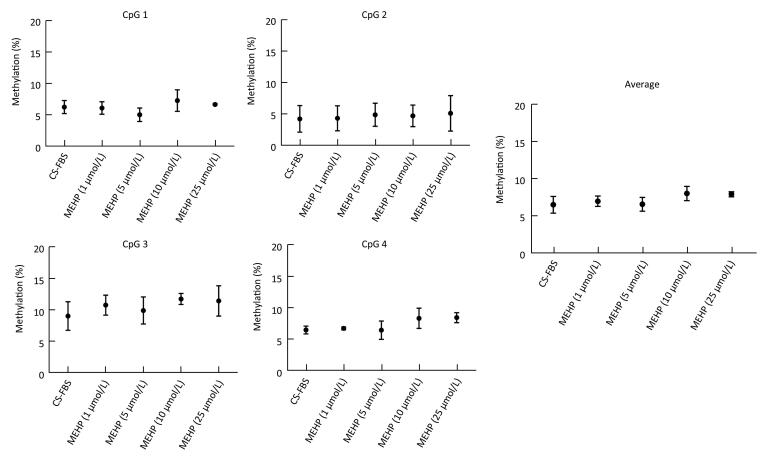
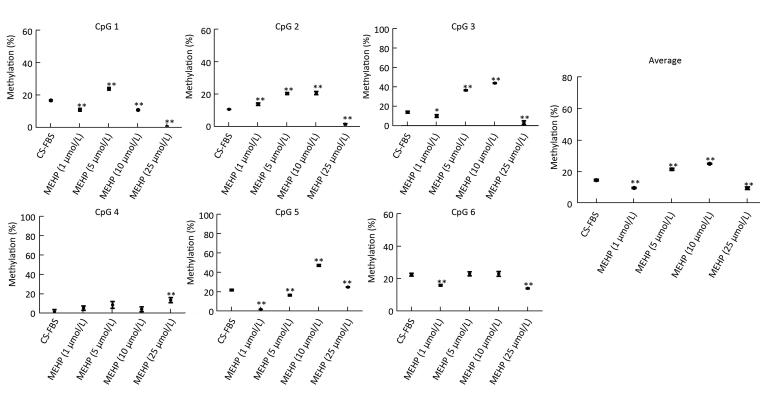
In the CS-FBS control group, the mean methyla-tion levels of PTCH in CpG 1, CpG 2, CpG 3, and CpG 4 were 6.35% ± 1.03%, 4.25% ± 2.10%, 9.13% ± 2.27%, and 6.60% ± 0.62% respectively. Compared to the control, there were no significant changes in the methylation levels of each CpG site in groups treated with MEHP (1, 5, 10, and 25 μmol/L). Moreover, the average methylation of all of the studied CpG sites of PTCH also showed no significant differences (Figure 2). Interestingly, compared to the CS-FBS control, the methylation levels of each CpG site in SMO showed significant differences following MEHP treatment (Figure 3). Moreover, the average methylation level of the six studied CpG sites in SMO in the CS-FBS control was 14.76% ± 0.54%. Compared to the control, there were also significant changes in the average methylation levels of SMO and the methylation levels were observably upregulated after treatment with MEHP doses of 5 and 10 μmol/L.
Figure 2. Effect of MEHP on the DNA methylation of PTCH. The methylation (%) of each of the four CpG sites in PTCH and the average methylation (%) of all of the studied CpG sites were calculated. Results are presented as the mean ± SD values from triplicate experiments.

Figure 3. Effect of MEHP on the DNA methylation of SMO. The methylation (%) of each of the six CpG sites in SMO and the average methylation (%) of all of the studied CpG sites were calculated. Results are presented as the mean ± SD values from triplicate experiments. (*P < 0.05 and **P < 0.01, compared to the CS-FBS control group)
-
To explore the relationship between DNA methylation and the genetic expression of PTCH and SMO, the methylation levels of these genes were compared with their mRNA expression levels at day 3 of treatment with MEHP. Correlation analysis showed that there were no significant correlations between DNA methylation and the expression of PTCH and SMO under treatment with MEHP (Table 2).
Table 2. Correlation between Methylation and PTCH and SMO Expression under MEHP Treatmenta
Item Pearson Coefficient PValue PTCH CpG 1 0.168 0.788 CpG 2 0.537 0.351 CpG 3 0.000 1.000 CpG 4 0.577 0.308 Average 0.164 0.792 SMO CpG 1 -0.234 0.705 CpG 2 0.064 0.919 CpG 3 0.405 0.499 CpG 4 0.711 0.178 CpG 5 0.494 0.397 CpG 6 -0.048 0.938 Average 0.400 0.504 Note. aThe correlation coefficients between the gene methylation levels and gene expression when treated with MEHP for 3 days were analyzed by Pearson' correlation test. -
DNA methylation is the predominant epigenetic mechanism during the growth and development of PCa in humans. In the present study, MEHP was shown to reduce 5-mC methylation in genomic DNA and affect PTCH and SMO expression independent of DNA methylation in LNCaP cells. The findings indicated that MEHP might affect the progression of PCa by influencing the methylation status of genomic DNA.
A decrease in the level of genomic DNA methylation induces genetic instability[20-21], and causes tumor initiation and progression[22-23]. 5-mC is an important marker of genomic DNA methylation, where the methylation occurs at the fifth carbon atom of cytosine. Moreover, 5-mC can transform into 5-hmC under the catalysis of Ten-eleven translocation (TET) protease, participating in the cell proliferation and differentiation process. A decrease in 5-mC and 5-hmC genomic DNA content can induce tumor heterogeneity and relapse[13-14]. A great deal of evidence supports that high exposure to environmental endocrine disruptors, such as polybrominated diphenyl ethers (PBDE) and polychlorinated biphenyl (PCB), might induce genomic hypomethylation[24-25]. In the present study, MEHP (1, 5, 10, and 25 μmol/L) decreased the amount of 5-mC in LNCaP PCa cells in a dose-response relationship. The hypomethylation level of 5-mC was previously proven to be a critical factor in the heterogeneity of metastatic PCa, and might contribute to the progression and relapse of PCa[26-27]. For instance, Brothman et al. performed a semi-quantitative analysis to detect 5-mC content by immunohistochemistry and immunostain densitometry, and found that the proportion of 5-mC methylation in prostate tumors, 77.76% ± 7.68%, significantly decreased in comparison with that in normal tissue, 99.00% ± 14.60%, and benign regions adjacent to the tumor, 100.22% ± 16.75%, P < 0.001[28]. The 5-mC content in prostate metastatic cancer quantified by high-performance liquid chromatography, 3.29% ± 0.24%, was also significantly lower than that in the normal control, 4.01% ± 0.11%[29].
Genome-wide 5-mC can be catalyzed into 5-hmC, where 5-hmC as a tumor biomarker is associated with cancer development and exhibits tissue specificity[30]. The proportion of 5-hmC is high in the brain (0.67%), relatively low in the lungs (0.18%), and very low in the breast (0.05%)[31]. Yang et al. reported that compared to tumor-adjacent normal tissues, the 5-hmC content decreased significantly in tumors of the breast, liver, lung, and prostate[26]. A reduction in 5-hmC (%) was also observed in PCa in another study[32]. The present results show that MEHP lowers 5-hmC content, although there was no statistically significant difference between the MEHP-treated groups.
Although the relationship between 5-mC and 5-hmC content is still unknown[32], MEHP can significantly reduce 5-mC content (%). There are several orders of magnitude of difference between the 5-mC and 5-hmC content (2.28% vs. 0.06%). Thus, the genomic methylation analysis results indicate that environmental exposure to MEHP might advance the progression of PCa by affecting genome-wide DNA methylation. This potential relationship between MEHP and PCa was also supported by reports of phthalate altering DNA methyltransferase function and inhibiting the binding of methyl-CpG binding proteins by increasing the production of ROS[6, 33-34].
PTCH and SMO, two critical genes in the Hedgehog pathway, have been demonstrated to play an important role in the growth and survival of human PCa[35-36]. The results from previous research showed that there were no significant effects of MEHP (1, 5, 10, and 25 μmol/L) on the methylation of PTCH and SMO.
The present study provides the advanced reported evidence that MEHP, the major metabolite of DEHP, can downregulate the percentage of 5-mC in genomic DNA. Genome-wide DNA methylation might be involved in the effect of MEHP on PCa progression, indicating that exposure to MEHP through medical materials in hospitals might advance the progression of PCa. More attention should be paid to PCa patients under medical treatment. The weaknesses of our study include the in vitro study design, no detection of the expression levels of DNA methyltransferases (DNMTs), and no application of DNA methylation inhibitors such as 5-aza-2'-deoxycytidine to further determine the effect of MEHP on DNA methylation. The slight evidence found in the current study supports that MEHP may affect the progression of PCa by changing global DNA methylation. Considering phthalates are ubiquitous in the environment and medical instruments, more evidence-based studies, especially human epidemiological studies, are needed in the future to explore the effect of phthalates on the progression of PCa and the potential regulation mechanisms involved.
-
Patients in hospitals are inevitably exposed to MEHP, the ubiquitous endocrine disruptor widely existing in various medical materials. The results of the present study indicate that MEHP could affect the progression and relapse of PCa by reducing 5-mC content in genomic DNA. More attention should be paid to the exposure of patients to MEHP from medical materials. Further studies are needed to explore the potential regulation mechanisms involved.
-
PCa, prostate cancer; NIH, National Institutes of Health; DEHP, di (2-ethylhexyl) phthalate; PVC, polyvinyl chloride; FDA, Food and Drug Administration; MEHP, mono-2-ethyhexyl phthalate; 5-mC, 5-methylcytosine; 5-hmC, 5-hydroxymethylcytosine; FBS, fetal bovine serum; CS-FBS, charcoal-stripped FBS; DMSO, dimethylsulfoxide; S.D., standard deviation; ANOVA, one-way analysis of variance; PBDE, polybrominated diphenyl ethers; PCB, polychlorinated biphenyl.
-
No conflict of interest to declare.
doi: 10.3967/bes2017.085
Effect of Mono-2-ethyhexyl Phthalate on DNA Methylation in Human Prostate Cancer LNCaP Cells
-
Abstract:
Objective To evaluate whether mono (2-ethylhexyl) phthalate (MEHP) affects genomic DNA methylation and the methylation status of some specific genes such as patched gene (PTCH) and smoothened gene (SMO) in LNCaP cells. Methods LNCaP cells were treated with MEHP (0, 1, 5, 10, and 25 μmol/L) for 3 days. An ELISA assay was preformed to detect genomic methylation, including 5-methylcytosine (5-mC) and 5-hydroxymethylcytosine (5-hmC) content. A pyrosequencing assay was applied to assess DNA methylation in PTCH and SMO gene promoters. The correlation between DNA methylation and gene expression was assessed. Results The proportion of cytosines with 5-mC methylation in LNCaP cells was significantly decreased by MEHP (1, 5, 10, and 25 μmol/L) in a dose-dependent manner (P < 0.01). For genes in the Hedgehog pathway, there was no significant MEHP concentration-dependent difference in the DNA methylation of PTCH and SMO. Conclusion MEHP might affect the progression of prostate cancer through its effect on global DNA methylation. -
Key words:
- Mono (2-ethyhexyl) phthalate /
- LNCaP /
- Genomic /
- Methylation /
- PTCH /
- SMO
-
Figure 1. Effect of MEHP on the amount of 5-mC and 5-hmC in LNCaP cells. Cells were treated with MEHP (0, 1, 5, 10, and 25 μmol/L) for 3 days. Then the proportion of cytosines with 5-mC (A) and 5-hmC (B) was assessed in LNCaP cells. Bars represent the mean ± SD values from triplicate experiments. (**P < 0.01, compared to the CS-FBS control group).
Figure 2. Effect of MEHP on the DNA methylation of PTCH. The methylation (%) of each of the four CpG sites in PTCH and the average methylation (%) of all of the studied CpG sites were calculated. Results are presented as the mean ± SD values from triplicate experiments.
Figure 3. Effect of MEHP on the DNA methylation of SMO. The methylation (%) of each of the six CpG sites in SMO and the average methylation (%) of all of the studied CpG sites were calculated. Results are presented as the mean ± SD values from triplicate experiments. (*P < 0.05 and **P < 0.01, compared to the CS-FBS control group)
Table 1. PCR and Pyrosequencing Primers for PTCH/SMO CpG Site Amplification and Analysis (5'-3')
Items PTCH[18] SMO[19] PCR primers F:GGGGATAGAATGGTTTAG
R:Biotin-ACTCCAAAAACTACTACTSMObis1 F:GAYGATTTTAGATTAAGTAAGGTGTT
R:TCCCACCATTAAAACCACCT
SMObis2 F:TTYGTGTATTTTAGAGAGTTTAG
R:Biotin-TCCCACCATTAAAACCACCTAnnealing
temperatures52.0 ℃ 55.6 ℃ (SMObis1)
53.6 ℃ (SMObis2)Pyrosequencing
primersAGGAGTATAAGAAAGTAGAGTT GAGTTAGAGTAATAAAGGAGT Analyzed sequences
and regionsAGTAGTTATYGYGAATTTAGTAGTTAGAGTTYGAGTA
GTTYGA (from -310 to -269 bp)aGGTYGTYGGYGGGGAGAGTTYGGGGGGTTGYGGYG
(from -479 to -445 bp)aNote. aThe transcription initiation sites of PTCH and SMO were separately designated as 0. YG indicates the detected CpG site.  下载: 导出CSV
Table 2. Correlation between Methylation and PTCH and SMO Expression under MEHP Treatmenta
Item Pearson Coefficient PValue PTCH CpG 1 0.168 0.788 CpG 2 0.537 0.351 CpG 3 0.000 1.000 CpG 4 0.577 0.308 Average 0.164 0.792 SMO CpG 1 -0.234 0.705 CpG 2 0.064 0.919 CpG 3 0.405 0.499 CpG 4 0.711 0.178 CpG 5 0.494 0.397 CpG 6 -0.048 0.938 Average 0.400 0.504 Note. aThe correlation coefficients between the gene methylation levels and gene expression when treated with MEHP for 3 days were analyzed by Pearson' correlation test.
下载: 导出CSV
-
[1] Jemal A, Murray T, Samuels A, et al. Cancer statistics. 2003. CA Cancer J Clin, 2003; 53, 5-26. doi: 10.3322/canjclin.53.1.5 [2] The National Cancer Institute website. http://seer.cancer.gov/statfacts/html/prost.html[2015-10]. [3] Lamont KR, Tindall DJ. Minireview:Alternative activation pathways for the androgen receptor in prostate cancer. Mol Endocrinol, 2011; 25, 897-907. doi: 10.1210/me.2010-0469 [4] Safety Assessment of Di(2-ethylhexyl) phthalate (DEHP)Released from PVC Medical Devices. http://www.fda.gov/downloads/MedicalDevices/DeviceRegulationandGuidance/GuidanceDocuments/UCM080457.pdf [2015-10]. [5] Lottrup G, Andersson AM, Leffers H, et al. Possible impact of phthalates on infant reproductive health. Int J Androl, 2006; 29, 172-80; discussion 81-5. doi: 10.1111/ija.2006.29.issue-1 [6] Zhao Y, Ao H, Chen L, et al. Mono-(2-ethylhexyl) phthalate affects the steroidogenesis in rat Leydig cells through provoking ROS perturbation. Toxicol In Vitro, 2012; 26, 950-5. doi: 10.1016/j.tiv.2012.04.003 [7] Ming-Yue MA, Zhang YM, Guo L, et al. Effects of DEHP and MEHP on apoptosis of leydig cells of mice. Industrial Health & Occupational Diseases, 2012; 339-41. (In Chinese) http://en.cnki.com.cn/Article_en/CJFDTOTAL-GYWZ201206007.htm [8] Erkekoglu P, Rachidi W, Yuzugullu OG, et al. Induction of ROS, p53, p21 in DEHP-and MEHP-exposed LNCaP cells-protection by selenium compounds. Food Chem Toxicol, 2011; 49, 1565-71. doi: 10.1016/j.fct.2011.04.001 [9] Yao PL, Lin YC, Richburg JH. Mono-(2-ethylhexyl) phthalate (MEHP) promotes invasion and migration of human testicular embryonal carcinoma cells. Biol Reprod, 2012; 86, 160, 1-10. https://tools.niehs.nih.gov/portfolio/index.cfm/portfolio/publicationDetail/id/1885827 [10] Zhang HY, Zhang W, Bao TY, et al. Relationship between environmental endocrine disruptor DEHP and prostatic hyperplasia in rats. Journal of Modern Urology, 2009; 347-9. (In Chinese) http://med.wanfangdata.com.cn/Paper/Detail?id=PeriodicalPaper_xdmnwkzz200905008 [11] Yong W, Jiao C, Jianhui W, et al. Mono-2-ethyhexyl phthalate advancing the progression of prostate cancer through activating the hedgehog pathway in LNCaP cells. Toxicol In Vitro, 2016; 32, 86-91. doi: 10.1016/j.tiv.2015.12.012 [12] Jaenisch R, Bird A. Epigenetic regulation of gene expression:how the genome integrates intrinsic and environmental signals. Nat Genet, 2003; 33, 245-54. doi: 10.1038/ng1089 [13] Ehrlich M. DNA hypomethylation in cancer cells. Epigenomics, 2009; 1, 239-59. doi: 10.2217/epi.09.33 [14] Jones PA, Baylin SB. The epigenomics of cancer. Cell, 2007; 128, 683-92. doi: 10.1016/j.cell.2007.01.029 [15] Du P, Ye HR, Gao J, et al. Methylation of PTCH1a gene in a subset of gastric cancers. World J Gastroenterol, 2009; 15, 3799-806. doi: 10.3748/wjg.15.3799 [16] Hinoue T, Weisenberger DJ, Pan F, et al. Analysis of the association between CIMP and BRAF in colorectal cancer by DNA methylation profiling. PLoS One, 2009; 4, e8357. doi: 10.1371/journal.pone.0008357 [17] Wolf I, Bose S, Desmond JC, et al. Unmasking of epigenetically silenced genes reveals DNA promoter methylation and reduced expression of PTCH in breast cancer. Breast Cancer Res Treat, 2007; 105, 139-55. doi: 10.1007/s10549-006-9440-4 [18] Lof-Ohlin ZM, Levanat S, Sabol M, et al. Promoter methylation in the PTCH gene in cervical epithelial cancer and ovarian cancer tissue as studied by eight novel Pyrosequencing(R) assays. Int J Oncol, 2011; 38, 685-92. https://core.ac.uk/download/pdf/33995555.pdf [19] Zhu Y, James RM, Peter A, et al. Functional Smoothened is required for expression of GLI3 in colorectal carcinoma cells. Cancer Lett, 2004; 207, 205-14. doi: 10.1016/j.canlet.2003.10.025 [20] Rodriguez J, Frigola J, Vendrell E, et al. Chromosomal instability correlates with genome-wide DNA demethylation in human primary colorectal cancers. Cancer Res, 2006; 66, 8462-9468. doi: 10.1158/0008-5472.CAN-06-0293 [21] Wilson AS, Power BE, Molloy PL. DNA hypomethylation and human diseases. Biochim Biophys Acta, 2007; 1775, 138-62. https://www.ncbi.nlm.nih.gov/pubmed/17045745 [22] Cravo M, Pinto R, Fidalgo P, et al. Global DNA hypomethylation occurs in the early stages of intestinal type gastric carcinoma. Gut, 1996; 39, 434-8. doi: 10.1136/gut.39.3.434 [23] Soares J, Pinto AE, Cunha CV, et al. Global DNA hypomethylation in breast carcinoma:correlation with prognostic factors and tumor progression. Cancer, 1999; 85, 112-8. doi: 10.1002/(ISSN)1097-0142 [24] Kim KY, Kim DS, Lee SK, et al. Association of low-dose exposure to persistent organic pollutants with global DNA hypomethylation in healthy Koreans. Environ Health Perspect, 2010; 118, 370-4. https://experts.umn.edu/en/publications/association-of-low-dose-exposure-to-persistent-organic-pollutants [25] Rusiecki JA, Baccarelli A, Bollati V, et al. Global DNA hypomethylation is associated with high serum-persistent organic pollutants in Greenlandic Inuit. Environ Health Perspect, 2008; 116, 1547-52. doi: 10.1289/ehp.11338 [26] Yang H, Liu Y, Bai F, et al. Tumor development is associated with decrease of TET gene expression and 5-methylcytosine hydroxylation. Oncogene, 2013; 32, 663-9. doi: 10.1038/onc.2012.67 [27] Yegnasubramanian S, Haffner MC, Zhang Y, et al. DNA hypomethylation arises later in prostate cancer progression than CpG island hypermethylation and contributes to metastatic tumor heterogeneity. Cancer Res, 2008; 68, 8954-67. doi: 10.1158/0008-5472.CAN-07-6088 [28] Brothman AR, Swanson G, Maxwell TM, et al. Global hypomethylation is common in prostate cancer cells:a quantitative predictor for clinical outcome? Cancer Genet Cytogenet, 2005; 156, 31-6. doi: 10.1016/j.cancergencyto.2004.04.004 [29] Bedford MT, van Helden PD. Hypomethylation of DNA in pathological conditions of the human prostate. Cancer Res, 1987; 47, 5274-6. https://www.ncbi.nlm.nih.gov/pubmed/2443238 [30] Nestor CE, Ottaviano R, Reddington J, et al. Tissue type is a major modifier of the 5-hydroxymethylcytosine content of human genes. Genome Res, 2012; 22, 467-77. doi: 10.1101/gr.126417.111 [31] Li W, Liu M. Distribution of 5-hydroxymethylcytosine in different human tissues. J Nucleic Acids, 2011; 2011, 870726. http://citeseerx.ist.psu.edu/viewdoc/summary?doi=10.1.1.349.7087 [32] Haffner MC, Chaux A, Meeker AK, et al. Global 5-hydroxymethylcytosine content is significantly reduced in tissue stem/progenitor cell compartments and in human cancers. Oncotarget, 2011; 2, 627-37. doi: 10.18632/oncotarget.v2i8 [33] Rusyn I, Kadiiska MB, Dikalova A, et al. Phthalates rapidly increase production of reactive oxygen species in vivo:role of Kupffer cells. Mol Pharmacol, 2001; 59, 744-50. https://hero.epa.gov/hero/index.cfm/reference/details/reference_id/630937 [34] Valinluck V, Tsai HH, Rogstad DK, et al. Oxidative damage to methyl-CpG sequences inhibits the binding of the methyl-CpG binding domain (MBD) of methyl-CpG binding protein 2 (MeCP2). Nucleic Acids Res, 2004; 32, 4100-8. doi: 10.1093/nar/gkh739 [35] Mimeault M, Moore E, Moniaux N, et al. Cytotoxic effects induced by a combination of cyclopamine and gefitinib, the selective hedgehog and epidermal growth factor receptor signaling inhibitors, in prostate cancer cells. Int J Cancer, 2006; 118, 1022-31. doi: 10.1002/ijc.21440 [36] Narita S, So A, Ettinger S, et al. GLI2 knockdown using an antisense oligonucleotide induces apoptosis and chemosensitizes cells to paclitaxel in androgen-independent prostate cancer. Clin Cancer Res, 2008; 14, 5769-77. doi: 10.1158/1078-0432.CCR-07-4282 -

 点击查看大图
计量
- 文章访问数: 2146
- HTML全文浏览量: 718
- PDF下载量: 67
- 被引次数: 0

 Quick Links