

 下载:
下载:


-
Autoimmune thyroiditis (AIT), also known as Hashimoto’s thyroiditis (HT) or chronic lymphoid thyroiditis, is the most prevalent organ-specific autoimmune disease. It is characterized by the presence of thyroid peroxidase antibody (TPOAb) and/or thyroglobulin antibody (TgAb) in the serum, extensive lymphocyte infiltration, and damage to the follicular cell structure of the thyroid gland[1,2]. AIT is a leading cause of acquired hypothyroidism and goiter and predominantly affects middle-aged women[1]. Recent epidemiological studies indicated an increasing incidence of AIT worldwide, particularly in regions with uneven iodine distribution[3,4].
Iodine is a micronutrient essential for thyroid hormone synthesis and significantly influences the pathogenesis of thyroid diseases. Research has indicated that iodine deficiency can result in endemic goiters and cognitive deficits[5,6], whereas an iodine surplus may impair thyroid function, causing goiter, hyperthyroidism, and hypothyroidism[7,8]. The chronic consumption of high iodine levels and extended iodine fortification following prolonged deficiency are associated with an increased risk of AIT[9,10].
From the genomic perspective, AIT susceptibility genes are primarily classified into immune-associated and thyroid-specific categories[11]. Natural Killer (NK) cells, a subset of lymphocytes crucial to the innate immune system, are involved in the pathogenesis of common autoimmune diseases, including juvenile rheumatoid arthritis, Type I Diabetes Mellitus, and autoimmune thyroid disease[12-14]. Wenzel et al. reported reduced NK cell activity in peripheral blood lymphocytes of patients with HT[15]. This reduction in NK cell function may precede the development of thyroid-specific autoantibodies and ensuing lymphocyte migration and infiltration into the thyroid gland, corresponding to the clinical phenotype of AIT[16]. Thus, we suggest that genes related to NK cells contribute to AIT susceptibility. Increasing evidence has shown that epigenetic alterations, especially DNA methylation, are significant in autoimmune thyroid disease pathogenesis[17,18]. Previous DNA methylation studies on thyroid pathology have mainly focused on Graves' disease and thyroid carcinomas[19,20], leaving AIT comparatively unexamined. DNA methylation is affected by nutrient levels, environmental factors, sex, and age[21-24]. Tingting et al. observed abnormal DNA methylation and hydroxymethylation at the ICAM1 gene promoter in the thyroid cells of patients with AIT, linking this epigenetic alteration to ICAM1 gene expression[25]. Therefore, we hypothesized that DNA methylation, influenced by environmental and genetic factors, plays a role in AIT pathogenesis.
In conclusion, AIT results from both genetic and environmental factors. Given the limited research on differentially methylated genes (DMGs) associated with AIT, our primary goal was to identify DMGs associated with NK cell activity in patients with AIT. Considering the role of waterborne iodine as an environmental factor in AIT pathogenesis, our secondary objective was to examine the DNA methylation status of NK cells in patients with AIT living in areas with different iodine levels.
-
Following the Health Industry Standard issued by the People's Republic of China, iodine zones were identified based on median water iodine concentrations (MWI): iodine-fortified areas (IFA, MWI < 10 µg/L, with iodized salt qualification rates > 90%), iodine-adequate areas (IAA, 40 ≤ MWI ≤ 100 µg/L, with non-iodized salt supplement), and iodine-excessive areas (IEA, MWI > 300 µg/L, with non-iodized salt supplement)[26,27]. Cluster sampling was used to select the villages of Dongtan and Qianlv as IFA, Dongding and Liuxiangzhuang as IAA, and Xieyuan as IEA.
-
To form the sequencing cohort, ten pairs of patients with AIT and controls were enrolled at the Affiliated Hospital of the Shanxi Institute of Endemic Diseases in November 2018. The diagnostic criteria included: 1) presence of serum TPOAb and TgAb or positivity for both antibodies concomitant with hypothyroidism or subclinical hypothyroidism; 2) thyroid ultrasound revealing goiter, echo heterogeneity, or multiple hypoechoic areas. The inclusion criteria were: 1) healthy individuals corresponding to the case group in sex, age, residence, and Body Mass Index (BMI); 2) no history of autoimmune or other thyroid diseases, no chronic or acute conditions, no prolonged thyroid medication or hormone treatment, and no pregnancy; 3) no goiter, negative for TgAb and TPOAb, normal thyroid function test results, or unremarkable thyroid ultrasound findings. The data for the 10 pairs are presented in Supplementary Table S1 (available in www.besjournal.com).
Table 1. Demographic characteristics of AIT and control groups
Characteristics IFA (89:89) IAA (40:40) IEA (47:47) All pairs (176:176) Case Control Case Control Case Control Case Control Sex (male/female) 8/81 8/81 5/35 5/35 10/37 10/37 23/153 23/153 Age (years) 45 ± 8 45 ± 8 44 ± 10 44 ± 10 43 ± 11 43 ± 11 44 ± 9 44 ± 9 BMI (kg/m2) 24.4 ± 3.2 24.3 ± 2.9 24.0 ± 3.3 24.0 ± 3.4 25.6 ± 3.6 25.5 ± 3.3 24.69 ± 3.44 24.59 ± 3.24 UIC (μg/L) 224.6
(149.6−319.5)211.7
(134.0−299.8)258.2
(152.9−406.4)229.9
(116.9−339.8)451.7
(250.4−583.8)363.8
(214.3−508.1)259.60
(157.10−439.25)230.90
(144.90−363.80)SIC (μg/L) 73.6
(63.3−86.8)76.5
(68.9−85.2)70.5
(64.2−84.0)75.5
(62.8−83.6)79.9
(70.0−96.3)83.0
(70.1−93.7)74.82
(64.23−86.98)77.89
(68.08−86.41)FT3 (pmol/L) 5.2 (4.7−5.6) 5.3 (4.8−5.6) 5.1 (4.8−5.4) 5.2 (5.0−5.6) 5.2 (4.8−5.4) 5.1 (4.6−5.4) 5.2 (4.8−5.5) 5.2 (4.9−5.6) FT4 (pmol/L) 15.1
(13.6−16.7)15.7
(14.0−16.8)15.1
(13.2−16.4)16.1
(14.0−17.0)16.6
(15.3−18.5)16.3
(15.1−17.4)15.4
(13.9−17.6)16.0
(14.4−17.1)TSH (μIU/mL) 2.6 (1.8−4.9)* 2.1 (1.5−2.7) 2.5 (1.6−4.2) 2.4 (1.8−3.1) 3.1 (1.9−4.1)* 1.9 (1.4−2.6) 2.8 (1.7−4.4)* 2.1 (1.5−2.8) TGAb (+), n (%) 26 (29.2)† − 12 (30)† − 4 (8.5) − 42 (23.9) − TPOAb (+), n (%) 30 (33.7) − 10 (25.0) − 19 (40.4) − 59 (33.5) − TGAb (+) &
TPOAb (+), n (%)21 (23.6) − 17 (42.5)‡ − 19 (40.4)‡ − 57 (32.4) − Note. Data are expressed as means ± standard deviations or medians withinterquartile ranges (25th–75th percentiles) or number (%). IFA, iodine-fortification area; IAA, iodine-adequate area; IEA, iodine-excess area; UIC, urinary iodine concentration; SIC, serum iodine concentration; FT3, free triiodothyronine; FT4, free thyroxine; TSH, thyroid-stimulating hormone; TPOAb (+), thyroid peroxidase antibody positive; TGAb (+), thyroglobulin antibody positive. *Significant differences compared with control groups; †Significant differences compared with IEA; ‡Significant differences compared with IFA. P < 0.05. To assemble the verification cohort, the study enlisted 1,225 local participants, comprising 852 females and 373 males. This group included 409, 392, and 424 individuals from the IFA, IAA, and 424 from IEA. Participants were required to be 18 years or older and have lived in the survey areas for at least five years. The exclusion criteria were pregnant or lactating women, individuals on medication or undergoing treatments that might affect thyroid function, and those who had consumed iodine-enriched foods in the last 72 h. Clinical characteristics have been outlined in a previous study[28]. For detailed analysis, AIT cases and controls were matched by age, sex, BMI, and residence. The inclusion and exclusion criteria for the AIT cases and controls were consistent with those of the sequenced population. In total, 176 matched pairs were established, including 89, 40, and 47 pairs from IFA, IAA, and IEA, respectively. Informed consent was obtained from all the participants, and the study protocol was approved by the Ethics Review Committee of Harbin Medical University (hrbmuecdc20200320).
-
Water samples were collected from the specified survey areas, with each aliquot containing at least 15 mL and stored at 4 °C. Water iodine concentrations (WIC) was determined using As3--Ce4+ catalytic spectrophotometry, following the protocols of the National Reference Laboratory for Iodine Deficiency Disorders and the Chinese Center for Disease Control and Prevention. The Chinese National Reference Laboratory for Iodine Deficiency Disorders provides internal quality control for iodine in water. Urinary specimens were collected from participants between 08:00 and 11:00 in sterilized, labeled polyethylene containers and kept at 4 °C. Urinary iodine concentrations (UIC) were measured using As3--Ce4+ catalytic spectrophotometry according to the China Ministry of Health directive (WS/T 107.1-2016)[29]. Venous blood was drawn from the subjects after an 8-hour fast. Serum iodine concentrations (SIC) were assessed using an inductively coupled plasma mass spectrometry system (PerkinElmer NexION 350; Shelton, CT, USA) according to the standard (WS/T 783-2021)[30]. Thyroid function parameters, free triiodothyronine (FT3), free thyroxine (FT4), thyroid-stimulating hormone (TSH), TPOAb, and TgAb were quantified using a chemiluminescence immunoassay (Siemens Healthcare Diagnostics Inc.). The normative reference ranges for thyroid function were set as follows: FT3, 3.1–6.8 pmol/L; FT4, 11.5–22.7 pmol/L; TSH, 0.27–4.2 µIU/mL; TPOAb, 0–60 U/mL; and TgAb, 0–60 U/mL.
-
The Illumina Methylation EPIC 850K Beadchip was used for genomic screening of whole blood samples from 10/10 matched pairs. Genomic DNA was extracted using a TIANGEN Extraction Kit (TIANGEN, Beijing, China), and their purity and concentration were assessed using a Nanodrop 2000 spectrophotometer. A total of 500 ng of DNA from each sample was bisulfite-converted using an EZ DNA Methylation Kit (Zymo Research, USA) and hybridized onto an Illumina Infinium Human Methylation 850K BeadChip (Illumina Inc., CA, USA), according to the manufacturer's instructions.
A total of 853,307 CpG sites were examined, with 257 sites showing differential methylation across 139 DMGs, based on the criteria for methylation variance and P values. Functional enrichment and signaling pathway analyses were conducted using Gene Ontology and Kyoto Encyclopedia of Genes and Genomes databases. Following these analyses, DMGs related to NK cells were further examined, and the results are listed in Supplementary Table S2 (available in www.besjournal.com). KLRC1, KLRC3, and SH2D1B were identified as key genes associated with AIT.
Table S2. GO and KEGG enrichment results of NK cells in 850K
ID Description P Gene ID GO:0002717 positive regulation of natural killer cell mediated immunity 0.0364* KLRC3/SH2D1B GO:0002715 regulation of natural killer cell mediated immunity 0.0683 KLRC3/SH2D1B GO:0002420 natural killer cell mediated cytotoxicity directed against tumor cell target 0.0932 KLRC3 GO:0002423 natural killer cell mediated immune response to tumor cell 0.0932 KLRC3 GO:0002855 regulation of natural killer cell mediated immune response to tumor cell 0.0932 KLRC3 GO:0002858 regulation of natural killer cell mediated cytotoxicity directed against tumor cell target 0.0932 KLRC3 GO:0035747 natural killer cell chemotaxis 0.1020 KLRC3 GO:0002228 natural killer cell mediated immunity 0.1222 KLRC3/SH2D1B GO:0045954 positive regulation of natural killer cell mediated cytotoxicity 0.2471 KLRC3 GO:0042269 regulation of natural killer cell mediated cytotoxicity 0.3372 KLRC3 GO:0042267 natural killer cell mediated cytotoxicity 0.4334 KLRC3 GO:0030101 natural killer cell activation 0.5654 KLRC3 hsa04650 natural killer cell mediated cytotoxicity 0.1490 KLRC3/KLRC1/SH2D1B Note. *P < 0.05, t test. -
MethylTarget™ (Genesky Corporation, Shanghai, China) was used to verify the methylation differences of candidate genes, using whole blood samples from 176/176 matched pairs. The primer details are provided in
Supplementary Table S3 (available in www.besjournal.com).Genomic DNA was extracted using a TIANGEN Extraction Kit (TIANGEN, Beijing, China) and converted into bisulfite using an EZ DNA Methylation Kit (Zymo, Irvine, CA, USA). Amplification, barcoding, and sequencing of samples were conducted on a MiSeq platform (Illumina, Inc., San Diego, CA, USA), strictly following the manufacturer’s protocols.
-
In this study, the mRNA expression levels of KLRC3 and KLRC1 were quantified using QRT-PCR in 176/176 matched pairs. Total RNA was extracted from whole blood using RNAiso Plus (Takara, Dalian, China) following the manufacturer’s instructions. The quantity of isolated RNA was measured with a NanoDrop2000 spectrophotometer (NanoDrop Technologies, USA), considering an optical density value between 1.8 and 2.0 at 260/280 as indicative of adequate sample quality. Reverse transcription was conducted using the PrimeScript™ RT Reagent Kit (Takara, Japan) on a gradient PCR machine (ABI, USA). Transcription levels were measured using a QuantStudio5 Real-Time PCR System (Applied Biosystems). The specific PCR primer sequences are listed in
Supplementary Table S4 (available in www.besjournal.com). -
The data were organized and processed using Microsoft Excel 2019, and subsequent statistical analyses were performed using SPSS software version 22.0. Graphical displays were created using GraphPad Prism Version 5.0 (GraphPad Software Inc., CA, USA). For datasets following a normal distribution, values are expressed as means ± standard deviations and analyzed using t-tests or one-way analysis of variance, with further pairwise comparisons conducted using the Least Significant Difference test. For datasets that were not normally distributed, values were presented as medians with interquartile ranges [25th–75th percentiles] and analyzed using the Mann–Whitney U test or Kruskal-Wallis H test. The Chi-square test was used to compare rates between distinct groups. Correlations between the variables were evaluated using Spearman’s rank or Pearson’s correlation analysis. All statistical tests were two-sided, with a P-value < 0.050 deemed statistically significant.
-
After applying strict matching criteria for age, sex, and BMI, a cohort of 176 paired participants was established for further analyses. These pairs were divided into three groups: 89 pairs in the IFA, 40 pairs in the IAA, and 47 pairs in the IEA, as detailed in Table 1. Within this cohort, TSH levels in the AIT groups were significantly higher than those in the respective control groups, with P < 0.001 indicating statistical significance. Specifically, in the IFA and IEA groups, TSH concentrations in the AIT groups were significantly higher than those in the control groups (P < 0.050 for both). Differences in the prevalence of TgAb+, and TPOAb+ and TgAb+ were notable across the different water iodine regions, with P < 0.05 for both. The prevalence of TgAb+ was significantly higher in the IFA and IAA groups than in IEA (P < 0.05 for both). Similarly, the prevalence of TPOAb+ and TgAb+ was significantly higher in the IAA and IEA groups than in IFA (P < 0.05 for both).
-
Table 2 presents the methylation status of the selected candidate genes, specifically KLRC1, KLRC3, and SH2D1B, as identified using the 850K Beadchip array. These genes were classified as DMGs with P values less than 0.05 and a group differential greater than 0.1 and were significantly involved in the NK cell-mediated immune regulation pathway. These genes were hypomethylated in the AIT cohort compared with the control group, with all instances reaching statistical significance (all P < 0.05).
Table 2. DNA methylation levels of candidate genes between AIT and control groups in the 850K
Probe Gene Chr Position Feature Case Control Group. diff P cg23810434 KLRC1 12 10603937 5’UTR 0.689 ± 0.097 0.789 ± 0.061 −0.101 0.010* cg04531182 KLRC3 12 10563981 TSS1500 0.272 ± 0.180 0.499 ± 0.299 −0.228 0.046* cg01062020 SH2D1B 1 162382848 TSS1500 0.213 ± 0.125 0.405 ± 0.230 −0.193 0.026* Note. Chr, chromosome; 5'UTR, in the range of 5'UTR sequence; TSS1500, in the range of 200 bp–1,500 bp upstream of the transcription start site; Group. diff, methylation level of case - the methylation level of control; *P < 0.05. -
As outlined in Table 3, we identified three candidate genes–KLRC1, KLRC3, and SH2D1B–encompassing 15 CpG sites. Specifically, KLRC1 was associated with seven CpG sites, KLRC3 with seven CpG sites, and SH2D1B with one CpG site. Comparative analysis indicated significant hypomethylation in KLRC1 within the AIT cohort compared with the control group (t = −6.314, P < 0.001), whereas KLRC3 was hypermethylated in the AIT cohort (t = 2.143, P = 0.033). The methylation status of SH2D1B did not significantly differ between the AIT and control groups.
Table 3. DNA methylation levels of candidate genes and CpG sites between AIT and control groups in the MethylTargetTM
Gene Site Case Control Group. diff P KLRC1 — 0.892 ± 0.026 0.907 ± 0.019 −0.015 9.37 × 10⁻¹⁰** 28 0.893 ± 0.029 0.904 ± 0.022 −0.012 4.71 × 10⁻⁵** 97 0.740 ± 0.052 0.749 ± 0.051 −0.010 0.085 138 0.935 ± 0.036 0.942 ± 0.037 −0.008 0.059 142 0.890 ± 0.048 0.919 ± 0.031 −0.030 8.02 × 10⁻¹¹** 144 0.892 ± 0.045 0.922 ± 0.031 −0.031 2.44 × 10⁻¹²** 154 0.949 ± 0.019 0.958 ± 0.015 −0.010 1.48 × 10⁻⁶** 182 0.947 ± 0.018 0.956 ± 0.016 −0.009 4.71 × 10⁻⁵** KLRC3 — 0.658 ± 0.208 0.611 ± 0.202 0.047 0.033* 65 0.621 ± 0.233 0.573 ± 0.227 0.049 0.049* 99 0.545 ± 0.283 0.478 ± 0.280 0.067 0.027* 122 0.581 ± 0.261 0.515 ± 0.256 0.067 0.017* 133 0.558 ± 0.280 0.492 ± 0.275 0.067 0.026* 162 0.675 ± 0.204 0.627 ± 0.199 0.048 0.027* 174 0.802 ± 0.118 0.780 ± 0.116 0.022 0.080 178 0.823 ± 0.099 0.812 ± 0.088 0.011 0.283 SH2D1B — 0.147 ± 0.154 0.175 ± 0.191 −0.028 0.132 81 0.147 ± 0.154 0.175 ± 0.191 −0.028 0.132 Note. Group.diff, the methylation level of case - the methylation level of control; *P < 0.05, **P < 0.001. At the individual CpG site level, five CpG sites in KLRC1 in the AIT cohort were significantly hypomethylated compared with those in the control group (t = −4.127, −6.749, −7.309, −4.905, −4.875; all P < 0.001). Similarly, five CpG sites in KLRC3 in the AIT cohort showed significant hypermethylation compared with the control group (t = 1.974, 2.220, 2.400, 2.243, and 2.223; all P < 0.050). No statistically significant difference was found in the methylation status of the CpG site within SH2D1B between the two groups.
-
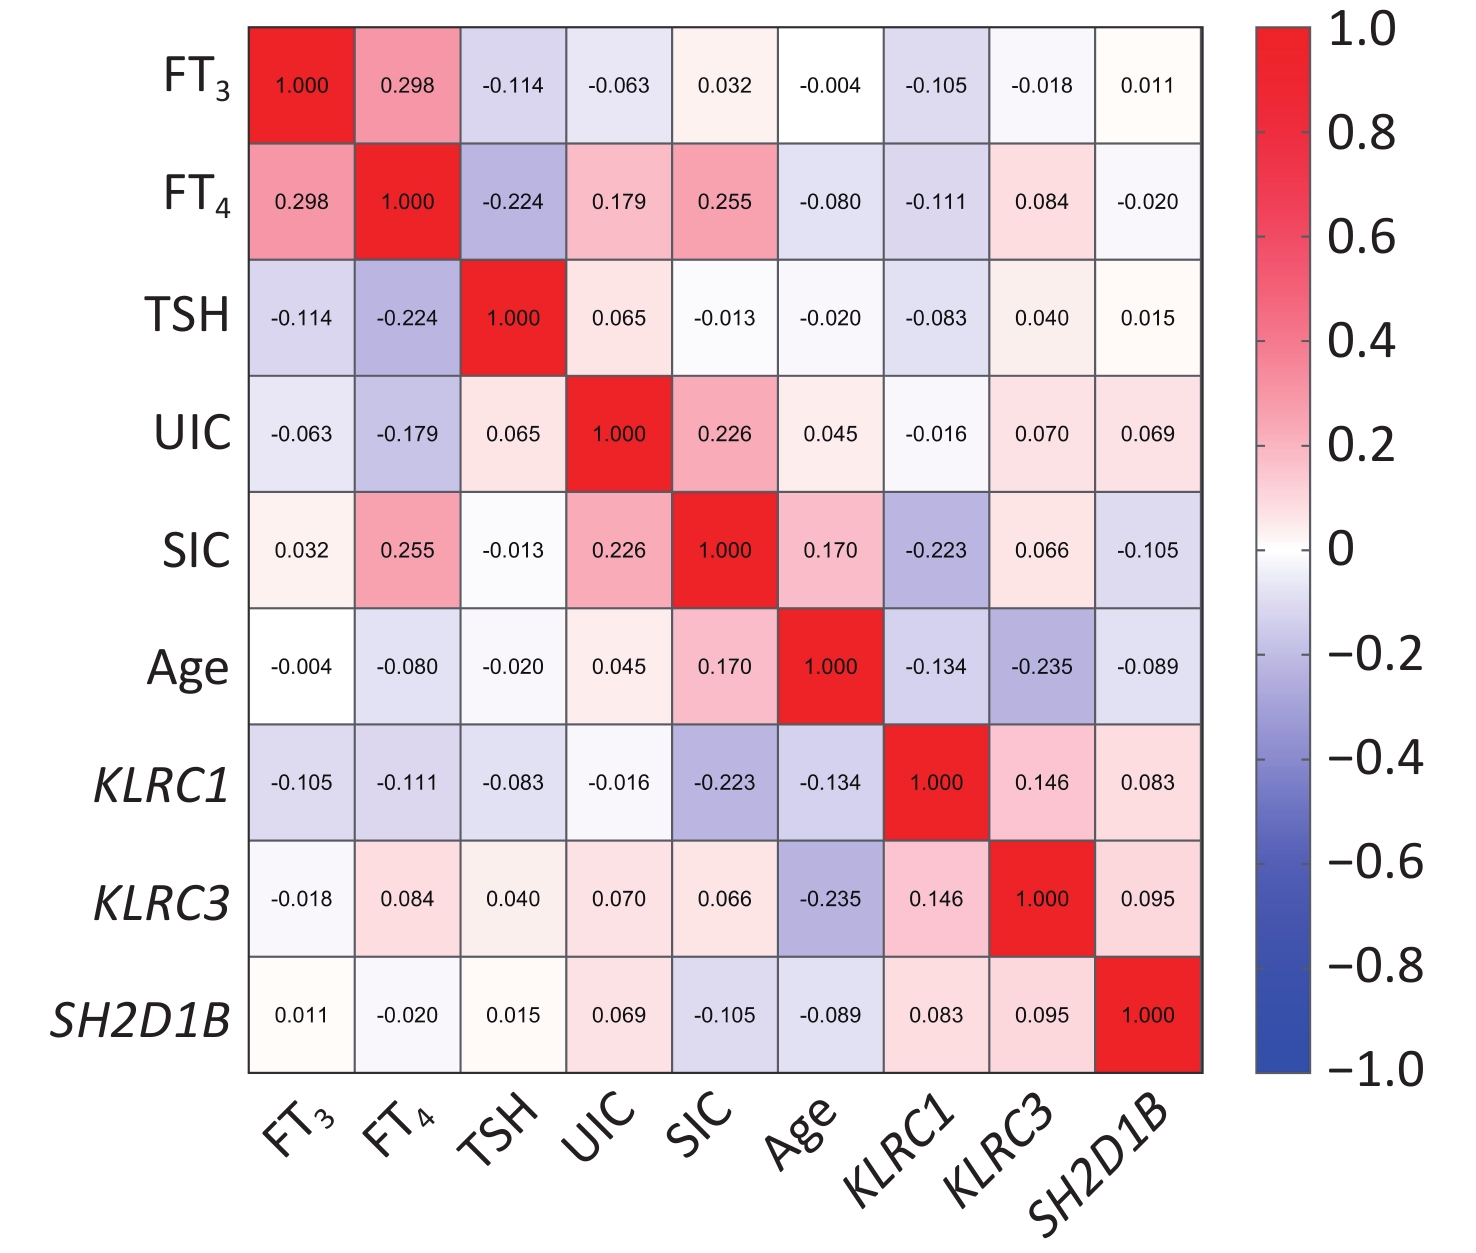
Figure 1 and
Supplementary Table S5 (available in www.besjournal.com) show a significant inverse relationship between the methylation levels of the KLRC1 gene and SIC in patients with AIT (r = −0.223, P = 0.004). Additionally, there was a negative correlation between the methylation levels of KLRC3 and age in the AIT cohort (r = −0.235, P = 0.002). However, no significant associations were observed between the DNA methylation levels of the candidate genes and UIC, FT3, FT4, or TSH levels.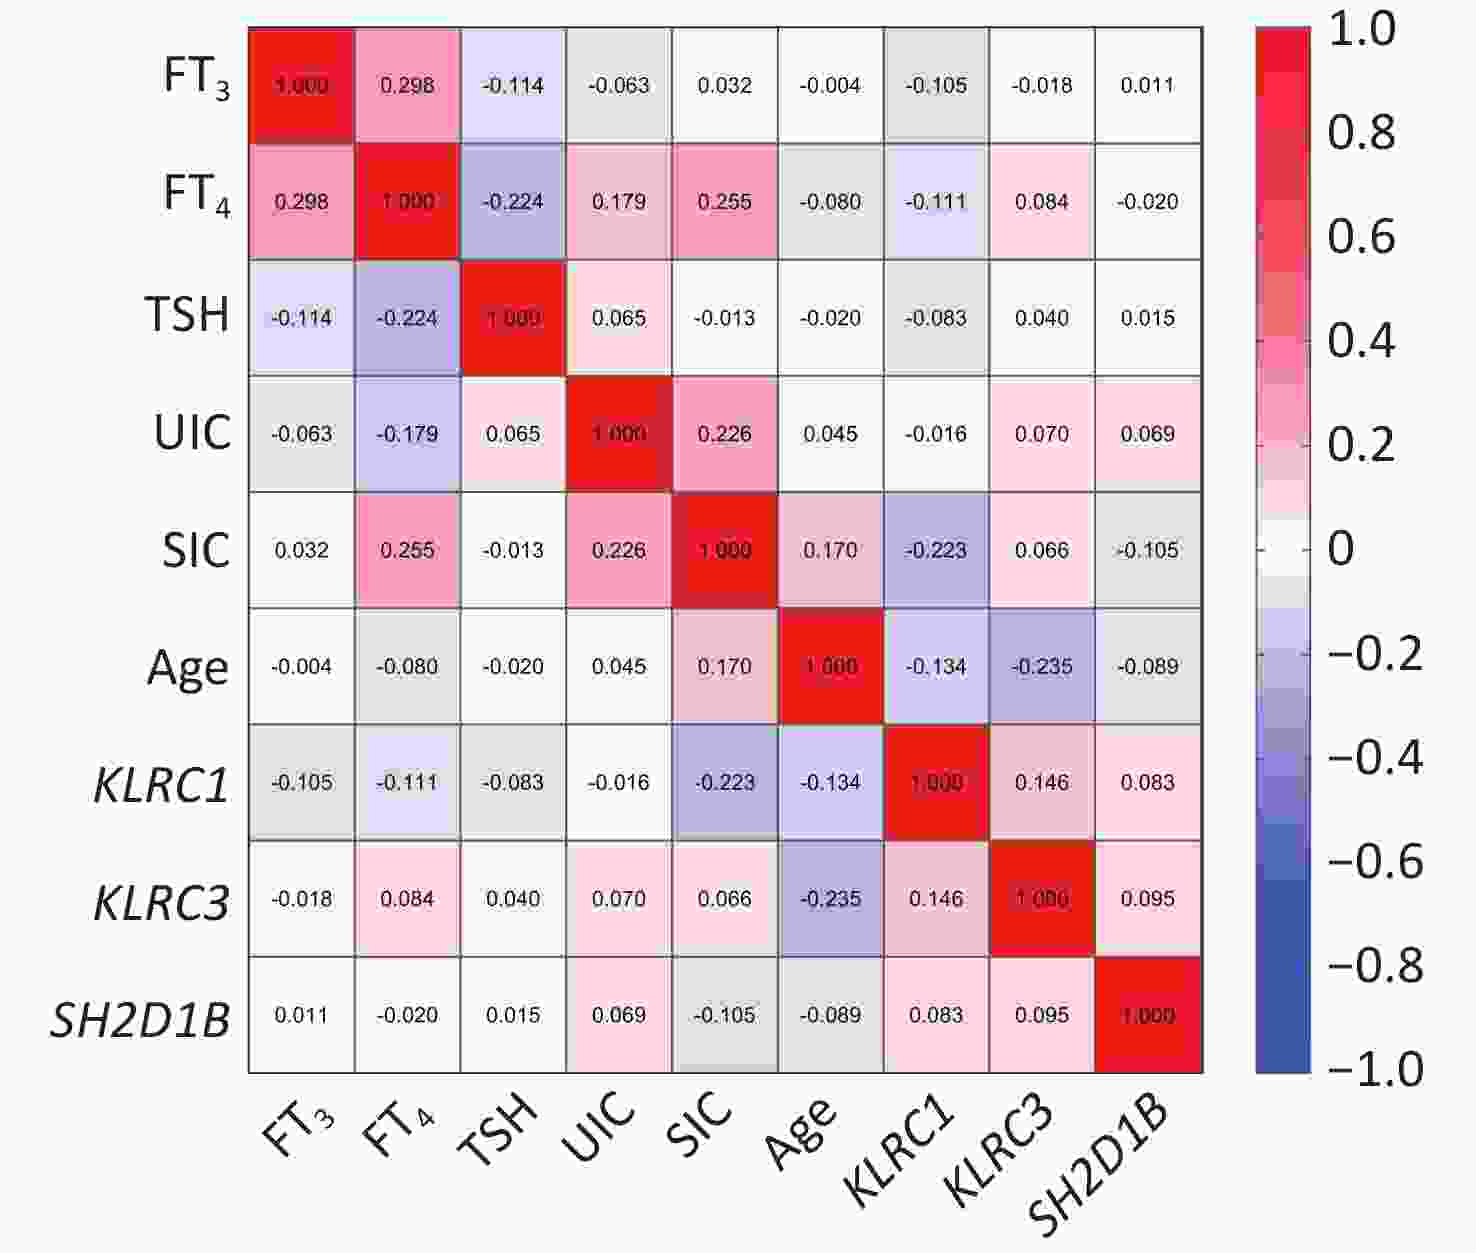
Figure 1. Correlation between DNA methylation levels of the candidate genes and age, iodine nutrition levels, and thyroid function in patients with autoimmune thyroiditis (AIT).
-
Stratified analyses were performed following correlation analyses and insights from existing research on the factors influencing DNA methylation in the pathogenesis of AIT.
Supplementary Table S6 (available in www.besjournal.com) shows that in the male subgroup, KLRC1 exhibited significantly lower methylation levels in the AIT cohort than in the control group (t = −2.744, P = 0.010). In the female subgroup, pronounced hypomethylation of KLRC1 was observed in the AIT cohort compared with the controls (t = −5.701, P < 0.001). Regarding CpG sites associated with candidate genes, the male subgroup showed two CpG sites within KLRC1 in the AIT cohort with decreased methylation compared with that in the control group (both P < 0.050). In the female subgroup, significant differences in methylation were found for five CpG sites in KLRC1 and four CpG sites in KLRC3 between the AIT and control cohorts (all P < 0.001 for KLRC1 and all P < 0.050 for KLRC3).Age-stratified analyses revealed significant findings, as detailed in
Supplementary Table S7 (available in www.besjournal.com). In individuals aged ≤ 29 years, a single CpG site within KLRC1 in the AIT cohort showed decreased methylation compared with that in the control group (P = 0.008). For the age group of 30–39 years, KLRC1 and its five associated CpG sites in the AIT cohort were significantly hypomethylated relative to those in the control group (all P < 0.050). In the 40–49 years age group, the KLRC1 gene and three of its CpG sites in the AIT cohort exhibited lower methylation levels than those in the control group (all P < 0.050), and the SH2D1B gene in the AIT cohort also showed hypomethylation (P = 0.019). In the subgroup aged > 50 years, three CpG sites within KLRC1 in the AIT cohort had reduced methylation levels compared with those in the control group (all P < 0.050), and SH2D1B also demonstrated lower methylation in the AIT cohort (P = 0.017).Following the analyses presented in
Supplementary Table S8 (available in www.besjournal.com), within the subgroup having SIC between 50–109.9 μg/L, the KLRC1 gene and its five associated CpG sites in the AIT cohort were found to have significantly lower methylation levels compared with the control group (all P < 0.050). Additionally, the SH2D1B gene in the AIT cohort showed markedly reduced methylation levels compared with those in the control group (P = 0.001).As indicated in
Supplementary Table S9 (available in www.besjournal.com), for the subgroup with UIC less than 100 μg/L, three CpG sites associated with the KLRC1 gene in the AIT cohort exhibited lower methylation (all P < 0.050). In the subgroup with UIC between 100–199 μg/L, two CpG sites associated with the KLRC1 gene in the AIT cohort showed lower methylation (all P < 0.050). In the subgroup with UIC between 200–299 μg/L, four CpG sites associated with the KLRC1 gene showed lower methylation, three CpG sites of the KLRC3 gene showed higher methylation, and the SH2D1B gene showed lower methylation in the AIT cohort (all P < 0.050). In participants with UIC greater than 300 μg/L, both the KLRC1 gene and its five associated CpG sites in the AIT cohort exhibited lower methylation, and the SH2D1B gene also showed reduced methylation levels (all P < 0.050). -
In an analysis presented in Table 4, significant hypomethylation of the KLRC1 gene in the AIT cohort compared with the control group was observed across various iodine-rich water environments, including IFA, IAA, and IEA (t = −2.758, −5.010, and −4.232, respectively; all P < 0.050). Specifically, in IFA, four CpG sites associated with KLRC1 in the AIT cohort showed hypomethylation (t = −2.519, −2.618, −3.285, and −1.979; all P < 0.050). In IAA, five CpG sites in KLRC1 exhibited hypomethylation in the AIT cohort (t = −2.557, −5.484, −5.991, −4.693, and −3.514; all P < 0.050), with similar findings in IEA (t = −2.737, −5.034, −4.690, −4.817, and −4.086; all P < 0.050). No statistically significant differences were observed in the methylation levels of KLRC3 and SH2D1B or their CpG sites between the AIT and control groups.
Table 4. DNA methylation levels of candidate genes and CpG sites between AIT and control groups in different water iodine areas
Gene Sites IFA (89:89) IAA (40:40) IEA (47:47) Group.diff P Group.diff P Group.diff P KLRC1 — −0.010 0.006** −0.021 4.00 × 10⁻⁶** −0.021 6.73 × 10⁻⁵** 28 −0.010 0.013* −0.011 0.059 −0.016 0.008* 97 −0.006 0.461 −0.010 0.362 −0.017 0.139 138 −0.008 0.162 −0.010 0.013* −0.006 0.605 142 −0.017 0.010* −0.045 7.93 × 10⁻⁷** −0.040 4.35 × 10⁻⁶** 144 −0.020 0.001* −0.046 8.96 × 10⁻⁸** −0.037 1.32 × 10⁻⁵** 154 −0.002 0.489 −0.015 1.25 × 10⁻⁵** −0.018 8.73 × 10⁻⁶** 182 −0.006 0.049* −0.011 7.70 × 10⁻³** −0.013 1.06 × 10⁻³** KLRC3 — 0.037 0.250 0.054 0.265 0.060 0.127 65 0.036 0.311 0.053 0.339 0.069 0.122 99 0.050 0.250 0.076 0.253 0.090 0.098 122 0.051 0.208 0.067 0.276 0.096 0.054 133 0.053 0.220 0.076 0.249 0.085 0.116 162 0.040 0.205 0.051 0.280 0.060 0.118 174 0.021 0.240 0.034 0.217 0.013 0.582 178 0.005 0.718 0.023 0.289 0.010 0.586 SH2D1B — −0.021 0.412 −0.058 0.126 −0.016 0.675 1 −0.021 0.412 −0.058 0.126 −0.016 0.675 Note. IFA, iodine-fortification areas; IAA, iodine-adequate areas; IEA, iodine-excess areas; Group.diff, the methylation level of case - the methylation level of control; *P < 0.05, **P < 0.001. Further investigation into DNA methylation differences among patients with AIT across these iodine-rich areas, as detailed in
Supplementary Table S10 (available in www.besjournal.com). We confirmed the demographic consistency in age, sex, and BMI among the case cohorts. No significant differences in methylation levels were found for KLRC1, KLRC3, or SH2D1B among cases. Nonetheless, significant differential methylation was observed at the three CpG sites of KLRC1 across these areas (F = 3.903, 4.175, and 6.301; all P < 0.050). Pairwise comparisons further highlighted the increased DNA methylation levels in patients with AIT in the IFA compared with those in the IEA, which was statistically significant (all P < 0.050). -
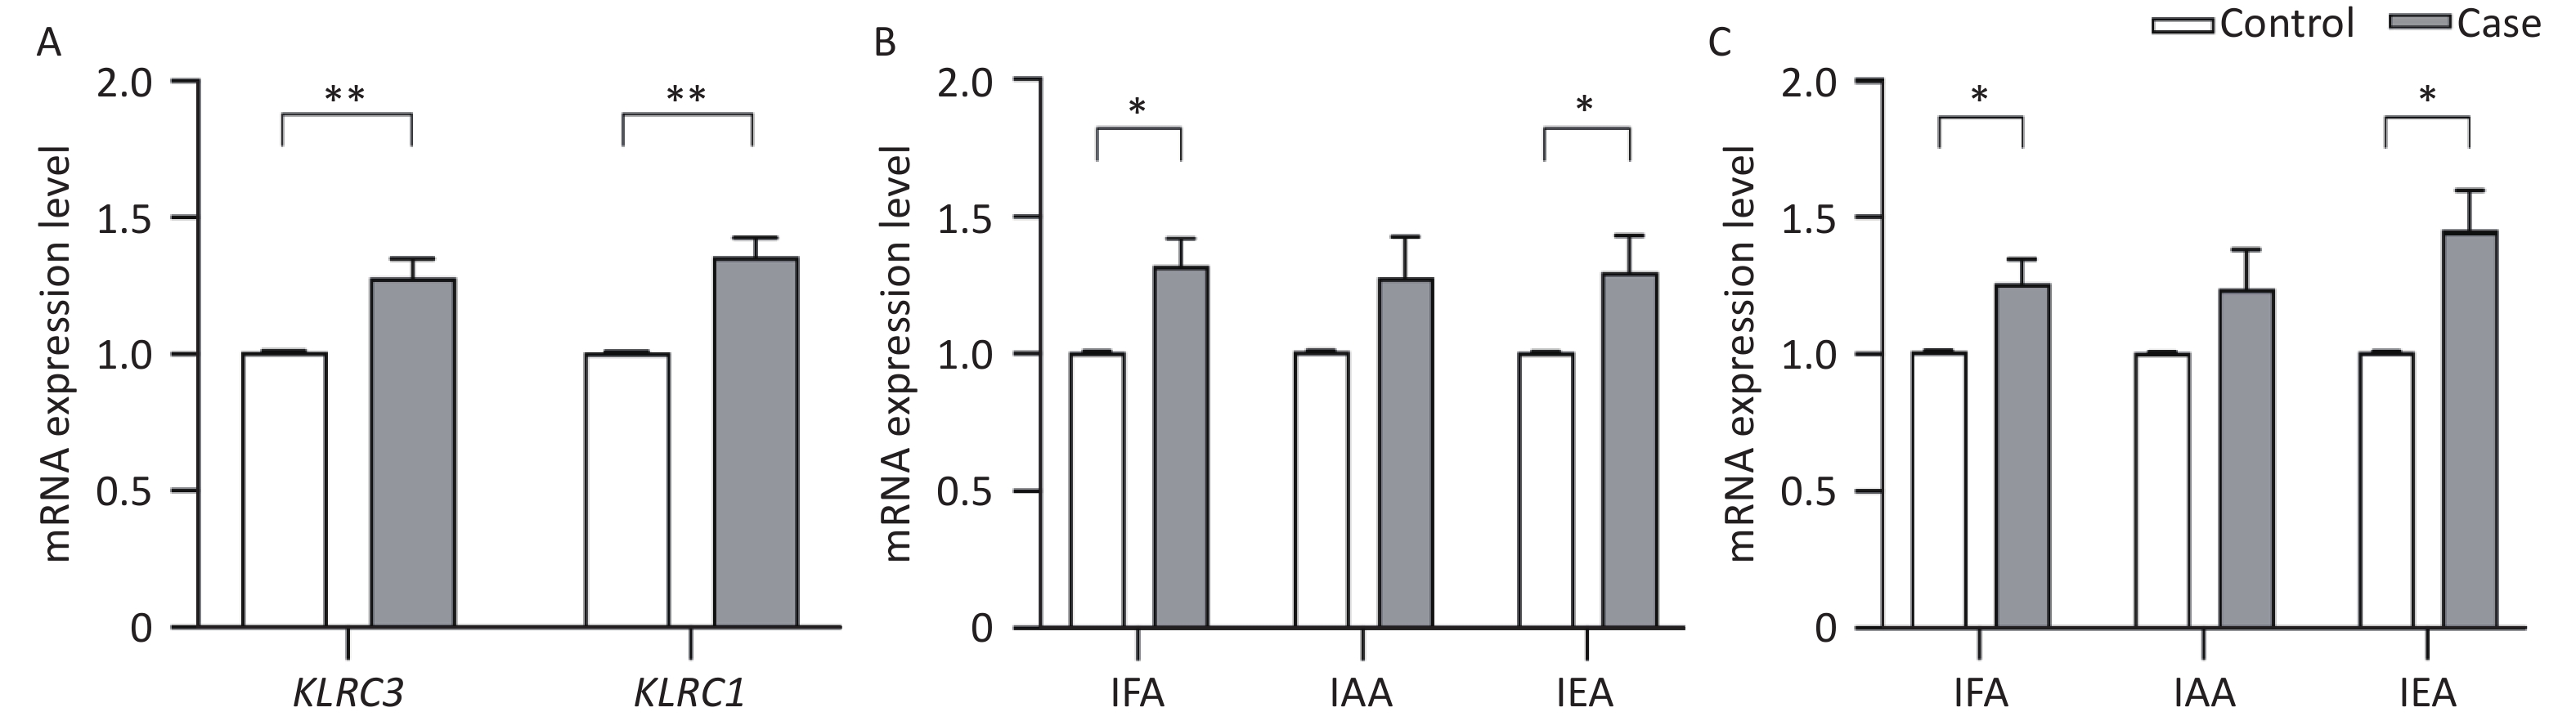
Due to the observed differential methylation in KLRC1 and KLRC3 genes between AIT and control groups, as reported in the context of the MethylTarget™ assay (referenced in Table 3), these genes were selected for validation analysis of their mRNA expression levels using QRT-PCR. Figure 2A shows that the transcriptional activity of both KLRC1 (1.356 ± 0.939 vs. 1.007 ± 0.016, t = −4.926, P < 0.001) and KLRC3 (1.281 ± 0.893 vs. 1.009 ± 0.015, t = −3.849, P < 0.001) was significantly higher in the AIT cohort compared with the control group. Figure 2B shows a significant increase in KLRC1 mRNA expression in patients with AIT over controls within IFA (1.319 ± 0.955 vs. 1.006 ± 0.019, t = −3.077, P = 0.002) and IEA (1.299 ± 0.917 vs. 1.005 ± 0.008, t = −2.196, P = 0.031). Similarly, Figure 2C indicates a rise in KLRC3 mRNA expression levels in the AIT cohort versus the control group in IFA (1.260 ± 0.811 vs. 1.011 ± 0.016, t = −2.043, P = 0.043) and IEA (1.454 ± 0.999 vs. 1.009 ± 0.014, t = −3.048, P = 0.003). Further analysis revealed no significant variation in the mRNA expression levels of KLRC1 and KLRC3 across the iodine areas (F = 1.609, P = 0.203; F = 1.270, P = 0.284).
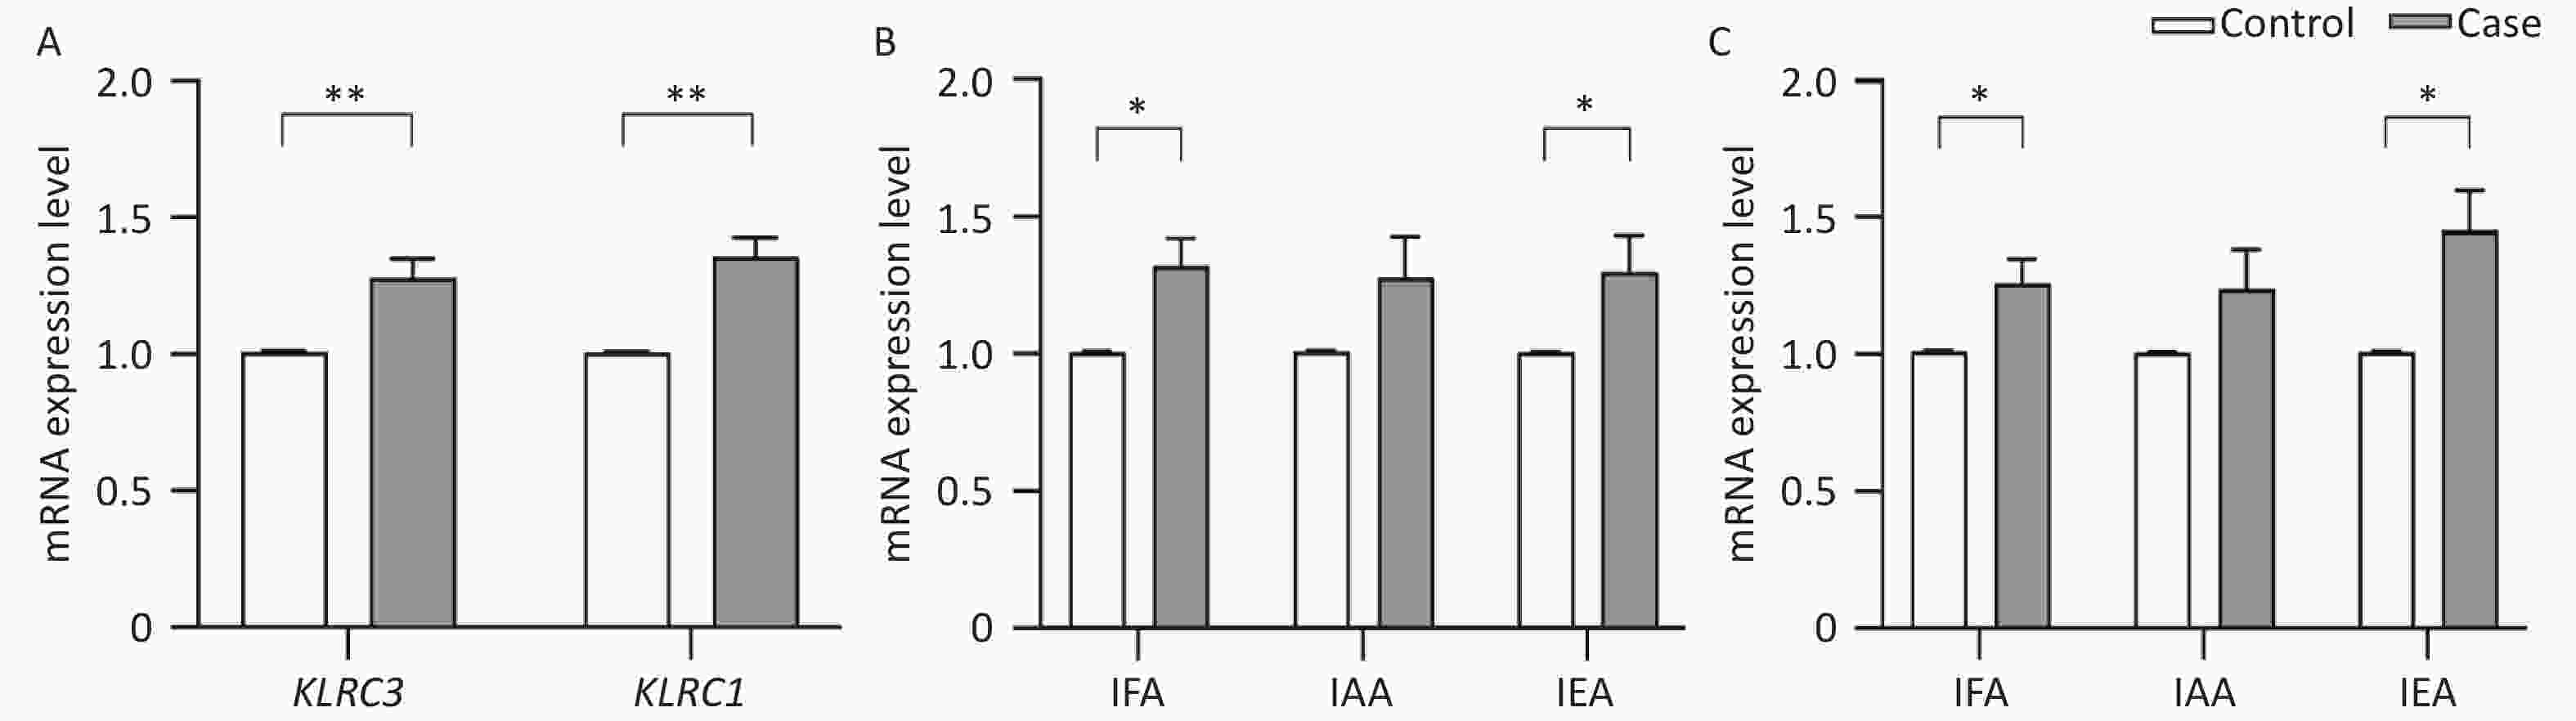
Figure 2. mRNA expression levels of KLRC1 and KLRC3 gene.
-
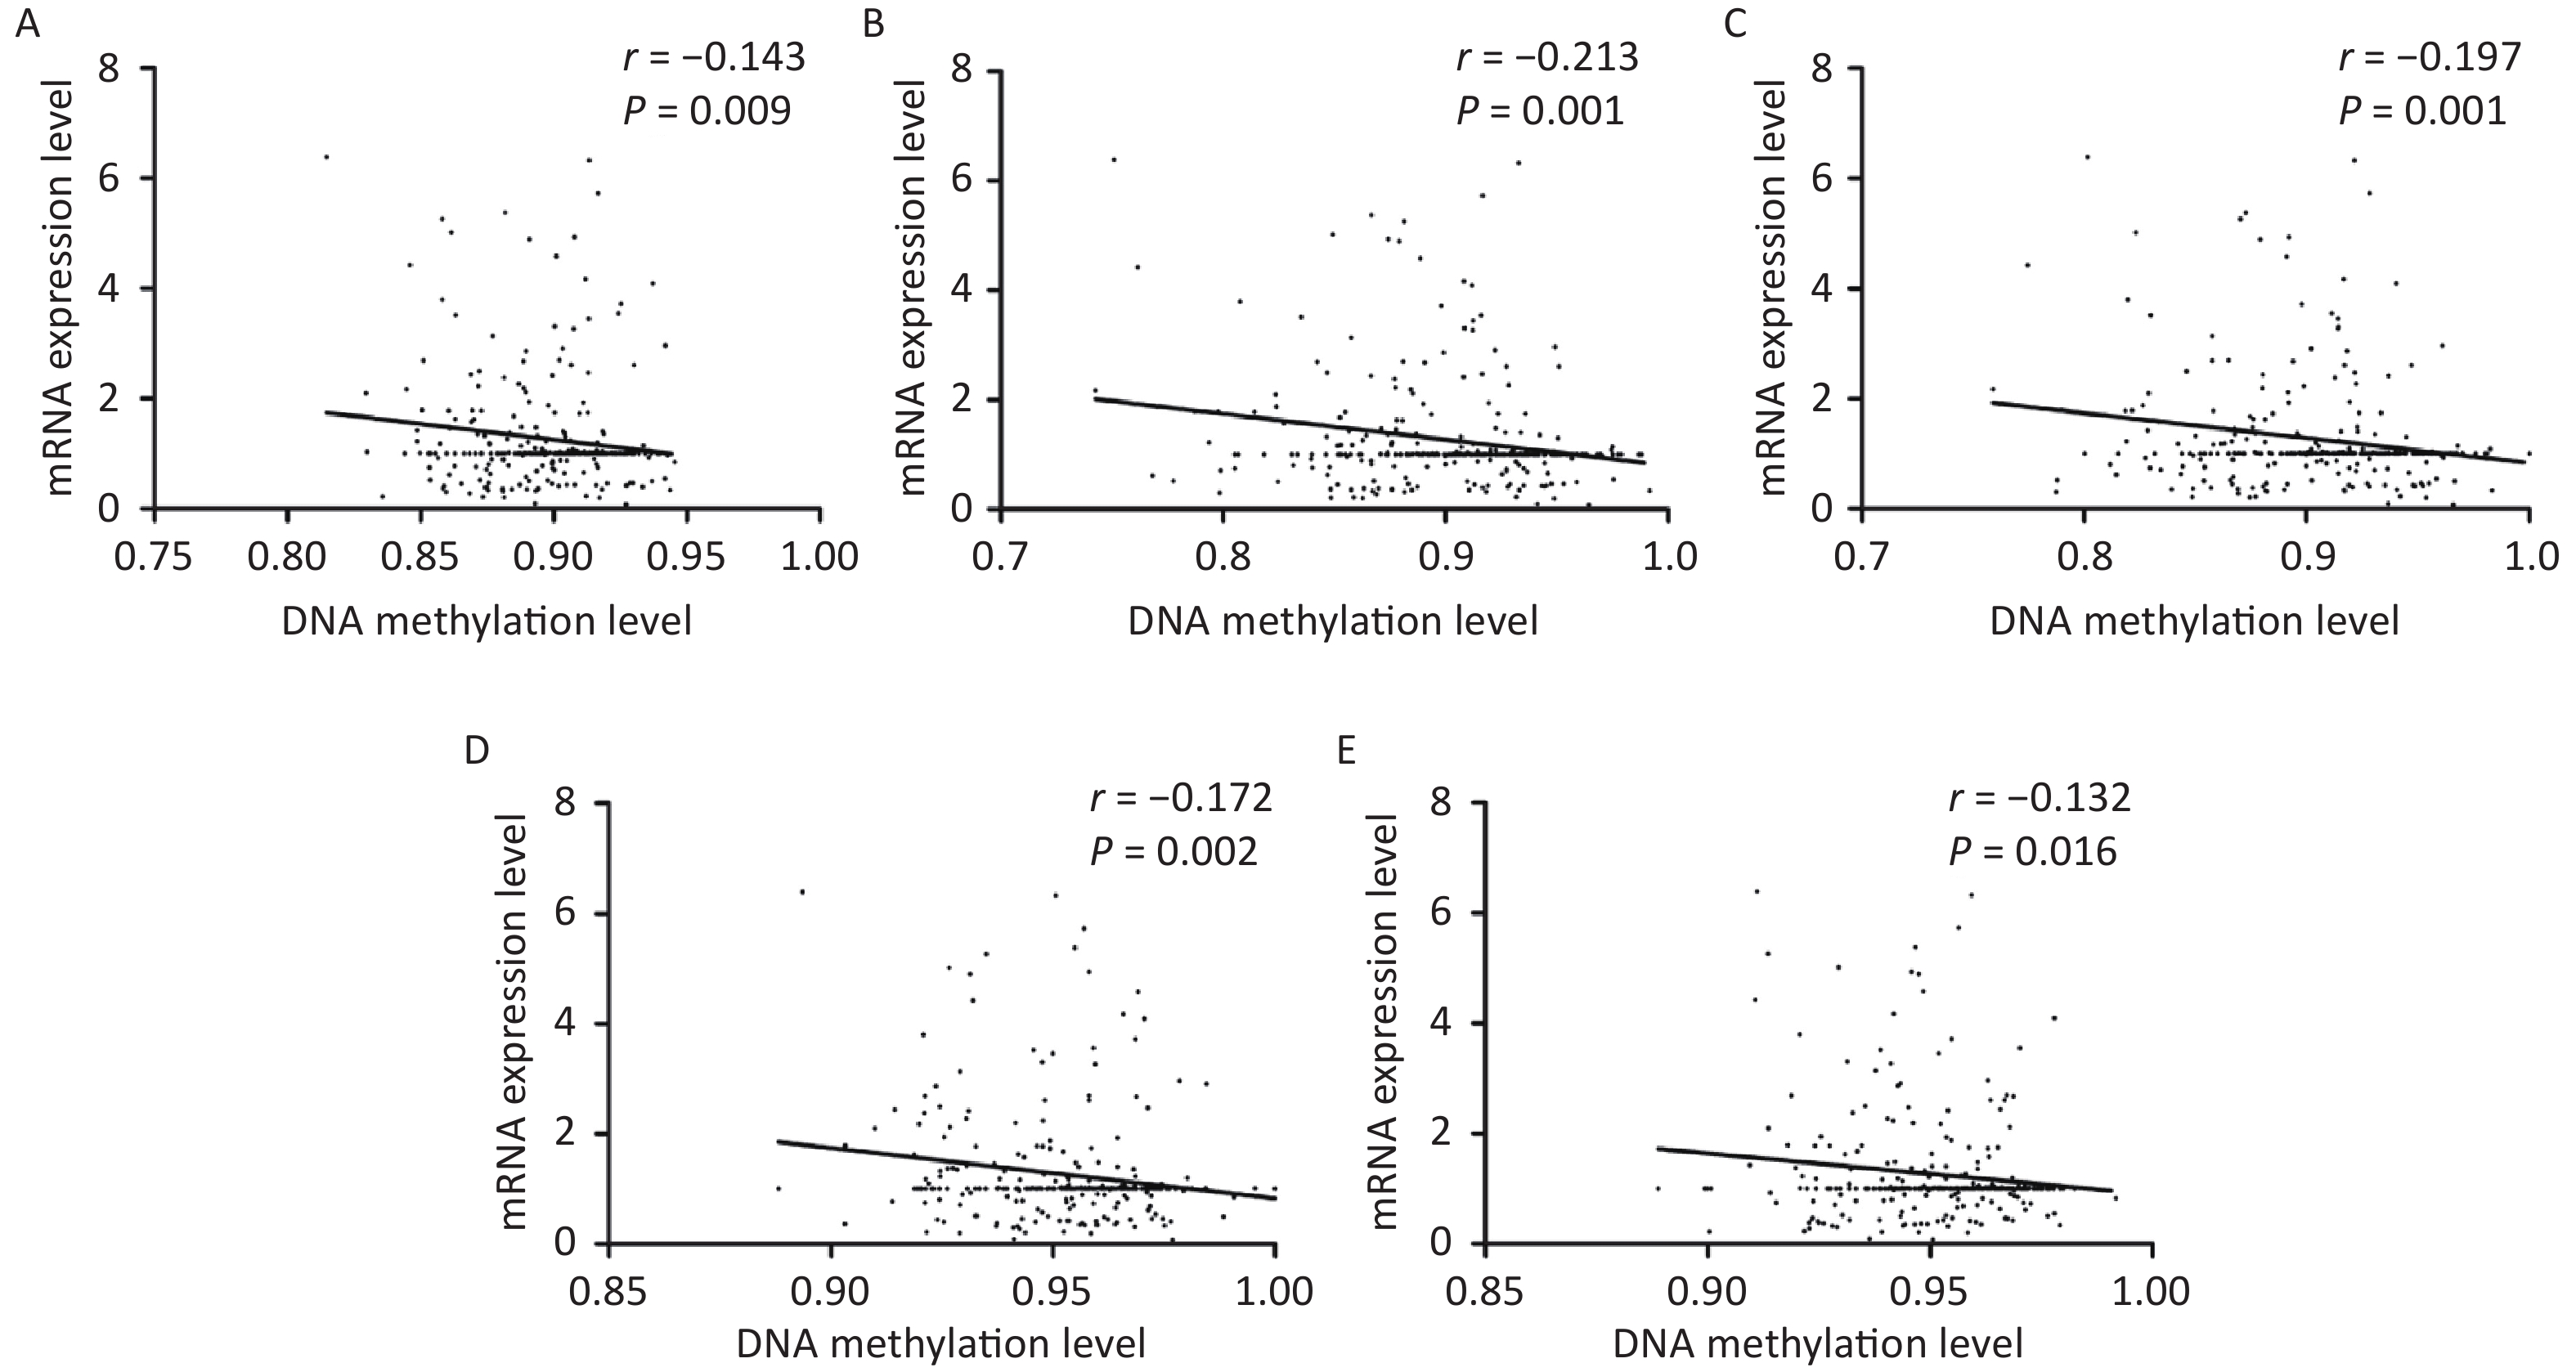
As shown in Figure 3, correlative analyses showed that DNA methylation levels in KLRC1 and its four associated CpG sites were inversely related to mRNA expression (all P < 0.050). However, no linear correlation was observed between the DNA methylation status of KLRC3 and its seven CpG sites or mRNA expression levels. In addition, there were no linear associations between DNA methylation and mRNA expression levels of KLRC1 and KLRC3 when analyzed with varying water iodine concentrations (all P > 0.050).
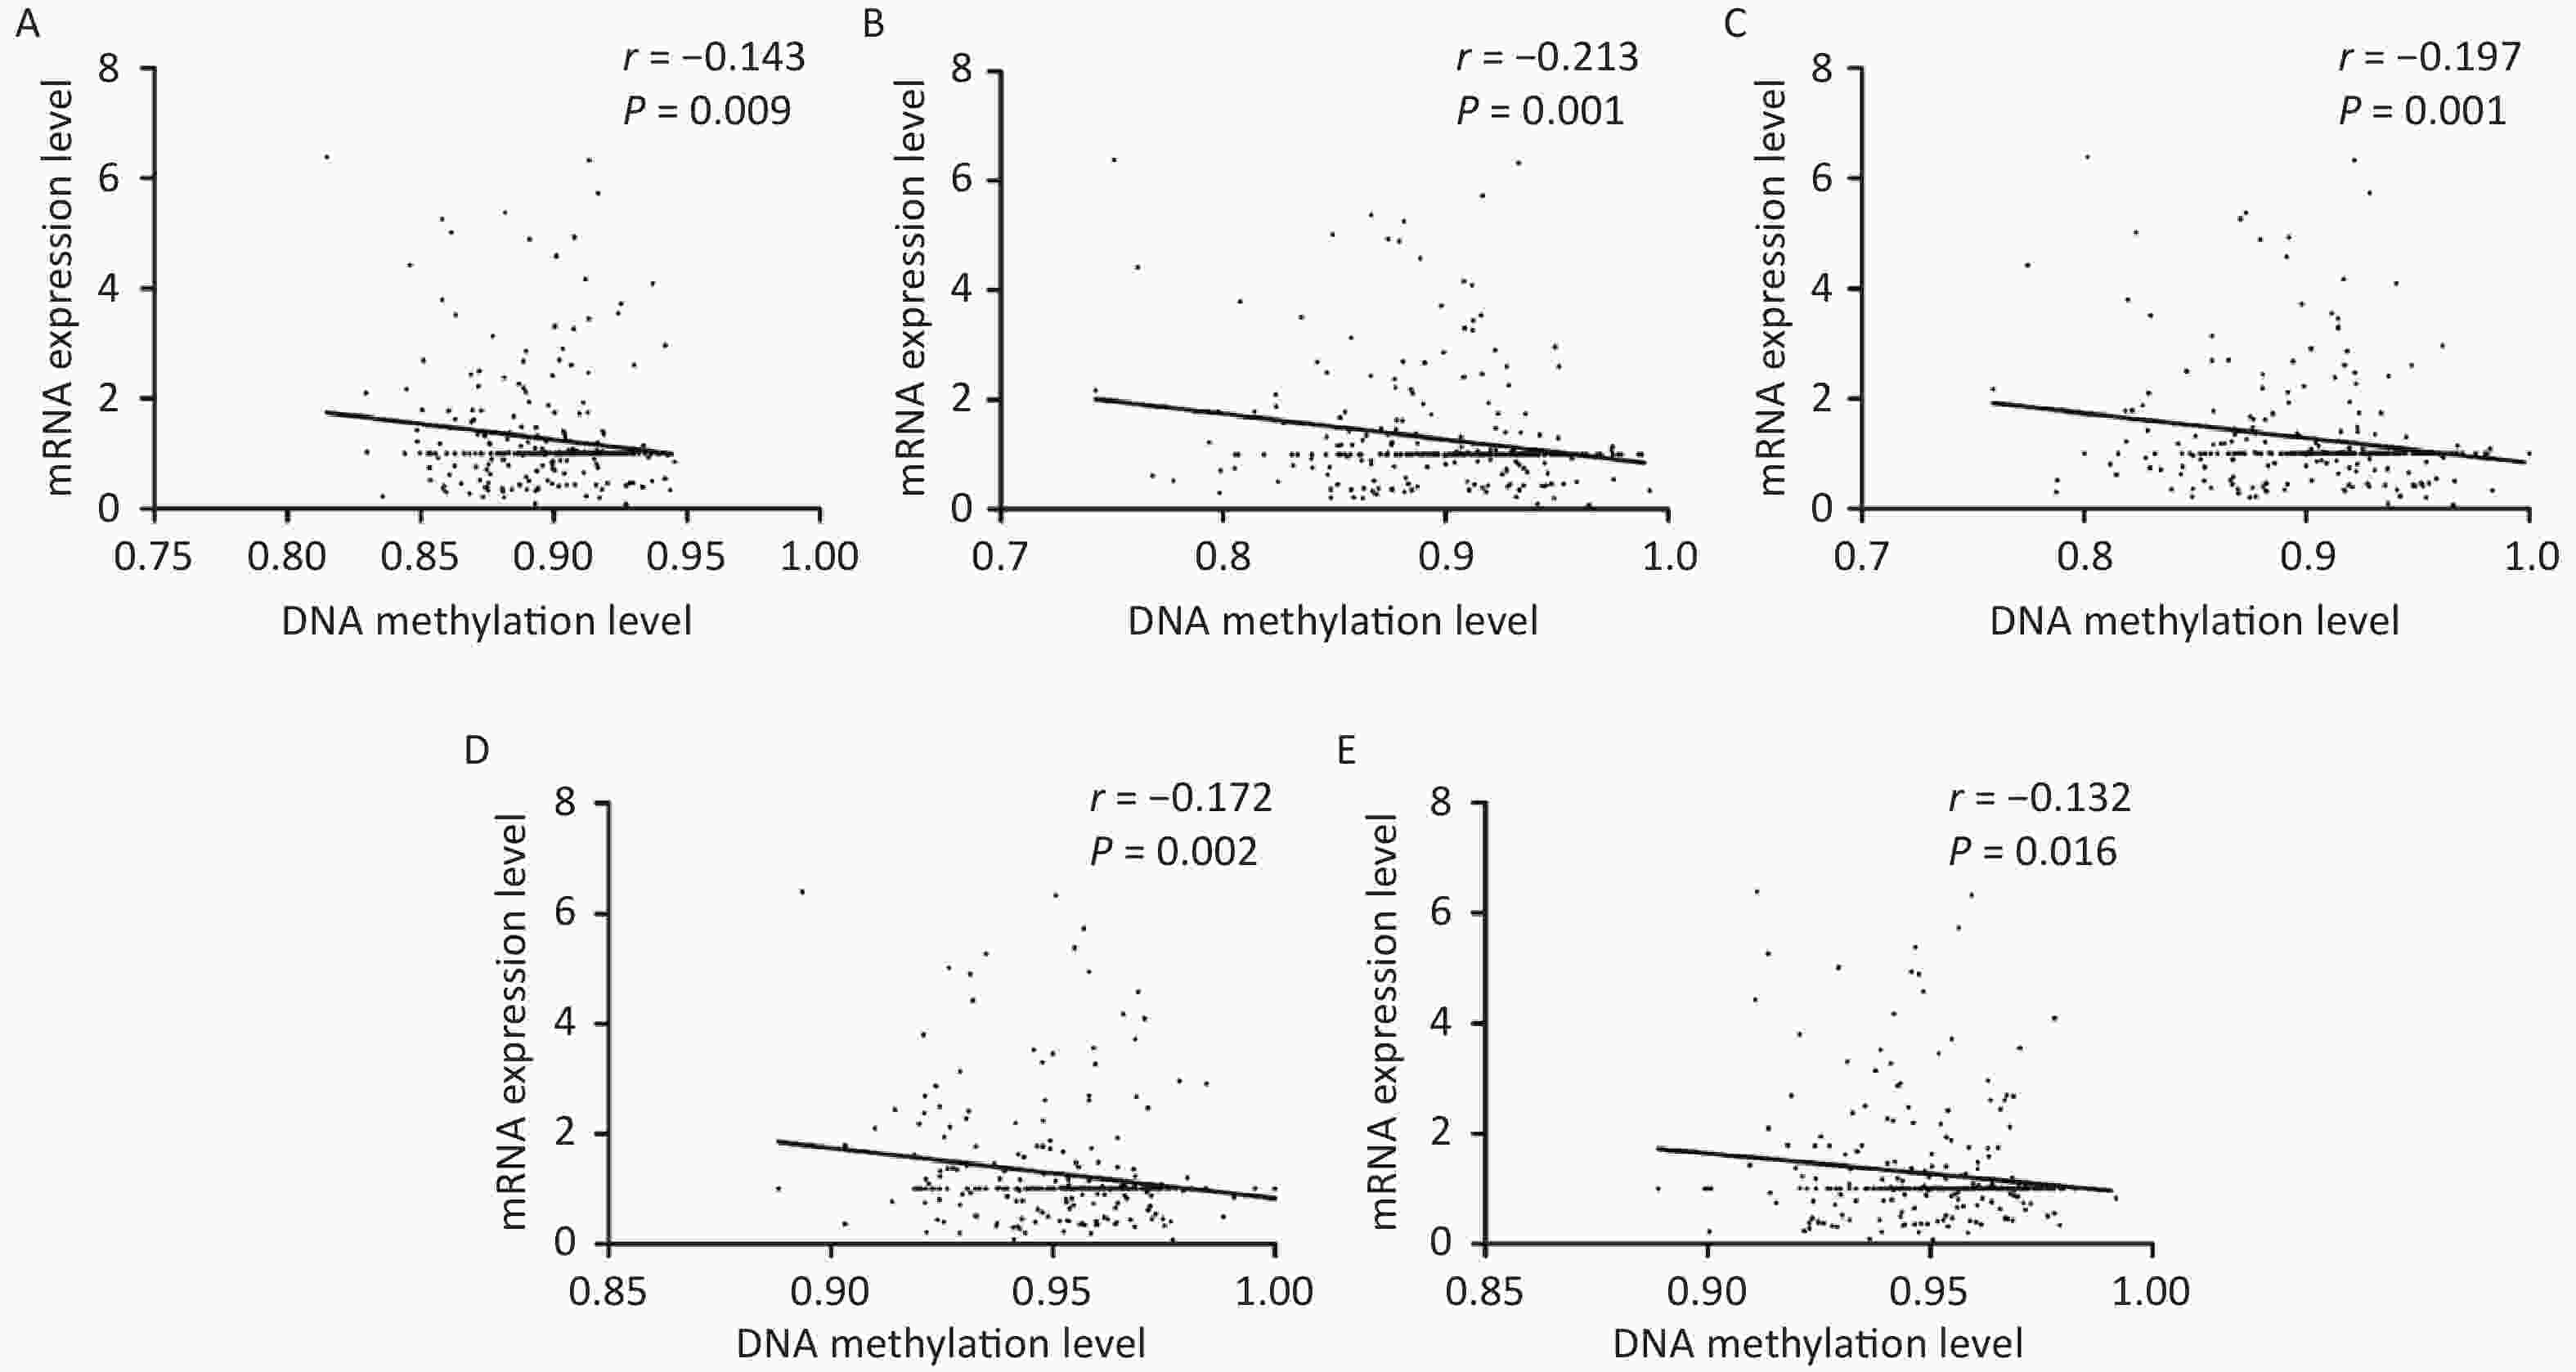
Figure 3. Scatter plots for mRNA expression levels and DNA methylation levels of KLRC1.
-
The present study identified NK cell-associated genes, specifically KLRC1, KLRC3, and SH2D1B, as DMGs. Further investigation in a larger cohort demonstrated that KLRC1 was hypomethylated and exhibited increased transcription, whereas KLRC3 showed hypermethylation and elevated expression levels in individuals with AIT. Environmentally, KLRC1 was found to be hypomethylated and transcriptionally active, particularly in IFA and IEA.
KLRC1 (NKG2A), an inhibitory receptor predominantly expressed in NK and T cells, plays a crucial role in modulating NK cell exhaustion and inhibiting cytotoxicity[31]. Our findings indicate that KLRC1 was hypomethylated and showed increased mRNA expression in the AIT cohort. Additionally, an inverse relationship was observed between the DNA methylation status and mRNA expression levels of KLRC1, aligning with the principle that promoter hypomethylation is associated with increased gene expression (as observed with KLRC1 promoter methylation changes in Table 2)[32]. Previous studies have also noted increased expression of KLRC1 in patients with HT[33], suggesting that the methylation status of KLRC1 may regulate NK cell function and contribute to AIT pathogenesis. However, further research is required to confirm this hypothesis.
KLRC3 (NKG2E) forms a complex with CD94 in NK cells and acts as an activating receptor that modulates the immune response[34]. Our data showed that KLRC3 was hypermethylated and had higher transcriptional activity in the AIT cohort. This finding may seem counterintuitive to traditional views as emerging evidence suggests that promoter hypermethylation sometimes coincides with increased transcriptional activity[35]. The CpG sites examined near KLRC3 were primarily in the distal promoter region (TSS1500), which typically has a reduced effect on gene expression[36]. The complex role of DNA methylation in immune-mediated diseases[37] indicates that the relationship between KLRC3 methylation and AIT pathogenesis requires further investigation.
SH2D1B (EAT-2) functions as an inhibitory component in NK cell operations and is involved in signal transduction modulation through signaling lymphocyte activation molecule family receptors, affecting both the innate and adaptive immune systems[38]. Previous studies have shown that SH2D1B increases the secretion of pro-inflammatory cytokines and chemokines, thereby increasing the regulatory and effector functions of human immune cells[39]. Research using animal models has identified SH2D1B as a negative regulator of NK cell activity, with these regulatory changes potentially leading to autoreactivity and autoimmunity[40]. Although identified as a DMG in the 850K array, our analysis did not reveal significant differences in SH2D1B methylation between the AIT and control groups.
Correlation and stratification analyses were performed to explore the influence of potential confounding factors on the methylation of candidate genes. These findings suggest that the methylation status of certain genes, particularly KLRC1, is associated with variables such as age, sex, SIC, and WIC. Autoimmune diseases generally show a female predilection, especially pronounced in thyroid disorders such as HT and Graves’ disease[41], which is consistent with the observations of this study. A notable number of CpG sites near the candidate genes displayed differences in methylation, primarily in individuals older than 29 years. It has been established that AIT is more common in females and increases with age[1], particularly affecting age groups beyond 45–50 years[42].This finding is supported by our data. Iodine is a crucial component in the synthesis of thyroid hormones, which is a complex process that occurs in thyroid follicular cells. This study identified a significant association between serum and water iodine concentrations and DNA methylation status of genes implicated in AIT.
Our investigation was centered on the distinct methylation patterns observed between AIT cases and controls in different iodine environments. Our findings revealed that in IEA, KLRC1 was hypomethylated and showed increased expression in the AIT cohort. These findings support the hypothesis that excessive iodine intake increases the risk of developing AIT. For instance, a five-year prospective study indicated an increasing cumulative incidence of AIT with varying iodine intake levels: 0.2% in mildly deficient, 1.0% in more than adequate, and 1.3% in excessive iodine intake scenarios[9]. Additionally, our group observed a higher incidence rate of AIT among lactating women in iodine-excess regions than among those in optimal iodine areas[7]. In areas where groundwater consumption is prevalent and groundwater iodine levels are high, iodine nutritional status largely depends on groundwater iodine concentration[43]. IEA, which lacks iodized salt provision, relies heavily on waterborne iodine, leading to a significantly higher UIC in IEA than in IFA and IAA[28]. This suggests that excessive waterborne iodine exposure in the IEA influences KLRC1 methylation and mRNA transcription, contributing to the development of AIT.
In IFA, KLRC1 exhibited hypomethylation and increased transcription in the AIT cohort. The exacerbation of thyroid autoimmunity following iodine supplementation after prolonged deficiency has been well documented. A previous study highlighted a potential link between increased iodine consumption and AIT onset, suggesting that excess iodine may trigger thyroid autoimmunity, leading to hypothyroidism[10]. Moreover, a longitudinal study by Zois et al. involving 302 children over seven years recorded a threefold increase in AIT prevalence post-iodization[44].
In areas with lower iodine levels, the iodine nutritional index primarily depends on the iodine content in salt and dietary iodine intake, especially with the implementation of the USI[43]. In our study, the IFA was supplied with an iodized salt, making it the primary source of salt-derived iodine. Our previous research indicated that the UIC in IFA (228.4 μg/L) was similar to that in IAA (243.9 μg/L)[28], suggesting comparable iodine nutritional levels despite the different iodine sources. We observed hypomethylation of the KLRC1 gene in the AIT cohort in IAA, where iodized salt was not supplied, and iodine intake mainly came from water. This suggests that diet in IFA or waterborne in IAA may influence KLRC1 methylation irrespective of the iodine source, contributing to AIT pathogenesis. To reduce the disease risk associated with iodine nutrition, different strategies may be considered: reducing the iodized salt supply in IFA to lower iodine nutritional levels and potentially decrease AIT risk and in IAA, focusing on environmental health impacts, such as water treatment methods to reduce drinking water iodine levels.
A significant challenge in this study involved comparing DNA methylation profiles between the AIT and control groups from different iodine environments, particularly when controlling for confounding variables. Although the water iodine levels in the IFA, IAA, and IEA regions were very different, the differences in iodine nutritional levels (urinary iodine level and serum iodine) among the populations of the three regions were not obvious because China adopted different salt iodization policies (iodized salt in the IFA and non-iodized salt in the IAA and IEA regions). Urinary and serum iodine levels in the human body are more reflective of the iodine nutritional status, which may lead to a smaller difference in DNA methylation levels among the three regions. Moreover, owing to the broad scope of our research and ethical considerations, we used whole blood samples instead of specific thyroid tissues. Whole blood comprises various cell types, which limits our ability to obtain detailed biological insights specific to certain tissues or organs. This limitation may obscure subtle biological differences and disease mechanisms pertinent to specific tissue types, highlighting the complexity of dissecting the molecular underpinnings of diseases, such as AIT, within the constraints of available sample types.
-
This study provides cross-sectional empirical evidence to clarify the relationship between genomic methylation patterns and AIT in populations exposed to varying waterborne iodine concentrations. The DNA methylation status of KLRC1 and KLRC3 is closely associated with AIT pathogenesis. Our findings indicate that changes in KLRC1 DNA methylation in patients with AIT may vary significantly between IFA and IEA.
-
Yao Chen: Writing-original draft preparation and formal analysis. Jinjin Liu: Writing-reviewing and editing. Mengying Qu, Bingxuan Ren, Huaiyong Wu, Li Zhang, and Zheng Zhou: Investigation and validation. Lixiang Liu: Project administration. Hongmei Shen: Supervision and funding acquisition.
-
Table S1. The basic information of AIT patients and health control in 850K
Group Sample Sex Age
(years)BMI
(kg/m2)TSH
(mIU/L)FT3
(pmol/L)FT4
(pmol/L)TPOAb
(IU/mL)TgAb
(IU/mL)Thyroid ultrasound Control Con-1 Female 30 25.71 3.59 5.95 17.18 11.74 8 Normal Con-2 Female 32 23.92 0.51 4.71 19.73 9.21 7 Normal Con-3 Female 34 25.39 1.58 4.46 12.97 9.73 7 Normal Con-4 Female 39 21.51 2.51 4.87 16.53 7.48 6 Normal Con-5 Female 42 25.39 1.75 3.97 20.54 < 5.00 6 Normal Con-6 Female 46 22.83 3.78 4.72 17.57 11.20 6 Normal Con-7 Female 46 19.81 2.90 4.98 18.75 20.19 5 Normal Con-8 Female 46 24.09 2.32 4.74 16.09 7.50 6 Normal Con-9 Female 48 22.03 0.76 4.10 16.61 11.28 8 Normal Con-10 Female 54 19.83 3.03 3.87 15.16 8.55 4 Normal AIT AIT-1 Female 30 20.70 > 100.00 2.55 ↓ 3.54 ↓ > 1300.00 41 Bilateral diffuse thyroid lesions AIT-2 Female 31 25.71 > 100.00 5.04 7.60 ↓ > 1300.00 36 Bilateral diffuse thyroid lesions, Abnormal hypoechoic area of left thyroid, Cystic nodule of right thyroid AIT-3 Female 34 23.15 5.84 4.67 15.11 > 1300.00 39 Bilateral diffuse thyroid lesions, left thyroid nodule AIT-4 Female 40 23.14 6.57 4.75 17.85 > 1300.00 31 Bilateral goiter with diffuse lesions, Cystic and solid nodules of the right thyroid AIT-5 Female 40 20.03 93.49 2.95 ↓ 3.85 ↓ 215.10 18 Bilateral goiter with diffuse lesions AIT-6 Female 42 23.88 14.98 5.79 10.30 ↓ > 1300.00 32 Goiter with diffuse lesions, Calcification in the right thyroid parenchyma, Bilateral thyroid nodules and partial nodules with calcification AIT-7 Female 44 20.96 4.86 4.64 17.62 > 1300.00 34 Bilateral diffuse thyroid lesions AIT-8 Female 48 24.89 > 100.00 < 0.40 ↓ 0.72 ↓ > 1300.00 29 Bilateral diffuse thyroid lesions AIT-9 Female 51 21.26 4.66 3.95 13.84 > 600.00 36 Goiter with diffuse lesions AIT-10 Female 54 19.81 8.27 4.37 17.73 459.10 53 Bilateral diffuse thyroid lesions Note. AIT, autoimmune thyroiditis; Con,control; BMI, body mass index; TSH, thyroid stimulating hormone; TPOAb, thyroid peroxidase antibodies; TgAb, thyroglobulin antibodies; FT3, free triiodothyronine; FT4, free thyroxine; ↓, indicates lower than the reference ranges. Table S3. Primer sequences in MethylTargetTM
Gene Primer F Primer R KLRC1 GTGTAATTAAAAGGGTGAGGTGGAG CTCCTAACCTCRTAATCRACATACCTC KLRC3 GGAGATGAGTTAGTAGAGAAATAGGAGATTAG ACCTCAACCTCCCAAACAAC SH2D1B TTGGAAATTATGGTAGTTGAAGATAGA ACCCCTATAATAACCAAAAACCTAAACA Table S4. Primer sequences in QRT-PCR
Gene Primer F Primer R KLRC1 5’-GGGTGACAATGAATGGTTTGG-3’ 5’-GATCCACACTGGGCTGATTTA-3’ KLRC3 5’-GTTTACTGCCACCTCCAGAA-3’ 5’-TCTGCTCCAGGAAAGGAATAAG-3’ β-actin 5’-CCTTTCCTGGGCATGGAGTCCTG-3’ 5’-GGAGCAATGATCTTGATCTTC-3’ Table S5. Correlation between DNA methylation levels of the candidate genes and age, iodine nutrition levels, and thyroid function in AIT patients
Characteristics KLRC1 KLRC3 SH2D1B UIC (μg/L) r −0.016 0.070 0.069 P 0.833 0.359 0.366 SIC (μg/L) r −0.223 0.066 −0.105 P 0.004* 0.393 0.175 Age (years) R −0.134 −0.235 −0.089 P 0.080 0.002* 0.241 FT3 (pmol/L) r −0.105 −0.018 0.011 P 0.171 0.810 0.887 FT4 (pmol/L) r −0.111 0.084 −0.020 P 0.150 0.267 0.789 TSH (µIU/mL) r −0.083 0.040 0.015 P 0.278 0.597 0.843 Note. UIC, urinary iodine concentration; SIC, serum iodine concentration; FT3, free triiodothyronine; FT4, free thyroxine; TSH, thyroid stimulating hormone; r, Pearson correlation coefficient; R, Spearman correlation coefficient; *P < 0.05. Table S6. DNA methylation levels of candidate genes and CpG sites between AIT and control groups stratifying by sex
Gene Site Male Female Group.diff P Group.diff P KLRC1 − −0.019 0.010* −0.015 3.12 × 10⁻⁸** 28 −0.006 0.516 −0.012 3.69 × 10⁻⁵** 97 −0.017 0.239 −0.009 0.158 138 −0.025 0.170 −0.005 0.184 142 −0.033 0.017* −0.029 1.78 × 10⁻⁹** 144 −0.032 0.012* −0.030 7.81 × 10⁻¹¹** 154 −0.012 0.054 −0.009 1.14 × 10⁻⁵** 182 −0.007 0.203 −0.009 3.48 × 10⁻⁶** KLRC3 − 0.050 0.351 0.047 0.052 65 0.054 0.360 0.048 0.076 99 0.070 0.350 0.067 0.043* 122 0.072 0.282 0.066 0.030* 133 0.075 0.316 0.066 0.043* 162 0.040 0.429 0.049 0.038* 174 0.026 0.413 0.022 0.115 178 0.015 0.570 0.010 0.339 SH2D1B − 0.010 0.830 −0.034 0.096 81 0.010 0.830 −0.034 0.096 Note. Group.diff, the methylation level of case-the methylation level of control; *P < 0.05, **P < 0.001. Table S7. DNA methylation levels of candidate genes and CpG sites between AIT and control groups stratifying by age
Gene Site ≤ 29 years 30−39 years 40−49 years > 50 years Group.diff P Group.diff P Group.diff P Group.diff P KLRC1 − −0.015 0.599 −0.016 0.006* −0.013 0.001* −0.018 0.173 28 −0.002 0.434 −0.010 0.019* −0.010 0.058 −0.013 0.141 97 0.004 0.070 −0.011 0.928 −0.001 0.012* −0.015 0.086 138 −0.009 0.685 0.004 0.393 −0.016 0.043* −0.005 0.176 142 −0.038 0.908 −0.038 <0.001** −0.019 0.404 −0.030 0.001* 144 −0.044 0.680 −0.038 <0.001** −0.019 0.528 −0.033 0.001* 154 −0.010 0.848 −0.006 0.023* −0.006 0.046* −0.012 0.031* 182 −0.008 0.008* −0.010 0.010* −0.007 0.132 −0.008 0.506 KLRC3 − 0.192 0.311 0.061 0.316 0.056 0.406 −0.003 0.596 65 0.203 0.496 0.065 0.260 0.048 0.177 0.001 0.745 99 0.267 0.363 0.094 0.173 0.061 0.386 0.001 0.990 122 0.250 0.299 0.087 0.159 0.065 0.321 0.006 0.799 133 0.243 0.295 0.094 0.209 0.072 0.231 −0.002 0.703 162 0.197 0.200 0.067 0.252 0.037 0.448 0.005 0.413 174 0.099 0.197 0.018 0.972 0.029 0.478 −0.002 0.899 178 0.078 0.823 0.010 0.313 0.022 0.787 −0.015 0.320 SH2D1B − 0.010 0.079 −0.003 0.531 −0.030 0.019* −0.046 0.017* 81 0.010 0.079 −0.003 0.531 −0.030 0.019* −0.046 0.017* Note. Group.diff, the methylation level of case-the methylation level of control; *P < 0.05, **P < 0.001. Table S8. DNA methylation levels of candidate genes and CpG sites between AIT and control groups stratifying by SIC
Gene Site < 50 μg/L 50–109.9 μg/L ≥ 110 μg/L Group.diff P Group.diff P Group.diff P KLRC1 − 0.003 0.812 −0.016 < 0.001** −0.029 0.265 28 0.006 0.122 −0.012 0.001* −0.035 0.757 97 0.001 0.856 −0.008 0.157 −0.069 0.189 138 −0.006 0.796 −0.007 0.252 −0.019 0.513 142 0.018 0.281 −0.031 < 0.001** −0.028 0.319 144 0.009 0.345 −0.032 < 0.001** −0.028 0.539 154 0.003 0.471 −0.009 0.001* −0.012 0.477 182 −0.011 0.290 −0.009 0.012* −0.009 0.575 KLRC3 − −0.067 0.385 0.050 0.490 0.020 0.357 65 −0.133 0.302 0.052 0.357 0.039 0.309 99 −0.122 0.452 0.070 0.273 0.036 0.475 122 −0.090 0.401 0.068 0.443 0.064 0.630 133 −0.115 0.365 0.070 0.382 0.025 0.467 162 −0.058 0.364 0.051 0.659 0.007 0.481 174 −0.042 0.948 0.023 0.710 −0.011 0.286 178 −0.059 0.902 0.013 0.316 −0.019 0.128 SH2D1B − −0.021 0.599 −0.023 0.001* 0.024 0.684 81 −0.021 0.599 −0.023 0.001* 0.024 0.684 Note. Group.diff, the methylation level of case-the methylation level of control; *P < 0.05, **P < 0.001, t test. Table S9. DNA methylation levels of candidate genes and CpG sites between AIT and control groups stratifying by UIC
Gene Site < 100 μg/L 100−199 μg/L 200−299 μg/L > 300 μg/L Group.diff P Group.diff P Group.diff P Group.diff P KLRC1 − −0.009 0.189 −0.015 0.127 −0.015 0.149 −0.016 < 0.001** 28 −0.003 0.331 −0.016 0.136 −0.007 0.038* −0.009 0.015* 97 −0.009 0.049* −0.011 0.504 −0.004 0.923 −0.008 0.489 138 −0.007 0.068 −0.007 0.939 −0.005 0.598 −0.009 0.001* 142 −0.016 0.012* −0.023 0.005* −0.035 0.011* −0.033 0.002* 144 −0.025 0.022* −0.025 0.020* −0.036 0.009* −0.034 0.001* 154 −0.004 0.638 −0.009 0.471 −0.009 0.082 −0.010 0.001* 182 −0.003 0.486 −0.011 0.740 −0.007 0.043* −0.008 0.059 KLRC3 − −0.060 0.737 0.058 0.304 0.057 0.354 0.061 0.570 65 −0.079 0.615 0.069 0.199 0.057 0.099 0.064 0.996 99 −0.093 0.824 0.083 0.210 0.068 0.104 0.088 0.991 122 −0.083 0.586 0.081 0.267 0.073 0.033* 0.085 0.714 133 −0.080 0.538 0.088 0.200 0.074 0.054 0.082 0.745 162 −0.040 0.728 0.049 0.310 0.066 0.013* 0.058 0.103 174 −0.025 0.821 0.027 0.967 0.044 0.001* 0.028 0.420 178 −0.019 0.439 0.011 0.370 0.018 0.248 0.018 0.093 SH2D1B − 0.036 0.767 0.009 0.501 −0.037 0.008* −0.040 0.021* 81 0.036 0.767 0.009 0.501 −0.037 0.008* −0.040 0.021* Note. Group.diff, the methylation level of case-the methylation level of control; *P < 0.05, **P < 0.001, t test. Table S10. DNA methylation levels of candidate genes and related CpG sites among cases in three areas
Gene Site IFA IAA IEA P KLRC1 − 0.896 ± 0.025 0.886 ± 0.022 0.889 ± 0.029 0.081 28 0.895 ± 0.028 0.888 ± 0.029 0.892 ± 0.032 0.951 97 0.740 ± 0.050 0.732 ± 0.054 0.745 ± 0.054 0.522 138 0.934 ± 0.046 0.938 ± 0.018 0.933 ± 0.025 0.814 142 0.900 ± 0.048a 0.879 ± 0.044 0.879 ± 0.049 0.022* 144 0.901 ± 0.045a 0.879 ± 0.040 0.884 ± 0.047 0.017* 154 0.954 ± 0.018a 0.945 ± 0.016 0.943 ± 0.022 0.002* 182 0.950 ± 0.018 0.944 ± 0.015 0.944 ± 0.018 0.125 KLRC3 − 0.653 ± 0.207 0.639 ± 0.232 0.684 ± 0.190 0.573 65 0.616 ± 0.230 0.596 ± 0.263 0.693 ± 0.211 0.510 99 0.539 ± 0.282 0.520 ± 0.313 0.578 ± 0.258 0.602 122 0.573 ± 0.263 0.555 ± 0.291 0.619 ± 0.232 0.480 133 0.550 ± 0.278 0.536 ± 0.314 0.593 ± 0.254 0.590 162 0.670 ± 0.204 0.657 ± 0.224 0.700 ± 0.187 0.577 174 0.801 ± 0.113 0.792 ± 0.132 0.812 ± 0.114 0.739 178 0.821 ± 0.096 0.817 ± 0.109 0.832 ± 0.097 0.752 SH2D1B − 0.155 ± 0.191 0.197 ± 0.171 0.194 ± 0.206 0.278 81 0.155 ± 0.191 0.197 ± 0.171 0.194 ± 0.206 0.278 Note. Group.diff, the methylation level of case-the methylation level of control; a Significant differences compared to IFA; *Significant differences among three groups; P<0.05.
doi: 10.3967/bes2024.103
DNA Methylation of KLRC1 and KLRC3 in Autoimmune Thyroiditis: Perspective of Different Water Iodine Exposure
-
Abstract:
Objective This study aimed to identify differentially methylated genes (DMGs) associated with natural killer cells in patients with autoimmune thyroiditis (AIT), focusing on the influence of varying water iodine exposure levels. Methods Participants were divided into categories based on median water iodine (MWI) concentrations: iodine-fortified areas (IFA, MWI < 10 µg/L), iodine-adequate areas (IAA, 40 ≤ MWI ≤ 100 µg/L), and iodine-excessive areas (IEA, MWI > 300 µg/L). A total of 176 matched AIT cases and controls were recruited and divided into 89, 40, and 47 pairs for IFA, IAA, and IEA, respectively. DMGs were identified using 850K BeadChip analysis for 10/10 paired samples. Validation of DNA methylation and mRNA expression levels of the DMGs was conducted using MethylTarget™ and QRT-PCR for 176/176 paired samples. Results KLRC1, KLRC3, and SH2D1B were identified as significant DMGs. Validation revealed that KLRC1 was hypomethylated and highly expressed, whereas KLRC3 was hypermethylated and highly expressed in individuals with AIT. Furthermore, KLRC1 was hypomethylated and highly expressed in both IFA and IEA. Conclusion The DNA methylation status of KLRC1 and KLRC3 may play crucial roles in AIT pathogenesis. Additionally, DNA methylation of KLRC1 seems to be influenced by different iodine concentrations in water. -
Key words:
- Autoimmune thyroiditis /
- DNA methylation /
- KLRC1 /
- KLRC3 /
- SH2D1B /
- Iodine
&These authors contributed equally to this work.
注释:1) CONFLICT OF INTEREST: -
Figure 1. Correlation between DNA methylation levels of the candidate genes and age, iodine nutrition levels, and thyroid function in patients with autoimmune thyroiditis (AIT).
Figure 2. mRNA expression levels of KLRC1 and KLRC3 gene.
(A) mRNA expression levels of KLRC1 and KLRC3 in cases and controls; (B) mRNA expression levels of KLRC1 in cases and controls from different water-iodine areas; (C) mRNA expression levels of KLRC3 in cases and controls from different water-iodine areas. IFA, iodine-fortified areas; IAA, iodine-adequate areas; IEA, iodine-excessive areas. *P < 0.05; **P< 0.01.
Figure 3. Scatter plots for mRNA expression levels and DNA methylation levels of KLRC1.
(A) KLRC1, (B) KLRC1_142, (C) KLRC1_144, (D) KLRC1_154, and (E) KLRC1_182.
Table 1. Demographic characteristics of AIT and control groups
Characteristics IFA (89:89) IAA (40:40) IEA (47:47) All pairs (176:176) Case Control Case Control Case Control Case Control Sex (male/female) 8/81 8/81 5/35 5/35 10/37 10/37 23/153 23/153 Age (years) 45 ± 8 45 ± 8 44 ± 10 44 ± 10 43 ± 11 43 ± 11 44 ± 9 44 ± 9 BMI (kg/m2) 24.4 ± 3.2 24.3 ± 2.9 24.0 ± 3.3 24.0 ± 3.4 25.6 ± 3.6 25.5 ± 3.3 24.69 ± 3.44 24.59 ± 3.24 UIC (μg/L) 224.6
(149.6−319.5)211.7
(134.0−299.8)258.2
(152.9−406.4)229.9
(116.9−339.8)451.7
(250.4−583.8)363.8
(214.3−508.1)259.60
(157.10−439.25)230.90
(144.90−363.80)SIC (μg/L) 73.6
(63.3−86.8)76.5
(68.9−85.2)70.5
(64.2−84.0)75.5
(62.8−83.6)79.9
(70.0−96.3)83.0
(70.1−93.7)74.82
(64.23−86.98)77.89
(68.08−86.41)FT3 (pmol/L) 5.2 (4.7−5.6) 5.3 (4.8−5.6) 5.1 (4.8−5.4) 5.2 (5.0−5.6) 5.2 (4.8−5.4) 5.1 (4.6−5.4) 5.2 (4.8−5.5) 5.2 (4.9−5.6) FT4 (pmol/L) 15.1
(13.6−16.7)15.7
(14.0−16.8)15.1
(13.2−16.4)16.1
(14.0−17.0)16.6
(15.3−18.5)16.3
(15.1−17.4)15.4
(13.9−17.6)16.0
(14.4−17.1)TSH (μIU/mL) 2.6 (1.8−4.9)* 2.1 (1.5−2.7) 2.5 (1.6−4.2) 2.4 (1.8−3.1) 3.1 (1.9−4.1)* 1.9 (1.4−2.6) 2.8 (1.7−4.4)* 2.1 (1.5−2.8) TGAb (+), n (%) 26 (29.2)† − 12 (30)† − 4 (8.5) − 42 (23.9) − TPOAb (+), n (%) 30 (33.7) − 10 (25.0) − 19 (40.4) − 59 (33.5) − TGAb (+) &
TPOAb (+), n (%)21 (23.6) − 17 (42.5)‡ − 19 (40.4)‡ − 57 (32.4) − Note. Data are expressed as means ± standard deviations or medians withinterquartile ranges (25th–75th percentiles) or number (%). IFA, iodine-fortification area; IAA, iodine-adequate area; IEA, iodine-excess area; UIC, urinary iodine concentration; SIC, serum iodine concentration; FT3, free triiodothyronine; FT4, free thyroxine; TSH, thyroid-stimulating hormone; TPOAb (+), thyroid peroxidase antibody positive; TGAb (+), thyroglobulin antibody positive. *Significant differences compared with control groups; †Significant differences compared with IEA; ‡Significant differences compared with IFA. P < 0.05.  下载: 导出CSV
S2. GO and KEGG enrichment results of NK cells in 850K
ID Description P Gene ID GO:0002717 positive regulation of natural killer cell mediated immunity 0.0364* KLRC3/SH2D1B GO:0002715 regulation of natural killer cell mediated immunity 0.0683 KLRC3/SH2D1B GO:0002420 natural killer cell mediated cytotoxicity directed against tumor cell target 0.0932 KLRC3 GO:0002423 natural killer cell mediated immune response to tumor cell 0.0932 KLRC3 GO:0002855 regulation of natural killer cell mediated immune response to tumor cell 0.0932 KLRC3 GO:0002858 regulation of natural killer cell mediated cytotoxicity directed against tumor cell target 0.0932 KLRC3 GO:0035747 natural killer cell chemotaxis 0.1020 KLRC3 GO:0002228 natural killer cell mediated immunity 0.1222 KLRC3/SH2D1B GO:0045954 positive regulation of natural killer cell mediated cytotoxicity 0.2471 KLRC3 GO:0042269 regulation of natural killer cell mediated cytotoxicity 0.3372 KLRC3 GO:0042267 natural killer cell mediated cytotoxicity 0.4334 KLRC3 GO:0030101 natural killer cell activation 0.5654 KLRC3 hsa04650 natural killer cell mediated cytotoxicity 0.1490 KLRC3/KLRC1/SH2D1B Note. *P < 0.05, t test.
下载: 导出CSV
Table 2. DNA methylation levels of candidate genes between AIT and control groups in the 850K
Probe Gene Chr Position Feature Case Control Group. diff P cg23810434 KLRC1 12 10603937 5’UTR 0.689 ± 0.097 0.789 ± 0.061 −0.101 0.010* cg04531182 KLRC3 12 10563981 TSS1500 0.272 ± 0.180 0.499 ± 0.299 −0.228 0.046* cg01062020 SH2D1B 1 162382848 TSS1500 0.213 ± 0.125 0.405 ± 0.230 −0.193 0.026* Note. Chr, chromosome; 5'UTR, in the range of 5'UTR sequence; TSS1500, in the range of 200 bp–1,500 bp upstream of the transcription start site; Group. diff, methylation level of case - the methylation level of control; *P < 0.05.
下载: 导出CSV
Table 3. DNA methylation levels of candidate genes and CpG sites between AIT and control groups in the MethylTargetTM
Gene Site Case Control Group. diff P KLRC1 — 0.892 ± 0.026 0.907 ± 0.019 −0.015 9.37 × 10⁻¹⁰** 28 0.893 ± 0.029 0.904 ± 0.022 −0.012 4.71 × 10⁻⁵** 97 0.740 ± 0.052 0.749 ± 0.051 −0.010 0.085 138 0.935 ± 0.036 0.942 ± 0.037 −0.008 0.059 142 0.890 ± 0.048 0.919 ± 0.031 −0.030 8.02 × 10⁻¹¹** 144 0.892 ± 0.045 0.922 ± 0.031 −0.031 2.44 × 10⁻¹²** 154 0.949 ± 0.019 0.958 ± 0.015 −0.010 1.48 × 10⁻⁶** 182 0.947 ± 0.018 0.956 ± 0.016 −0.009 4.71 × 10⁻⁵** KLRC3 — 0.658 ± 0.208 0.611 ± 0.202 0.047 0.033* 65 0.621 ± 0.233 0.573 ± 0.227 0.049 0.049* 99 0.545 ± 0.283 0.478 ± 0.280 0.067 0.027* 122 0.581 ± 0.261 0.515 ± 0.256 0.067 0.017* 133 0.558 ± 0.280 0.492 ± 0.275 0.067 0.026* 162 0.675 ± 0.204 0.627 ± 0.199 0.048 0.027* 174 0.802 ± 0.118 0.780 ± 0.116 0.022 0.080 178 0.823 ± 0.099 0.812 ± 0.088 0.011 0.283 SH2D1B — 0.147 ± 0.154 0.175 ± 0.191 −0.028 0.132 81 0.147 ± 0.154 0.175 ± 0.191 −0.028 0.132 Note. Group.diff, the methylation level of case - the methylation level of control; *P < 0.05, **P < 0.001.
下载: 导出CSV
Table 4. DNA methylation levels of candidate genes and CpG sites between AIT and control groups in different water iodine areas
Gene Sites IFA (89:89) IAA (40:40) IEA (47:47) Group.diff P Group.diff P Group.diff P KLRC1 — −0.010 0.006** −0.021 4.00 × 10⁻⁶** −0.021 6.73 × 10⁻⁵** 28 −0.010 0.013* −0.011 0.059 −0.016 0.008* 97 −0.006 0.461 −0.010 0.362 −0.017 0.139 138 −0.008 0.162 −0.010 0.013* −0.006 0.605 142 −0.017 0.010* −0.045 7.93 × 10⁻⁷** −0.040 4.35 × 10⁻⁶** 144 −0.020 0.001* −0.046 8.96 × 10⁻⁸** −0.037 1.32 × 10⁻⁵** 154 −0.002 0.489 −0.015 1.25 × 10⁻⁵** −0.018 8.73 × 10⁻⁶** 182 −0.006 0.049* −0.011 7.70 × 10⁻³** −0.013 1.06 × 10⁻³** KLRC3 — 0.037 0.250 0.054 0.265 0.060 0.127 65 0.036 0.311 0.053 0.339 0.069 0.122 99 0.050 0.250 0.076 0.253 0.090 0.098 122 0.051 0.208 0.067 0.276 0.096 0.054 133 0.053 0.220 0.076 0.249 0.085 0.116 162 0.040 0.205 0.051 0.280 0.060 0.118 174 0.021 0.240 0.034 0.217 0.013 0.582 178 0.005 0.718 0.023 0.289 0.010 0.586 SH2D1B — −0.021 0.412 −0.058 0.126 −0.016 0.675 1 −0.021 0.412 −0.058 0.126 −0.016 0.675 Note. IFA, iodine-fortification areas; IAA, iodine-adequate areas; IEA, iodine-excess areas; Group.diff, the methylation level of case - the methylation level of control; *P < 0.05, **P < 0.001.
下载: 导出CSV
S1. The basic information of AIT patients and health control in 850K
Group Sample Sex Age
(years)BMI
(kg/m2)TSH
(mIU/L)FT3
(pmol/L)FT4
(pmol/L)TPOAb
(IU/mL)TgAb
(IU/mL)Thyroid ultrasound Control Con-1 Female 30 25.71 3.59 5.95 17.18 11.74 8 Normal Con-2 Female 32 23.92 0.51 4.71 19.73 9.21 7 Normal Con-3 Female 34 25.39 1.58 4.46 12.97 9.73 7 Normal Con-4 Female 39 21.51 2.51 4.87 16.53 7.48 6 Normal Con-5 Female 42 25.39 1.75 3.97 20.54 < 5.00 6 Normal Con-6 Female 46 22.83 3.78 4.72 17.57 11.20 6 Normal Con-7 Female 46 19.81 2.90 4.98 18.75 20.19 5 Normal Con-8 Female 46 24.09 2.32 4.74 16.09 7.50 6 Normal Con-9 Female 48 22.03 0.76 4.10 16.61 11.28 8 Normal Con-10 Female 54 19.83 3.03 3.87 15.16 8.55 4 Normal AIT AIT-1 Female 30 20.70 > 100.00 2.55 ↓ 3.54 ↓ > 1300.00 41 Bilateral diffuse thyroid lesions AIT-2 Female 31 25.71 > 100.00 5.04 7.60 ↓ > 1300.00 36 Bilateral diffuse thyroid lesions, Abnormal hypoechoic area of left thyroid, Cystic nodule of right thyroid AIT-3 Female 34 23.15 5.84 4.67 15.11 > 1300.00 39 Bilateral diffuse thyroid lesions, left thyroid nodule AIT-4 Female 40 23.14 6.57 4.75 17.85 > 1300.00 31 Bilateral goiter with diffuse lesions, Cystic and solid nodules of the right thyroid AIT-5 Female 40 20.03 93.49 2.95 ↓ 3.85 ↓ 215.10 18 Bilateral goiter with diffuse lesions AIT-6 Female 42 23.88 14.98 5.79 10.30 ↓ > 1300.00 32 Goiter with diffuse lesions, Calcification in the right thyroid parenchyma, Bilateral thyroid nodules and partial nodules with calcification AIT-7 Female 44 20.96 4.86 4.64 17.62 > 1300.00 34 Bilateral diffuse thyroid lesions AIT-8 Female 48 24.89 > 100.00 < 0.40 ↓ 0.72 ↓ > 1300.00 29 Bilateral diffuse thyroid lesions AIT-9 Female 51 21.26 4.66 3.95 13.84 > 600.00 36 Goiter with diffuse lesions AIT-10 Female 54 19.81 8.27 4.37 17.73 459.10 53 Bilateral diffuse thyroid lesions Note. AIT, autoimmune thyroiditis; Con,control; BMI, body mass index; TSH, thyroid stimulating hormone; TPOAb, thyroid peroxidase antibodies; TgAb, thyroglobulin antibodies; FT3, free triiodothyronine; FT4, free thyroxine; ↓, indicates lower than the reference ranges.
下载: 导出CSV
S3. Primer sequences in MethylTargetTM
Gene Primer F Primer R KLRC1 GTGTAATTAAAAGGGTGAGGTGGAG CTCCTAACCTCRTAATCRACATACCTC KLRC3 GGAGATGAGTTAGTAGAGAAATAGGAGATTAG ACCTCAACCTCCCAAACAAC SH2D1B TTGGAAATTATGGTAGTTGAAGATAGA ACCCCTATAATAACCAAAAACCTAAACA
下载: 导出CSV
S4. Primer sequences in QRT-PCR
Gene Primer F Primer R KLRC1 5’-GGGTGACAATGAATGGTTTGG-3’ 5’-GATCCACACTGGGCTGATTTA-3’ KLRC3 5’-GTTTACTGCCACCTCCAGAA-3’ 5’-TCTGCTCCAGGAAAGGAATAAG-3’ β-actin 5’-CCTTTCCTGGGCATGGAGTCCTG-3’ 5’-GGAGCAATGATCTTGATCTTC-3’
下载: 导出CSV
S5. Correlation between DNA methylation levels of the candidate genes and age, iodine nutrition levels, and thyroid function in AIT patients
Characteristics KLRC1 KLRC3 SH2D1B UIC (μg/L) r −0.016 0.070 0.069 P 0.833 0.359 0.366 SIC (μg/L) r −0.223 0.066 −0.105 P 0.004* 0.393 0.175 Age (years) R −0.134 −0.235 −0.089 P 0.080 0.002* 0.241 FT3 (pmol/L) r −0.105 −0.018 0.011 P 0.171 0.810 0.887 FT4 (pmol/L) r −0.111 0.084 −0.020 P 0.150 0.267 0.789 TSH (µIU/mL) r −0.083 0.040 0.015 P 0.278 0.597 0.843 Note. UIC, urinary iodine concentration; SIC, serum iodine concentration; FT3, free triiodothyronine; FT4, free thyroxine; TSH, thyroid stimulating hormone; r, Pearson correlation coefficient; R, Spearman correlation coefficient; *P < 0.05.
下载: 导出CSV
S6. DNA methylation levels of candidate genes and CpG sites between AIT and control groups stratifying by sex
Gene Site Male Female Group.diff P Group.diff P KLRC1 − −0.019 0.010* −0.015 3.12 × 10⁻⁸** 28 −0.006 0.516 −0.012 3.69 × 10⁻⁵** 97 −0.017 0.239 −0.009 0.158 138 −0.025 0.170 −0.005 0.184 142 −0.033 0.017* −0.029 1.78 × 10⁻⁹** 144 −0.032 0.012* −0.030 7.81 × 10⁻¹¹** 154 −0.012 0.054 −0.009 1.14 × 10⁻⁵** 182 −0.007 0.203 −0.009 3.48 × 10⁻⁶** KLRC3 − 0.050 0.351 0.047 0.052 65 0.054 0.360 0.048 0.076 99 0.070 0.350 0.067 0.043* 122 0.072 0.282 0.066 0.030* 133 0.075 0.316 0.066 0.043* 162 0.040 0.429 0.049 0.038* 174 0.026 0.413 0.022 0.115 178 0.015 0.570 0.010 0.339 SH2D1B − 0.010 0.830 −0.034 0.096 81 0.010 0.830 −0.034 0.096 Note. Group.diff, the methylation level of case-the methylation level of control; *P < 0.05, **P < 0.001.
下载: 导出CSV
S7. DNA methylation levels of candidate genes and CpG sites between AIT and control groups stratifying by age
Gene Site ≤ 29 years 30−39 years 40−49 years > 50 years Group.diff P Group.diff P Group.diff P Group.diff P KLRC1 − −0.015 0.599 −0.016 0.006* −0.013 0.001* −0.018 0.173 28 −0.002 0.434 −0.010 0.019* −0.010 0.058 −0.013 0.141 97 0.004 0.070 −0.011 0.928 −0.001 0.012* −0.015 0.086 138 −0.009 0.685 0.004 0.393 −0.016 0.043* −0.005 0.176 142 −0.038 0.908 −0.038 <0.001** −0.019 0.404 −0.030 0.001* 144 −0.044 0.680 −0.038 <0.001** −0.019 0.528 −0.033 0.001* 154 −0.010 0.848 −0.006 0.023* −0.006 0.046* −0.012 0.031* 182 −0.008 0.008* −0.010 0.010* −0.007 0.132 −0.008 0.506 KLRC3 − 0.192 0.311 0.061 0.316 0.056 0.406 −0.003 0.596 65 0.203 0.496 0.065 0.260 0.048 0.177 0.001 0.745 99 0.267 0.363 0.094 0.173 0.061 0.386 0.001 0.990 122 0.250 0.299 0.087 0.159 0.065 0.321 0.006 0.799 133 0.243 0.295 0.094 0.209 0.072 0.231 −0.002 0.703 162 0.197 0.200 0.067 0.252 0.037 0.448 0.005 0.413 174 0.099 0.197 0.018 0.972 0.029 0.478 −0.002 0.899 178 0.078 0.823 0.010 0.313 0.022 0.787 −0.015 0.320 SH2D1B − 0.010 0.079 −0.003 0.531 −0.030 0.019* −0.046 0.017* 81 0.010 0.079 −0.003 0.531 −0.030 0.019* −0.046 0.017* Note. Group.diff, the methylation level of case-the methylation level of control; *P < 0.05, **P < 0.001.
下载: 导出CSV
S8. DNA methylation levels of candidate genes and CpG sites between AIT and control groups stratifying by SIC
Gene Site < 50 μg/L 50–109.9 μg/L ≥ 110 μg/L Group.diff P Group.diff P Group.diff P KLRC1 − 0.003 0.812 −0.016 < 0.001** −0.029 0.265 28 0.006 0.122 −0.012 0.001* −0.035 0.757 97 0.001 0.856 −0.008 0.157 −0.069 0.189 138 −0.006 0.796 −0.007 0.252 −0.019 0.513 142 0.018 0.281 −0.031 < 0.001** −0.028 0.319 144 0.009 0.345 −0.032 < 0.001** −0.028 0.539 154 0.003 0.471 −0.009 0.001* −0.012 0.477 182 −0.011 0.290 −0.009 0.012* −0.009 0.575 KLRC3 − −0.067 0.385 0.050 0.490 0.020 0.357 65 −0.133 0.302 0.052 0.357 0.039 0.309 99 −0.122 0.452 0.070 0.273 0.036 0.475 122 −0.090 0.401 0.068 0.443 0.064 0.630 133 −0.115 0.365 0.070 0.382 0.025 0.467 162 −0.058 0.364 0.051 0.659 0.007 0.481 174 −0.042 0.948 0.023 0.710 −0.011 0.286 178 −0.059 0.902 0.013 0.316 −0.019 0.128 SH2D1B − −0.021 0.599 −0.023 0.001* 0.024 0.684 81 −0.021 0.599 −0.023 0.001* 0.024 0.684 Note. Group.diff, the methylation level of case-the methylation level of control; *P < 0.05, **P < 0.001, t test.
下载: 导出CSV
S9. DNA methylation levels of candidate genes and CpG sites between AIT and control groups stratifying by UIC
Gene Site < 100 μg/L 100−199 μg/L 200−299 μg/L > 300 μg/L Group.diff P Group.diff P Group.diff P Group.diff P KLRC1 − −0.009 0.189 −0.015 0.127 −0.015 0.149 −0.016 < 0.001** 28 −0.003 0.331 −0.016 0.136 −0.007 0.038* −0.009 0.015* 97 −0.009 0.049* −0.011 0.504 −0.004 0.923 −0.008 0.489 138 −0.007 0.068 −0.007 0.939 −0.005 0.598 −0.009 0.001* 142 −0.016 0.012* −0.023 0.005* −0.035 0.011* −0.033 0.002* 144 −0.025 0.022* −0.025 0.020* −0.036 0.009* −0.034 0.001* 154 −0.004 0.638 −0.009 0.471 −0.009 0.082 −0.010 0.001* 182 −0.003 0.486 −0.011 0.740 −0.007 0.043* −0.008 0.059 KLRC3 − −0.060 0.737 0.058 0.304 0.057 0.354 0.061 0.570 65 −0.079 0.615 0.069 0.199 0.057 0.099 0.064 0.996 99 −0.093 0.824 0.083 0.210 0.068 0.104 0.088 0.991 122 −0.083 0.586 0.081 0.267 0.073 0.033* 0.085 0.714 133 −0.080 0.538 0.088 0.200 0.074 0.054 0.082 0.745 162 −0.040 0.728 0.049 0.310 0.066 0.013* 0.058 0.103 174 −0.025 0.821 0.027 0.967 0.044 0.001* 0.028 0.420 178 −0.019 0.439 0.011 0.370 0.018 0.248 0.018 0.093 SH2D1B − 0.036 0.767 0.009 0.501 −0.037 0.008* −0.040 0.021* 81 0.036 0.767 0.009 0.501 −0.037 0.008* −0.040 0.021* Note. Group.diff, the methylation level of case-the methylation level of control; *P < 0.05, **P < 0.001, t test.
下载: 导出CSV
S10. DNA methylation levels of candidate genes and related CpG sites among cases in three areas
Gene Site IFA IAA IEA P KLRC1 − 0.896 ± 0.025 0.886 ± 0.022 0.889 ± 0.029 0.081 28 0.895 ± 0.028 0.888 ± 0.029 0.892 ± 0.032 0.951 97 0.740 ± 0.050 0.732 ± 0.054 0.745 ± 0.054 0.522 138 0.934 ± 0.046 0.938 ± 0.018 0.933 ± 0.025 0.814 142 0.900 ± 0.048a 0.879 ± 0.044 0.879 ± 0.049 0.022* 144 0.901 ± 0.045a 0.879 ± 0.040 0.884 ± 0.047 0.017* 154 0.954 ± 0.018a 0.945 ± 0.016 0.943 ± 0.022 0.002* 182 0.950 ± 0.018 0.944 ± 0.015 0.944 ± 0.018 0.125 KLRC3 − 0.653 ± 0.207 0.639 ± 0.232 0.684 ± 0.190 0.573 65 0.616 ± 0.230 0.596 ± 0.263 0.693 ± 0.211 0.510 99 0.539 ± 0.282 0.520 ± 0.313 0.578 ± 0.258 0.602 122 0.573 ± 0.263 0.555 ± 0.291 0.619 ± 0.232 0.480 133 0.550 ± 0.278 0.536 ± 0.314 0.593 ± 0.254 0.590 162 0.670 ± 0.204 0.657 ± 0.224 0.700 ± 0.187 0.577 174 0.801 ± 0.113 0.792 ± 0.132 0.812 ± 0.114 0.739 178 0.821 ± 0.096 0.817 ± 0.109 0.832 ± 0.097 0.752 SH2D1B − 0.155 ± 0.191 0.197 ± 0.171 0.194 ± 0.206 0.278 81 0.155 ± 0.191 0.197 ± 0.171 0.194 ± 0.206 0.278 Note. Group.diff, the methylation level of case-the methylation level of control; a Significant differences compared to IFA; *Significant differences among three groups; P<0.05.
下载: 导出CSV
-
[1] Pyzik A, Grywalska E, Matyjaszek-Matuszek B, et al. Immune disorders in Hashimoto's thyroiditis: what do we know so far? J Immunol Res, 2015; 2015, 979167. [2] Antonelli A, Ferrari SM, Corrado A, et al. Autoimmune thyroid disorders. Autoimmun Rev, 2015; 14, 174−80. doi: 10.1016/j.autrev.2014.10.016 [3] Bulow Pedersen I, Knudsen N, Jørgensen T, et al. Large differences in incidences of overt hyper- and hypothyroidism associated with a small difference in iodine intake: a prospective comparative register-based population survey. J Clin Endocrinol Metab, 2002; 87, 4462−9. doi: 10.1210/jc.2002-020750 [4] Ragusa F, Fallahi P, Elia G, et al. Hashimotos' thyroiditis: epidemiology, pathogenesis, clinic and therapy. Best Pract Res Clin Endocrinol Metab, 2019; 33, 101367. doi: 10.1016/j.beem.2019.101367 [5] Zama SY, Ahmed M, Vadiraja N. Prevalence of Goitre in school children of chamarajanagar district, Karnataka, India. J Clin Diagn Res, 2013; 7, 2807-9. [6] Mitka M. Even mild iodine deficiency during gestation may impair brain function in children. JAMA, 2013; 309, 2428. [7] Liu LX, Wang DD, Liu P, et al. The relationship between iodine nutrition and thyroid disease in lactating women with different iodine intakes. Br J Nutr, 2015; 114, 1487−95. doi: 10.1017/S0007114515003128 [8] Du Y, Gao YH, Meng FG, et al. Iodine deficiency and excess coexist in China and induce thyroid dysfunction and disease: a cross-sectional study. PLoS One, 2014; 9, e111937. doi: 10.1371/journal.pone.0111937 [9] Teng WP, Shan ZY, Teng XC, et al. Effect of iodine intake on thyroid diseases in China. N Engl J Med, 2006; 354, 2783−93. doi: 10.1056/NEJMoa054022 [10] Palaniappan S, Shanmughavelu L, Prasad HK, et al. Improving iodine nutritional status and increasing prevalence of autoimmune thyroiditis in children. Indian J Endocrinol Metab, 2017; 21, 85−9. doi: 10.4103/2230-8210.195996 [11] Ajjan RA, Weetman AP. The pathogenesis of Hashimoto's thyroiditis: further developments in our understanding. Horm Metab Res, 2015; 47, 702−10. doi: 10.1055/s-0035-1548832 [12] Gianchecchi E, Delfino DV, Fierabracci A. NK cells in autoimmune diseases: linking innate and adaptive immune responses. Autoimmun Rev, 2018; 17, 142−54. doi: 10.1016/j.autrev.2017.11.018 [13] Zhang C, Tian ZG. NK cell subsets in autoimmune diseases. J Autoimmun, 2017; 83, 22−30. doi: 10.1016/j.jaut.2017.02.005 [14] Jie HB, Sarvetnick N. The role of NK cells and NK cell receptors in autoimmune disease. Autoimmunity, 2004; 37, 147−53. doi: 10.1080/0891693042000196174 [15] Wenzel BE, Chow A, Baur R, et al. Natural killer cell activity in patients with Graves' disease and Hashimoto's thyroiditis. Thyroid, 1998; 8, 1019−22. doi: 10.1089/thy.1998.8.1019 [16] Solerte SB, Precerutti S, Gazzaruso C, et al. Defect of a subpopulation of natural killer immune cells in Graves' disease and Hashimoto's thyroiditis: normalizing effect of dehydroepiandrosterone sulfate. Eur J Endocrinol, 2005; 152, 703−12. doi: 10.1530/eje.1.01906 [17] Wang B, Shao XQ, Song RH, et al. The emerging role of epigenetics in autoimmune thyroid diseases. Front Immunol, 2017; 8, 396. [18] Mazzone R, Zwergel C, Artico M, et al. The emerging role of epigenetics in human autoimmune disorders. Clin Epigenetics, 2019; 11, 34. doi: 10.1186/s13148-019-0632-2 [19] Hewagama A, Richardson B. The genetics and epigenetics of autoimmune diseases. J Autoimmun, 2009; 33, 3−11. doi: 10.1016/j.jaut.2009.03.007 [20] Cai TT, Muhali FS, Song RH, et al. Genome-wide DNA methylation analysis in Graves' disease. Genomics, 2015; 105, 204−10. doi: 10.1016/j.ygeno.2015.01.001 [21] Kim YI. Nutritional epigenetics: impact of folate deficiency on DNA methylation and colon cancer susceptibility. J Nutr, 2005; 135, 2703−9. doi: 10.1093/jn/135.11.2703 [22] Cao JX, Zhang HP, Du LX. Influence of environmental factors on DNA methylation. Hereditas, 2013; 35, 839−46. (In Chinese) [23] Kwabi-Addo B, Chung W, Shen LL, et al. Age-related DNA methylation changes in normal human prostate tissues. Clin Cancer Res, 2007; 13, 3796−802. doi: 10.1158/1078-0432.CCR-07-0085 [24] Kang GH, Lee S, Kim JS, et al. Profile of aberrant CpG island methylation along the multistep pathway of gastric carcinogenesis. Lab Invest, 2003; 83, 635−41. doi: 10.1097/01.LAB.0000067481.08984.3F [25] Liu TT, Sun J, Wang ZJ, et al. Changes in the DNA methylation and hydroxymethylation status of the intercellular adhesion molecule 1 gene promoter in Thyrocytes from autoimmune thyroiditis patients. Thyroid, 2017; 27, 838−45. doi: 10.1089/thy.2016.0576 [26] Shen HM, Liu P, Jia QZ, et al. Definition and demarcation of iodine deficient areas and iodine adequate areas (WS/T 669-2020). Beijing: Standards Press of China, 2020. (In Chinese) [27] Jia QZ, Zhang XD, Shen HM, et al. Definition and demarcation of water-borne iodine-excess areas and iodine-excess endemial areas (GB/T 19380-2016). Beijing: Standards Press of China, 2016. (In Chinese) [28] Wan SY, Qu MY, Wu HY, et al. Autoimmune thyroid diseases after 25 years of universal salt iodisation: an epidemiological study of Chinese adults in areas with different water iodine levels. Br J Nutr, 2020; 124, 853−64. doi: 10.1017/S0007114520001786 [29] Zhang YP, Yan YQ, Liu LJ, et al. Determination of iodine in urine—Part 1: As3+-Ce4+ catalytic spectrophotometry (WS/T 107.1-2016). Beijing: Standards Press of China, 2016. (In Chinese) [30] Zhang YP, Li WD, Huang SY, et al. Determination of iodine in serum-inductively coupled plasma mass spectrometry (WS/T 783-2021). Beijing: Standards Press of China, 2021. (In Chinese) [31] Zhang C, Wang XM, Li SR, et al. NKG2A is a NK cell exhaustion checkpoint for HCV persistence. Nat Commun, 2019; 10, 1507. doi: 10.1038/s41467-019-09212-y [32] Jones PA. Functions of DNA methylation: islands, start sites, gene bodies and beyond. Nat Rev Genet, 2012; 13, 484−92. doi: 10.1038/nrg3230 [33] Ortega-Rodríguez AC, Martínez-Hernández R, Monsiváis-Urenda A, et al. Quantitative and functional analysis of PD-1+ NK cells in patients with autoimmune thyroid disease. J Clin Endocrinol Metab, 2020; 105, dgaa569. doi: 10.1210/clinem/dgz084 [34] Orbelyan GA, Tang FM, Sally B, et al. Human NKG2E is expressed and forms an intracytoplasmic complex with CD94 and DAP12. J Immunol, 2014; 193, 610−6. doi: 10.4049/jimmunol.1400556 [35] Smith J, Sen S, Weeks RJ, et al. Promoter DNA Hypermethylation and paradoxical gene activation. Trends Cancer, 2020; 6, 392−406. doi: 10.1016/j.trecan.2020.02.007 [36] Haberle V, Stark A. Eukaryotic core promoters and the functional basis of transcription initiation. Nat Rev Mol Cell Biol, 2018; 19, 621−37. doi: 10.1038/s41580-018-0028-8 [37] Vecellio M, Wu HJ, Lu QJ, et al. The multifaceted functional role of DNA methylation in immune-mediated rheumatic diseases. Clin Rheumatol, 2021; 40, 459−76. doi: 10.1007/s10067-020-05255-5 [38] Taha M, Nezerwa E, Nam HJ. The X-ray crystallographic structure of human EAT2 (SH2D1B). Protein Pept Lett, 2016; 23, 862−6. doi: 10.2174/0929866523666160831162239 [39] Aldhamen YA, Appledorn DM, Seregin SS, et al. Expression of the SLAM family of receptors adapter EAT-2 as a novel strategy for enhancing beneficial immune responses to vaccine antigens. J Immunol, 2011; 186, 722−32. doi: 10.4049/jimmunol.1002105 [40] Roncagalli R, Taylor JER, Zhang SH, et al. Negative regulation of natural killer cell function by EAT-2, a SAP-related adaptor. Nat Immunol, 2005; 6, 1002−10. doi: 10.1038/ni1242 [41] Klein SL, Flanagan KL. Sex differences in immune responses. Nat Rev Immunol, 2016; 16, 626−38. doi: 10.1038/nri.2016.90 [42] Dong YH, Fu DG. Autoimmune thyroid disease: mechanism, genetics and current knowledge. Eur Rev Med Pharmacol Sci, 2014; 18, 3611−8. [43] Ma RQ, Yan MQ, Han P, et al. Deficiency and excess of groundwater iodine and their health associations. Nat Commun, 2022; 13, 7354. doi: 10.1038/s41467-022-35042-6 [44] Zois C, Stavrou I, Kalogera C, et al. High prevalence of autoimmune thyroiditis in schoolchildren after elimination of iodine deficiency in northwestern Greece. Thyroid, 2003; 13, 485−9. doi: 10.1089/105072503322021151 -
 23420+Supplementary Materials.pdf

-

 点击查看大图
计量
- 文章访问数: 1063
- HTML全文浏览量: 462
- PDF下载量: 57
- 被引次数: 0

 Quick Links