

 下载:
下载:


-
The testes are highly radiosensitive[1-3]. Ionizing radiation (IR) is a common cause of male infertility by impairing spermatogenesis and causing excessive apoptosis of spermatogonia[4]. The use of IR in radiotherapy for the treatment of cancer usually causes temporary or permanent infertility of males, which is an important issue especially among young people[5]. However, with the increasing use of radiotherapy, potential male infertility cannot be ignored.
The regulatory mechanism underlying apoptosis of spermatogonia has not yet been elucidated. Although p53-dependent apoptosis can eliminate excessive spermatogonia, but increased expression of p53 causes excessive apoptosis of spermatogonia, leading to decreased numbers of sperm[6]. Therefore, it is necessary to precisely regulate p53 activity, which plays an important role in maintaining spermatogenesis.
Deregulation of ribosomal biogenesis leads to the leakage of some key RPs to the nucleoplasm, which induces the cell cycle arrest and apoptosis[7,8]. The primary role of this process, which is initiated in the nucleolus, thus, is referred to nucleolar stress or ribosomal stress, is to activate p53[9]. Some ribosomal proteins (RPs), including RPL3[10], RPL13[11], RPL23[12], RPL34[13], and RPS14[14], regulate mouse double minute 2 homolog (MDM2)-p53 pathway. However, p53 is also regulated by interactions among RPs via MDM2[15]. RPL11, which is an important effector of nucleolar stress, remains stable in the nucleoplasm by forming a complex with RPL5 and 5S rRNA, while other RPs interact with RPL5 or RPL11 and form the RPs-RPL5/RPL11 complex[16]. Therefore, it is necessary to clarify the mechanism underlying RPs-RPL5/RPL11 interactions that participate in spermatogonia apoptosis induced by IR.
In previous study, the differential RPs and ribosomal mRNA in response to heavy ion radiation (HIR) were identified in mouse testes [17]. RPL23 and RPL23a are members of the ribosomal L23P family[18] and were downregulated at the protein and mRNA levels, respectively, in the testis of mice in response to HIR. In the present study, the potential relationship between RPL23a expression and spermatogonia apoptosis in response to IR was investigated, which provides insight to environmental and clinical risks following exposure to IR in male fertility.
-
The protocol of experimental animals was approved by the Ethics Committee and Institutional Animal Care and Use Committee. 36 healthy male mice (C57BL/6, 5-week-old; body weight, 16–18 g) were purchased from the Lanzhou Veterinary Research Institute, Chinese Academy of Agricultural Sciences (Lanzhou, China) and adaptively fed for one week before experimentation. The mice were housed in cages (n = 3/cage) according to the previous condition[19], randomly and equally assigned to the control group and irradiated group.
Animals were enterocoelia irradiated with X‐rays performed at the Medical Electron Linear Accelerator (EDGE, Varian, CA, USA) of the Gansu Provincial Hospital with A 6MV flattening filter (FF) beam (LET = 8 GeV/µm, dose rate 6 Gy/min) at a dose of 4 Gy under the same irradiation conditions, the testes were separated at 6, 12, and 24 h for analyzing after irradiation[20].
-
The GC-1 cells derived from mouse spermatogonia (no. BNCC338398) (BeNa, Culture Collection, Beijing, China) were cultured in the complete DMEM high-glucose medium (with 10% fetal bovine serum, Hyclone, MA, USA) under controlled conditions (37 °C, 5% CO2). GC-1 cells were irradiated with X‐rays performed at the X‐ray apparatus (precision, X-RAD 225, CT, USA) of the Institute of Modern Physics, Chinese Academy of Sciences with 225 KV (dose rate 150 mGy/min).
-
The proteins of testes and GC-1 cells were extracted with lysis buffer (Solarbio science & technology, Beijing, China), and the protein quantitation was detected by the bicinchoninic acid assay (Solarbio). Forty µg of proteins were separated by 10% and 12% (w/v) polyacrylamide gels, and transferred to polyvinylidene difluoride membranes, then the membranes were blocked in 5% nonfat milk (in TBST) and incubated with primary antibodies (Abs) diluted to 1:1,000 in TBS against β-actin (ab8227), p21 (ab109199) and RPL23a (ab223089) (Abcam, Cambridge, UK), MDM2 (GTX100531) and p53 (GTX70214) (GeneTex, TX, USA) at 4 °C overnight. Afterward, the membranes were incubated with a secondary Ab labeled with horseradish peroxidase (ZB2301; Beijing Zhongshan Jinqiao Biotechnology, Beijing, China) for 1 h at room temperature (RT). Protein bands were detected with a horseradish peroxidase substrate kit and a FluorChem 2 imaging system (Alpha Innotech Corporation, San Leandro, CA, USA) was used to capture images and analyze the band intensities.
-
The TUNEL kit (Beyotime Biotechnology, Shanghai, China) was used to detect the apoptotic spermatogonia after IR in vivo. The testicular tissues were dehydrated with gradient alcohol, fixed with dimethylbenzene, and embedded in paraffin. The embedded testicular tissues were cut into sections at a thickness of 4 µm, which were permeabilized with proteinase K at 37 °C for 15 min, and then dropwise added the reaction mixture for 2 h at RT. After the reaction, the sections were washed and then stained with 5 μg/mL of 4, 6-diamidino-2-phenylindole (DAPI; solarbio) for 10 min[21]. At last, the sections were sealed with glycerin and scanned, then analyzed by Panoramic MIDI software (3DHISTECH, Budapest, Hungary).
The sections and GC-1 cells were permeabilized with 0.5% Triton X-100 in phosphate-buffered saline (PBS) at RT for 15 min, and blocked at RT for 30 min (5% bovine serum albumin in PBS), then incubated with the primary Abs against RPL23a, p53, MDM2, RPL11 and Nucleolin (dilution, 1:500 in PBS) at 4 °C overnight. The sections were incubated with a secondary Alexa Fluor 555 Ab (bs-0295G-AF555; BoAoSeng Company, Beijing, China) for 1 h at 37 °C. Afterward, the sections and cells were washed three times with TBS for 10 min each time and then stained with 5 μg/mL DAPI for 10 min. Finally, the sections with were sealed with glycerin, then observed under a biomicroscope (BX53, Olympus, Tokyo, Japan) or a confocal laser microscope (LSM, Carl Zeiss AG, Germany)[22]. Image-J 1.46 system (Media Cybernetics Inc., Bethesda, MD, USA) was used for the semi-quantitative evaluation. Average optical density per area (AOD) (Integral optical density/Area) was applied to indicate the level of corresponding protein expression.
-
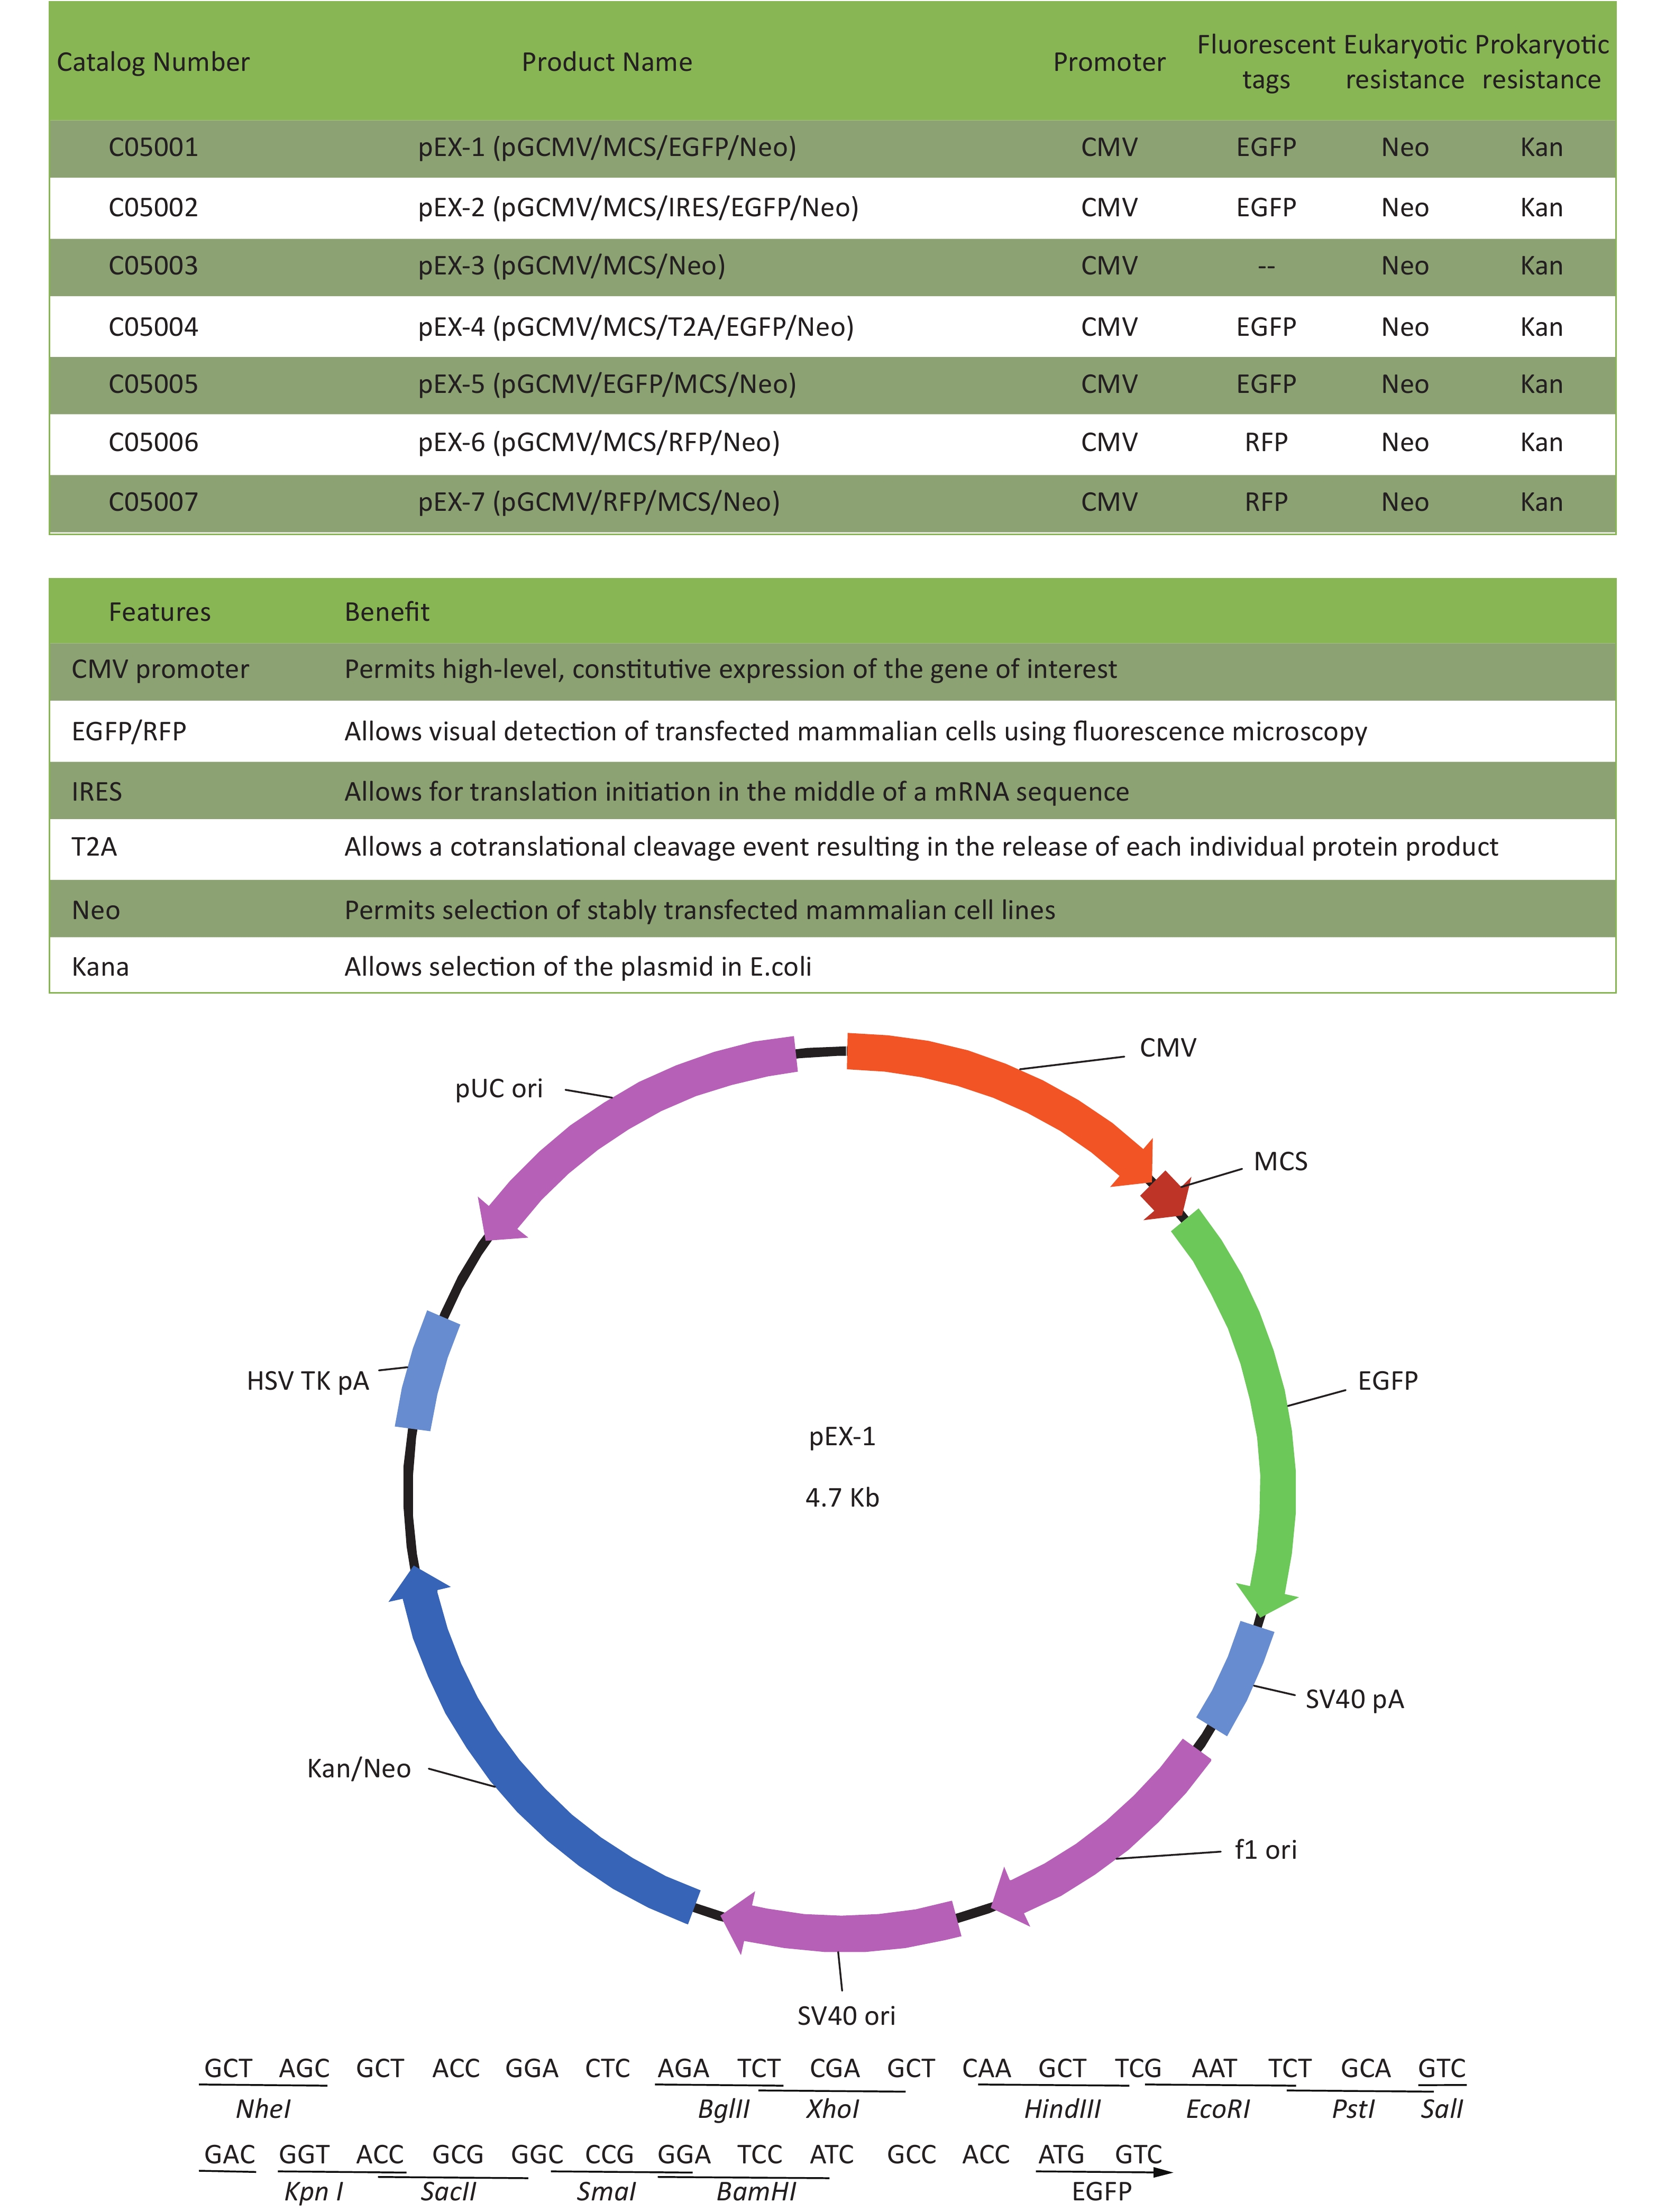
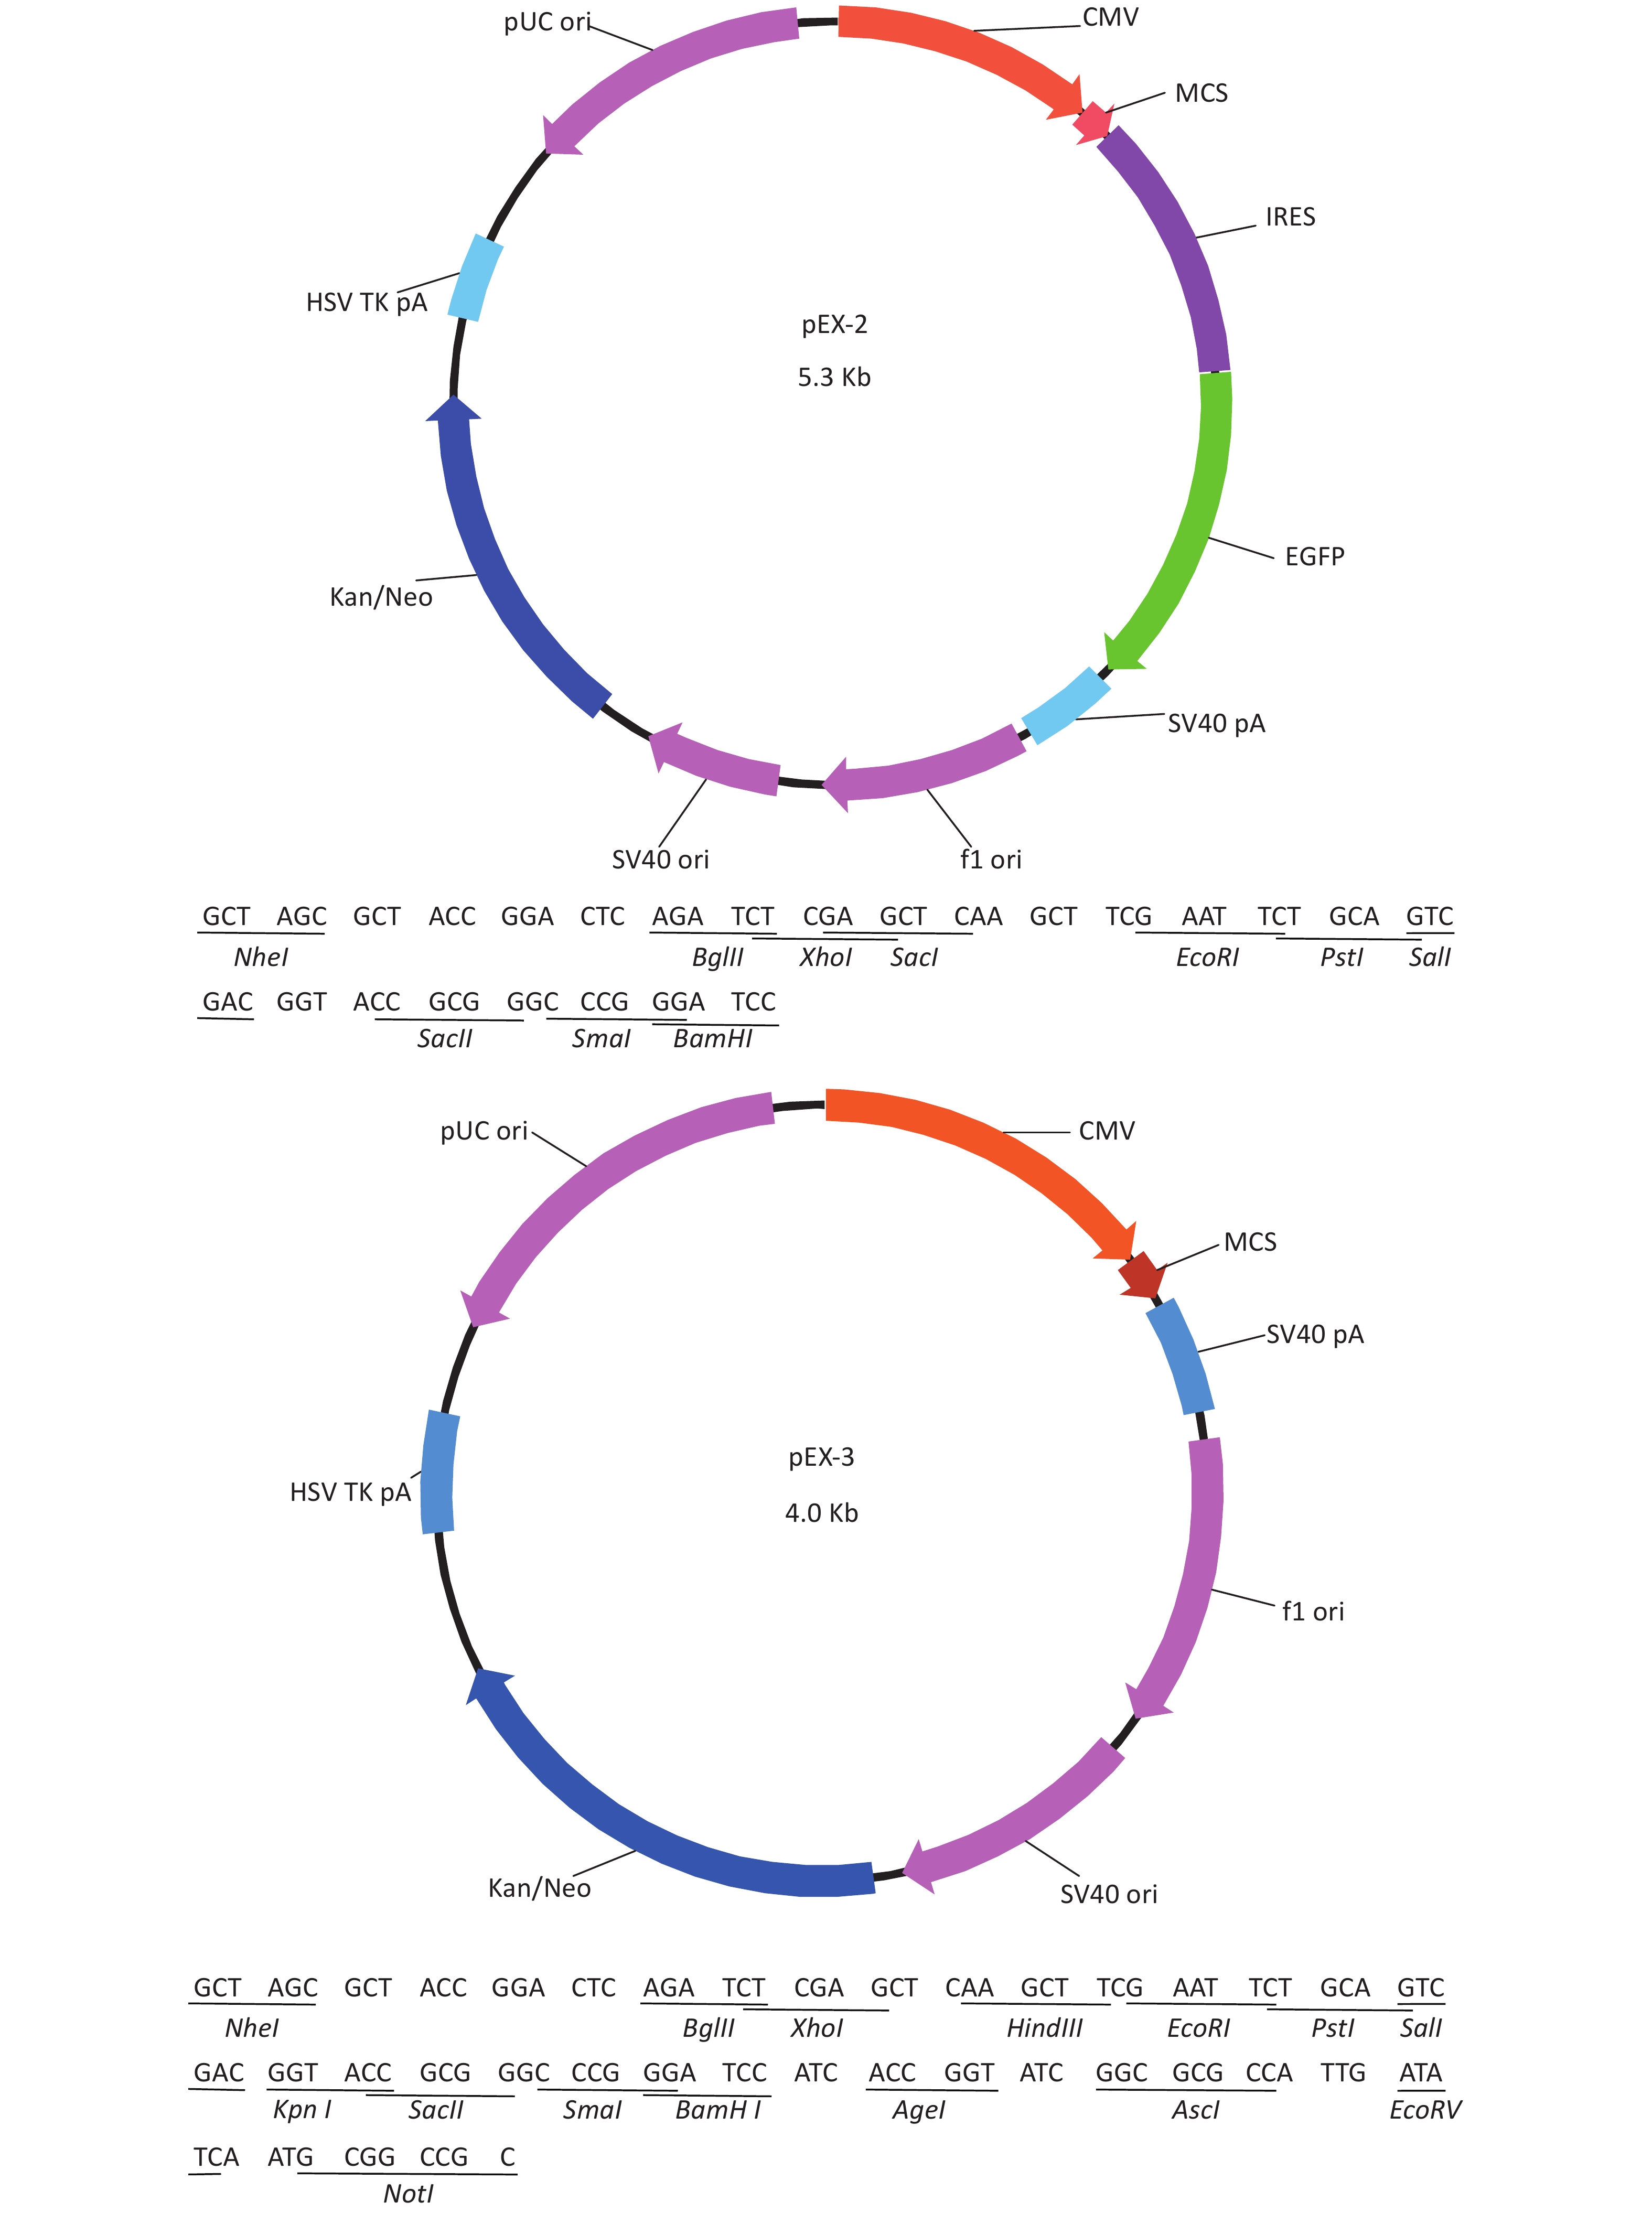
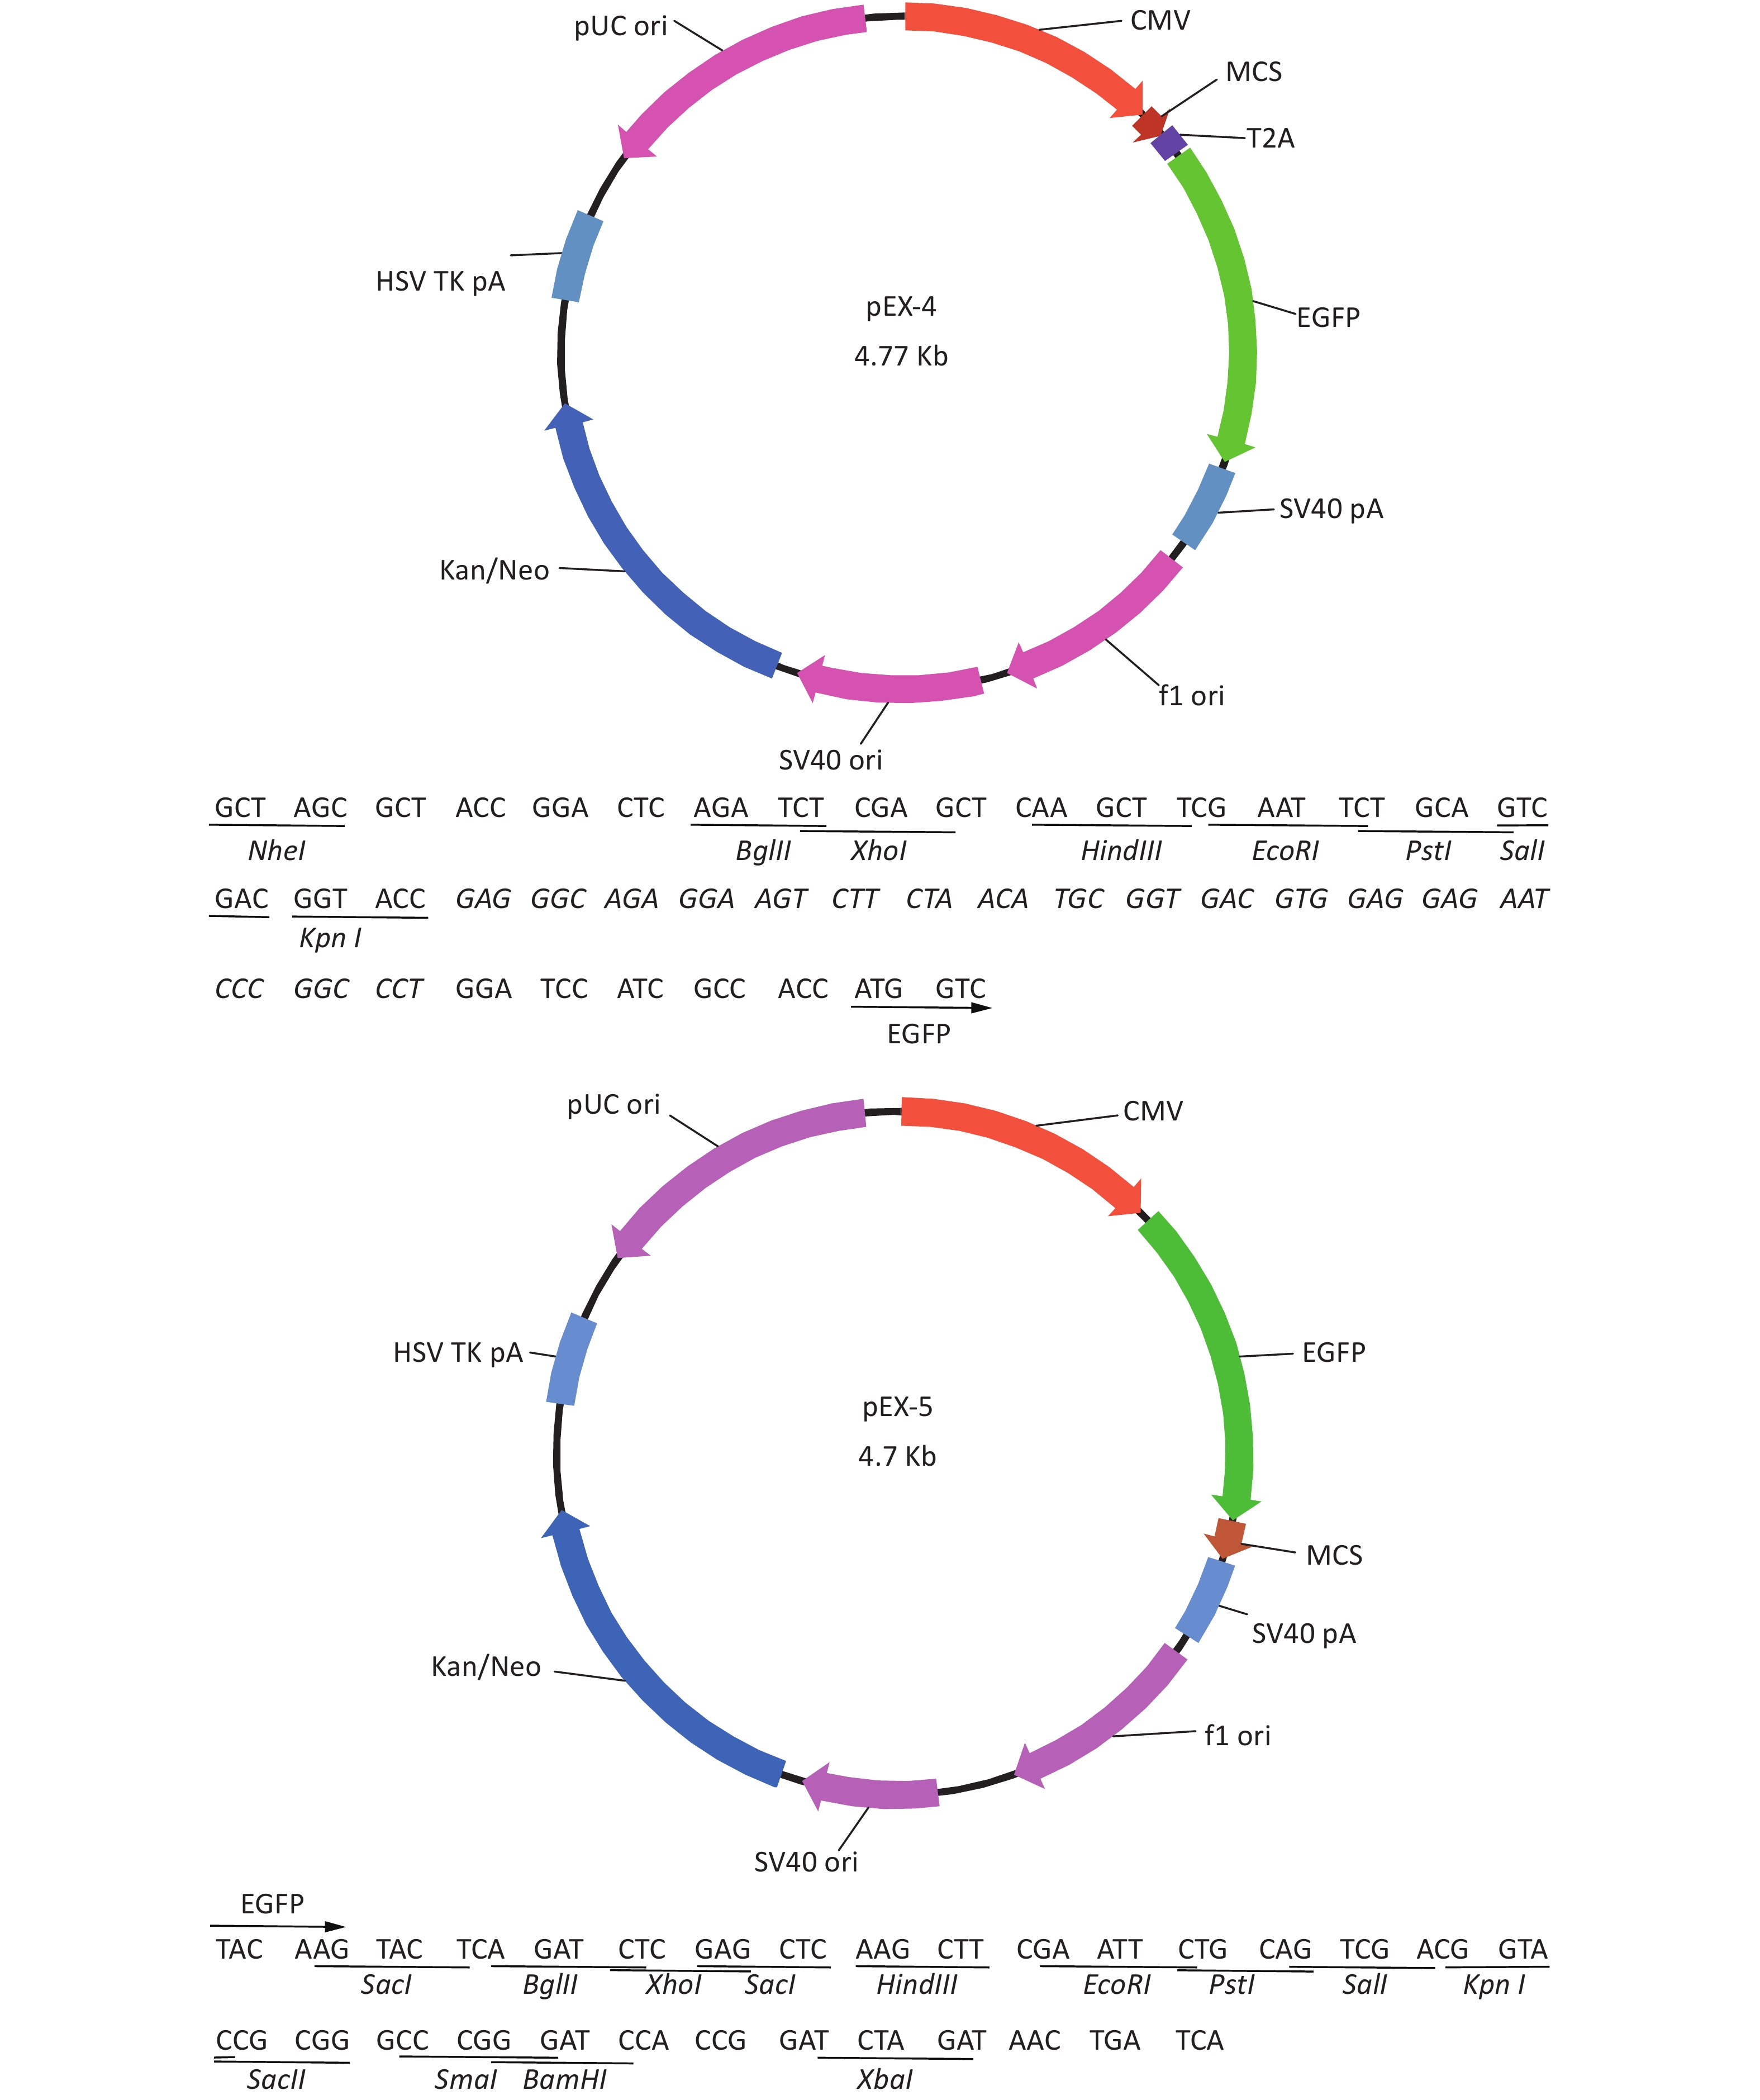
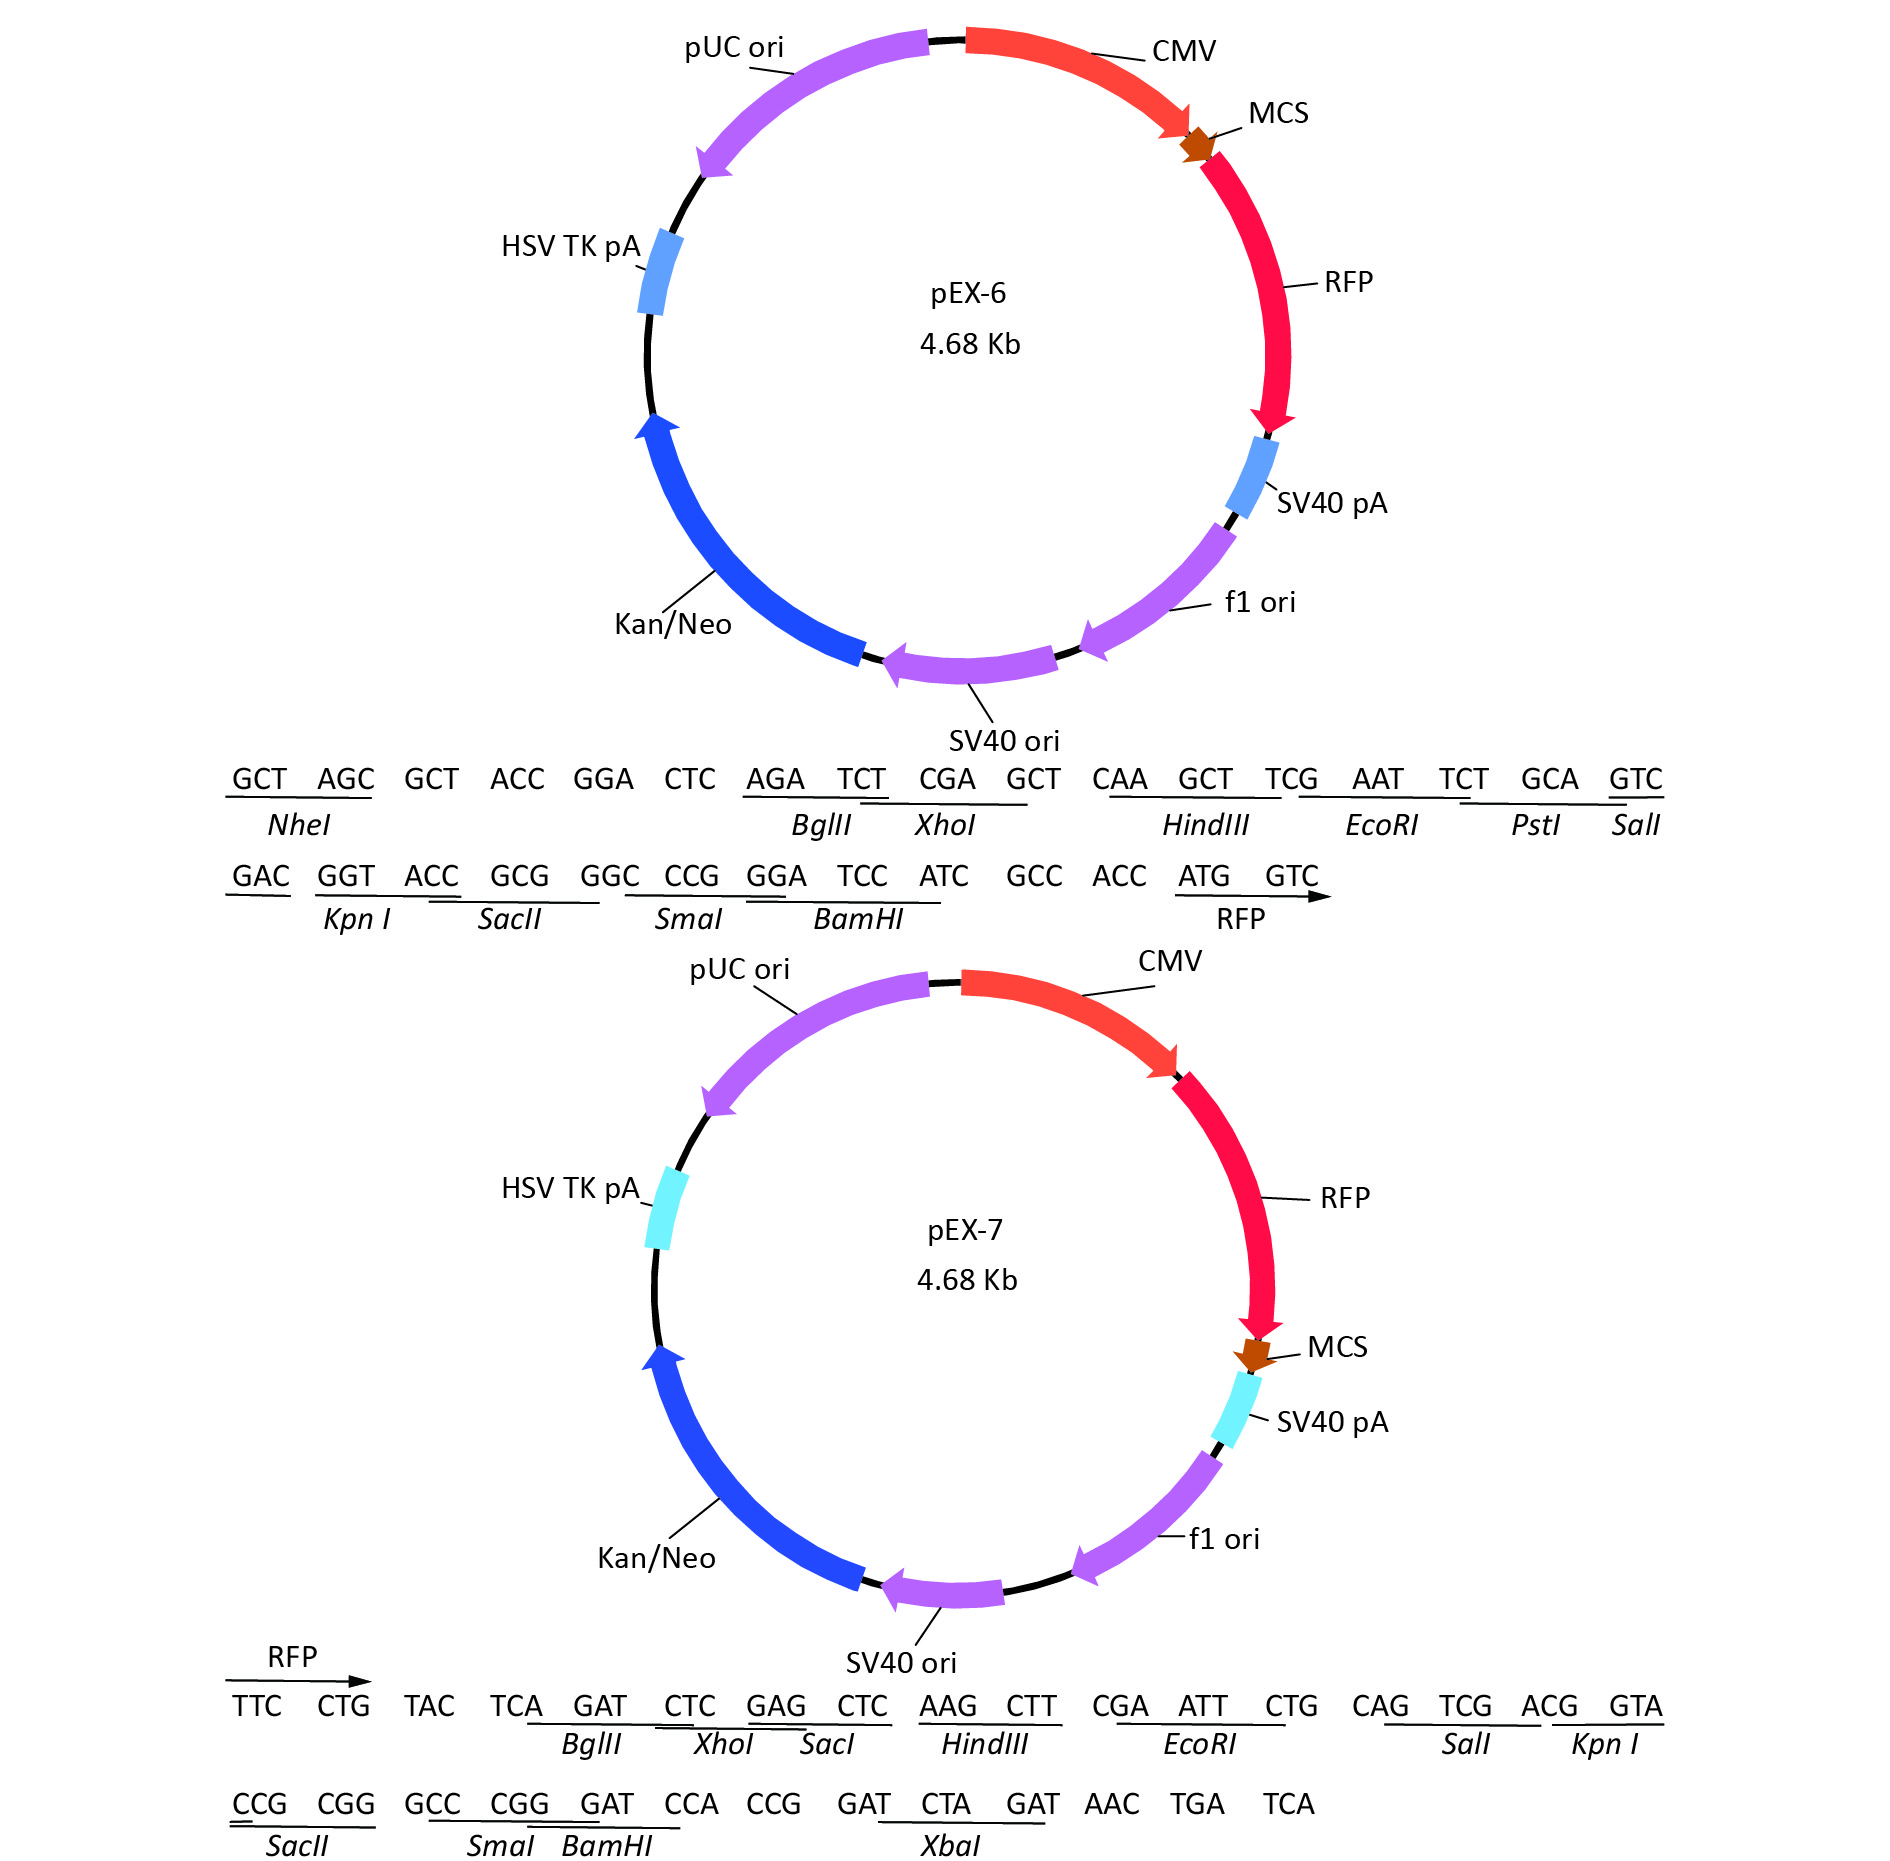
Total RNA of GC-1 cells was isolated using TRIzol Reagent (Invitrogen, Carlsbad, CA, USA). Polymerase chain reaction (PCR) was performed using the SYBR green dye on the StepOnePlusTM RealTime PCR System (Applied Biosystems). The primers of p53, MDM2 and p21 were shown in Supplementary File 1[23] (available in www.besjournal.com). The sequence of the RPL23a siRNAs was shown in Supplementary File 2 (available in www.besjournal.com) and synthesized by Genepharma (Shanghai, China), and the efficiency of knockdown was shown in Supplementary File 3 (available in www.besjournal.com). The overexpression plasmid was shown in Supplementary File 4 (available in www.besjournal.com).
Table 1. The sequences of primers. Supplementary
Name Primer Sequence (5'-3') Size (bp) β-actin Forward CACGATGGAGGGGCCGGACTCATC 240 Reverse TAAAGACCTCTATGCCAACACAGT RPL23a Forward TGCTATCATCAAATTCCCAC 192 Reverse ACATACGCCTTCTTCTCTCC p53 Forward GGACAGCTTTGAGGTTCGTG 237 Reverse TCATTCAGCTCCCGGAACAT MDM2 Forward CGGTGGAACTTTGACTTCGT 212 Reverse AGAGTGCAAGACAGCGACAA P21 Forward CTTCGTGAGAACTGGCTTCC 225 Reverse CGATGGTTGGGAATAGTCGT Table 2. The sequences of RPL11 using three different siRNAs
Gene Sequence Sense (5'-3') Antisense (5'-3') Rpl23a-mus-47 GCCGAAAGCGAAGAAGGAATT UUCCUUCUUCGCUUUCGGCTT Rpl23a-mus-352 CCAAUAAGCAUCAGAUCAATT UUGAUCUGAUGCUUAUUGGTT Rpl23a-mus-455 UCGCUUGGCUCCUGAUUAUTT AUAAUCAGGAGCCAAGCGATT 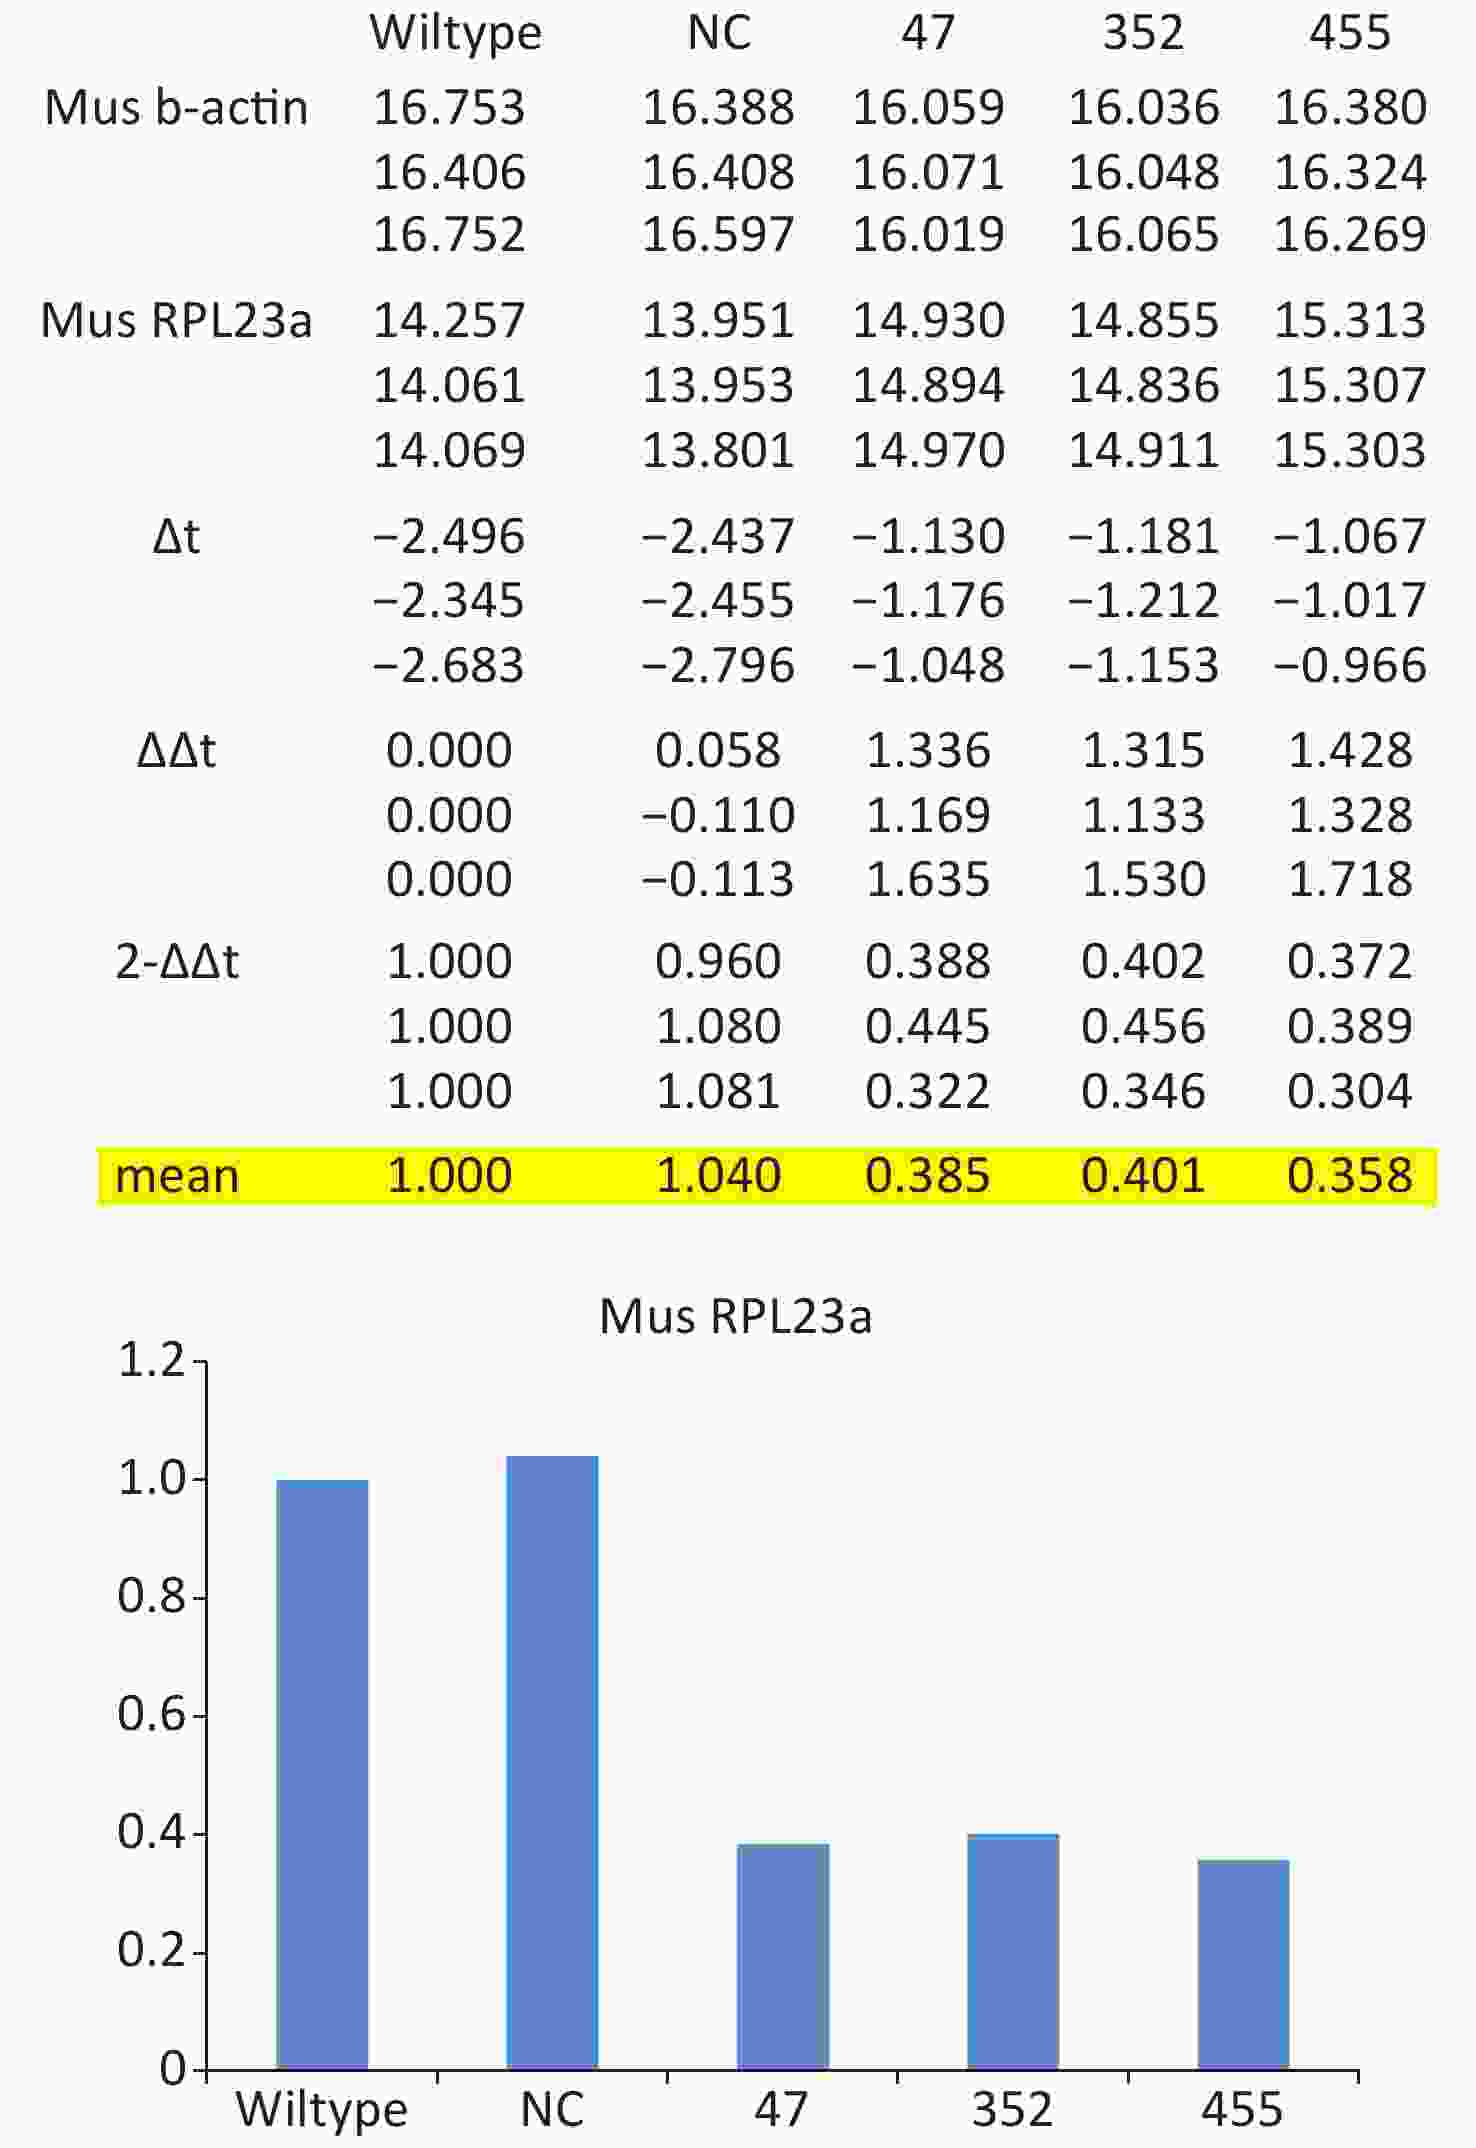
Figure S2. The efficiency of knockdown of the RPL23a siRNAs.
-
GC-1 cells were transfected for 48 h, washed with PBS and harvested with lysis buffer (Solarbio), and homogenized on ice. After centrifugation at 10,000 rpm/ 10 min at 4 °C, the supernatant was divided as an input control for Western blot analysis. Briefly, 500 μg of protein was diluted in pre-cooled PBS (final volume, 500 μL), mixed with agarose protein A+G beads, washed twice with pre-cooled PBS, centrifuged at 3,000 rpm/ 5 min at 4 °C, and then formulated into a 50% concentration with pre-cooled PBS. The agarose protein A+G beads were divided into two portions, one for removing non-specific binding and one for binding to Abs. As a pre-treatment step, the sample and 30 µL of agarose A+G beads were added to individual tubes, which were then slowly shaken for 2 h at 4 °C to eliminate non-specific binding. The samples were centrifuged at 3,000 rpm/ 5 min at 4 °C to remove the protein A+G beads. Then, 5 μL of Ab RPL11 was added to 500 μL of total protein to react with the target protein (no Ab in the control group). The antigen-Ab mixture was slowly shaken overnight at 4 °C. The next day, 30 μL of 50% agarose protein A+G (30 μL/tube) were added and the reaction was carried out for 3–6 h at 4 °C. Afterward, the reaction mixture was centrifuged at 3,000 rpm/ 5 min at 4 °C. Then, the supernatant was discarded and the precipitate was washed three times with 800–1,000 μL of pre-cooled PBS. Next, the pellet was resuspended in loading buffer, boiled in water for 5 min, and then immediately placed on ice. After cooling to RT, the sample was centrifuged at 12,000 rpm/ 10 min at 4 °C for and collected the supernate for western blot analysis[24].
-
GC-1 cells were digested with 0.25% trypsin (Hyclone), washed with cooled PBS and fixed in 70% ethanol, then stained with 50 μg/mL propidium iodide (PI) and 50 μg/mL RNase A (Meilune Biotechnology, Dalian, China) for 30 min at RT[25]. GC-1 cells were digested and washed with cooled PBS, resuspended in 500 μL buffer and then stained with 5 μL Annexin V and 1 μL propidium iodide (PI) in dark for 15 min at RT[26]. The flowsight imaging flow cytometer (Amnis/Merck Millipore, Darmstadt, Germany) was used to collect data and analyze the apoptotic ratio, the modFit software program (Verity Software House, Topsham, ME, USA) was used to analyze cell cycle.
-
Prism 8 software (GraphPad Software, CA, USA) was used to analyze the data. Statistical differences were analyzed based on the Student's t test and on one-way analysis of variance test. P value of < 0.05 was represented statistically significant.
-
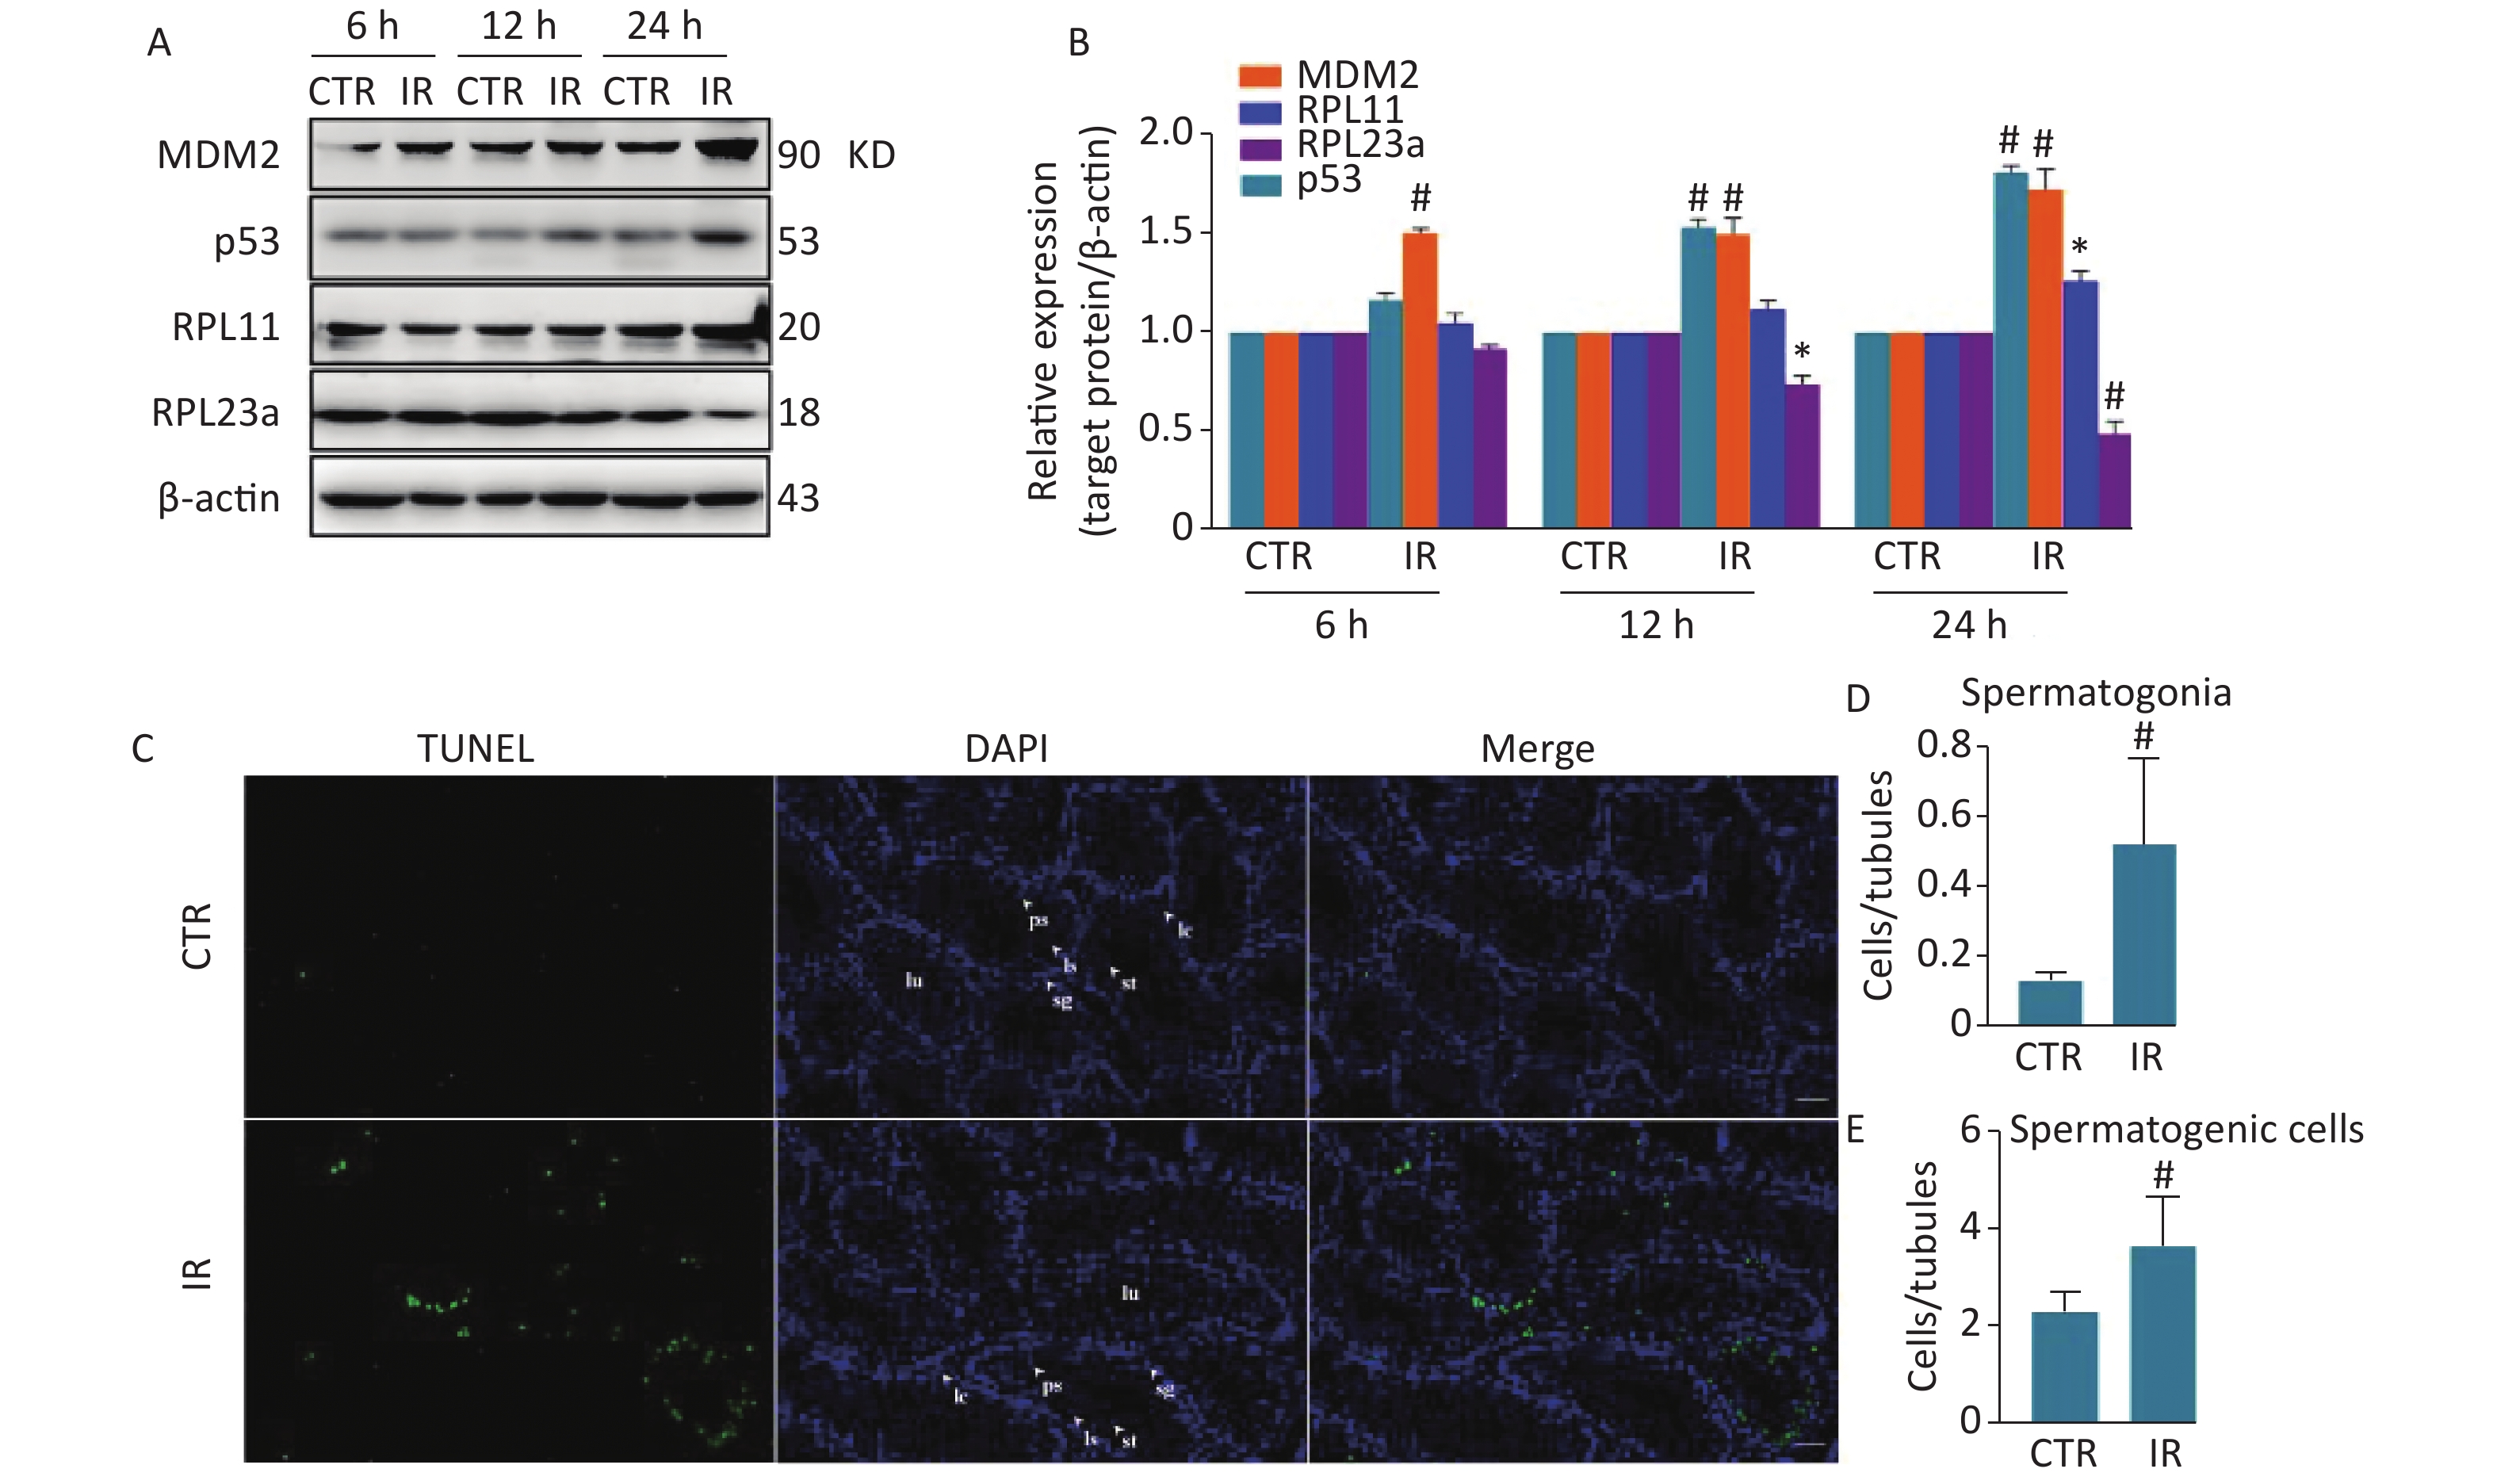
Comparative proteomics analysis showed that RPL23a expression was downregulated in mouse testes at 12 h after HIR[17]. RPL11 is an important ribosomal stress effector[14]. Some RPs activate p53 through the binding of RPL11 and forming a complex, which binds MDM2 to inhibit its E3 ligase activity to increase the stability and transcriptional activity of p53, thereby inducing apoptosis[16]. The results of previous study found that HIR can activate ribosomal stress and induce spermatogonia apoptosis, in a process related to changes in RPs expression levels. Therefore, these relationships were explored by immunoblotting analysis of the expression levels of RPL23a, RPL11, MDM2, and p53 in testes at 6, 12, and 24 h after IR (Figure 1A). Mice were irradiated with IR at 4 Gy to mimic the high dose received from radiotherapy[27]. The expression of these four proteins was time-dependent. RPL11 expression was only significant at 24 h (P < 0.001) (Figure 1B), while changes to the expression levels of p53 and RPL23a were significant at 12 (RPL23a, P < 0.05; p53, P < 0.001) and 24 h (P < 0.001) (Figure 1B). However, MDM2 expression was significant at all time points (P < 0.001) (Figure 1B).
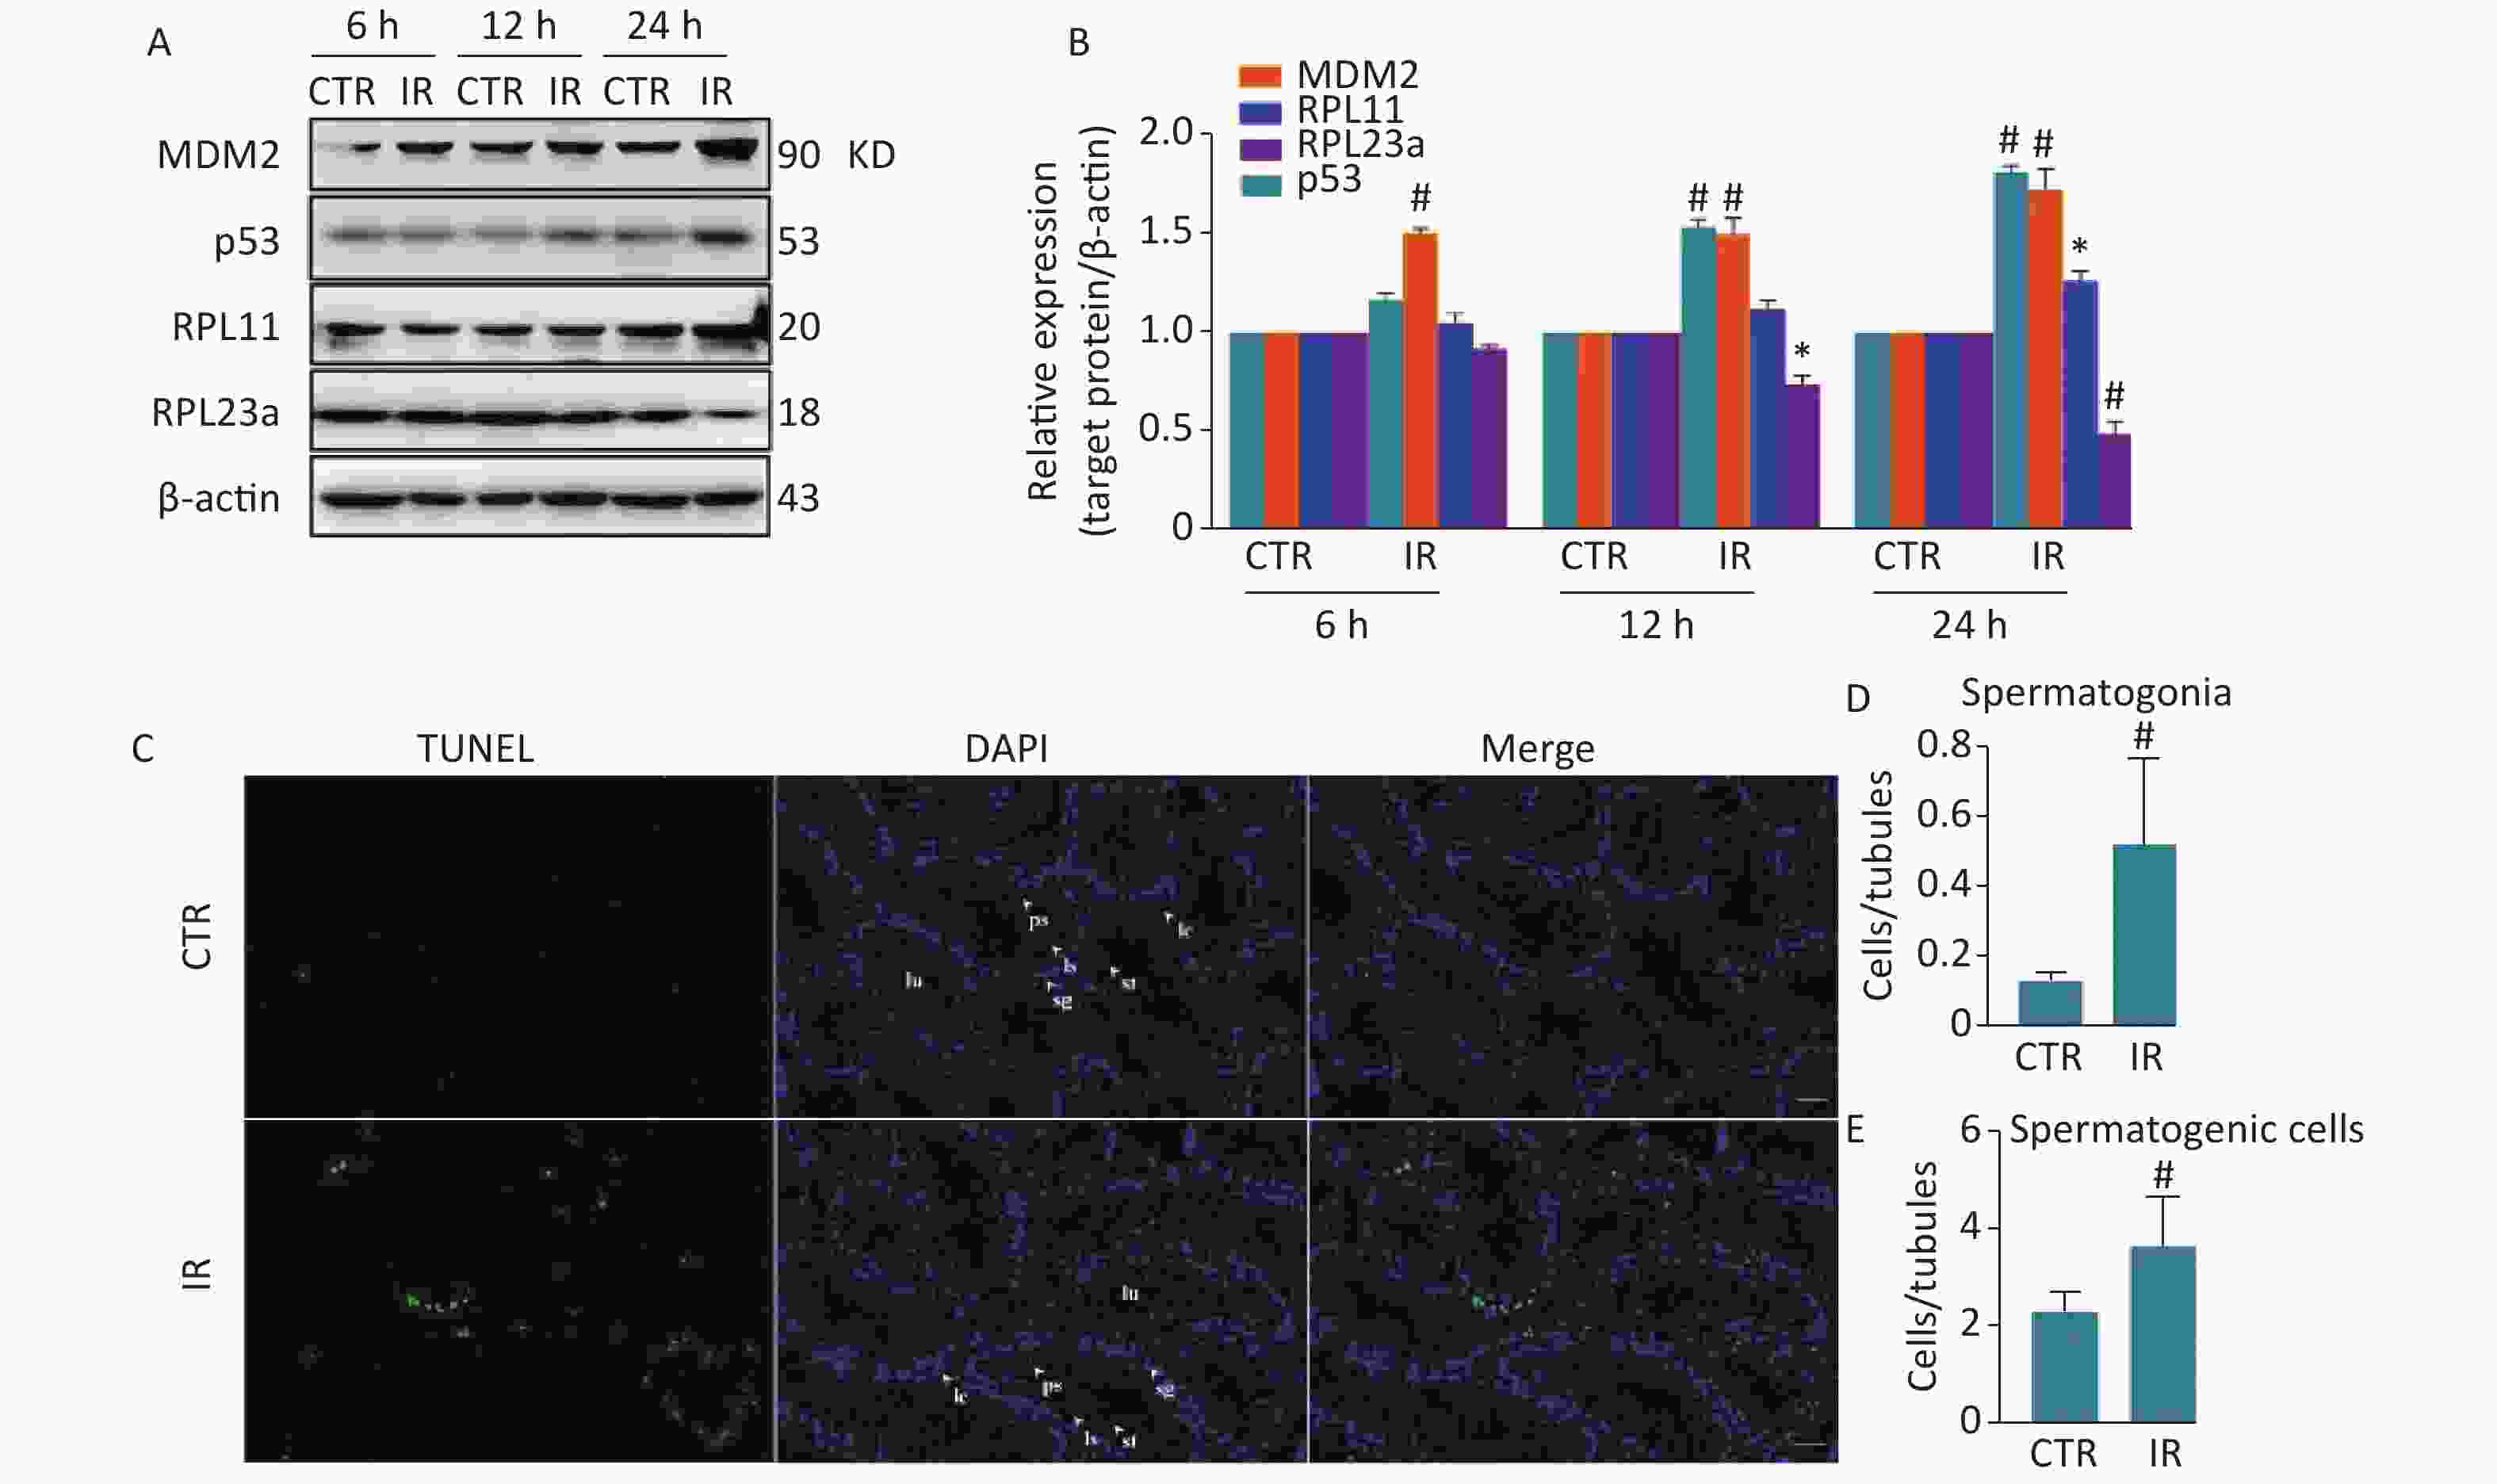
Figure 1. Immunoblotting analysis of RPL23a, RPL11, MDM2, and p53 expression in mice testes exposed to 4 Gy IR (A); Relative expression levels of proteins compared to β-actin (B); testes of three mice were analyzed and values are presented as the mean ± SEM; asterisks and pound signs represent significant differences from controls: *P < 0.05, #P < 0.001. TUNEL staining to assess spermatogonia apoptosis and spermatogenic cells in testis at 24 h after IR (magnification, 200×; scale bar = 50 μm) (C); different cell types are indicated by white arrows; the nucleus are labeled with DAPI (blue) and apoptotic signals are shown in green. Histogram of apoptotic ratio (D, E); apoptotic ratio = apoptotic spermatogenic cells (spermatogonia)/seminiferous tubules; counted all observed apoptotic spermatogenic cells and seminiferous tubules in each mouse; values represent mean ± SEM from three mice in each group; significant difference from controls: #P < 0.001. Abbreviations: CTR, control; IR, ionizing radiation; sg, spermatogonia; ps, pachytene spermatocyte; ls, leptotene stage spermatocyte; st, spermatid; sp, spermatozoa; lc, Leydig cell.
-
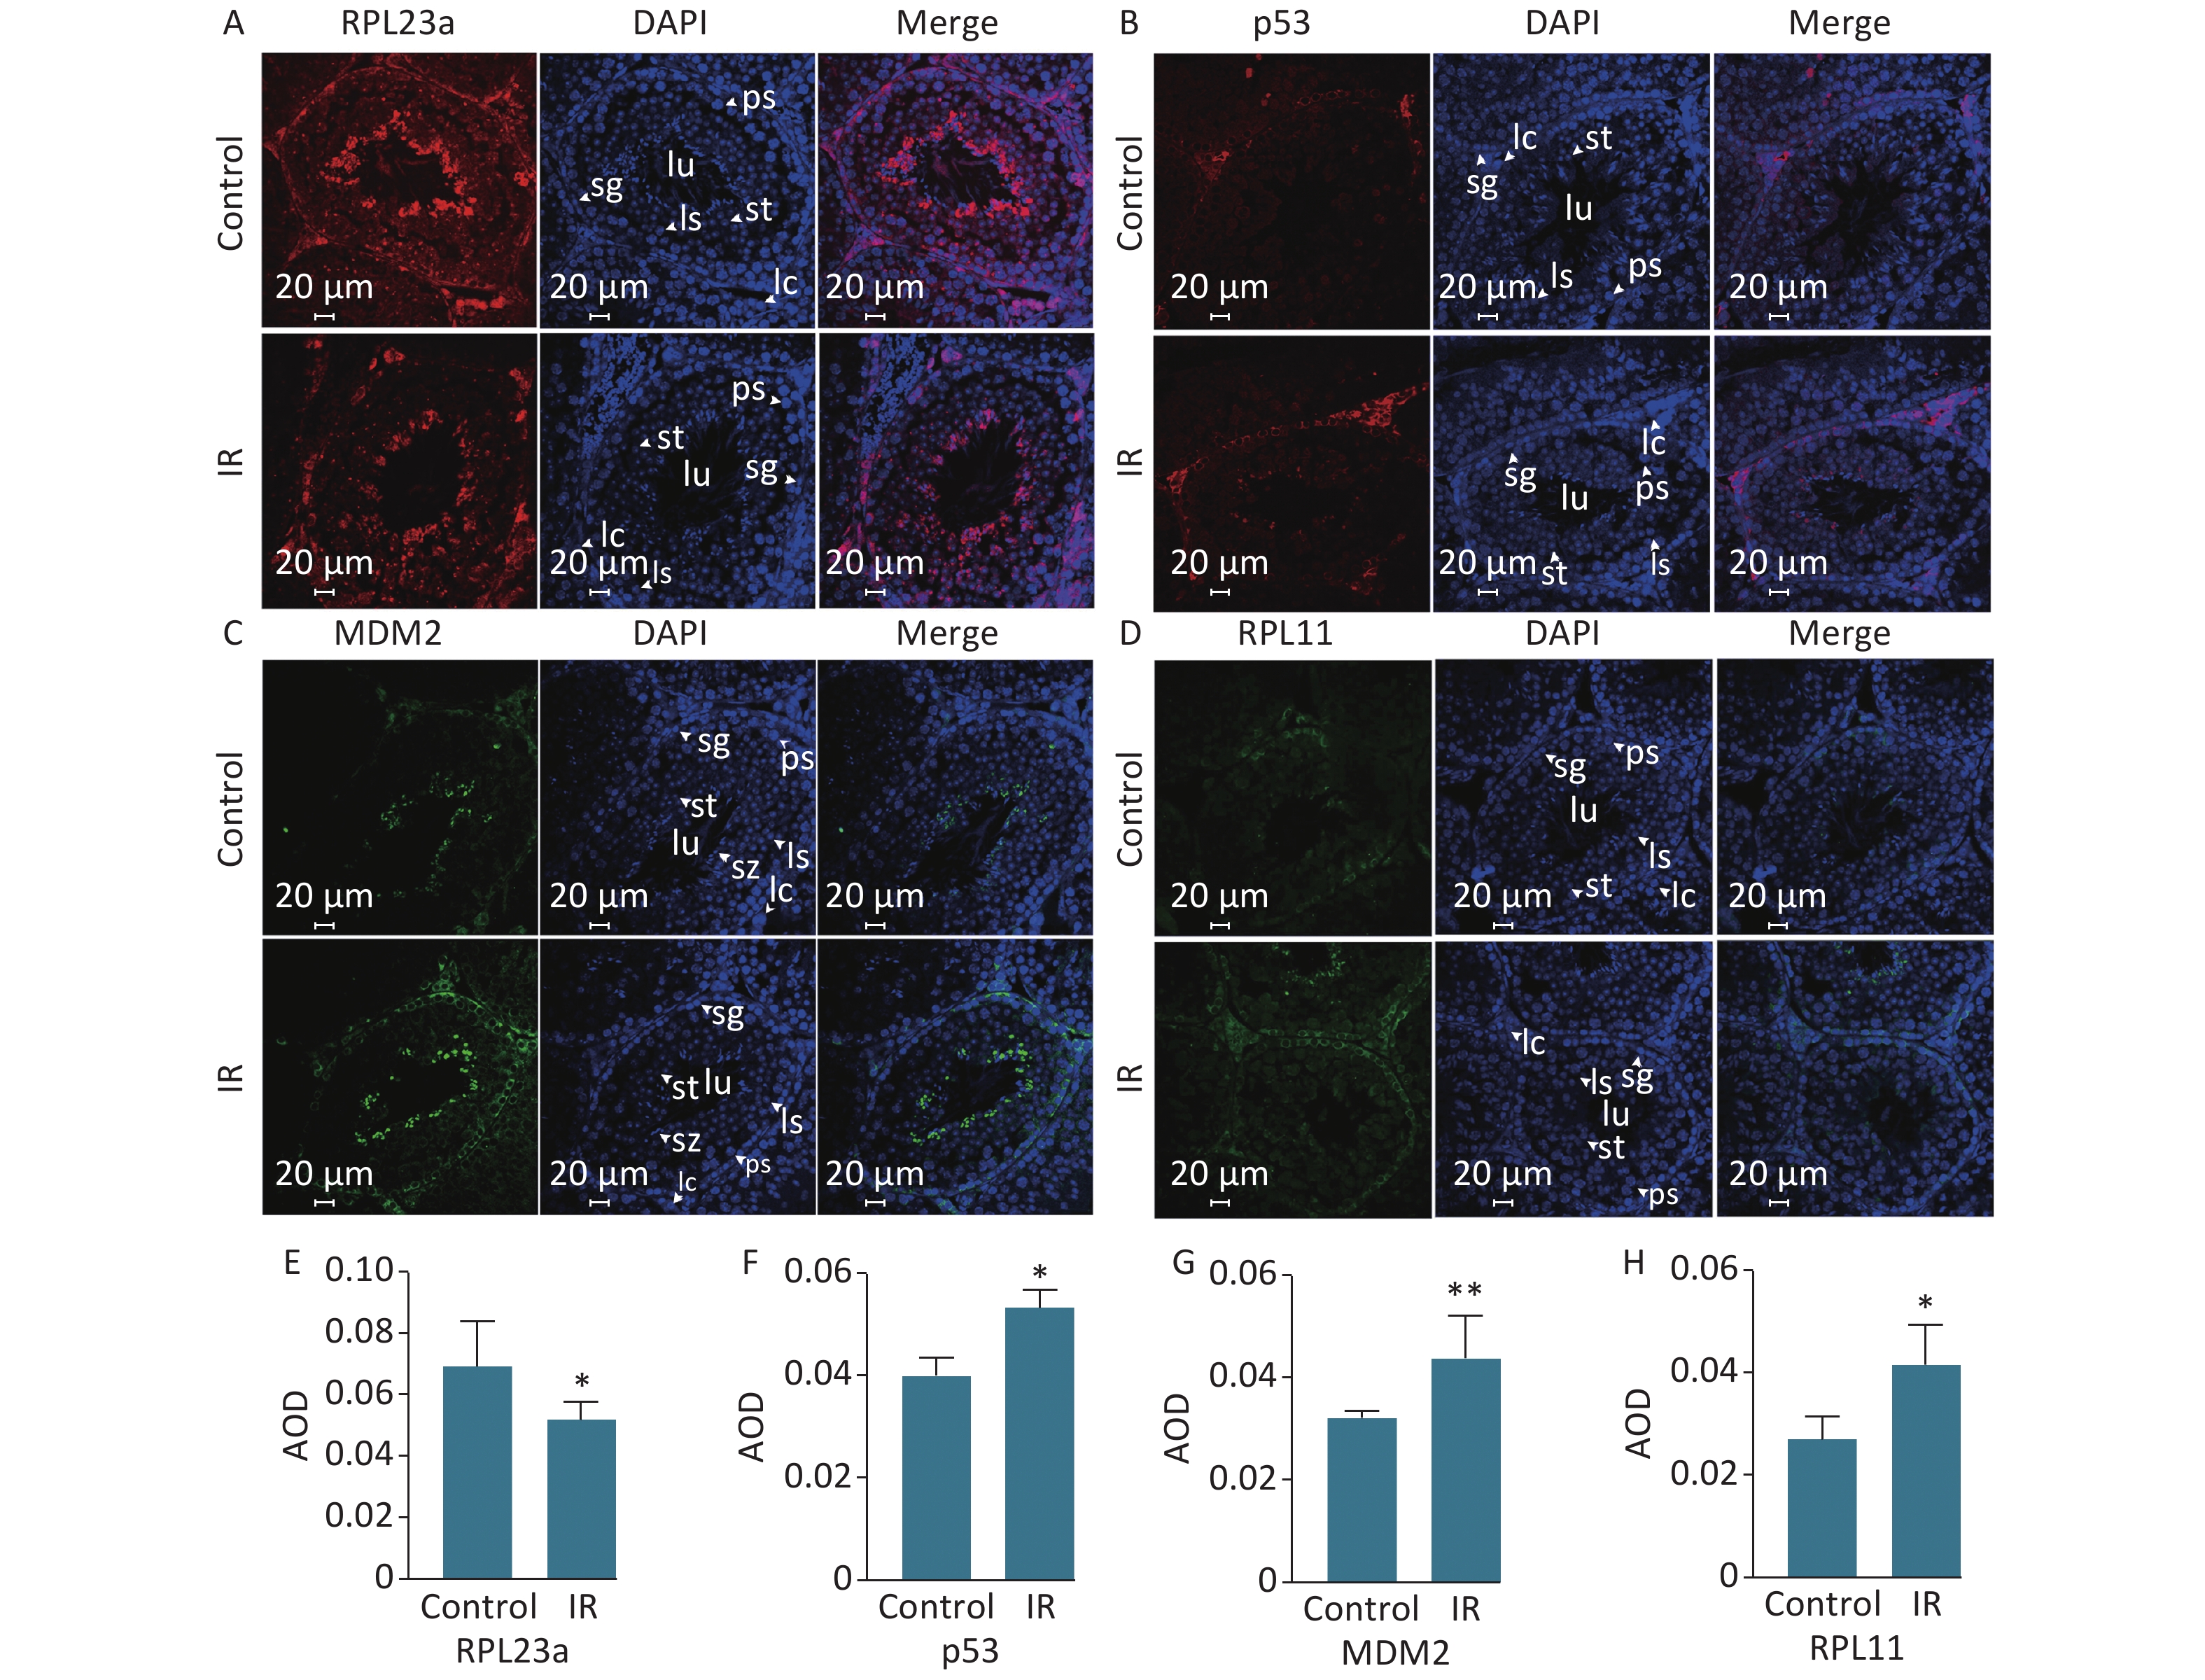
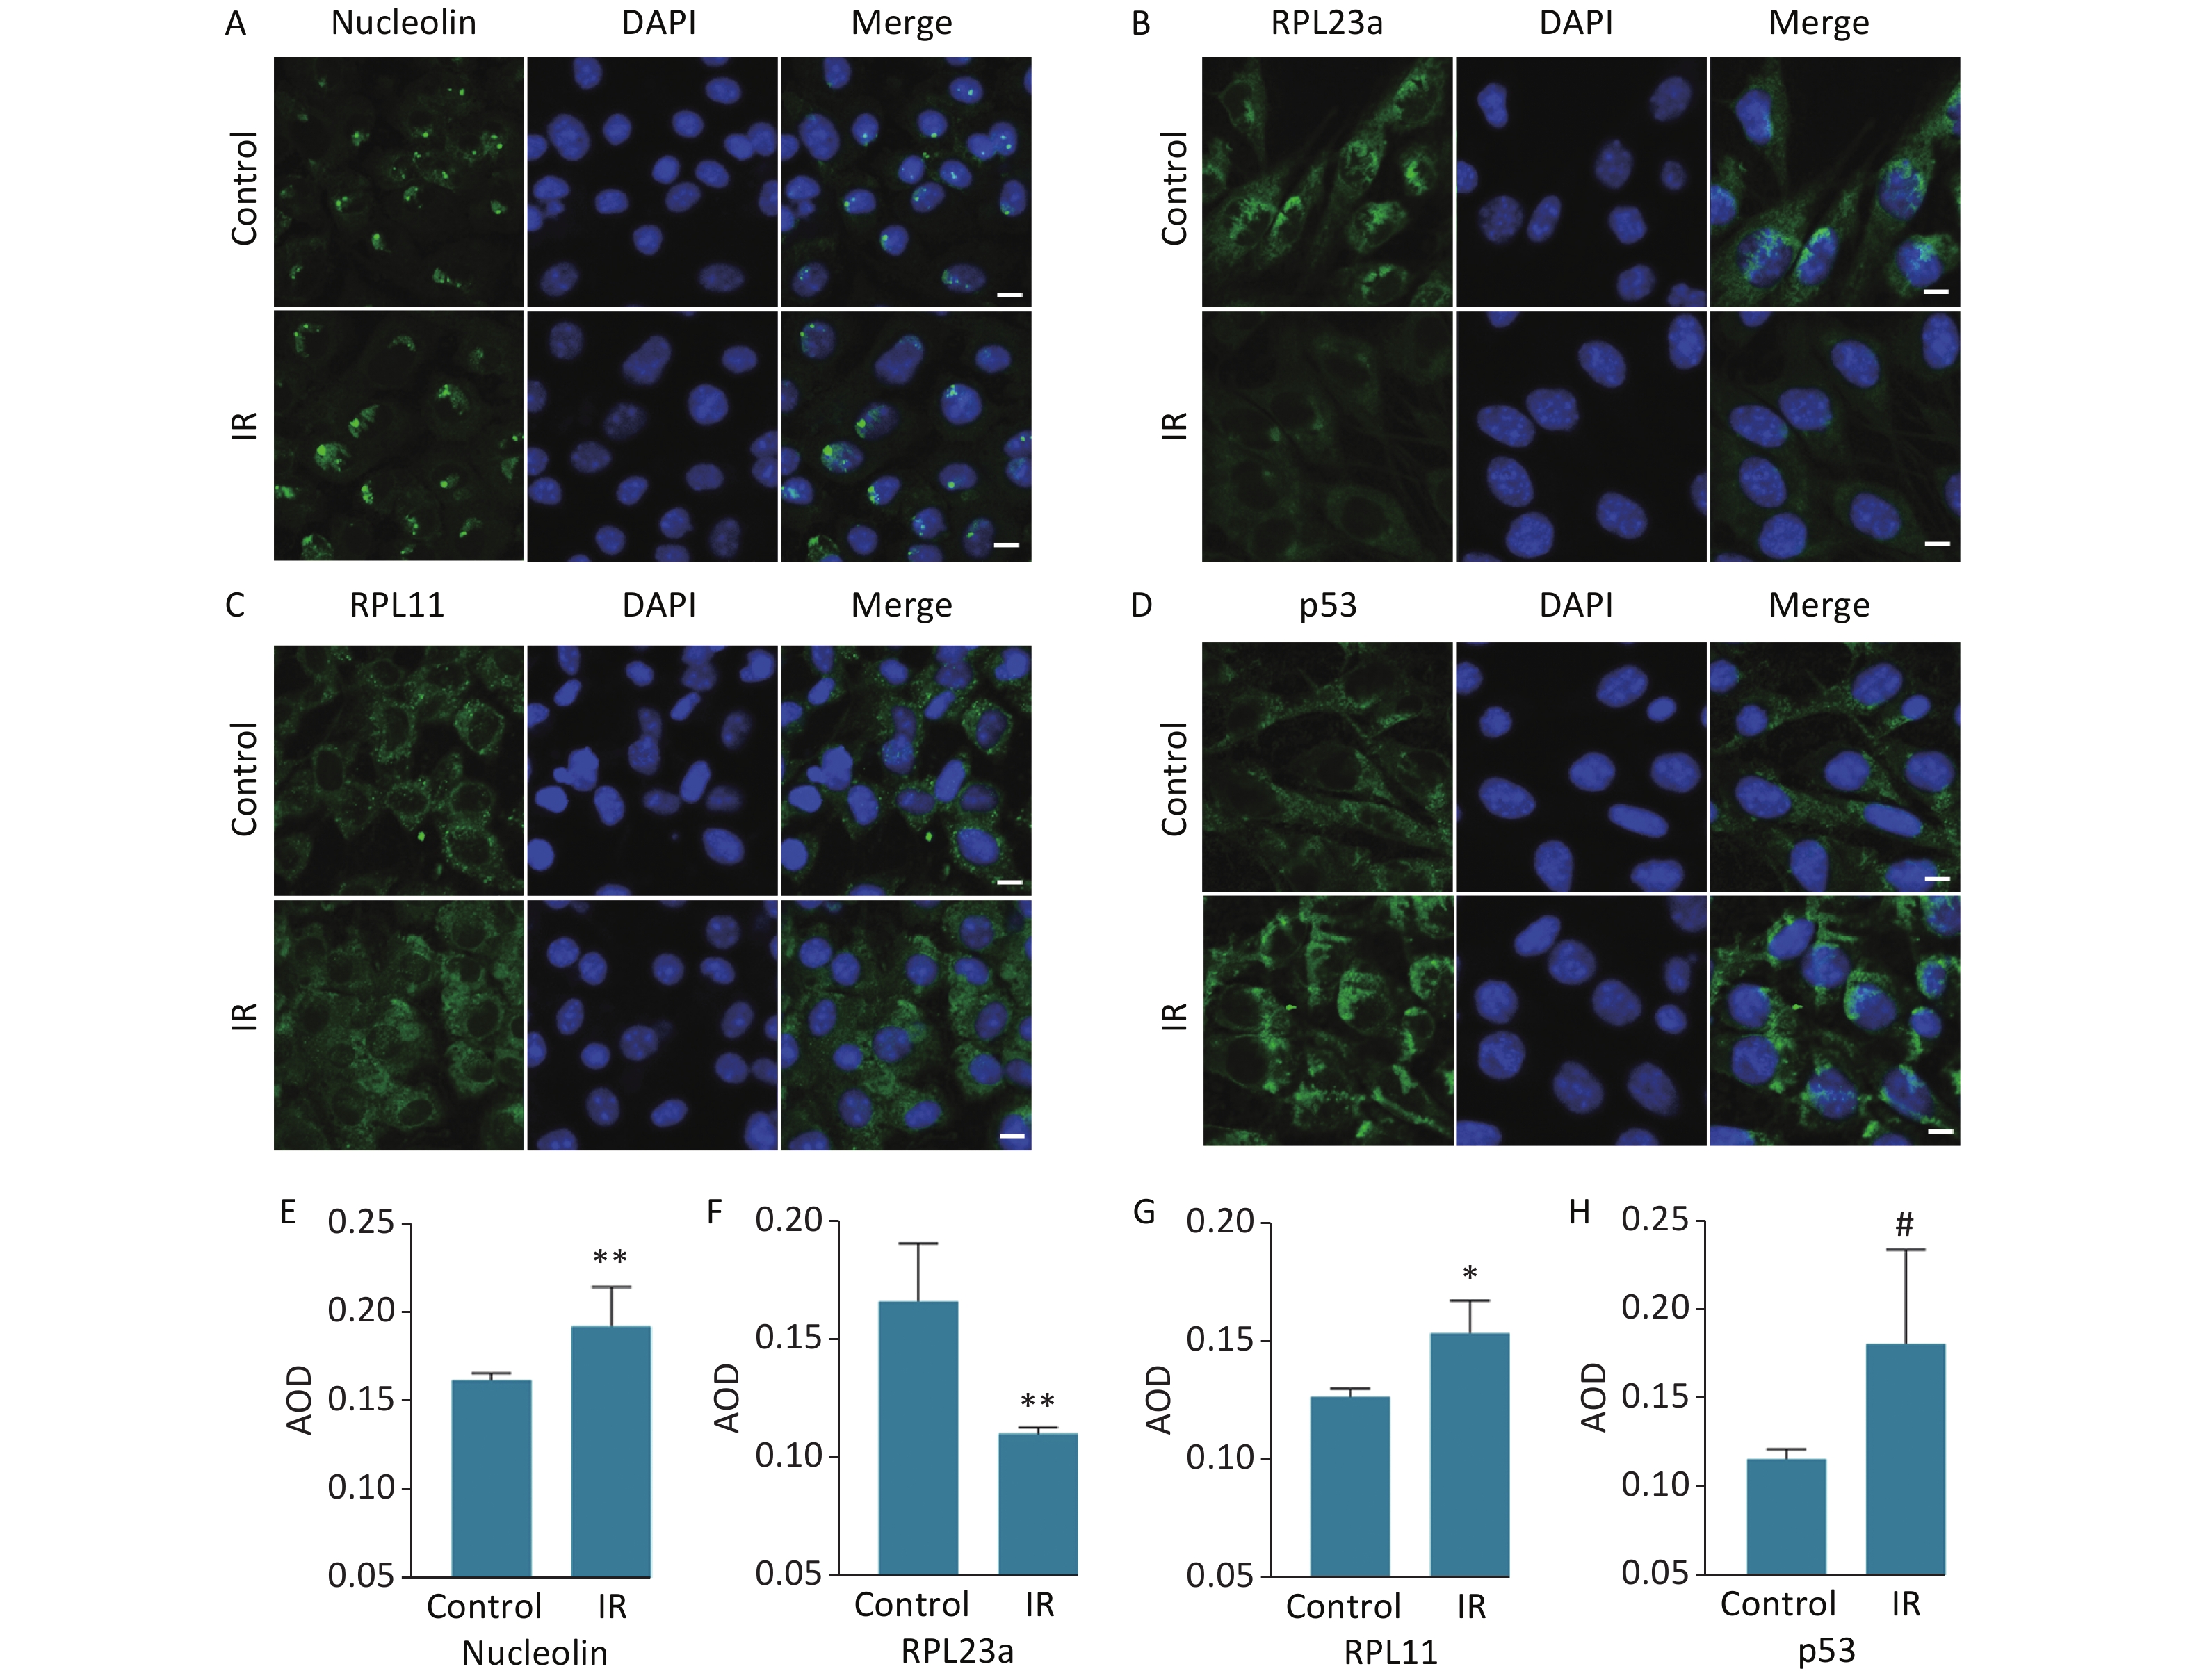
Spermatogonia apoptosis was assessed with the TUNEL assay at 24 h after IR because the differences in the expression levels of RPL23a, RPL11, MDM2, and p53 were most significant at this time point. Next, spermatogonia apoptosis and the expression of these proteins were investigated in vivo at 24 h after IR. The results showed that there were almost no apoptosis of spermatogenic cells in the control group, IR had induced apoptosis of spermatogonia, spermatocyte and spermatid (Figure 1C). Immunofluorescence was used to determine the distribution of RPL23a, RPL11, MDM2, and p53 in spermatogonia in vivo at 24 h after IR (Figure 2A, B, C, D). The results showed that the immunofluorescence signal of RPL23a was decreased (Figure 2E), while those of RPL11, MDM2, and p53 were increased in spermatogonia (Figure 2F, G, H), suggesting that IR-induced apoptosis of spermatogonia was associated with reduced expression of RPL23a and the RPL11-MDM2-p53 pathway.
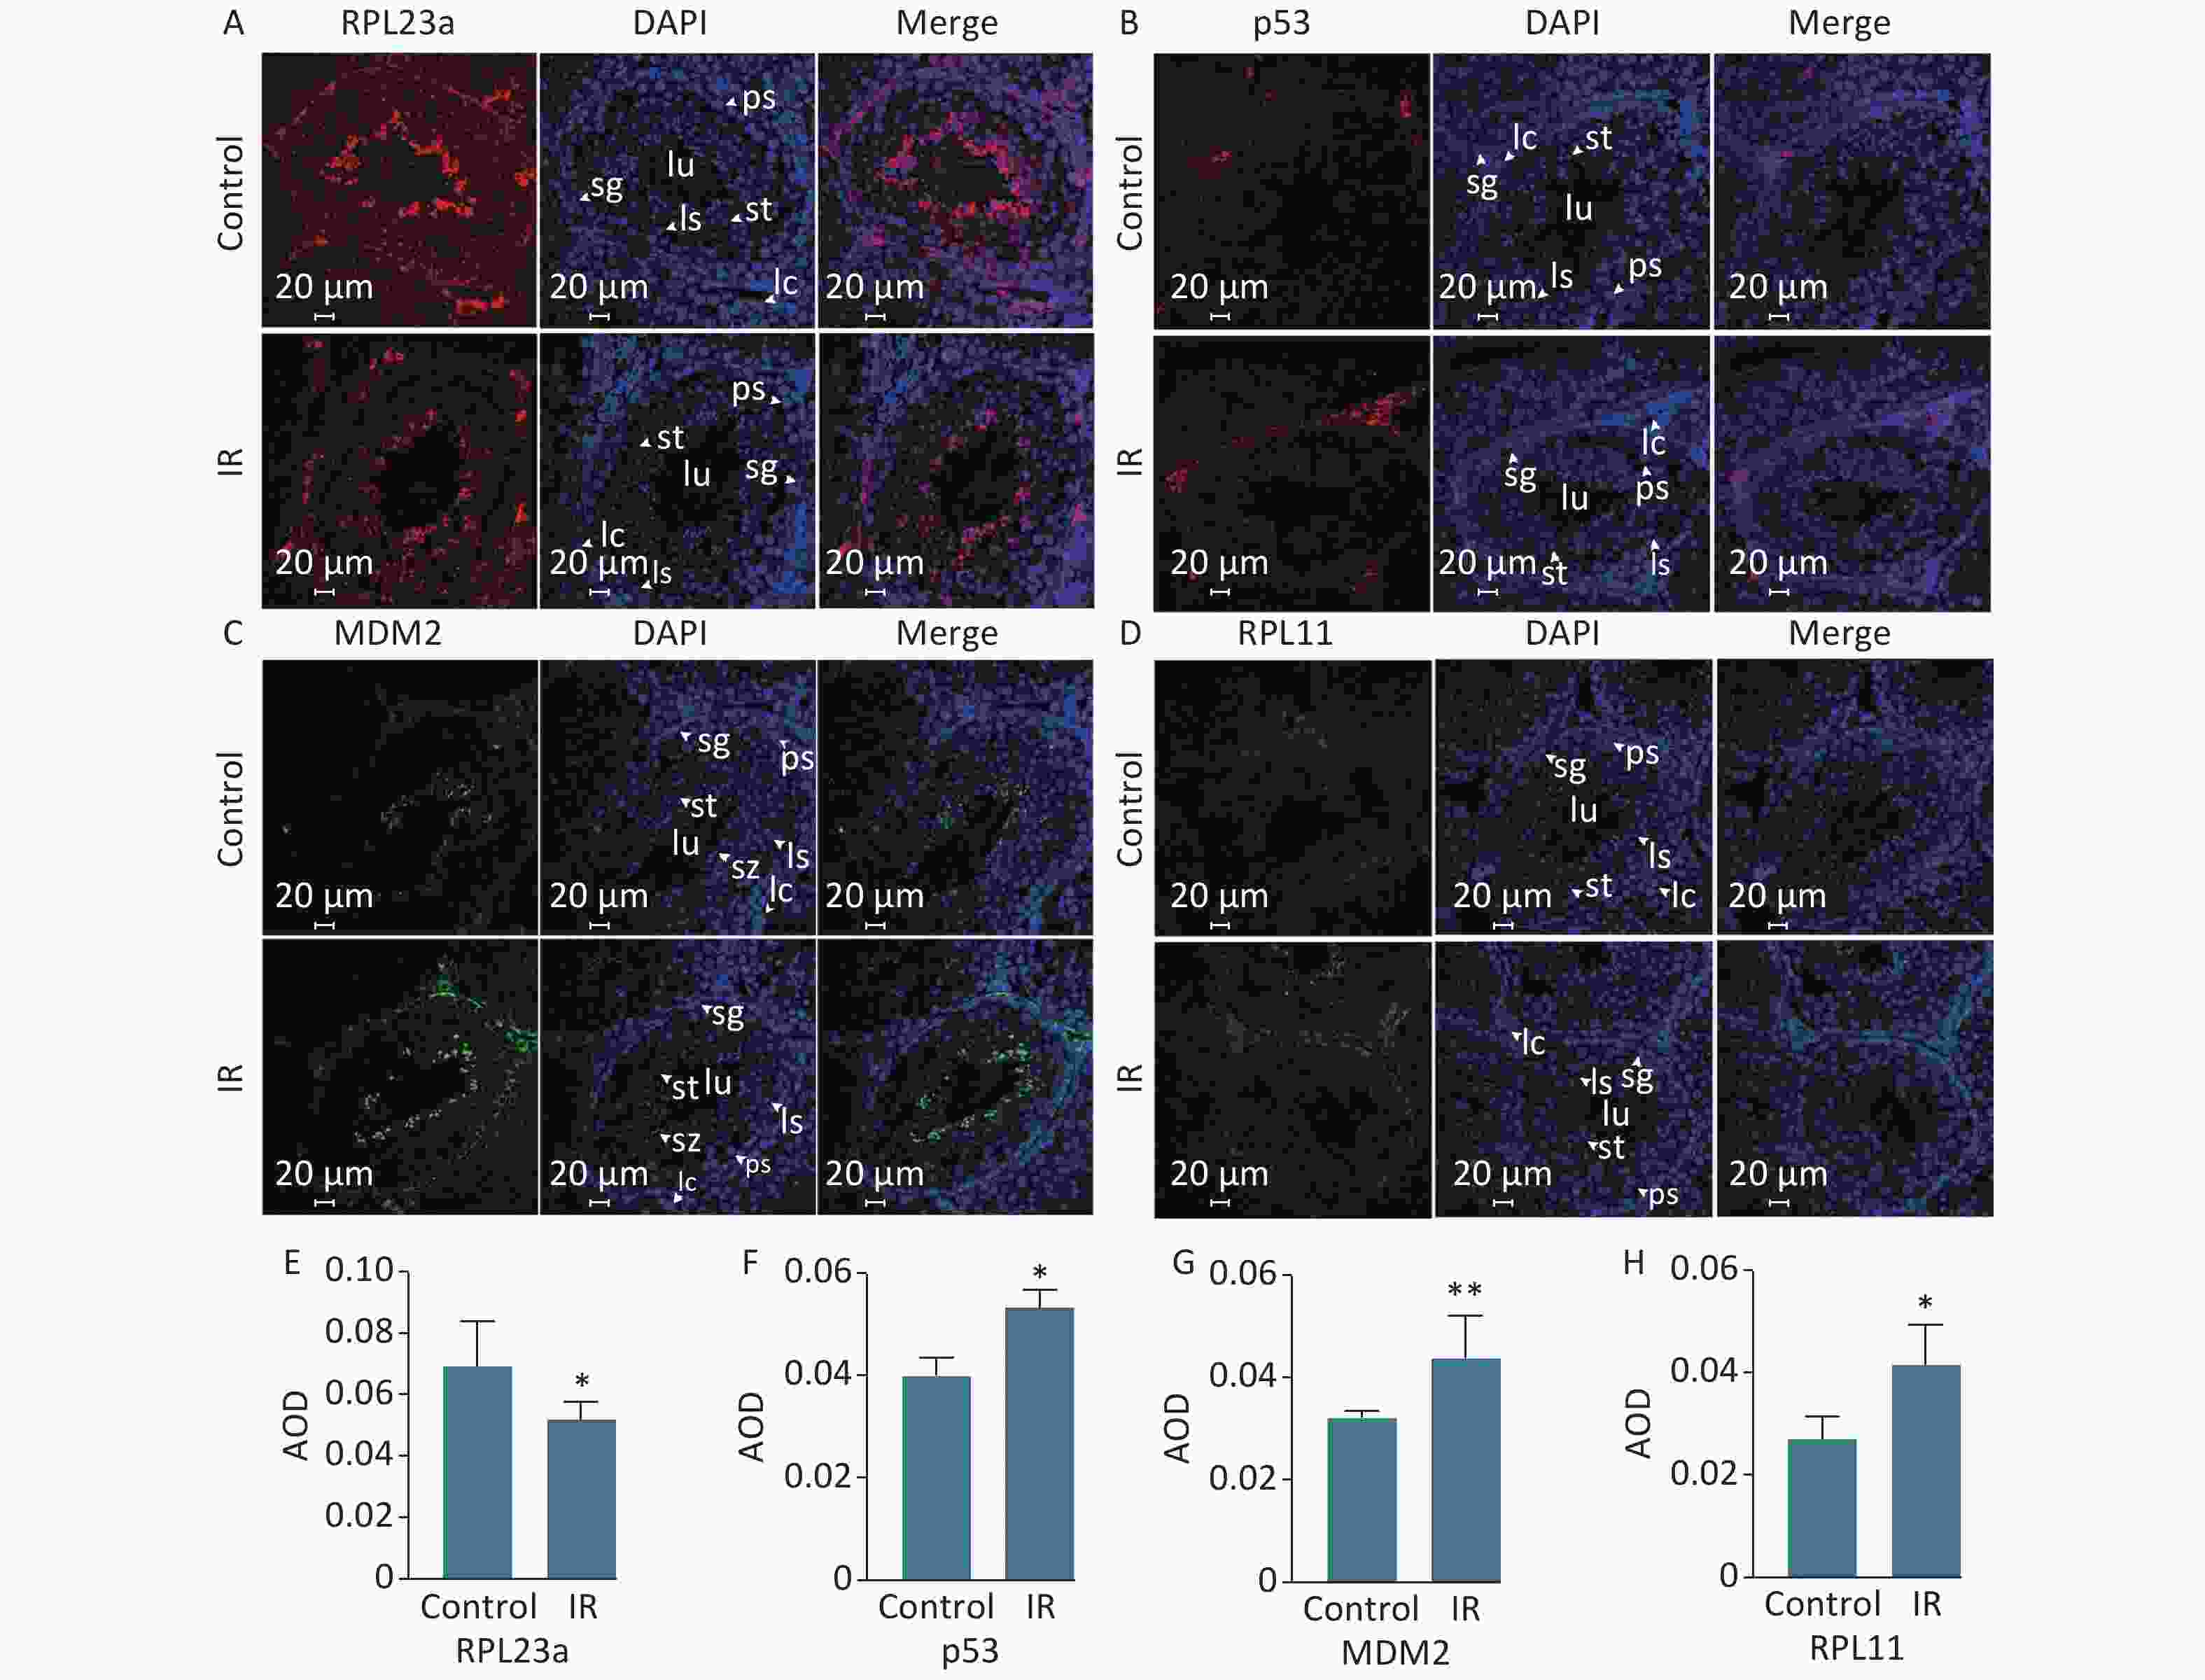
Figure 2. Immunofluorescence analysis of the distribution of RPL23a, RPL11, MDM2, and p53 in different cell types in testis at 24 h after 4 Gy IR (magnification, 400×; scale bar = 20 μm) (A, B, C, D); different cell types are indicated by white arrows; the nucleus are labeled with DAPI (blue); the fluorescence signals of RPL23a and p53 are shown in red, while those of MDM2 and RPL11 are shown in green. Quantification of proteins in spermatogonia were assessed as mean AOD (E, F, G, H); values represent the average ± SEM from three mice per group, asterisks signs represent significant differences from controls: *P < 0.05, **P < 0.01 with Student's t-test analysis. Abbreviations: IR, ionizing radiation; sg, spermatogonia; ps, pachytene spermatocyte; ls, leptotene stage spermatocyte; st, spermatid; sp, spermatozoa; lc, Leydig cell.
-
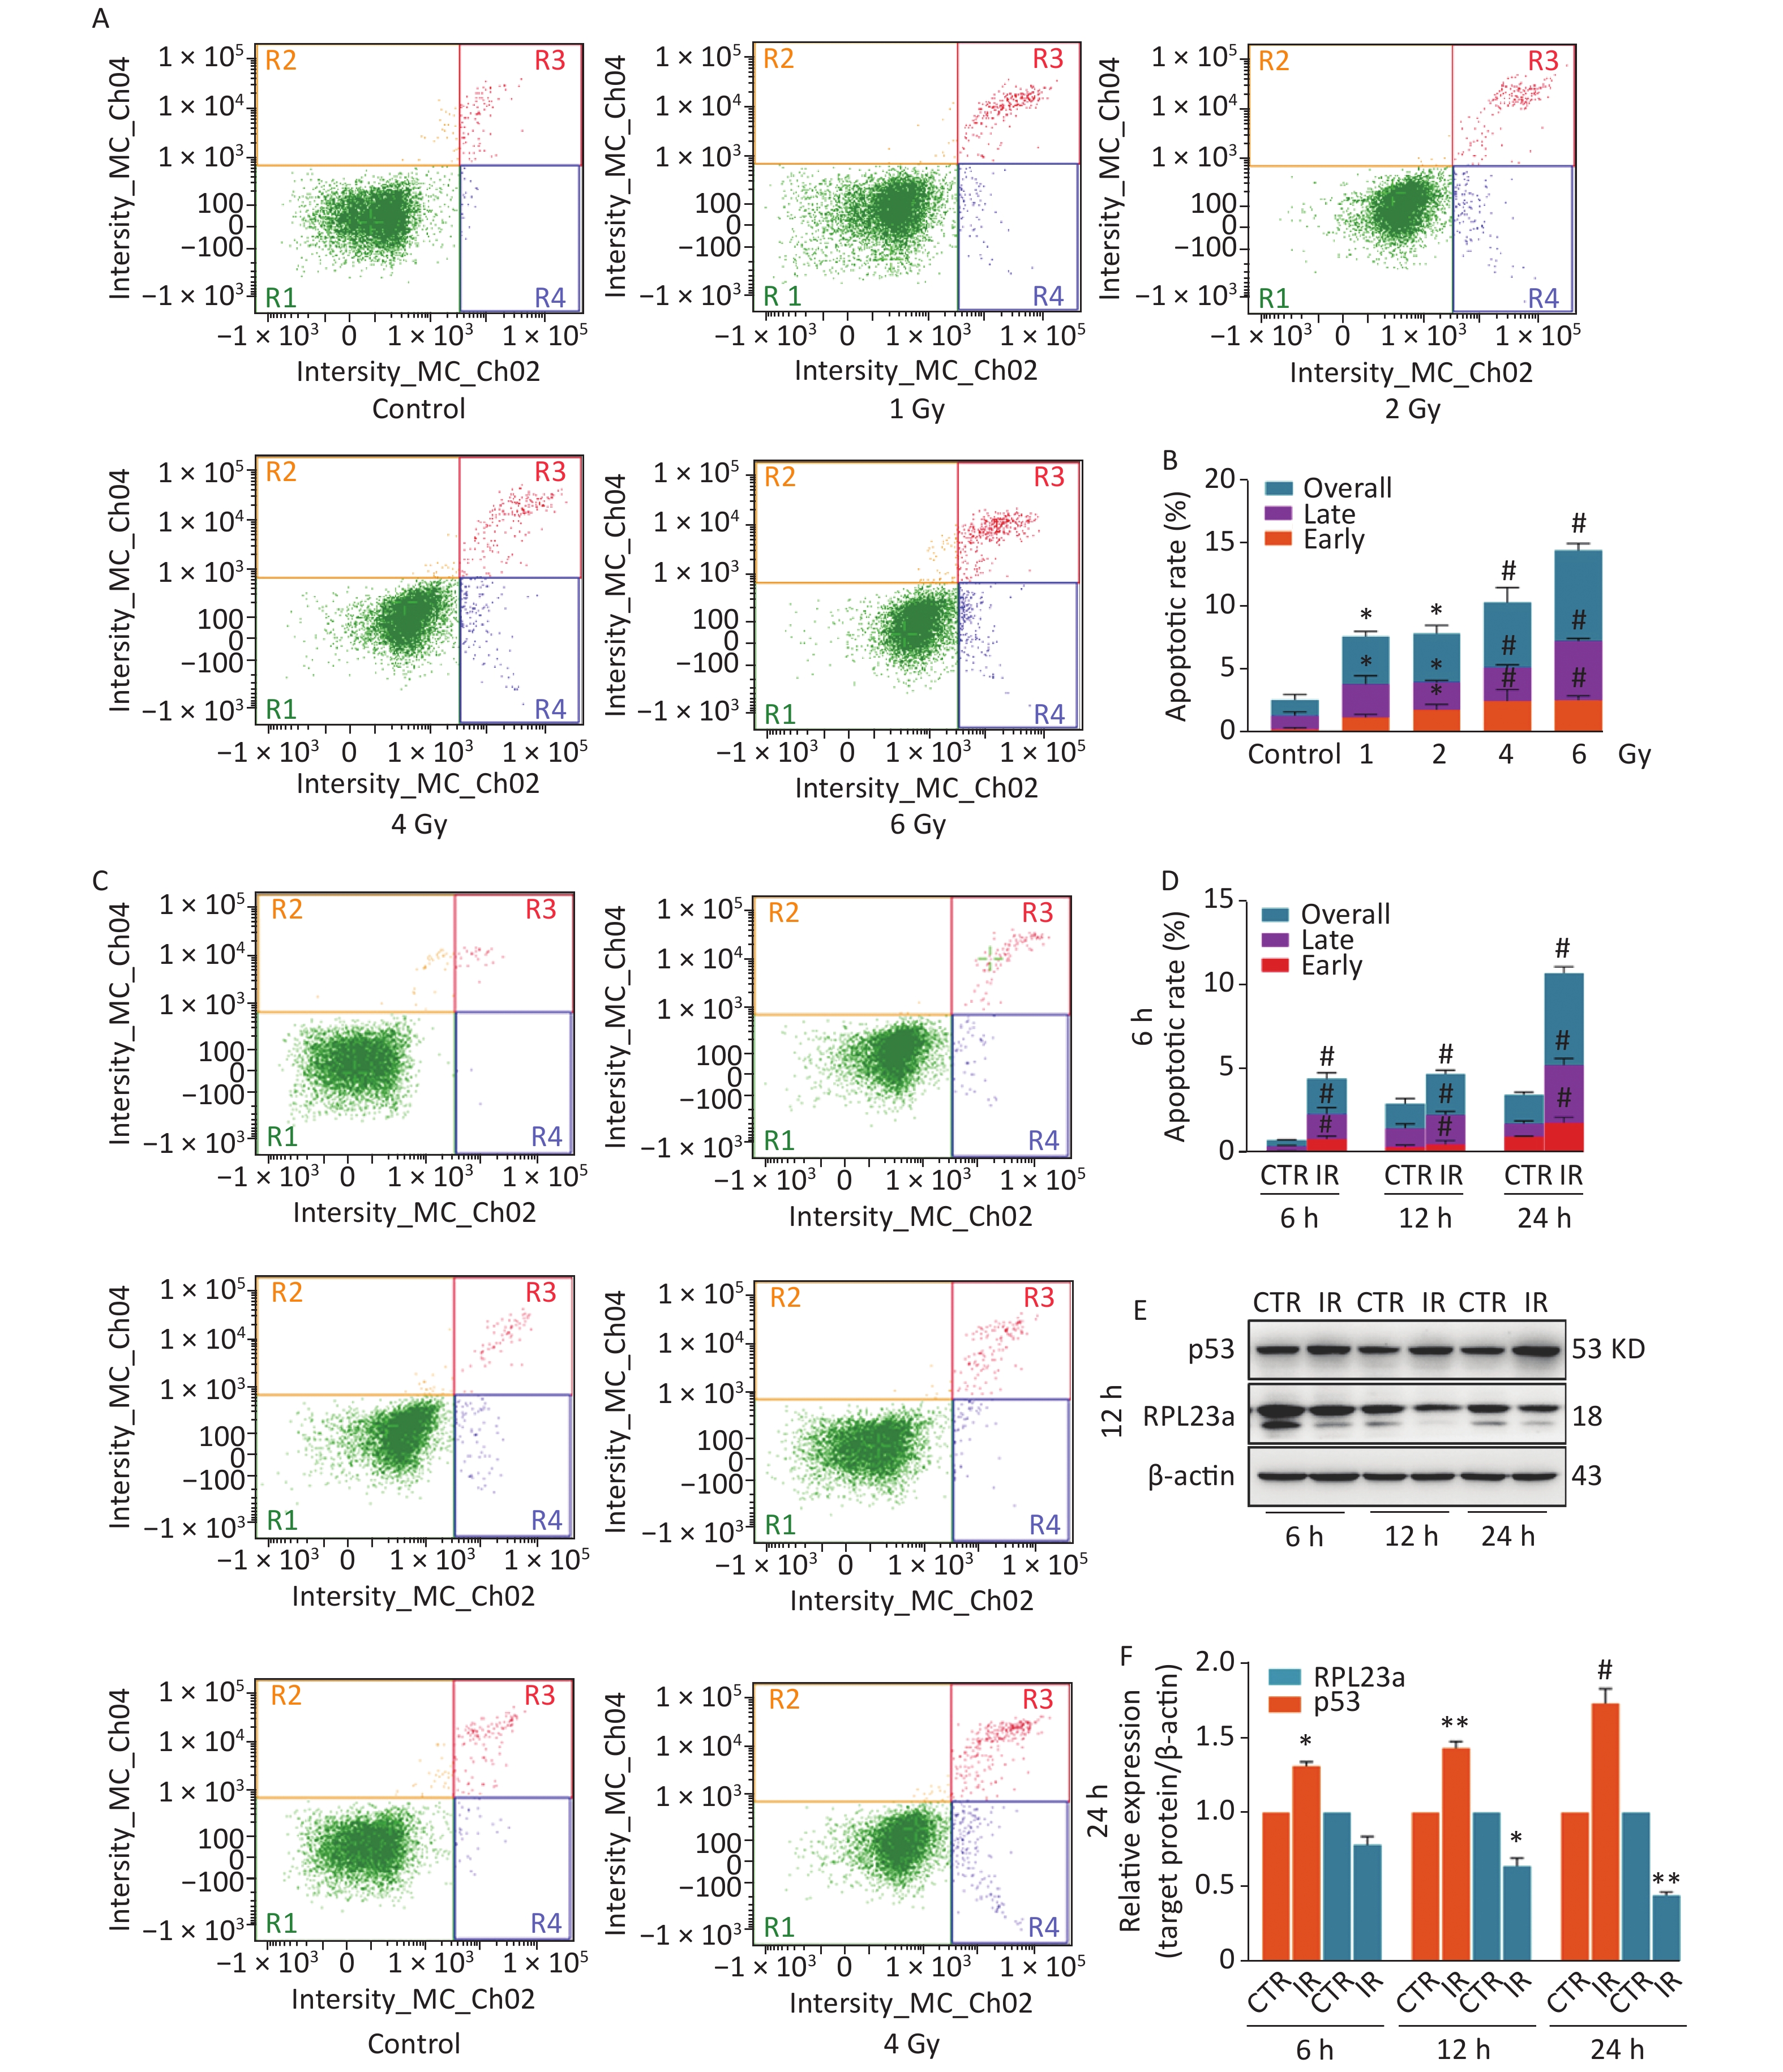
A spermatogonia, GC-1 cells, were selected to investigate the relationship between RPL23a expression and p53 activation in spermatogonia in vitro. In order to confirm the effect of IR on spermatogonia apoptosis, we analyzed the apoptotic ratio of spermatogonia at 24 h by different irradiated dose (Figure 3A), the results showed the apoptotic ratio has dose-dependent (Figure 3B). Then, we analyzed the apoptotic ratio of spermatogonia at different time point under 4 Gy (Figure 3C), the results showed that the apoptotic ratio has time-dependent (Figure 3D). The above results indicated that IR induces spermatogonia apoptosis has dose and time-dependent in vitro. The decreased expression of RPL23a and increased p53 after 4 Gy IR were time-dependent (Figure 3E, F). IR can increase the expression of nucleolar integrity marker protein nucleolin (NCL) and make it enter the nucleoplasm[28].
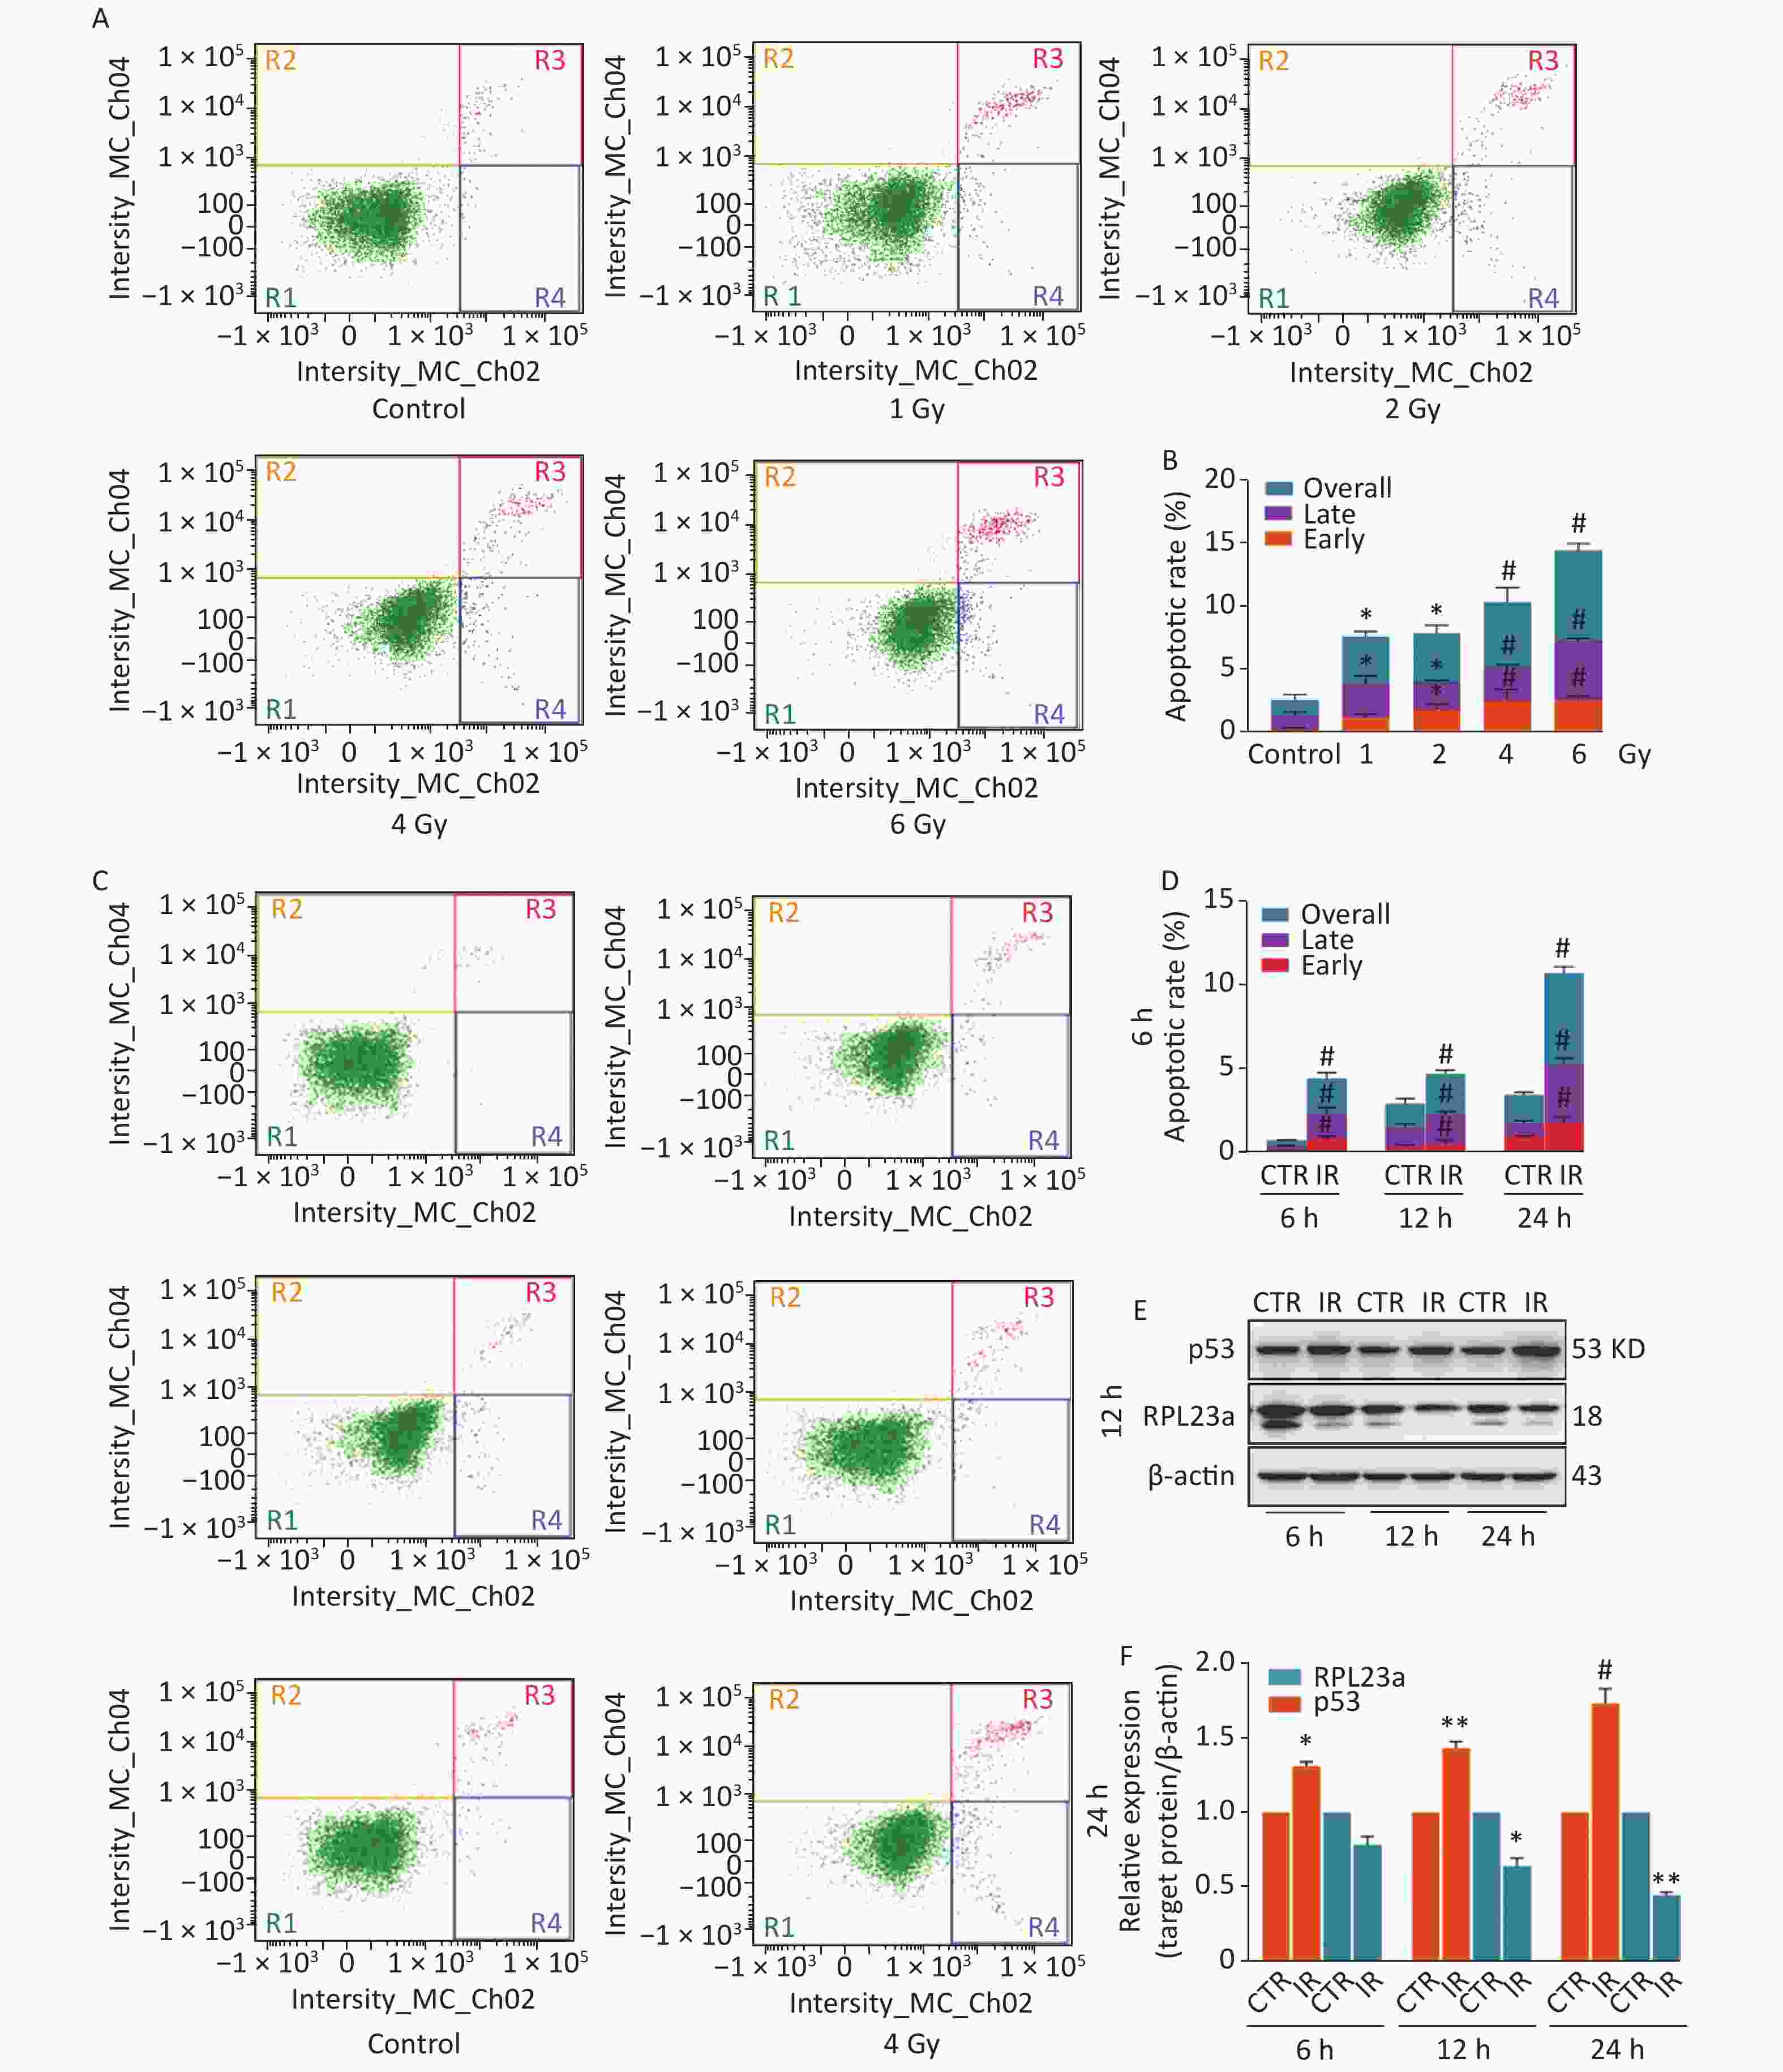
Figure 3. Apoptosis of GC-1 cells analyzed by flow cytometry exposed to IR (A, C). The apoptotic ratio of GC-1 cells exposed to IR (B, D); three dependent repeats were analyzed and values are presented as the mean ± SEM, asterisks and pound signs represent significant differences from controls: *P < 0.05, #P < 0.001. Immunoblotting analysis of RPL23a and p53 expression in GC-1 cells exposed to IR (E). Relative expression levels of target proteins as compared to β-actin (F); three gels were analyzed and values are presented as the mean ± SEM, asterisks and pound signs represent significant differences from controls: *P < 0.05, **P < 0.01, #P < 0.001. Abbreviations: CTR, control; IR, ionizing radiation.
The distribution of NCL, RPL23a, RPL11 and p53 was shown in GC-1 cells at 24 h after IR (Figure 4A, B, C, D). The increased expression of NCL (Figure 4E) suggested the nucleolar structure of the GC-1 cells may be injured by IR. The immunofluorescence signal of RPL23a was distributed in the nucleus and cytoplasm of the control group (Figure 4B), and IR reduced the fluorescence intensity of RPL23a (Figure 4F). In addition, the expression levels of RPL11 and p53 were increased in the nucleus and cytoplasm in the IR group (Figure 4C, D, G, H).
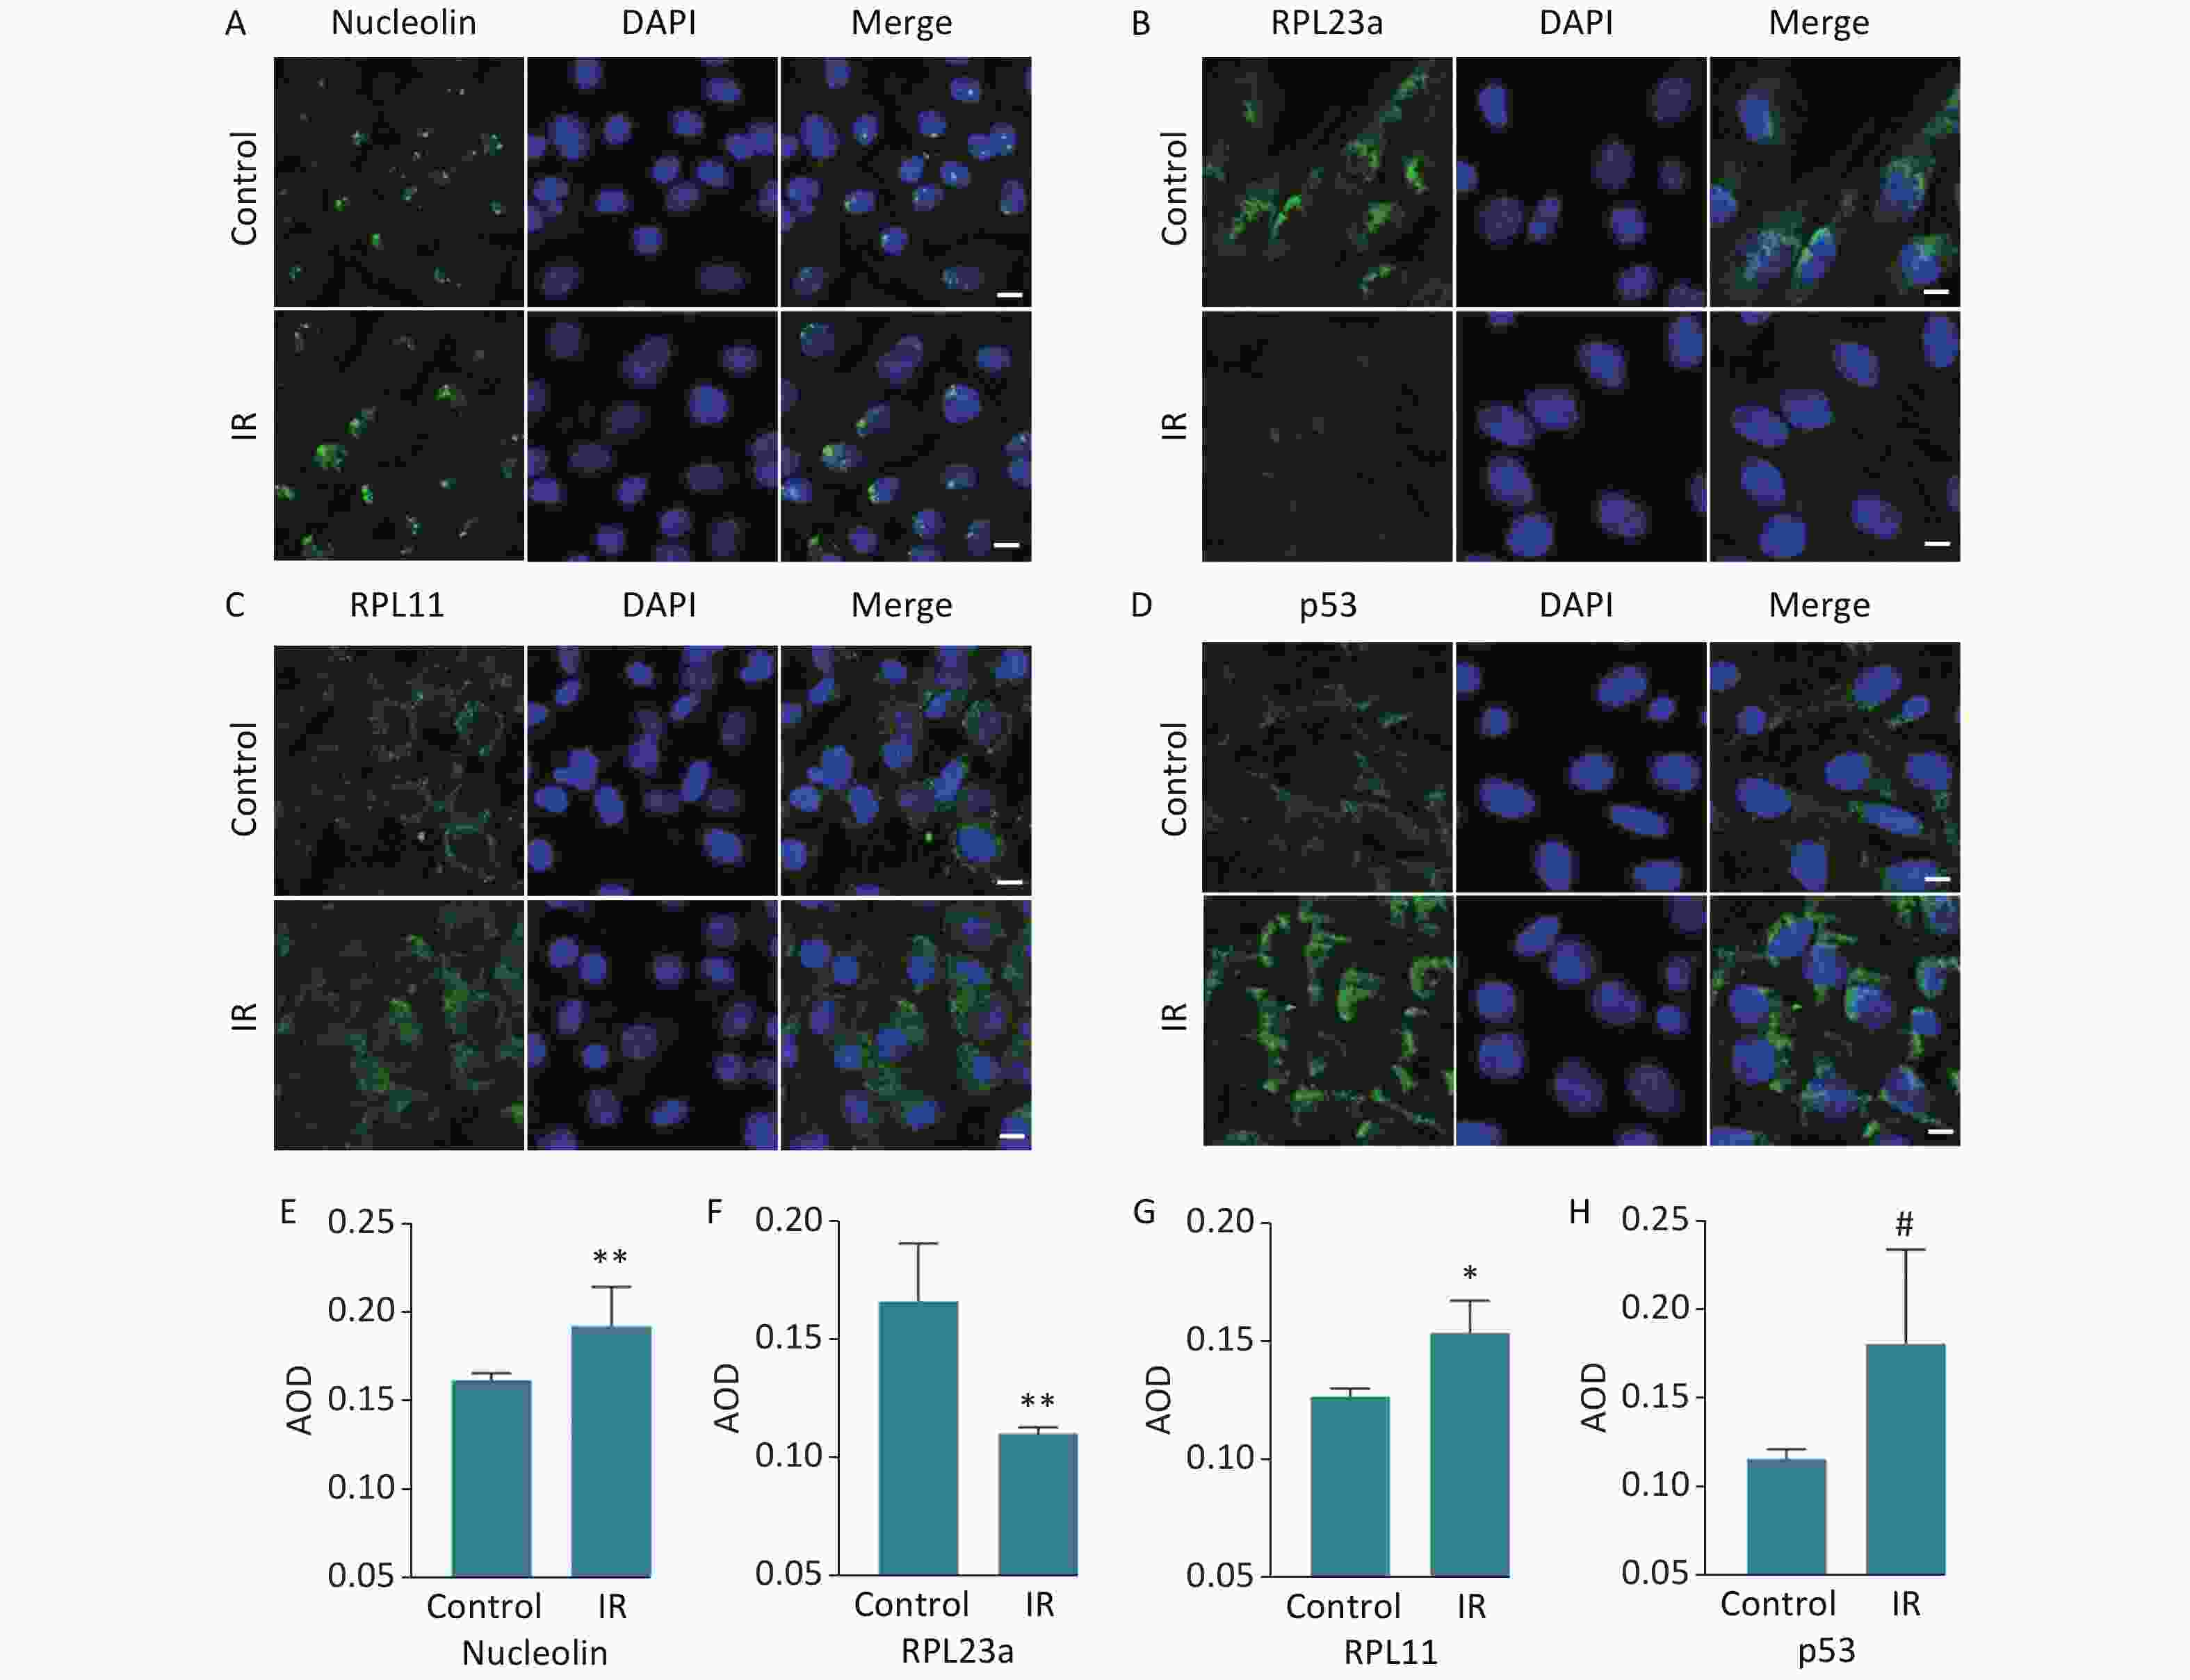
Figure 4. Immunofluorescence analysis of the distribution of RPL23a, RPL11, and p53 in GC-1 cells at 24 h after IR (magnification, 400×; scale bar = 10 μm) (A, B, C, D); the nucleus are labeled with DAPI (blue). Quantification of proteins were assessed as mean AOD (E, F, G, H); values represent the average ± SEM from three independent repeats, asterisks signs represent significant differences from controls: *P < 0.05, **P < 0.01 with Student's t-test analysis. Abbreviations: IR, ionizing radiation.
-
IR increased spermatogonia apoptosis, decreased RPL23a expression, and activated p53. The above results suggest that RPL23a expression is related to p53 accumulation and activation. To verify this hypothesis, we knocked down the expression of RPL23a and analyzed the effect of low expression of RPL23a on cell cycle arrest, apoptosis, and the expression of RPL11, MDM2 and p53 in GC-1 cells.
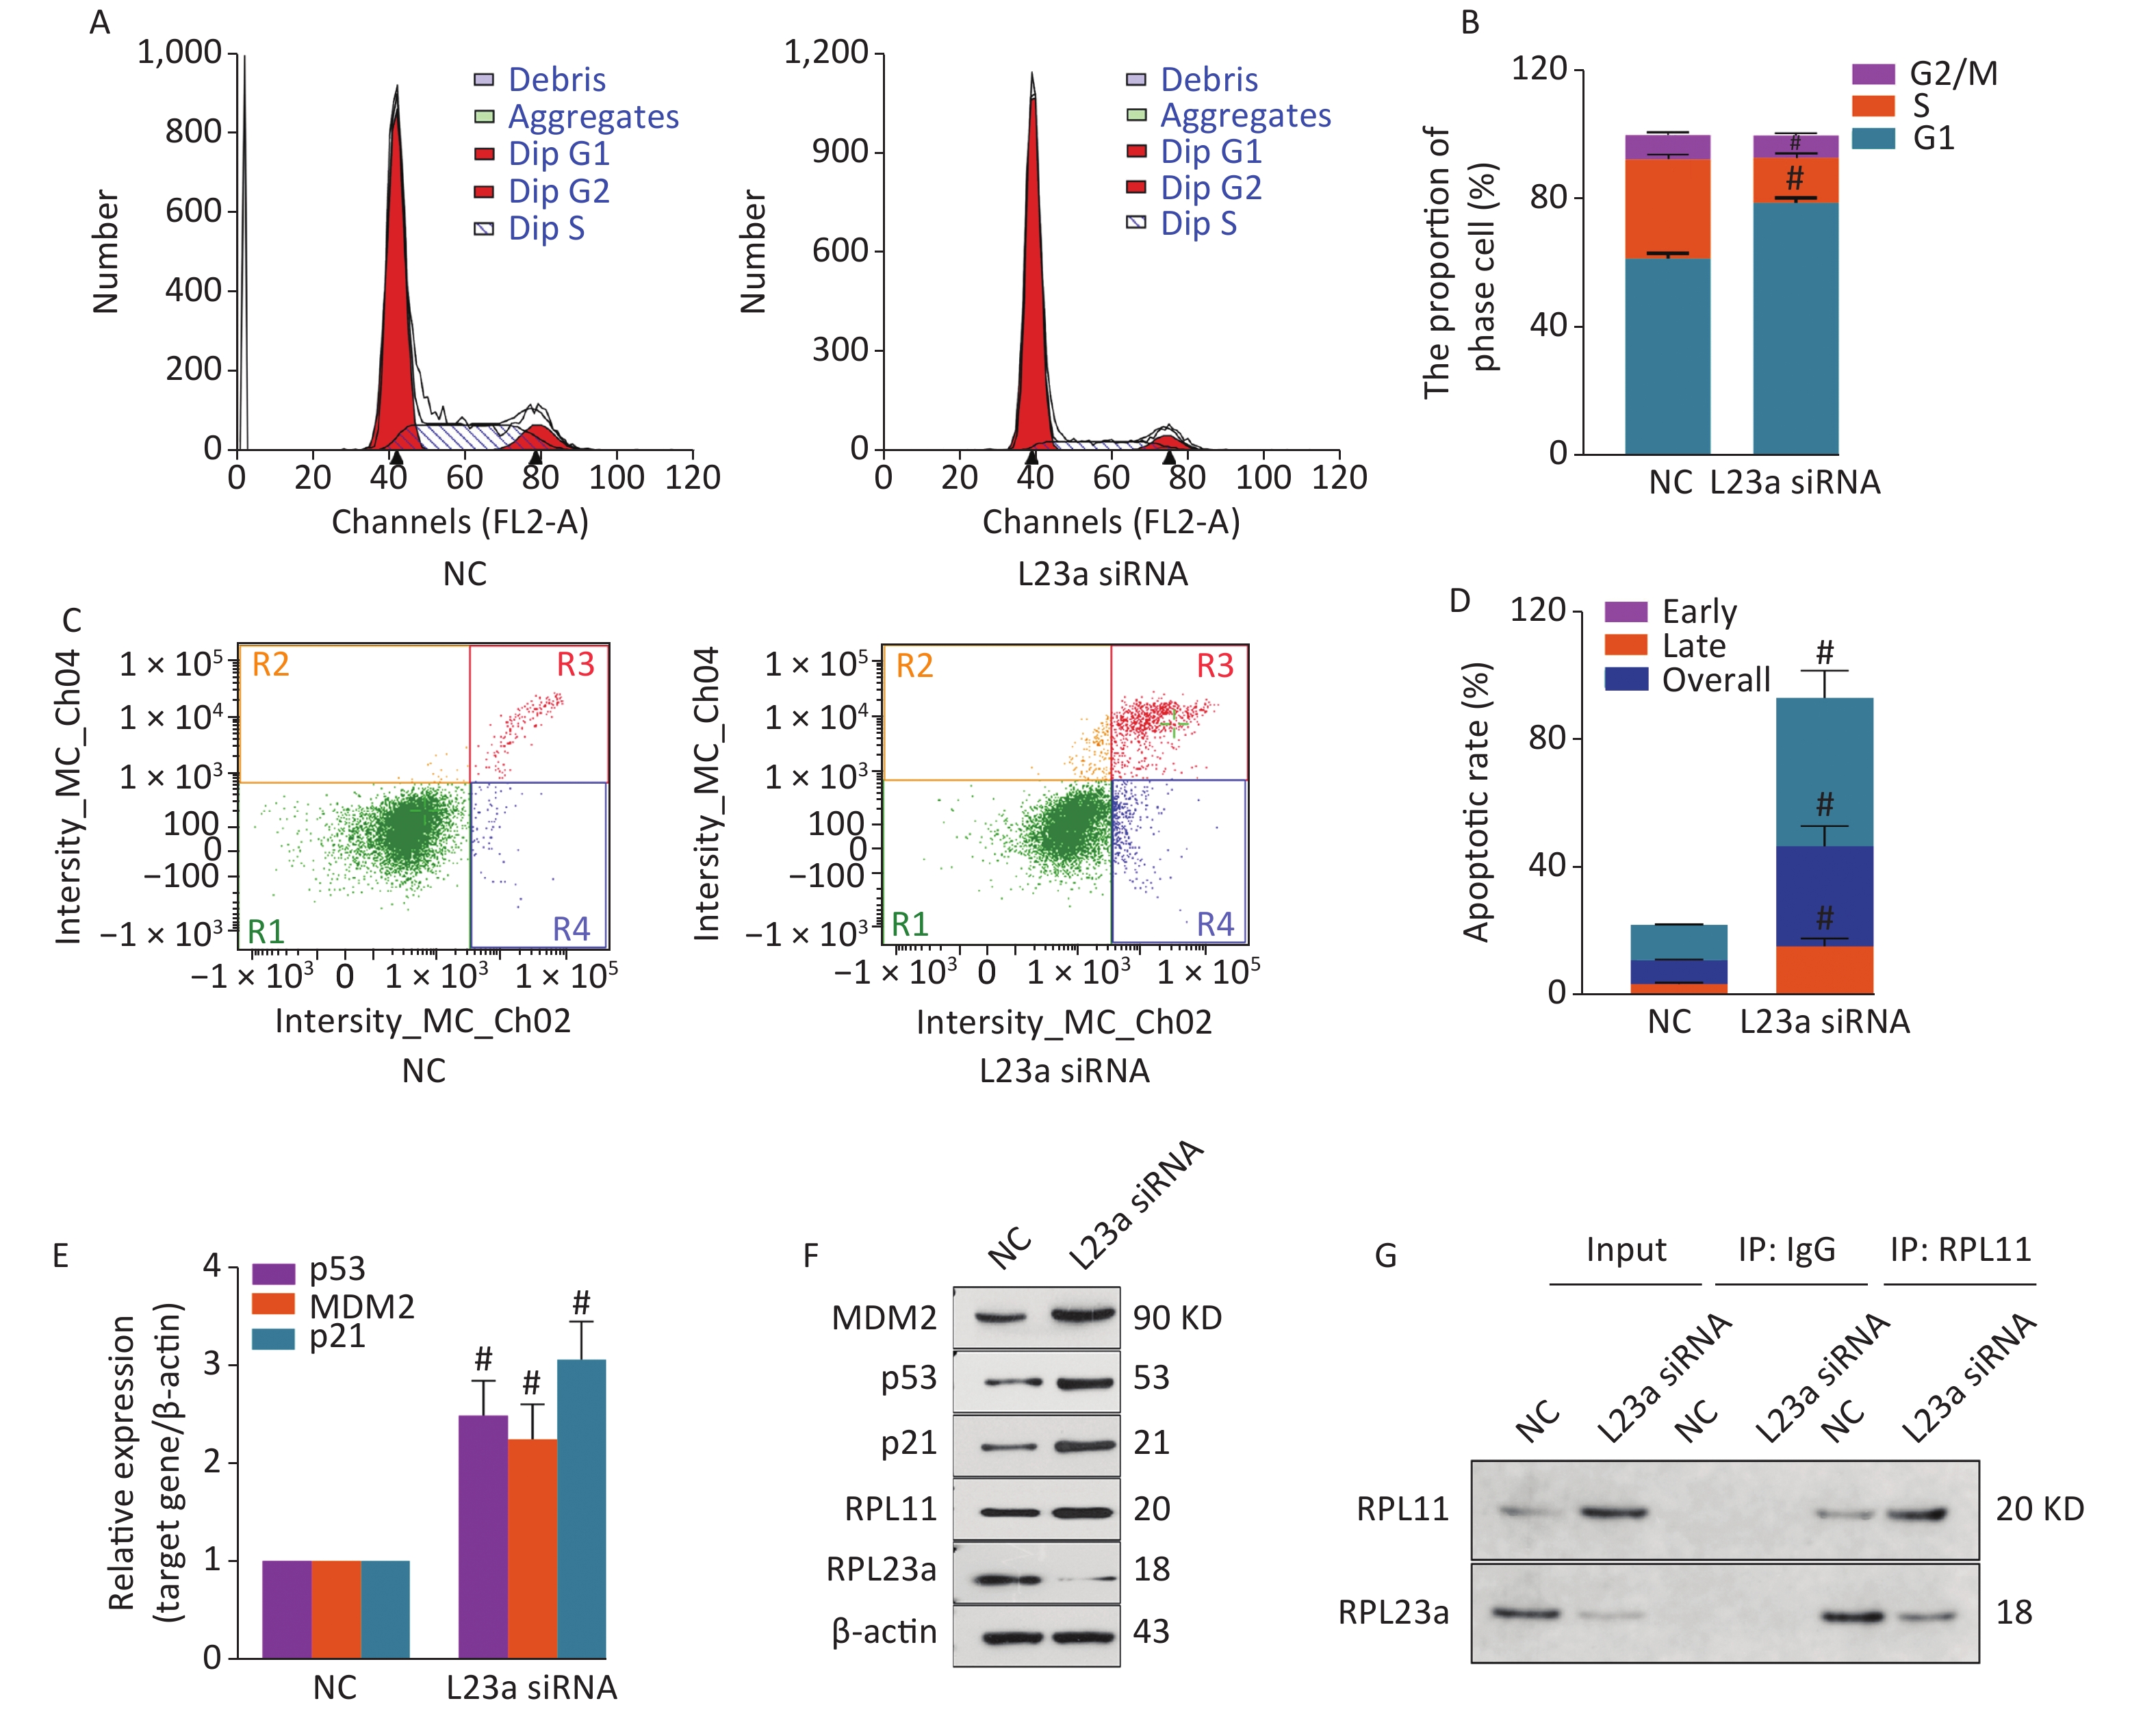
The activation of p53 induced apoptosis and cell cycle arrest in GC-1 cells after knocking down RPL23a. The Figure 5A shows the representative rate of phase by flow cytometer, RPL23a knockdown significantly increased the proportion of the G1 phase (Figure 5B). The Figure 5C shows the representative rate of apoptosis by flow cytometer, RPL23a knockdown significantly increases the early, late and overall apoptotic ratio in GC-1 cells (Figure 5D). These results indicating that RPL23a knockdown cause cell cycle arrest, leading to apoptosis.
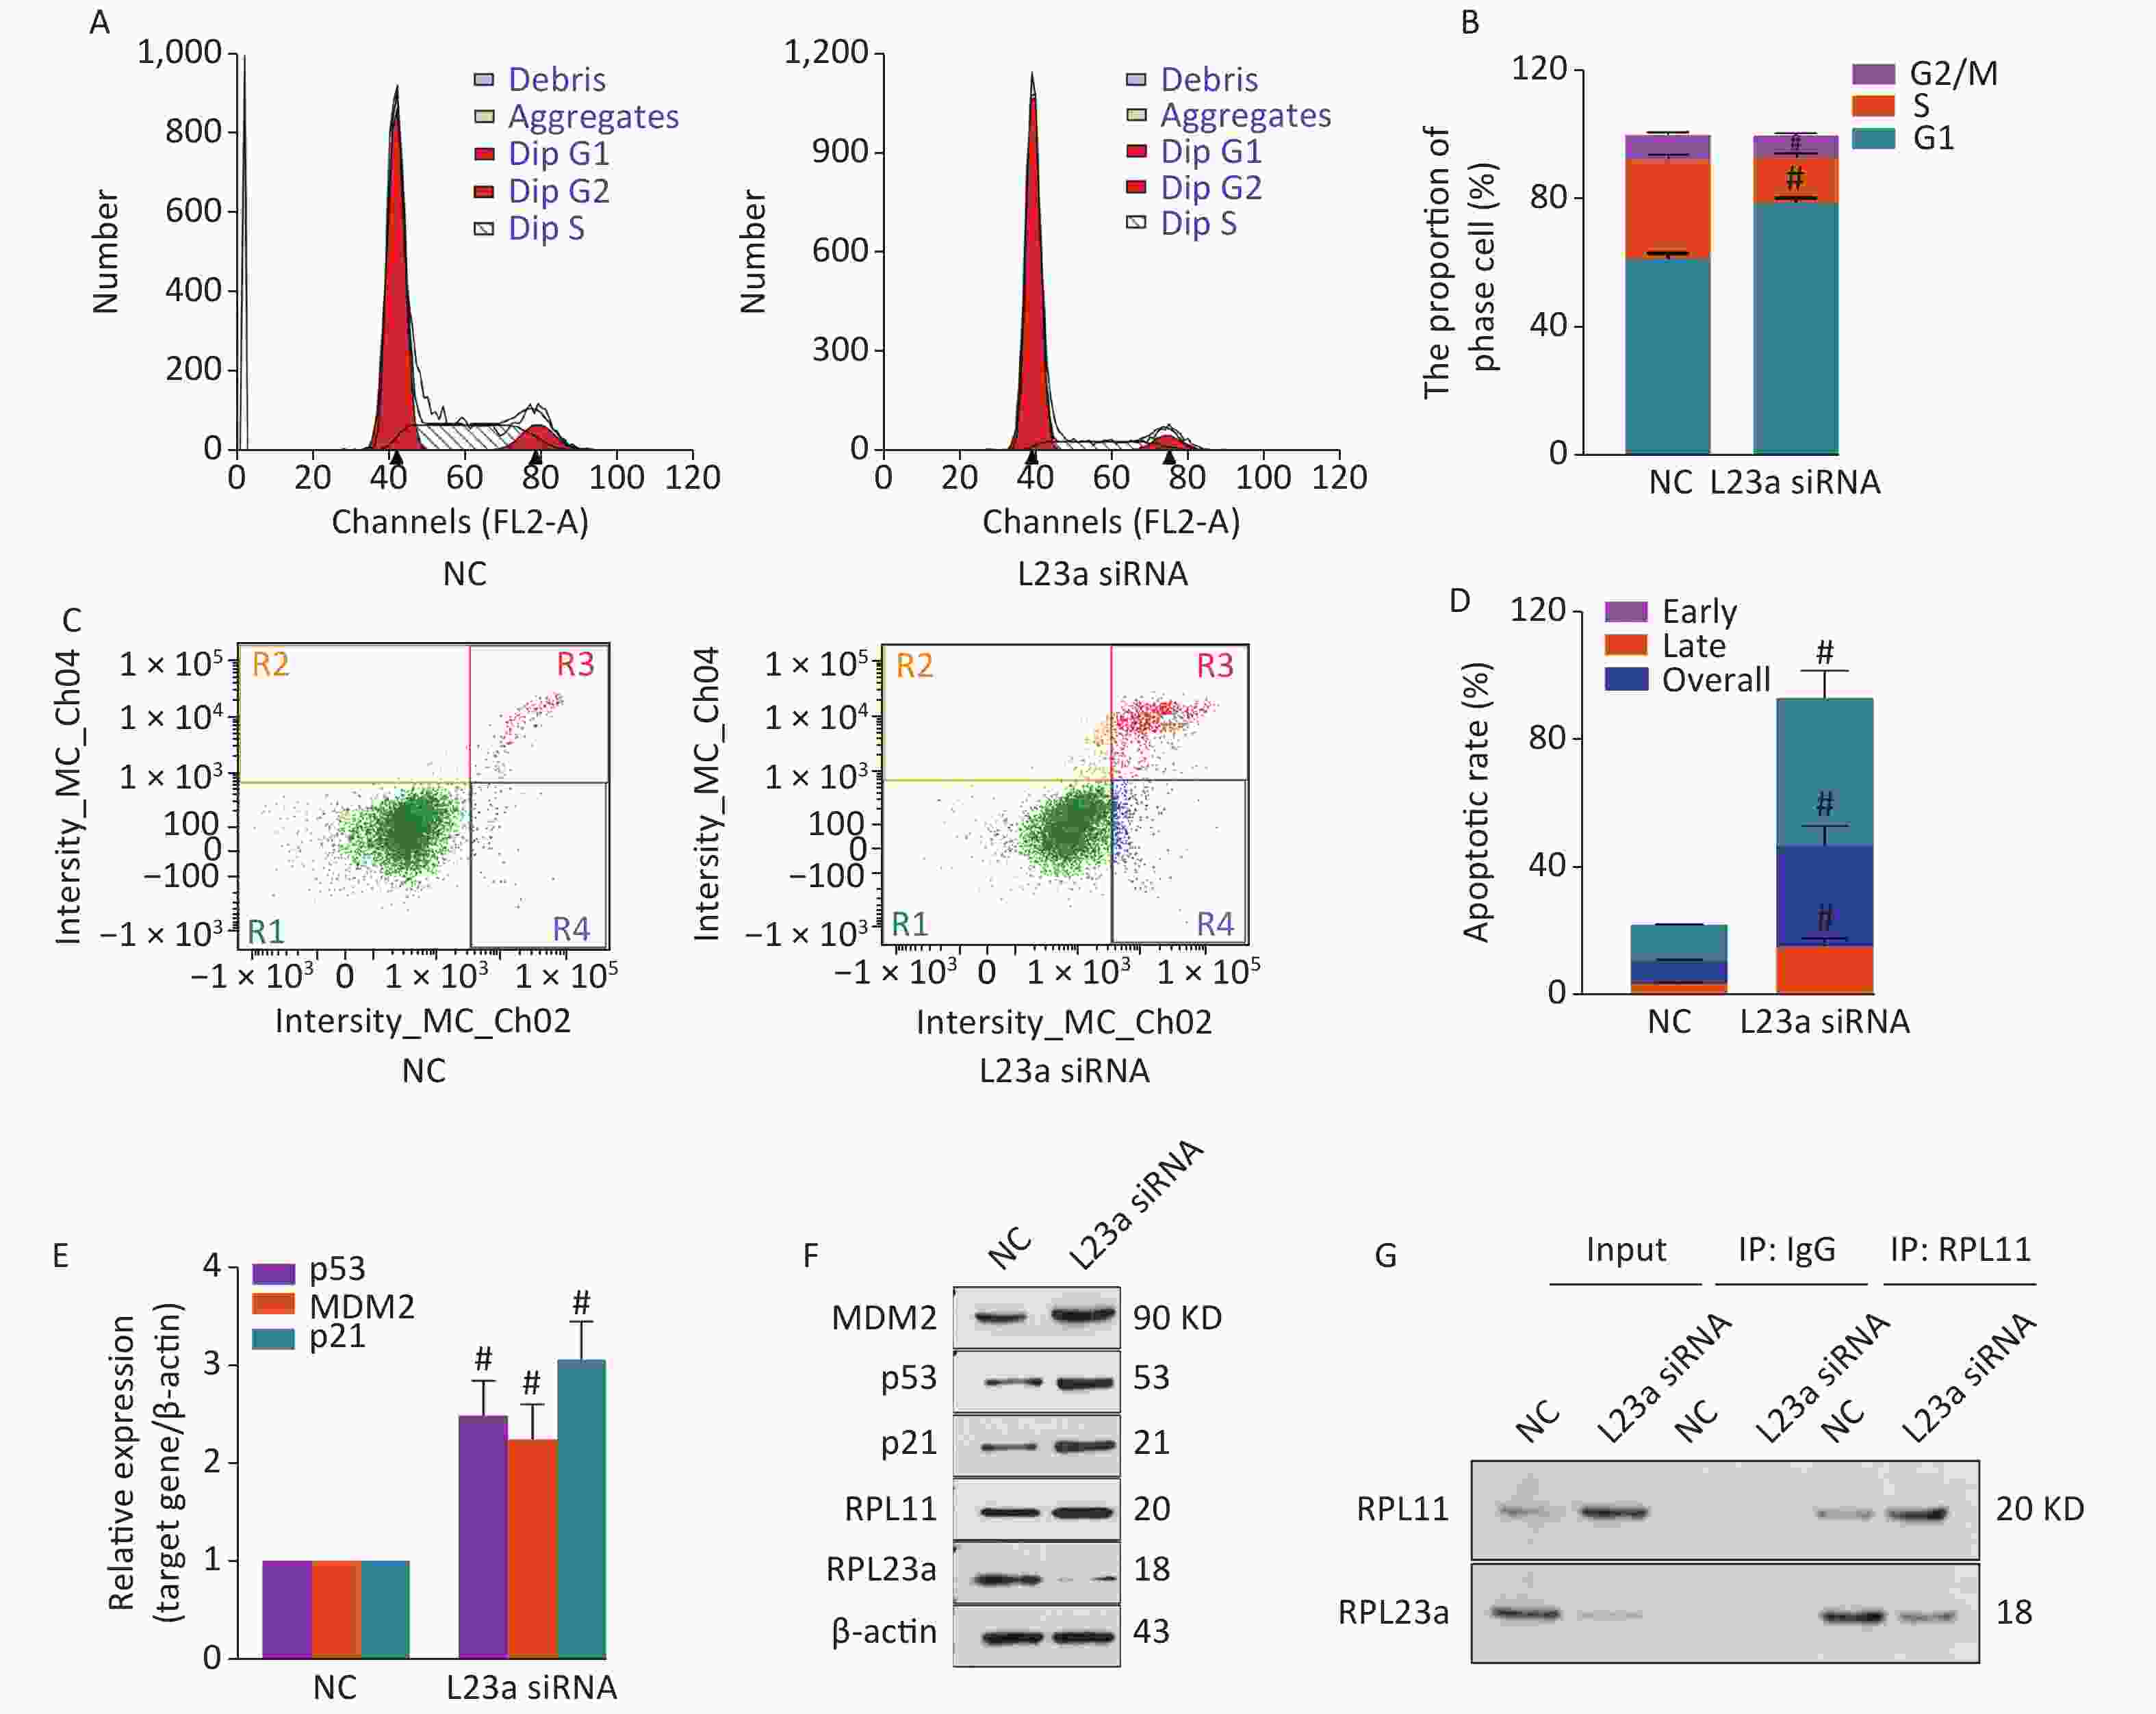
Figure 5. Cell cycle phase of GC-1 cells measured after knocking down RPL23a (A); The ratio of cell phase of GC-1 cells after knocking down RPL23a (B); three dependent repeats were analyzed and values are presented as the mean ± SEM, asterisks and pound signs represent significant differences from controls: #P < 0.001. Apoptotic ratio of GC-1 cells analyzed after knocking down RPL23a (C); The apoptotic ratio of GC-1 cells after knocking down RPL23a (D); three dependent repeats were analyzed and values are presented as the mean ± SEM, asterisks and pound signs represent significant differences from controls: #P < 0.001. Relative expression levels of mRNAs (E); three dependent repeats were analyzed and values are presented as the mean ± SEM, asterisks and pound signs represent significant differences from controls: #P < 0.001. Relative expression levels of proteins after knocking down RPL23a compared to β-actin (F); Endogenous interactions of RPL23a and RPL11 were analyzed by IP (G); cell lysates were immunoprecipitated with anti-RPL11 polyclonal antibody and analyzed by immunoblotting with anti-RPL11 and RPL23a antibodys. Abbreviations: NC, negative control; L23a siRNA, RPL23a siRNA; IP, immunoprecipitation.
-
The expression levels of p53 protein and mRNA, p53 target genes MDM2 and p21 increased significantly, and the expression level of RPL11 protein also significantly increased after knocking down RPL23a (Figure 5E, F). The aforementioned results indicated that the decreased expression level of RPL23a activated p53 and p53 target genes MDM2, and this process was related to RPL11. Therefore, we analyzed the endogenous interactions of binding of RPL11 and RPL23a using immunoprecipitation. The levels of RPL11 and RPL23a complexed of RPL23a knockdown GC-1 cells were markedly reduced in comparison with NC cells (Figure 5G).
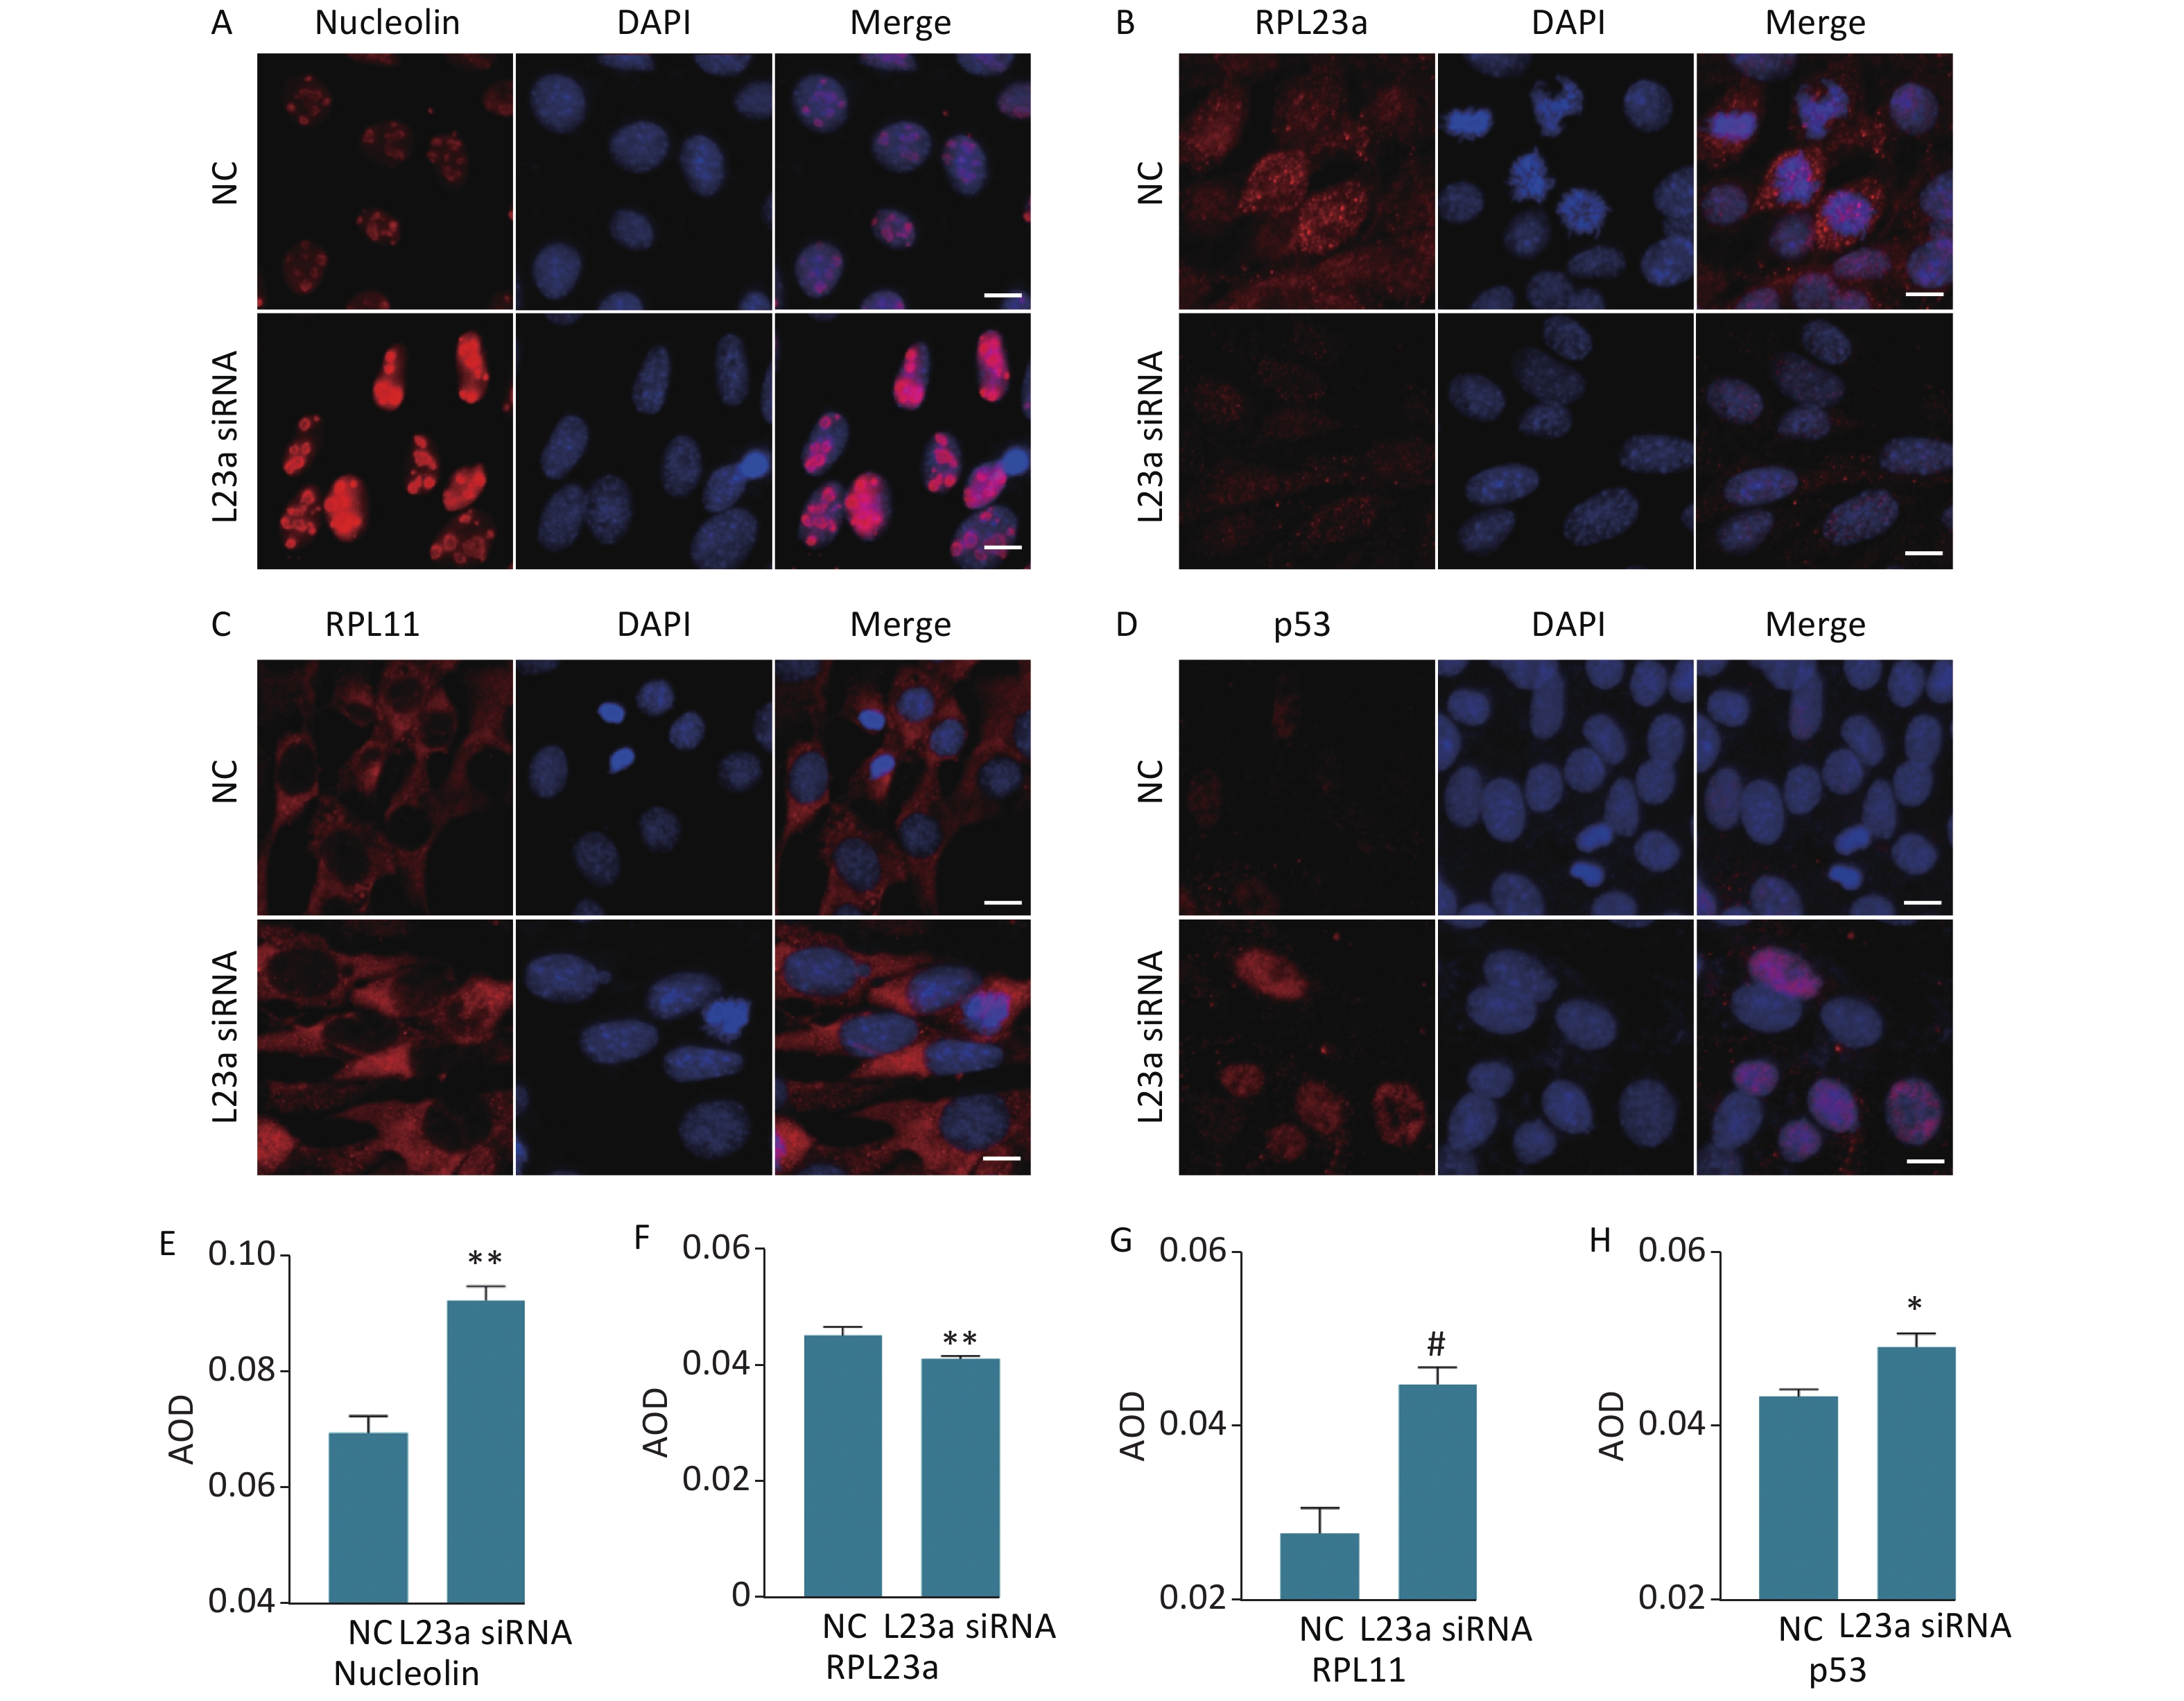
The distribution of NCL, RPL23a, RPL11 and p53 was shown in GC-1 cells after knocking down RPL23a (Figure 6A, B, C, D). The distribution and increased level of NCL (Figure 6A, E) showed the nucleolar structure of the GC-1 cells may be damaged. The fluorescence signals of RPL23a protein in the nucleolus and cytoplasm weakened (Figure 6B, F), while the fluorescence signals of RPL11 and p53 (Figure 6C, D, G, H) enhanced. Therefore, we interpret these results as indicating that decrease of RPL23a induced ribosomal stress, released RPL11 from the ribosomal structure; attenuated the binding of RPL11 and RPL23a; enhanced the binding of RPL11 to MDM2, mediating degradation of p53. Thus, decrease of RPL23a weakened the interaction between RPL23a and RPL11, leading to p53 accumulation.
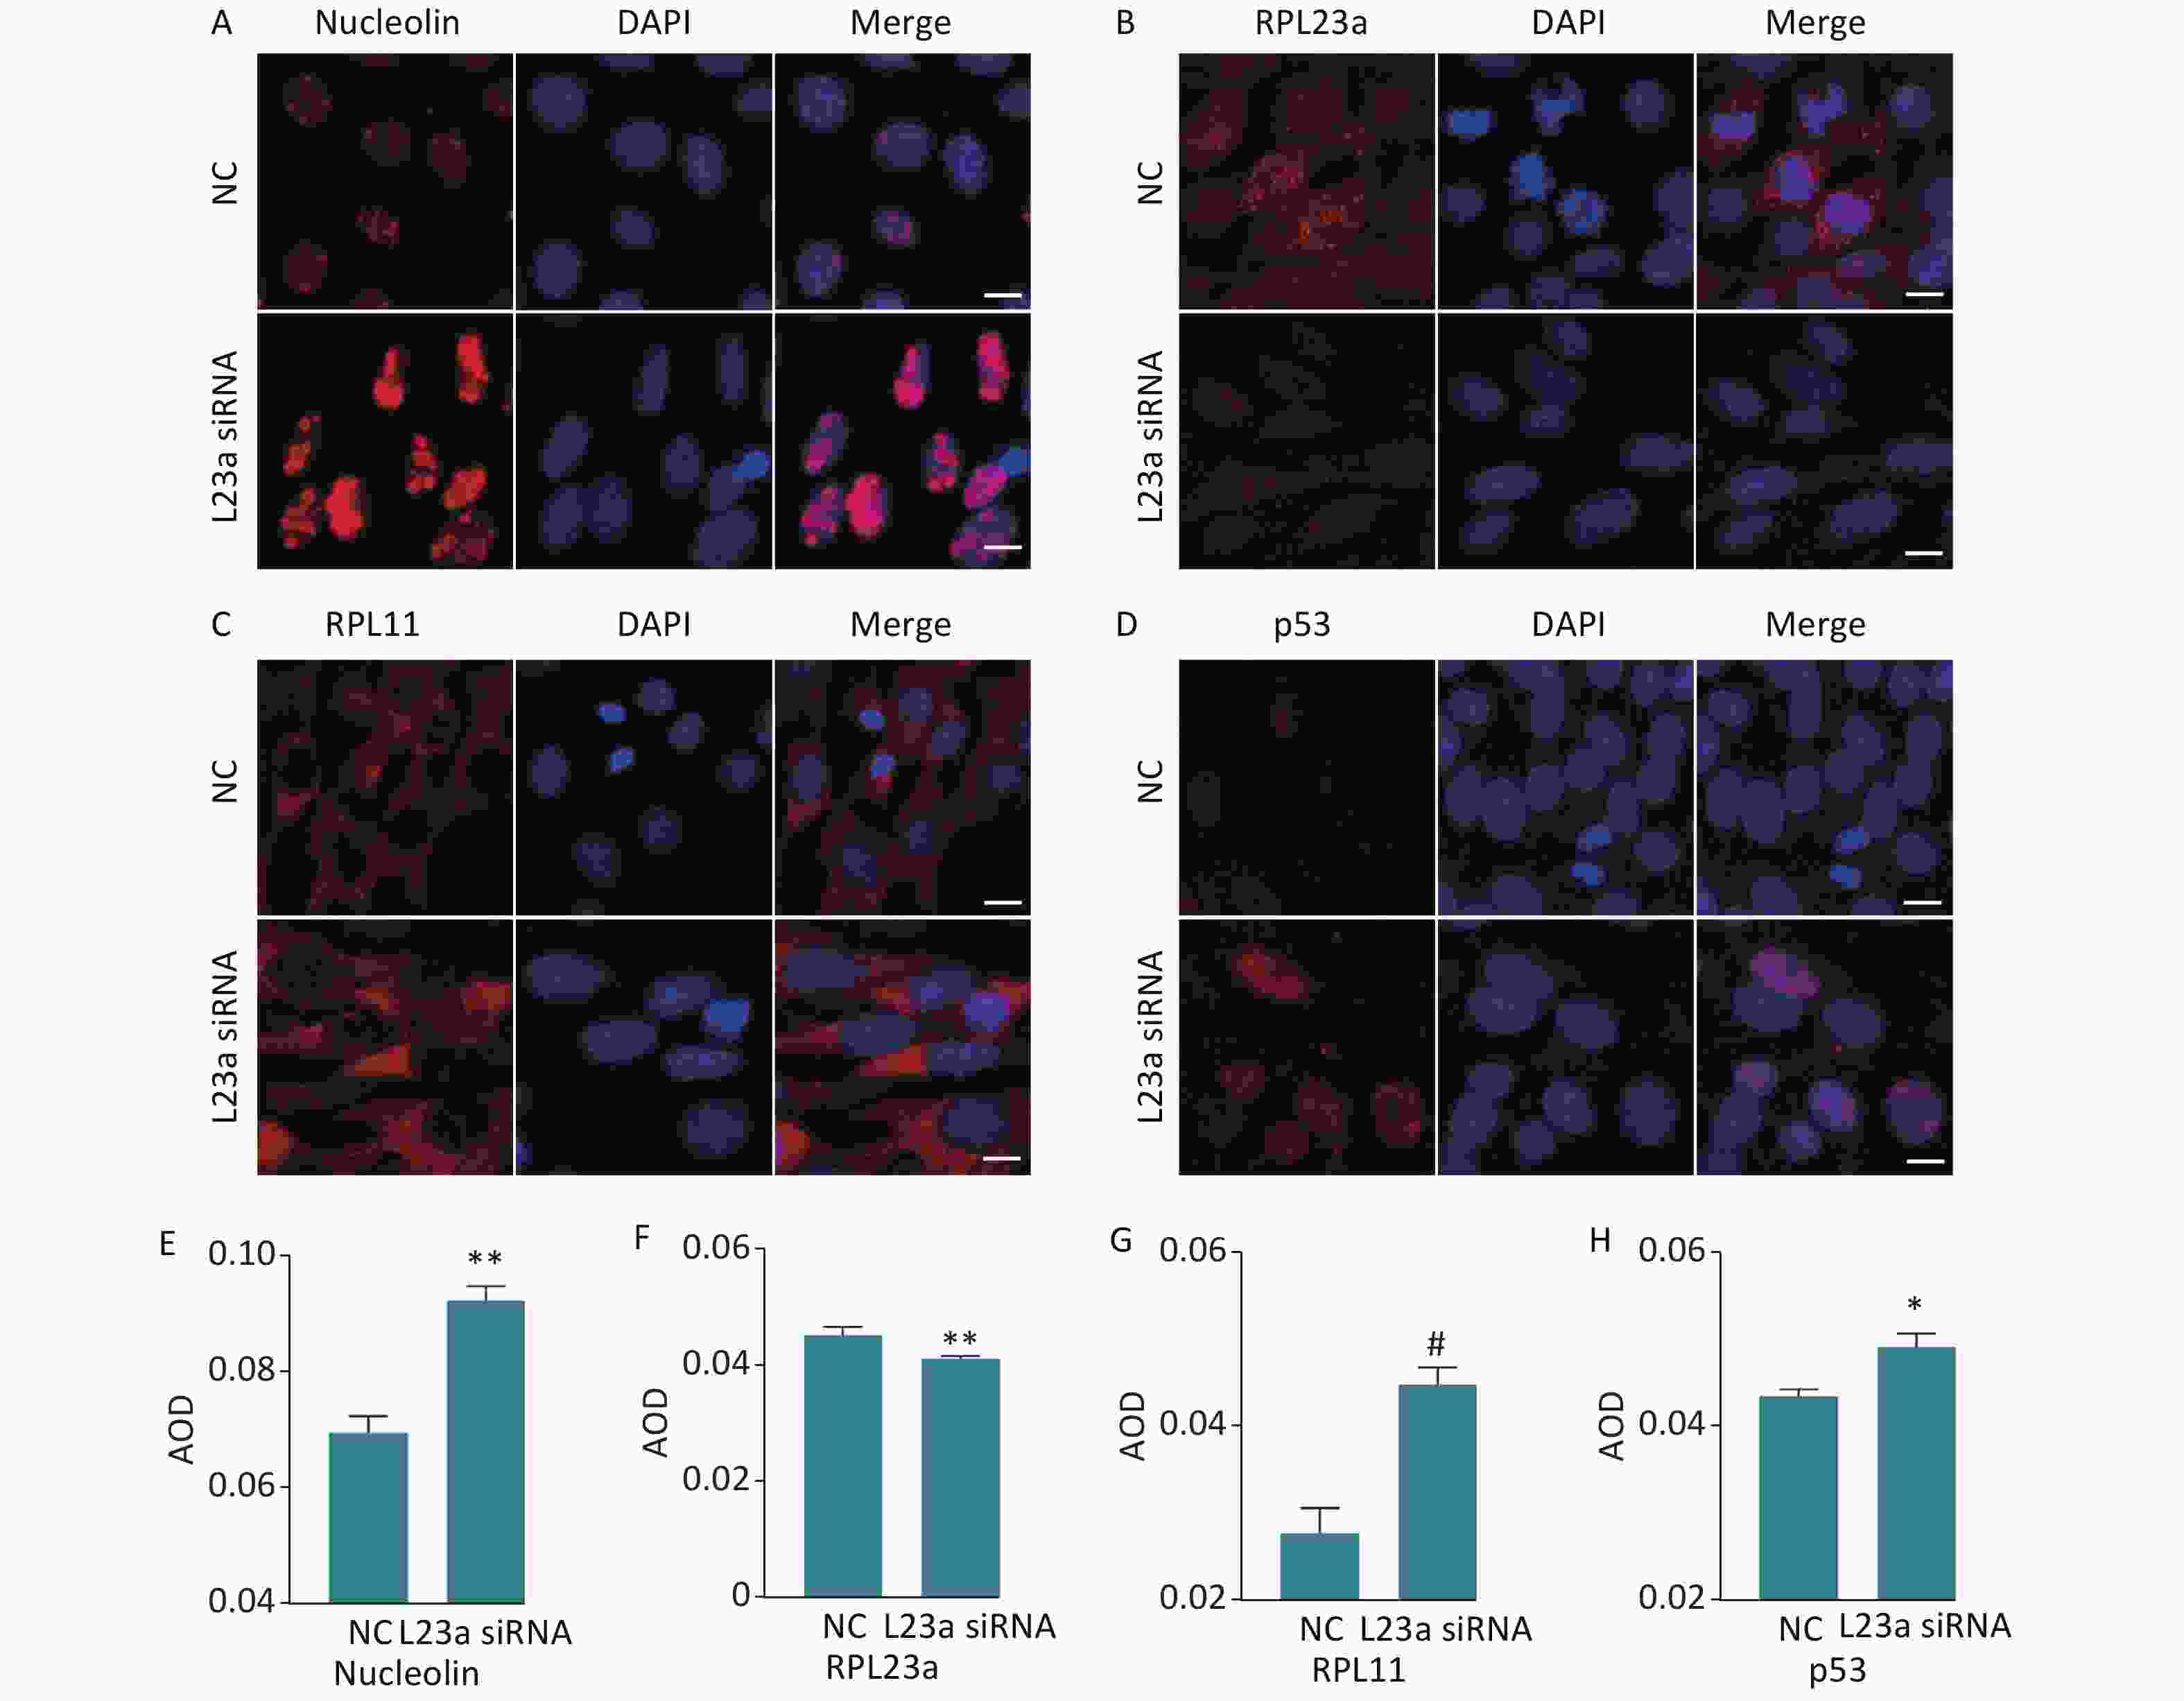
Figure 6. Immunofluorescence analysis of the distribution of RPL23a, RPL11, and p53 in GC-1 cells after knocking down RPL23a (magnification, 400×; scale bar = 10 μm) (A, B, C, D); the nucleus are labeled with DAPI (blue). Quantification of proteins were assessed as mean AOD (E, F, G, H); values represent the average ± SEM from three independent repeats, asterisks signs represent significant differences from controls: *P < 0.05, **P < 0.01, #P < 0.01 with Student's t-test analysis. Abbreviations: NC, negative control; L23a siRNA, RPL23a siRNA.
-
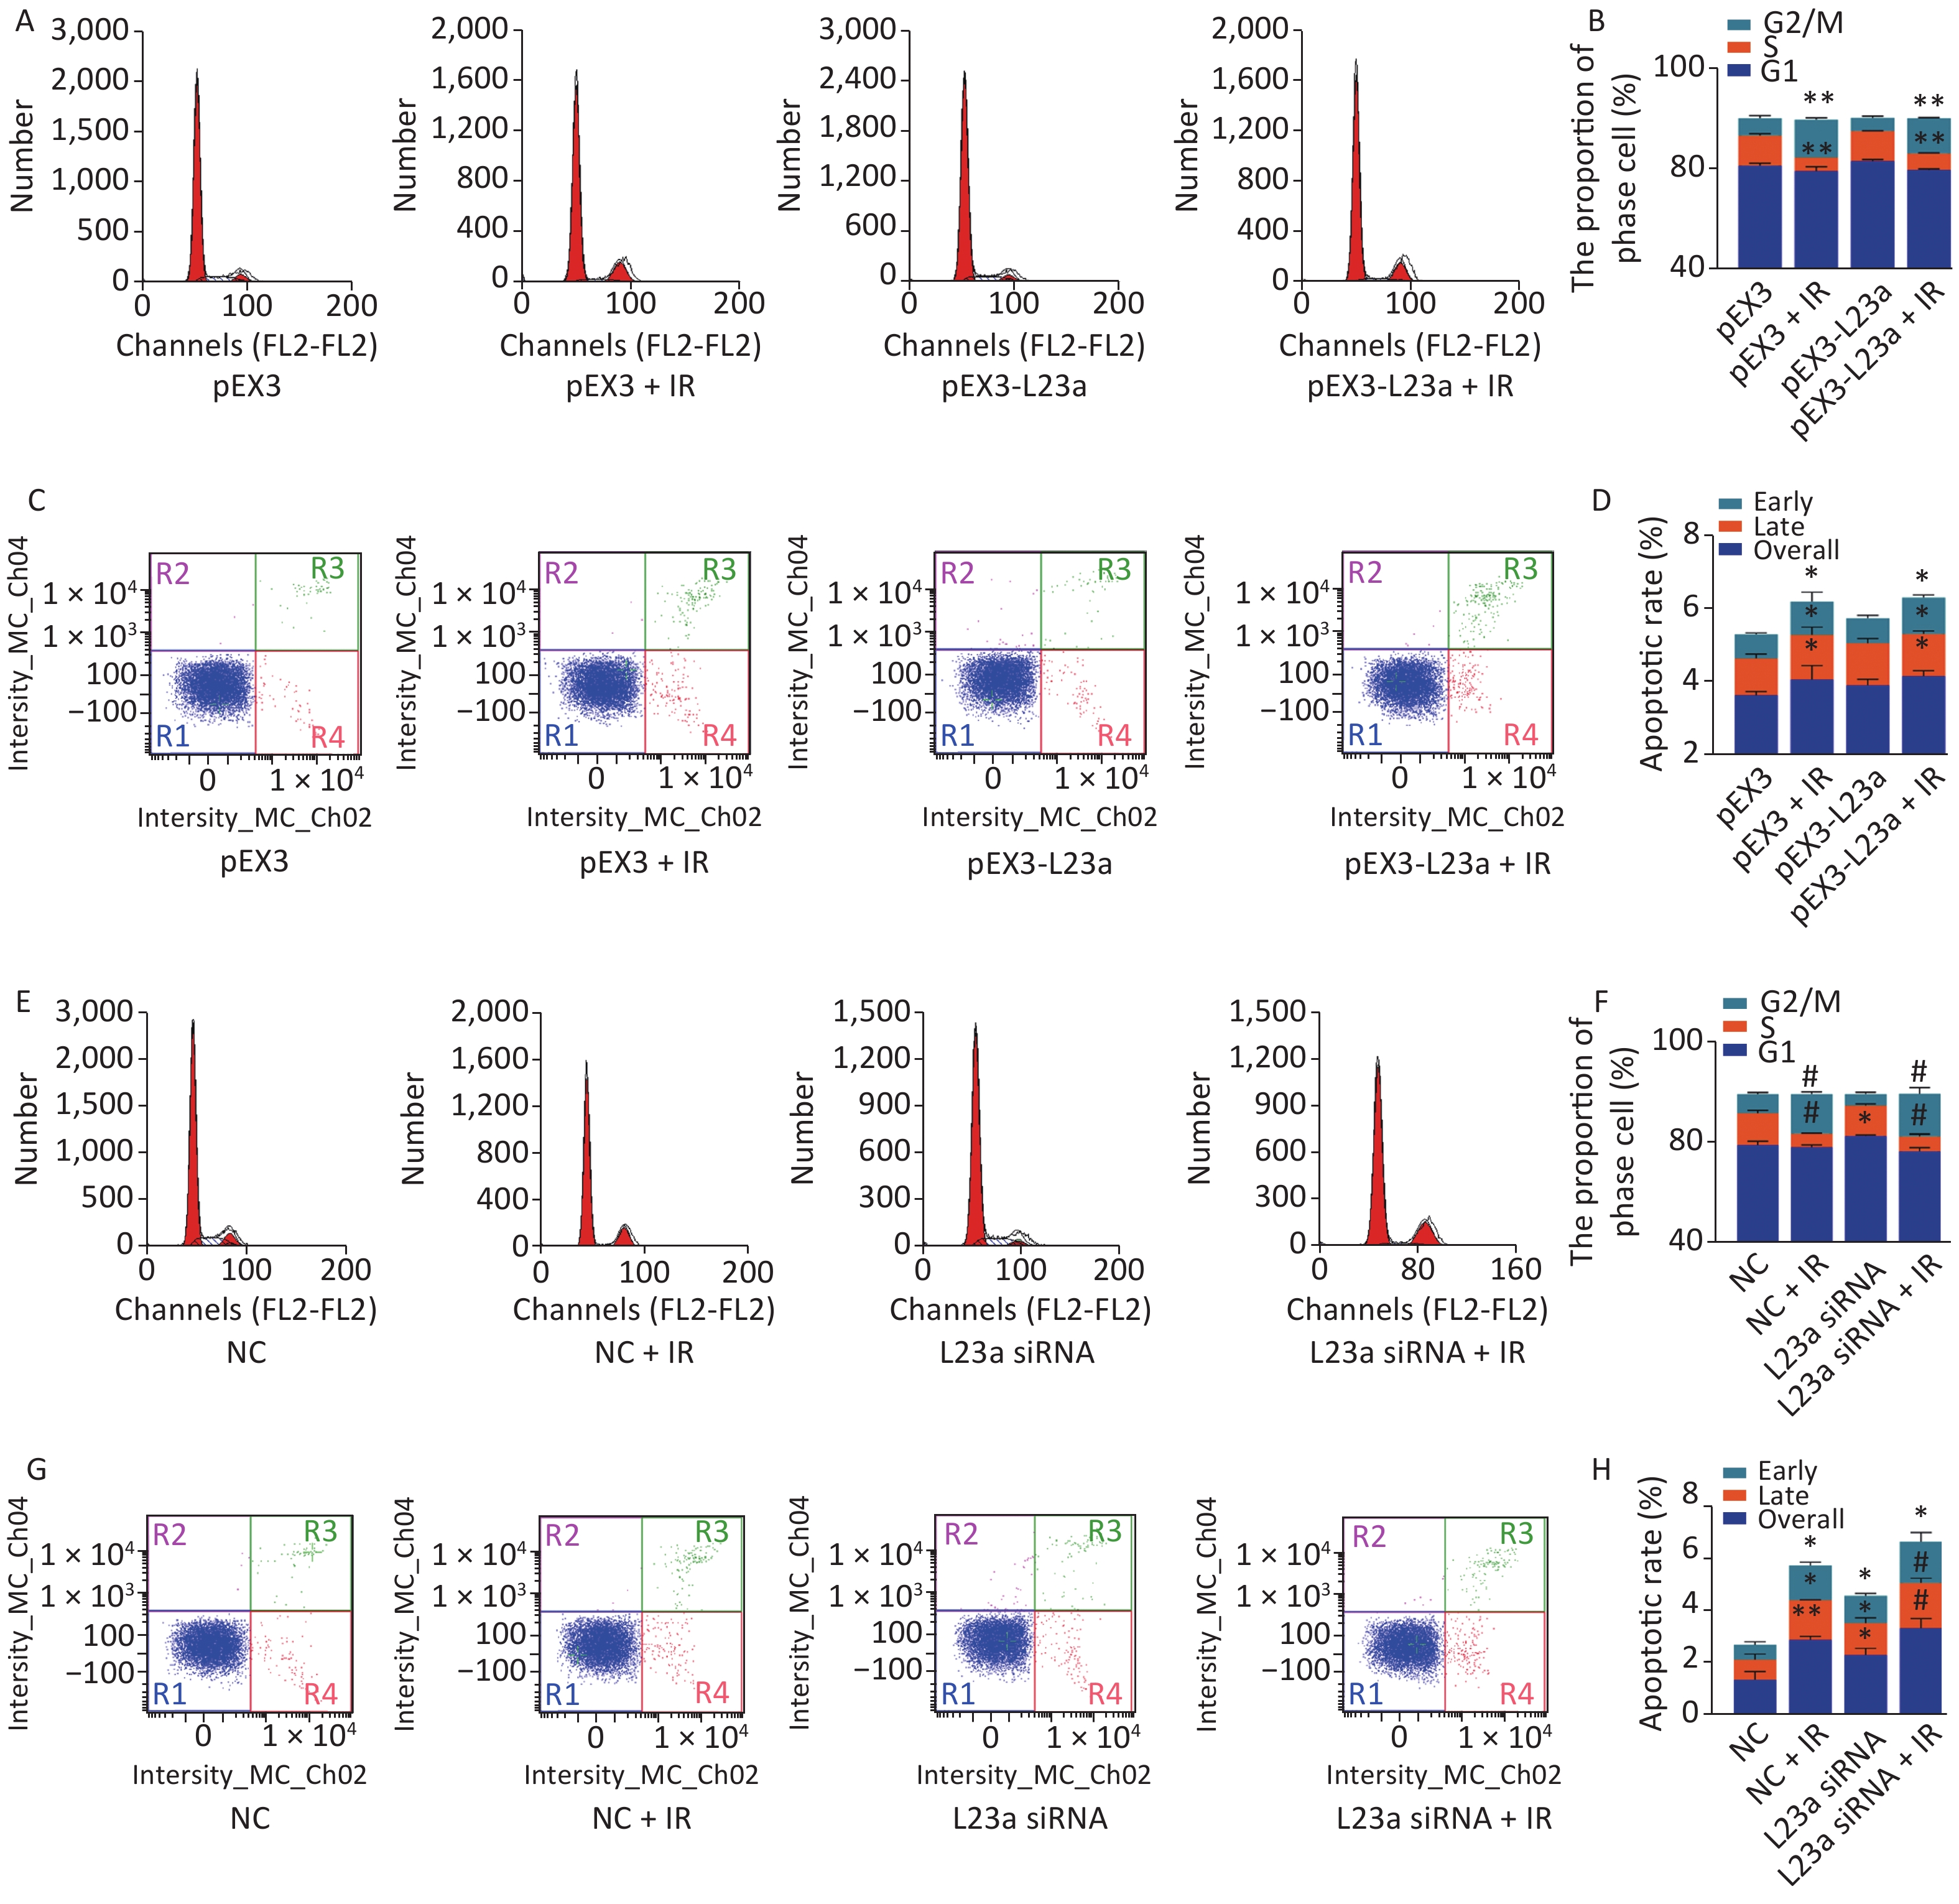
The apoptotic rate of GC-1 cells is highest at 24 h after 4 Gy irradiation, therefore, we selected this time point to examine the effect of overexpression and knockdown of RPL23a on apoptosis and cell cycle phase induced by IR. The overexpression of RPL23a did not aggravate the cell cycle arrest (Figure 7A, B) and apoptosis (Figure 7C, D) induced by IR compared with IR alone. However, the knockdown of RPL23a increased the cell cycle arrest (Figure 7E, F) and the apoptotic ratio of GC-1 cells (Figure 7G, H) in L23a siRNA+IR group compared with IR alone, suggesting that knockdown of RPL23a could increase the radiosensitivity and promote the apoptosis of GC-1 cells.

Figure 7. Cell cycle phase measured in GC-1 cells at 24 h after IR (A); the GC-1 cells were transfected with overexpressed plasmids (pEX3 or pEX3-L23a) for 48 h, then irradiated with 4 Gy IR. The ratio of cell phase of GC-1 cells (B); three independent repeats were analyzed and values are presented as the mean ± SEM, asterisks and pound signs represent significant differences from controls: **P < 0.01. Apoptotic ratio analyzed in GC-1 cells at 24 h after IR (C); the GC-1 cells were transfected with overexpressed plasmids (pEX3 or pEX3-L23a) for 48 h, then irradiated with 4 Gy IR. The apoptotic ratio of GC-1 cells (D); three dependent repeats were analyzed and values are presented as the mean ± SEM, asterisks and pound signs represent significant differences from controls: *P < 0.05. Cell cycle phase measured in GC-1 cells at 24 h after IR (E); the GC-1 cells were transfected with siRNAs for 36 h, then irradiated with 4 Gy IR. The ratio of cell phase of GC-1 cells (F); three independent repeats were analyzed and values are presented as the mean ± SEM, asterisks and pound signs represent significant differences from controls: *P < 0.05, #P < 0.001. Apoptotic ratio analyzed in GC-1 cells at 24 h after IR (G); the GC-1 cells were transfected with siRNAs for 36 h, then irradiated with 4 Gy IR. The apoptotic ratio of GC-1 cells (H); three dependent repeats were analyzed and values are presented as the mean ± SEM, asterisks and pound signs represent significant differences from controls: *P < 0.05, **P < 0.01, #P < 0.001. Abbreviations: pEX3-L23a, pEX3-RPL23a; NC, negative control; L23a siRNA, RPL23a siRNA.
-
The levels of MDM2, RPL11, p53 and p21 were significant increased in L23a siRNA group compared with NC, and the expression of these proteins were higher in L23a siRNA+IR group than IR alone. These results show that RPL23a could regulate apoptosis of GC-1 cells and the knockdown of RPL23a can promote apoptosis of GC-1 cells induced by IR via RPL23a-RPL11-MDM2-p53 pathway. The accumulation of p53 increases the transcription of p21, leading to cell cycle arrest. Increased cleavage of caspase 3, caspase 9 and Cyc was observed in both IR and RPL23a knockdown groups. PUMA and Bax, were increased in both IR and RPL23a knockdown groups (Figure 8C, D) and the levels of these proteins were higher in L23a siRNA+IR group compared IR group (Figure 8E, F). Taken together, these results indicated that, via RPL23a-RPL11-MDM2-p53 pathway regulation, the p53 played a crucial role in mitochondrial apoptotic pathway of spermatogonia apoptosis and the knockdown of RPL23a can enhance the mitochondrial apoptotic pathway induced by IR.
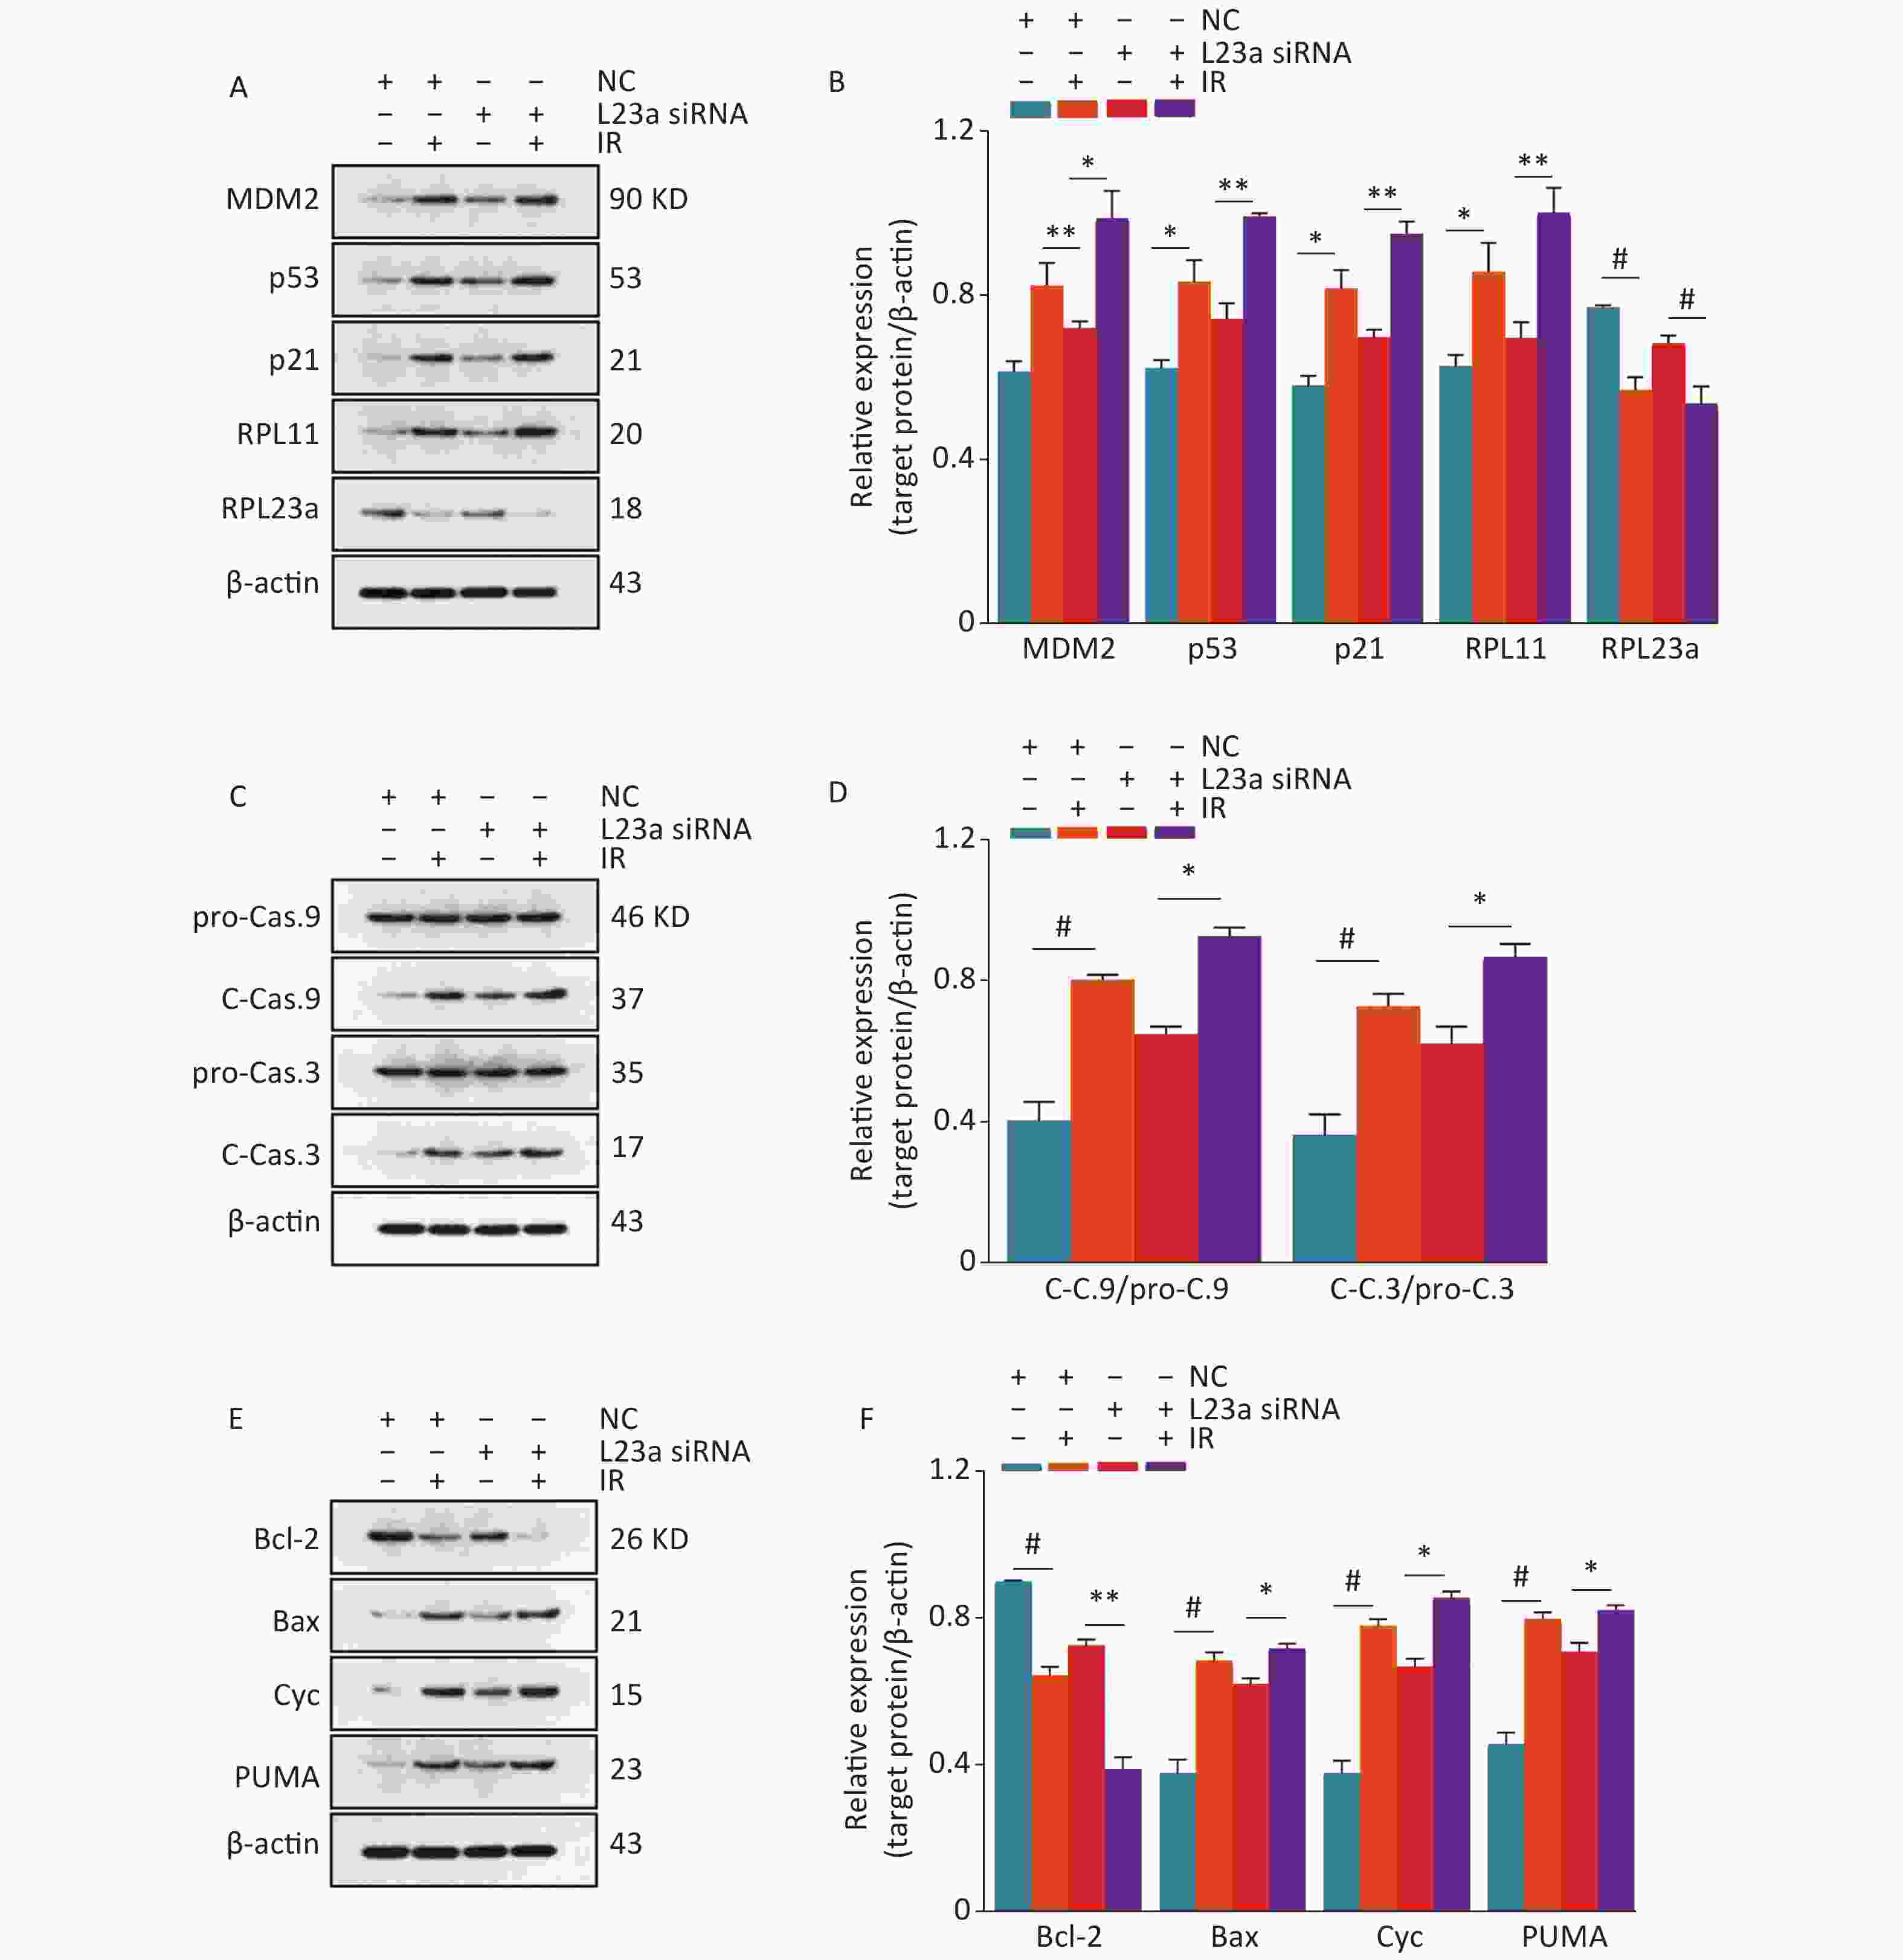
Figure 8. Immunoblotting analysis of MDM2, p53, p21, RPL11, and RPL23a expression in GC-1 cells at 24 h after IR (A); the GC-1 cells were transfected with siRNA for 36 h, then irradiated with 4 Gy IR. Relative expression levels of proteins as compared to β-actin (B); three gels were analyzed and values are presented as the mean ± SEM, asterisks and pound signs represent significant differences from controls: *P < 0.05, **P < 0.01, #P < 0.001. Immunoblotting analysis of caspase 3 and caspase 9 expression in GC-1 cells at 24 h after IR (C); the GC-1 cells were transfected with siRNA for 36 h, then irradiated with 4 Gy IR. Relative expression levels of proteins as compared to β-actin (D); three gels were analyzed and values are presented as the mean ± SEM, asterisks and pound signs represent significant differences from controls: *P < 0.05, #P < 0.001. Immunoblotting analysis of Bax, Bcl-2, Cyc and PUMA expression in GC-1 cells at 24 h after IR (E); the GC-1 cells were transfected with siRNA for 36 h, then irradiated with 4 Gy IR. Relative expression levels of proteins as compared to β-actin (F); three gels were analyzed and values are presented as the mean ± SEM, asterisks and pound signs represent significant differences from controls: *P < 0.05, **P < 0.01, #P < 0.001. Abbreviations: IR, ionizing radiation; NC, negative control; L23a siRNA, RPL23a siRNA; Cyc, cytochrome C.
-
Apoptosis plays an imperative role in the regulation of spermatogenesis mainly by affecting the process of spermatogonia death[29]. Spermatogonia apoptosis is mediated by p53, which must precisely control the temporal and spatial activation and inhibition of p53 in order to eliminate excess spermatogonia, while retaining an adequate abundance of spermatogonia to produce sufficient numbers of sperm[30]. Although excessive spermatogonia are eliminated through apoptosis to maintain an appropriate ratio of germ cells to Sertoli cells, excessive apoptosis of spermatogonia can result in azoospermia and male infertility[31].
Radiation can induce apoptosis and accelerate or delay differentiation of germ cells, resulting in cell death[25]. This process may be influenced by ribosomal stress, which results in p53 activation and causes some of the RPs that make up the ribosomal subunits to freely enter the nucleus without being degraded by the proteasomes, and directly or indirectly bind to MDM2, which inhibits E3 ubiquitin ligase activity and activates p53 through the MDM2-p53 pathway[32-34]. Among the RPs that bind to MDM2, RPL11 is an effector in response to ribosomal stress and its accumulation can inhibit MDM2 and activate p53[35]. RPL11 mRNA translation could be up-regulated by inhibition of 40S ribosomal biogenesis, which leads to RPL11 accumulation in the nucleoplasm[36]. RPL11 can remain stable in the nucleoplasm by forming a complex with RPL5 and 5S rRNA[37]. Some RPs interact with RPL5 or RPL11 to form the RPs-RPL5/RPL11 complex[17]. Therefore, we propose that ribosomal stress promotes the dissociation of RPs from the complex that enhances the interactions of the RPL5/RPL11 complex with MDM2 and inhibits MDM2 E3 ligase activity to increase the transcriptional activity of p53, thereby inducing cell cycle arrest at G1/S and G2/M phases.
RPL23 and RPL23a belong to the L23P family of RPs[18]. Previous studies have confirmed that RPL23 can directly interact with MDM2 and overexpression of RPL23 can enhance this interaction and inhibit MDM2-mediated ubiquitination degradation of p53, and activate p53 in tumor cells via the RPL23-MDM2-p53 pathway[38]. Understandably, the ribosomal proteins (RPs) interact with MDM2-p53 pathway that monitors the abnormal ribosome biogenesis, which constitutes a “surveillance network”. The previous study has showed that overexpression of RPL23 promotes its binding to MDM2 and inhibits the ubiquitination degradation of p53 by MDM2, resulting in p53 accumulation. In this study, although the G1 phase arrest and apoptosis have slightly increased in RPL23a overexpression cells, however, the overexpression of RPL23a did not aggravate the G1 phase arrest and apoptosis induced by IR. Conversely, the knockdown of RPL23a promoted the G1 phase arrest and apoptosis induced by IR. Therefore, we focused on the effect of RPL23a knockdown on p53 accumulation induced by IR.
Knockdown of RPL23a activated p53 and p53 target genes MDM2 and p21, increased the proportion of the G1 phase and decreased the proportion of S phase, moreover, increased the apoptotic rate, indicating that RPL23a knockdown could activate p53 and cause cell cycle arrest, leading to apoptosis. This process is caused by the reduced binding of RPL23a and RPL11, leading to enhance the binding of RPL11 and MDM2, and inhibits MDM2 E3 ligase activity to stabilize p53. Activation of p53 induces cell cycle arrest, and activates the Bax-mediated mitochondrial apoptosis pathway.
In this study, the RPL23a expression was reduced in spermatogonia after IR. Hence, the possible relationship between RPL23a expression and p53 activation in spermatogonia apoptosis was further investigated. IR can promote apoptosis of spermatogonia, reduce the expression of RPL23a, and increase the expression of p53, indicating that decreased expression of RPL23a is related to p53-induced apoptosis of spermatogonia. These results suggested a potential relationship between RPL23a expression and spermatogonia apoptosis in response to IR, and that there may be an alternative pathway, other than RPL23a-MDM2-p53, which regulates p53 activation. Accordingly, reduction of RPL23a expression induced by IR resulted in weakened binding of RPL23a with RPL11, leading to enhance binding of RPL11 with MDM2, which stabilizes and activates p53 to induce spermatogonia apoptosis.
In summary, IR-induced spermatogonia apoptosis may be related to reduced RPL23a expression. The binding of RPL23a and RPL11 was weakened by IR-induced reduction of RPL23a expression, which may indirectly activate the RPL11-MDM2-p53 pathway that causes p53 activation to induce spermatogonia apoptosis. These results provide new insights in to the relationship between RPs and p53 activation in spermatogonia apoptosis induced by IR.
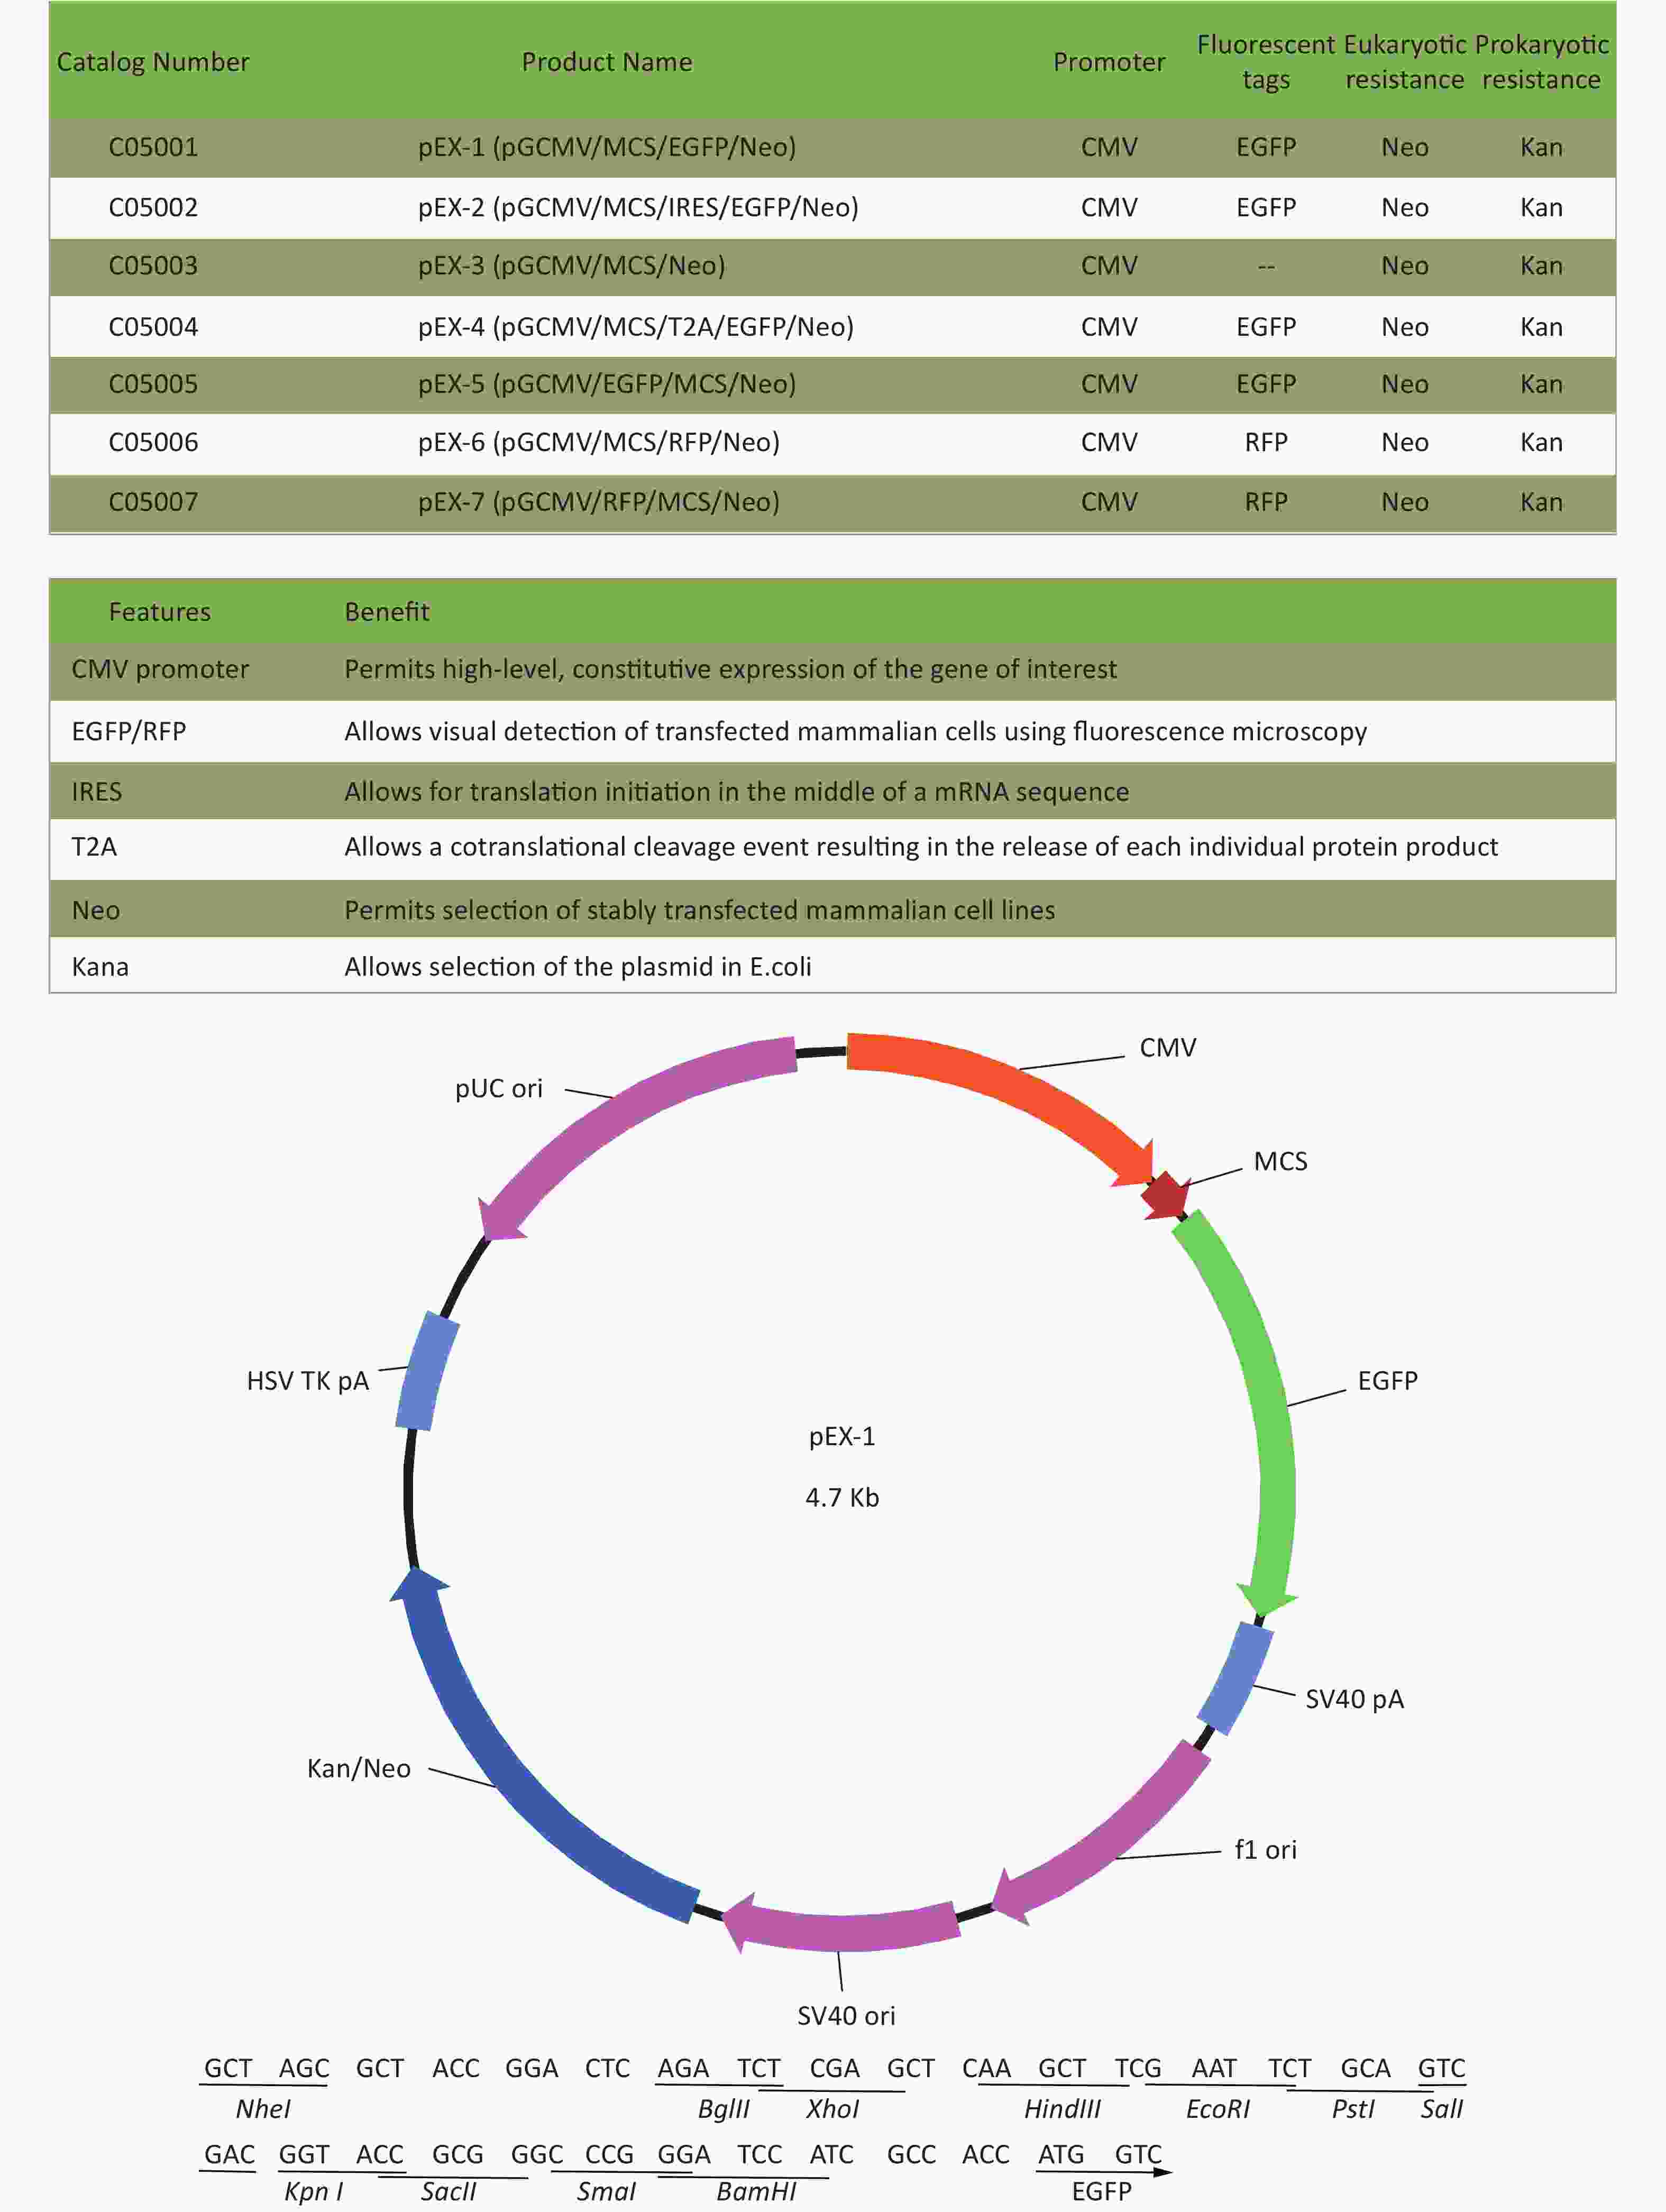
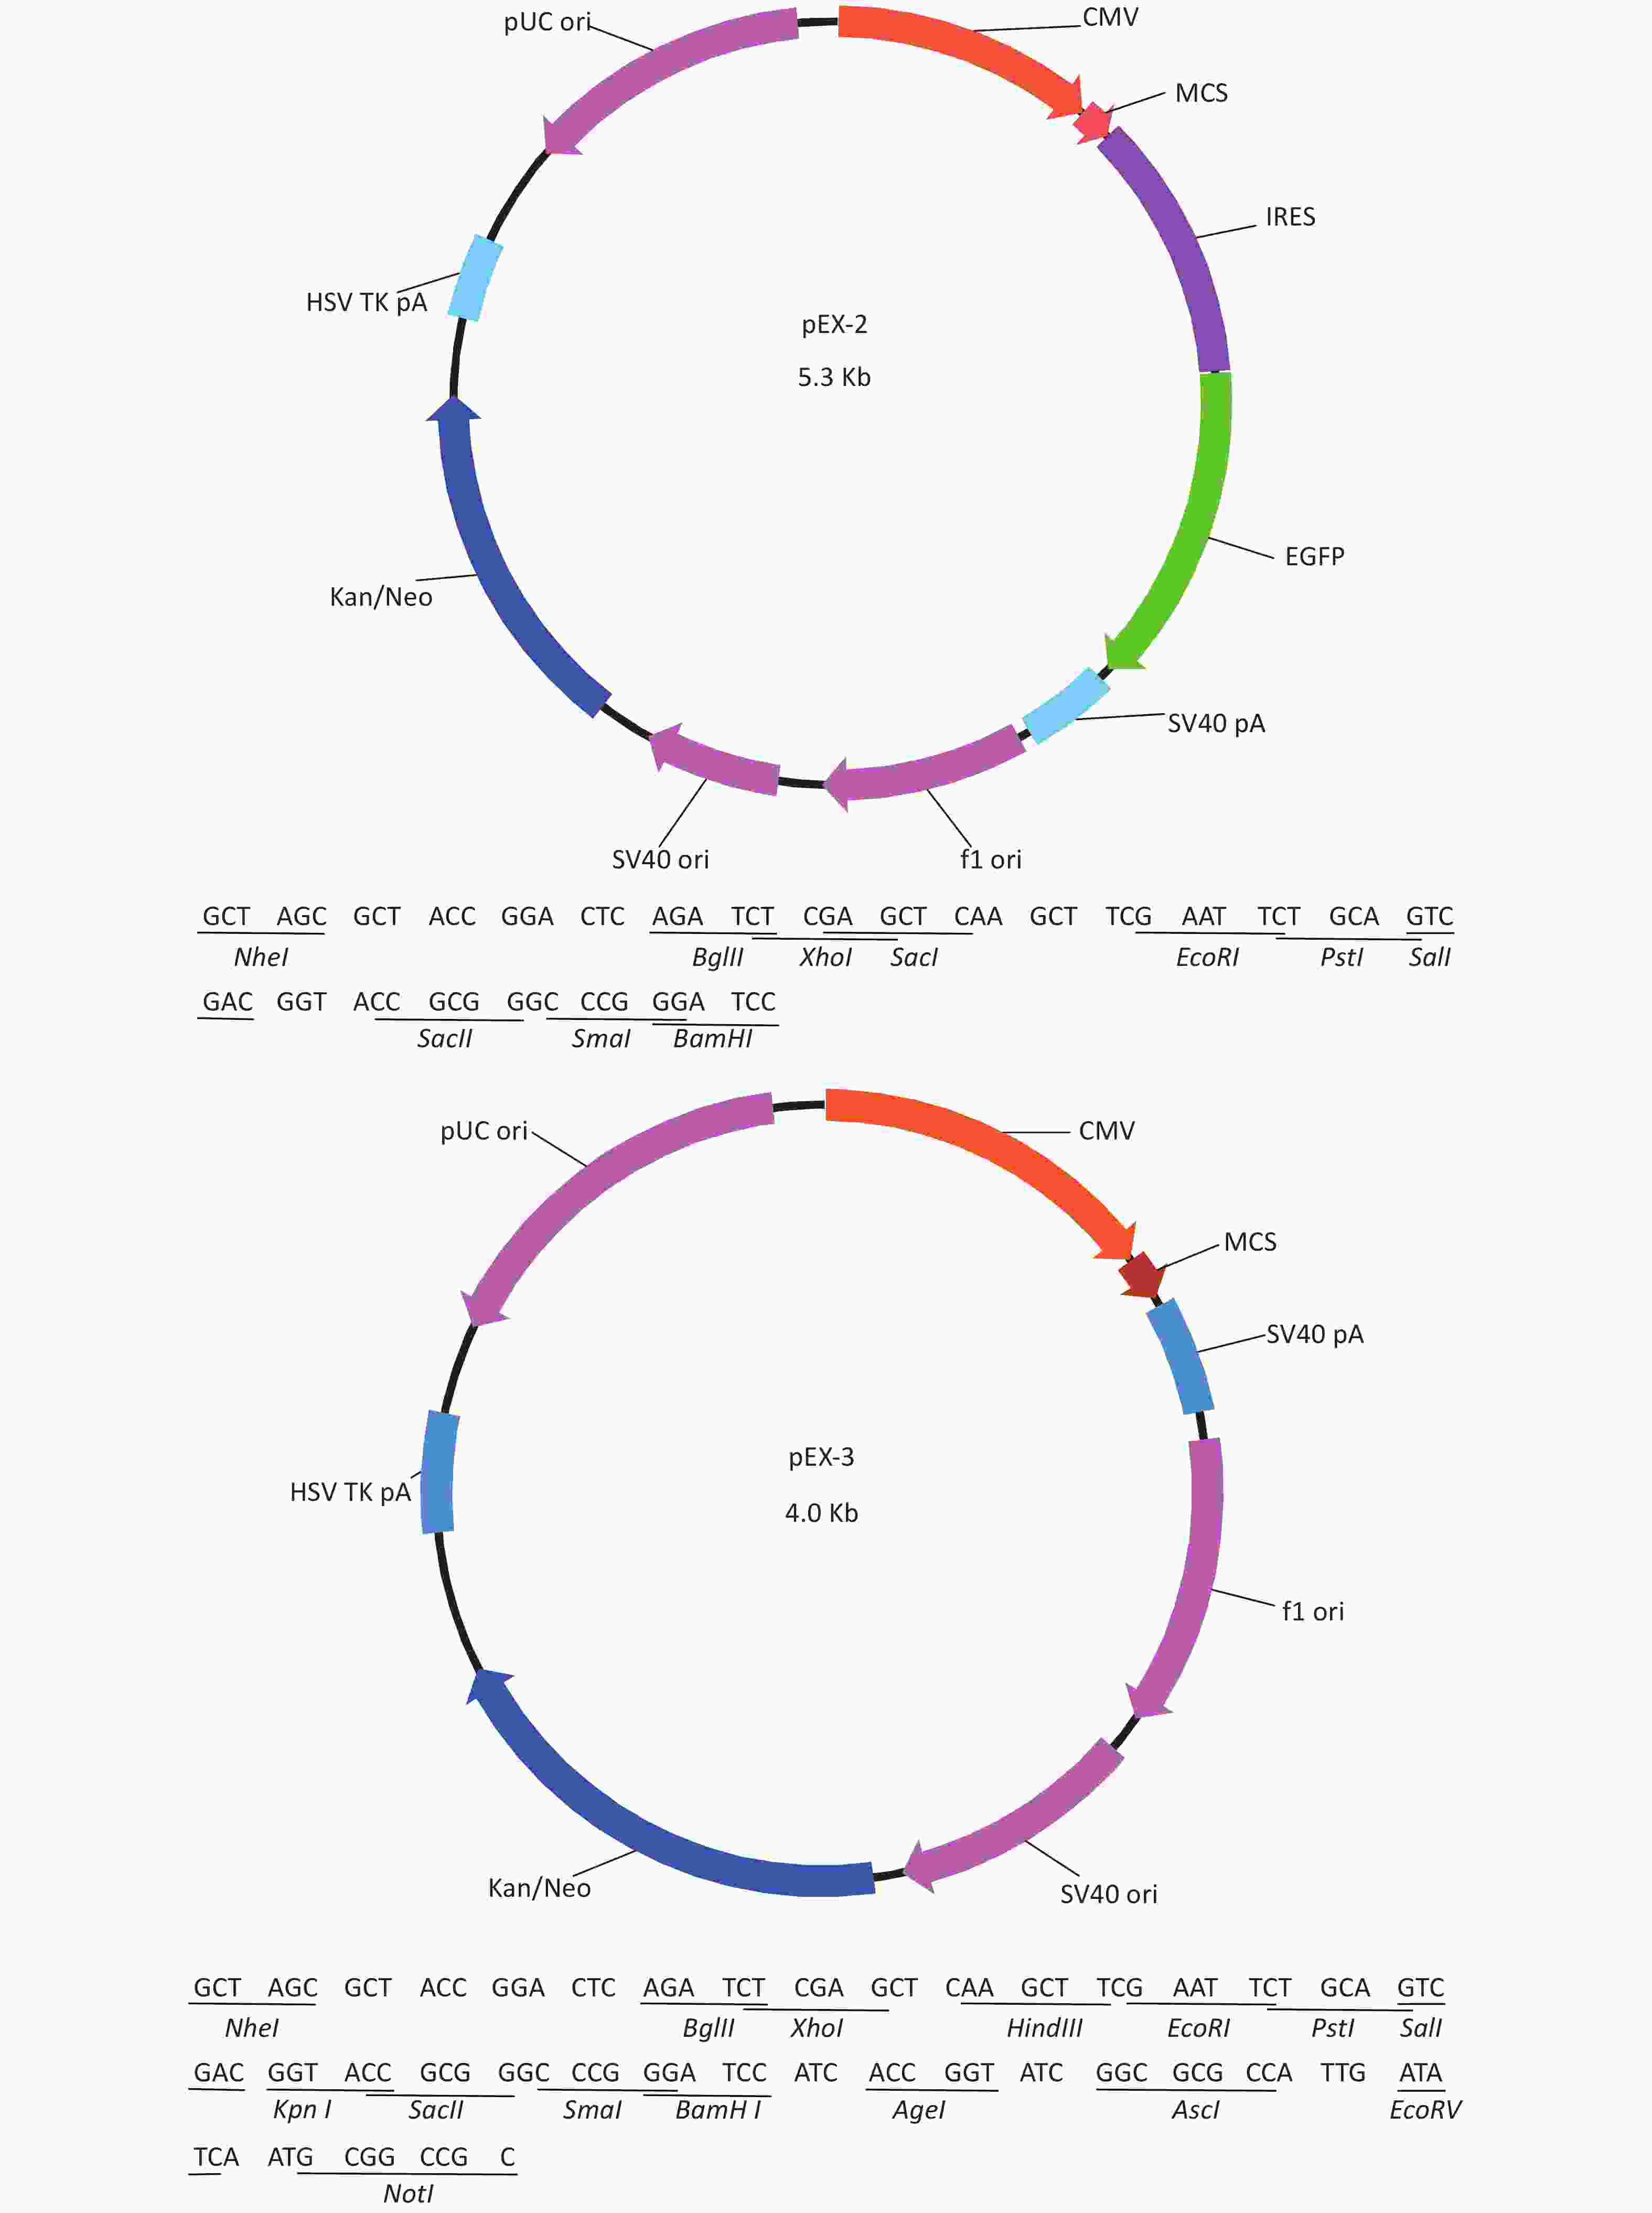
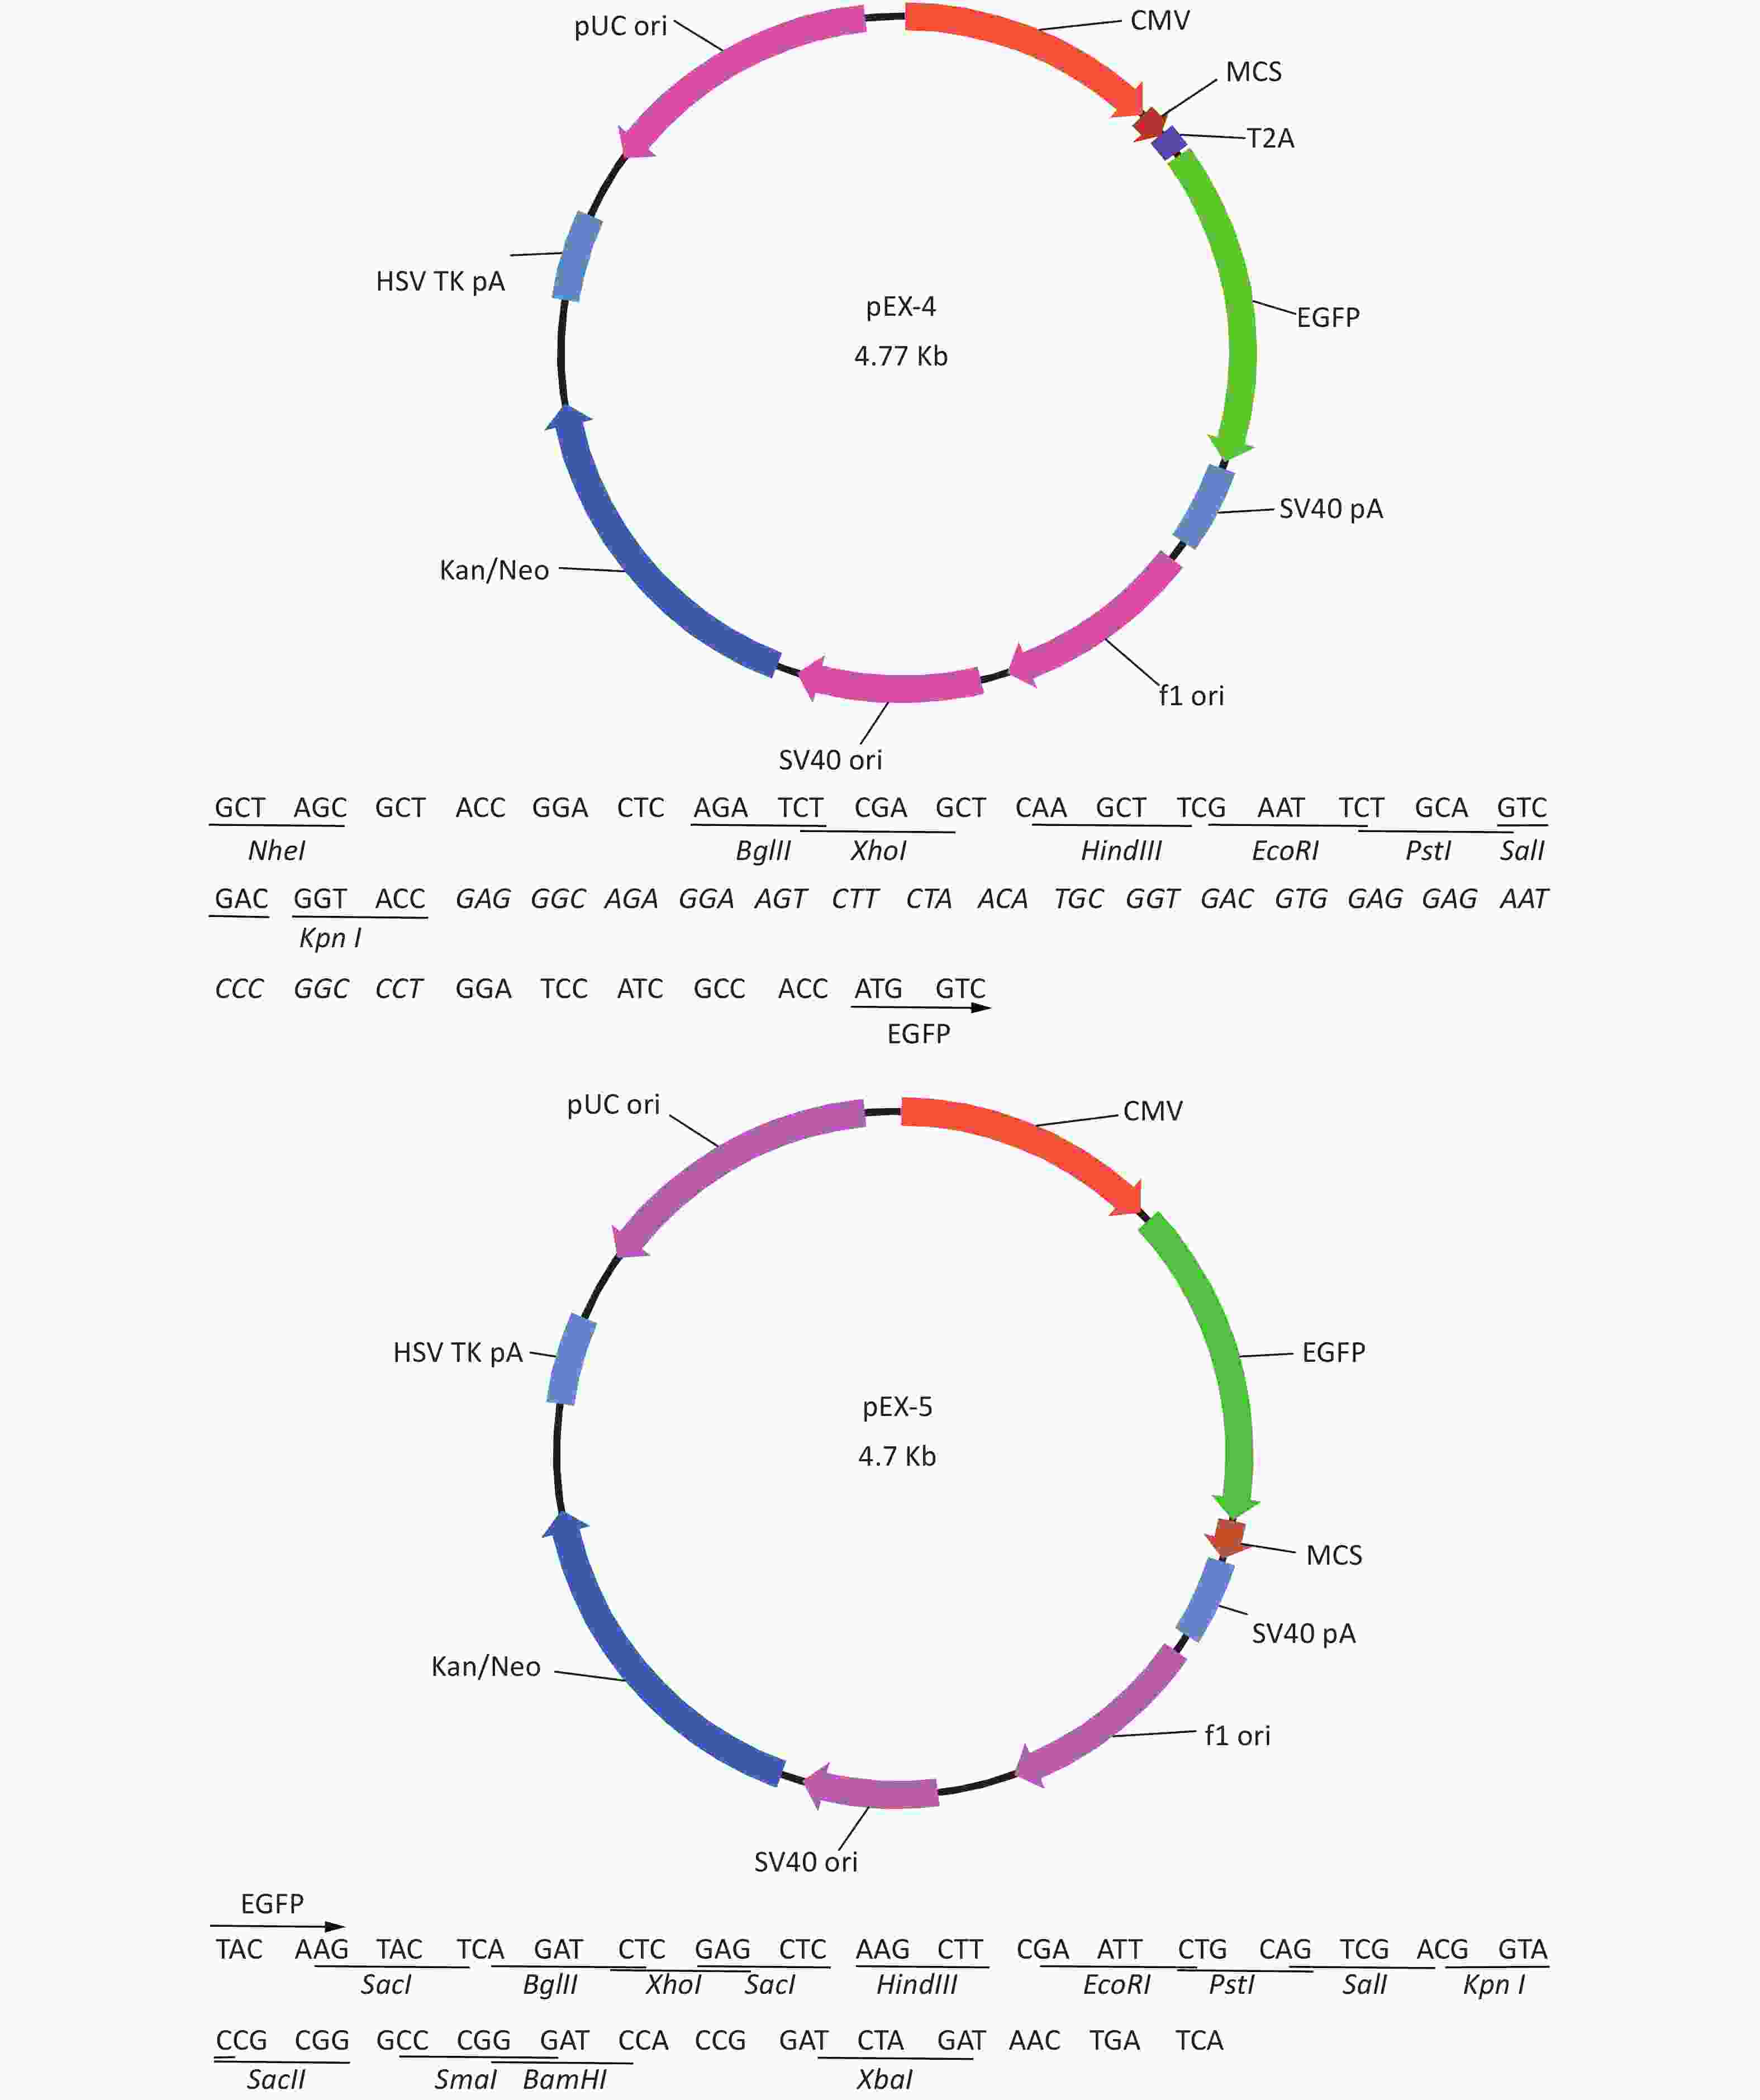
Figure S1-3. The overexpression plasmid of RPL23a.
doi: 10.3967/bes2021.108
Ionizing Radiation-Induced RPL23a Reduction Regulates Apoptosis via RPL11-MDM2-p53 Pathway in Mouse Spermatogonia
-
Abstract:
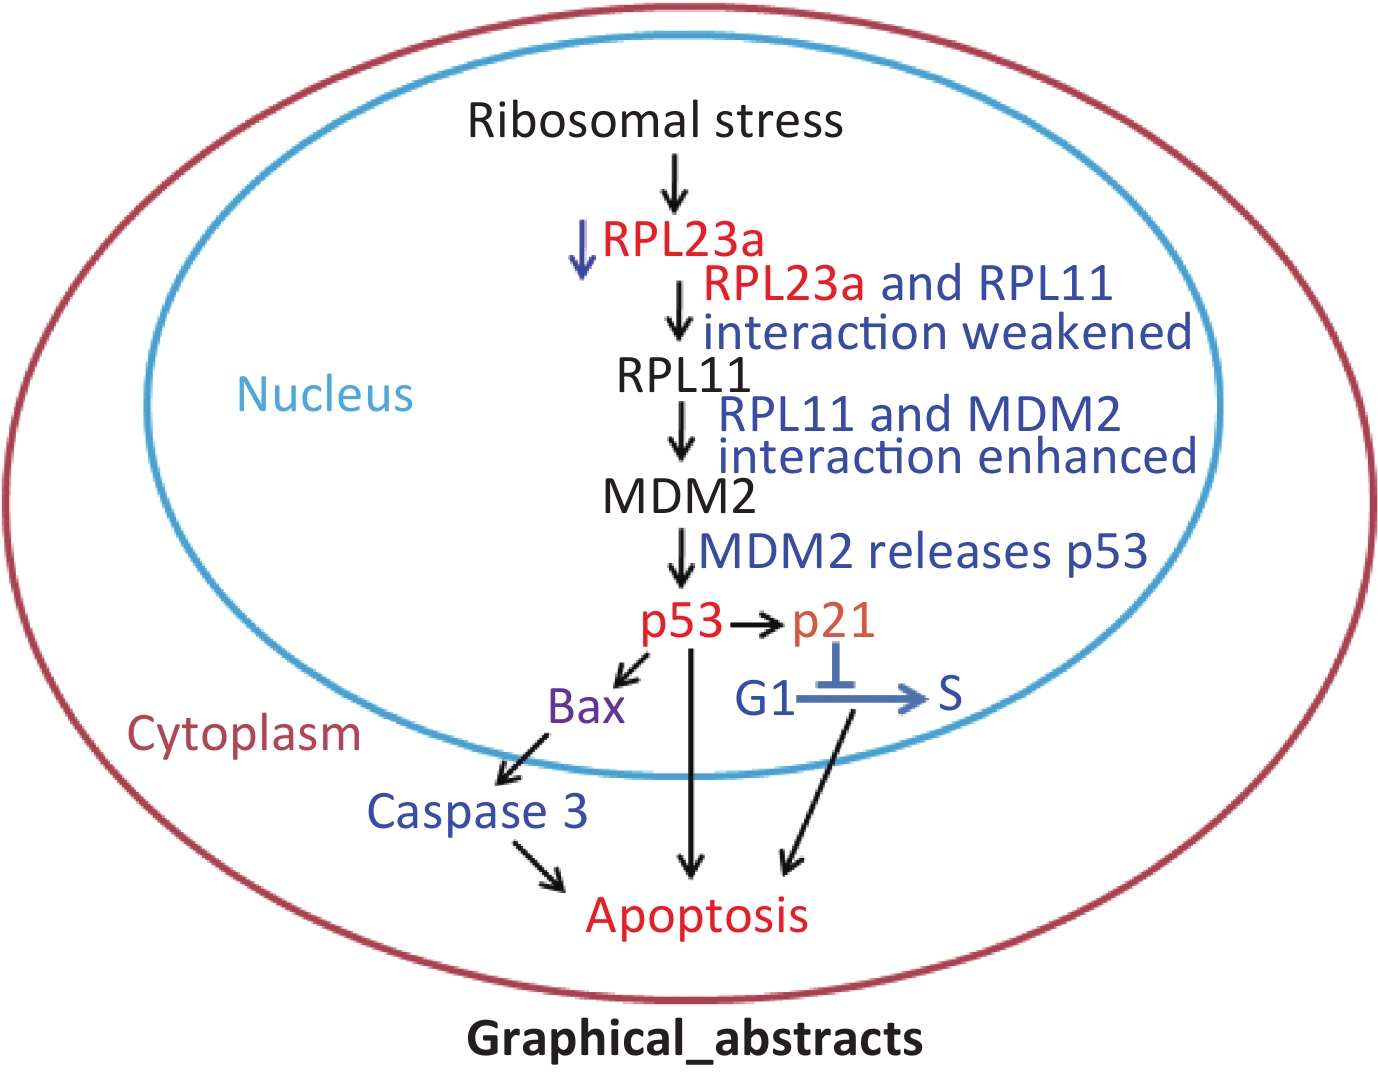
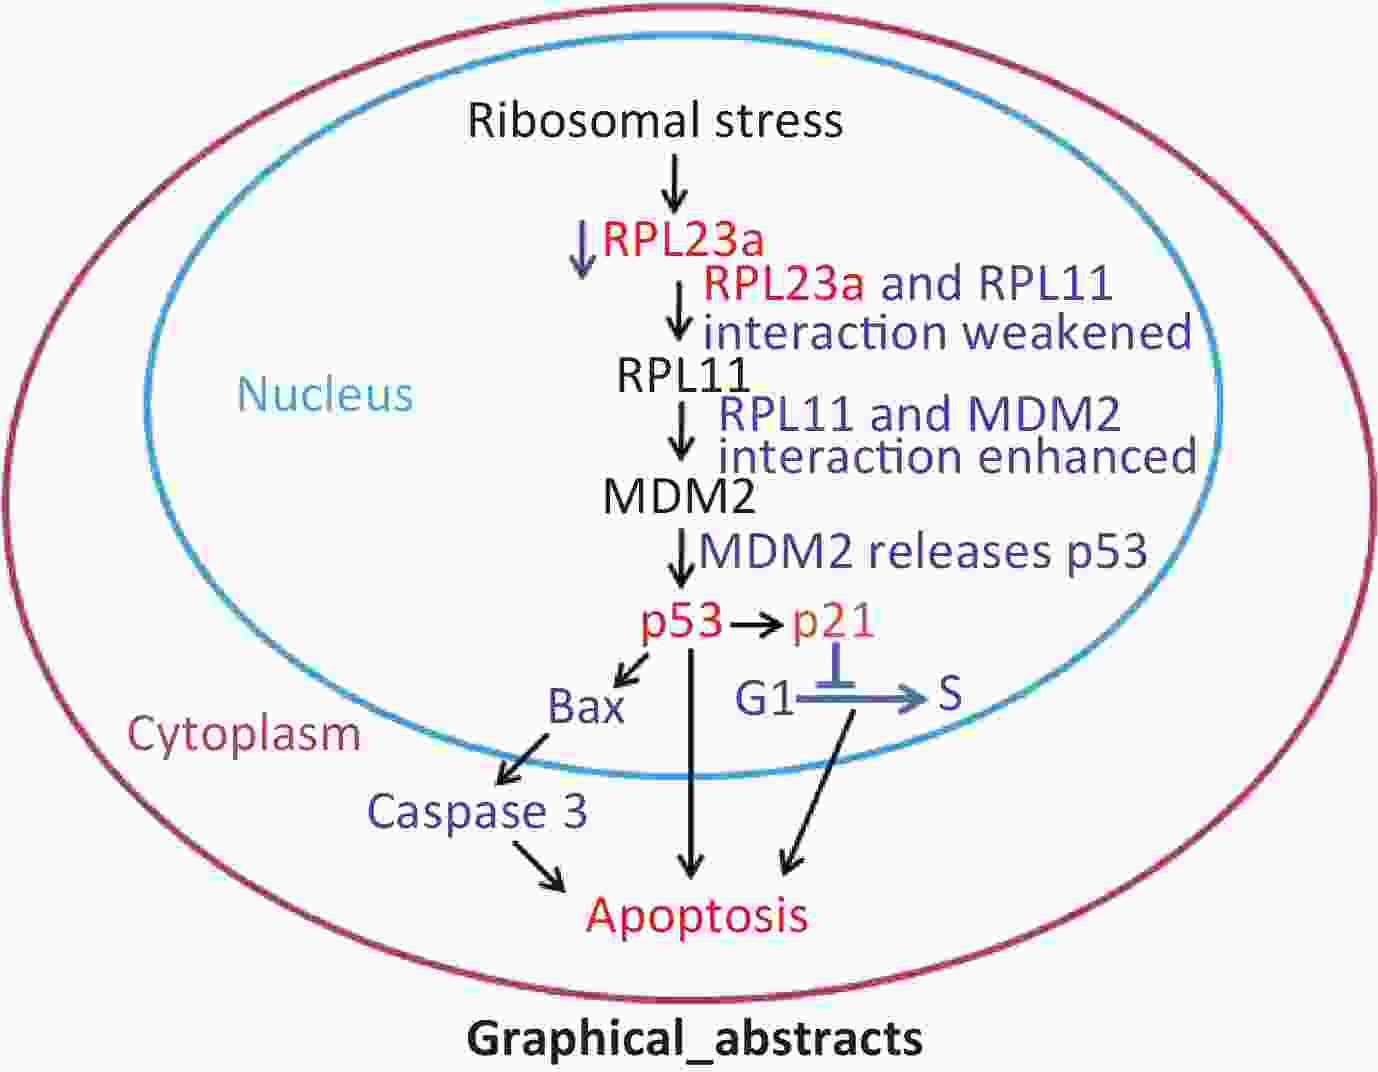
Objective The expression patterns of ribosomal large subunit protein 23a (RPL23a) in mouse testes and GC-1 cells were analyzed to investigate the potential relationship between RPL23a expression and spermatogonia apoptosis upon exposure to X-ray. Methods Male mice and GC-1 cells were irradiated with X-ray, terminal dUTP nick end-labelling (TUNEL) was performed to detect apoptotic spermatogonia in vivo. Apoptotic rate and cell cycle phase of GC-1 cells were analyzed with flow cytometry. Protein interactions were detected by Immunoprecipitation and protein localization as studied by immunofluorescence. Immunoblotting and real-time PCR were applied to analyze to protein and gene expression. Results Ionizing radiation (IR) increased spermatogonia apoptosis, the expression of RPL11, MDM2 and p53, and decreased RPL23a expression in mice spermatogonia in vivo and in vitro. RPL23a knockdown weakened the interaction between RPL23a and RPL11, leading to p53 accumulation. Moreover, knockdown and IR decreased RPL23a that induces spermatogonia apoptosis via RPL23a-RPL11-MDM2-p53 pathway in GC-1 cells. Conclusion These results suggested that IR reduced RPL23a expression, leading to weakened the RPL23a-RPL11 interactions, which may have activated p53, resulting in spermatogonia apoptosis. These results provide insights into environmental and clinical risks of radiotherapy following exposure to IR in male fertility. The graphical abstract was available in the web of www.besjournal.com .-
Key words:
- Ionizing radiation /
- Testis /
- Spermatogonia apoptosis
-
Figure 1. Immunoblotting analysis of RPL23a, RPL11, MDM2, and p53 expression in mice testes exposed to 4 Gy IR (A); Relative expression levels of proteins compared to β-actin (B); testes of three mice were analyzed and values are presented as the mean ± SEM; asterisks and pound signs represent significant differences from controls: *P < 0.05, #P < 0.001. TUNEL staining to assess spermatogonia apoptosis and spermatogenic cells in testis at 24 h after IR (magnification, 200×; scale bar = 50 μm) (C); different cell types are indicated by white arrows; the nucleus are labeled with DAPI (blue) and apoptotic signals are shown in green. Histogram of apoptotic ratio (D, E); apoptotic ratio = apoptotic spermatogenic cells (spermatogonia)/seminiferous tubules; counted all observed apoptotic spermatogenic cells and seminiferous tubules in each mouse; values represent mean ± SEM from three mice in each group; significant difference from controls: #P < 0.001. Abbreviations: CTR, control; IR, ionizing radiation; sg, spermatogonia; ps, pachytene spermatocyte; ls, leptotene stage spermatocyte; st, spermatid; sp, spermatozoa; lc, Leydig cell.
Figure 2. Immunofluorescence analysis of the distribution of RPL23a, RPL11, MDM2, and p53 in different cell types in testis at 24 h after 4 Gy IR (magnification, 400×; scale bar = 20 μm) (A, B, C, D); different cell types are indicated by white arrows; the nucleus are labeled with DAPI (blue); the fluorescence signals of RPL23a and p53 are shown in red, while those of MDM2 and RPL11 are shown in green. Quantification of proteins in spermatogonia were assessed as mean AOD (E, F, G, H); values represent the average ± SEM from three mice per group, asterisks signs represent significant differences from controls: *P < 0.05, **P < 0.01 with Student's t-test analysis. Abbreviations: IR, ionizing radiation; sg, spermatogonia; ps, pachytene spermatocyte; ls, leptotene stage spermatocyte; st, spermatid; sp, spermatozoa; lc, Leydig cell.
Figure 3. Apoptosis of GC-1 cells analyzed by flow cytometry exposed to IR (A, C). The apoptotic ratio of GC-1 cells exposed to IR (B, D); three dependent repeats were analyzed and values are presented as the mean ± SEM, asterisks and pound signs represent significant differences from controls: *P < 0.05, #P < 0.001. Immunoblotting analysis of RPL23a and p53 expression in GC-1 cells exposed to IR (E). Relative expression levels of target proteins as compared to β-actin (F); three gels were analyzed and values are presented as the mean ± SEM, asterisks and pound signs represent significant differences from controls: *P < 0.05, **P < 0.01, #P < 0.001. Abbreviations: CTR, control; IR, ionizing radiation.
Figure 4. Immunofluorescence analysis of the distribution of RPL23a, RPL11, and p53 in GC-1 cells at 24 h after IR (magnification, 400×; scale bar = 10 μm) (A, B, C, D); the nucleus are labeled with DAPI (blue). Quantification of proteins were assessed as mean AOD (E, F, G, H); values represent the average ± SEM from three independent repeats, asterisks signs represent significant differences from controls: *P < 0.05, **P < 0.01 with Student's t-test analysis. Abbreviations: IR, ionizing radiation.
Figure 5. Cell cycle phase of GC-1 cells measured after knocking down RPL23a (A); The ratio of cell phase of GC-1 cells after knocking down RPL23a (B); three dependent repeats were analyzed and values are presented as the mean ± SEM, asterisks and pound signs represent significant differences from controls: #P < 0.001. Apoptotic ratio of GC-1 cells analyzed after knocking down RPL23a (C); The apoptotic ratio of GC-1 cells after knocking down RPL23a (D); three dependent repeats were analyzed and values are presented as the mean ± SEM, asterisks and pound signs represent significant differences from controls: #P < 0.001. Relative expression levels of mRNAs (E); three dependent repeats were analyzed and values are presented as the mean ± SEM, asterisks and pound signs represent significant differences from controls: #P < 0.001. Relative expression levels of proteins after knocking down RPL23a compared to β-actin (F); Endogenous interactions of RPL23a and RPL11 were analyzed by IP (G); cell lysates were immunoprecipitated with anti-RPL11 polyclonal antibody and analyzed by immunoblotting with anti-RPL11 and RPL23a antibodys. Abbreviations: NC, negative control; L23a siRNA, RPL23a siRNA; IP, immunoprecipitation.
Figure 6. Immunofluorescence analysis of the distribution of RPL23a, RPL11, and p53 in GC-1 cells after knocking down RPL23a (magnification, 400×; scale bar = 10 μm) (A, B, C, D); the nucleus are labeled with DAPI (blue). Quantification of proteins were assessed as mean AOD (E, F, G, H); values represent the average ± SEM from three independent repeats, asterisks signs represent significant differences from controls: *P < 0.05, **P < 0.01, #P < 0.01 with Student's t-test analysis. Abbreviations: NC, negative control; L23a siRNA, RPL23a siRNA.
Figure 7. Cell cycle phase measured in GC-1 cells at 24 h after IR (A); the GC-1 cells were transfected with overexpressed plasmids (pEX3 or pEX3-L23a) for 48 h, then irradiated with 4 Gy IR. The ratio of cell phase of GC-1 cells (B); three independent repeats were analyzed and values are presented as the mean ± SEM, asterisks and pound signs represent significant differences from controls: **P < 0.01. Apoptotic ratio analyzed in GC-1 cells at 24 h after IR (C); the GC-1 cells were transfected with overexpressed plasmids (pEX3 or pEX3-L23a) for 48 h, then irradiated with 4 Gy IR. The apoptotic ratio of GC-1 cells (D); three dependent repeats were analyzed and values are presented as the mean ± SEM, asterisks and pound signs represent significant differences from controls: *P < 0.05. Cell cycle phase measured in GC-1 cells at 24 h after IR (E); the GC-1 cells were transfected with siRNAs for 36 h, then irradiated with 4 Gy IR. The ratio of cell phase of GC-1 cells (F); three independent repeats were analyzed and values are presented as the mean ± SEM, asterisks and pound signs represent significant differences from controls: *P < 0.05, #P < 0.001. Apoptotic ratio analyzed in GC-1 cells at 24 h after IR (G); the GC-1 cells were transfected with siRNAs for 36 h, then irradiated with 4 Gy IR. The apoptotic ratio of GC-1 cells (H); three dependent repeats were analyzed and values are presented as the mean ± SEM, asterisks and pound signs represent significant differences from controls: *P < 0.05, **P < 0.01, #P < 0.001. Abbreviations: pEX3-L23a, pEX3-RPL23a; NC, negative control; L23a siRNA, RPL23a siRNA.
Figure 8. Immunoblotting analysis of MDM2, p53, p21, RPL11, and RPL23a expression in GC-1 cells at 24 h after IR (A); the GC-1 cells were transfected with siRNA for 36 h, then irradiated with 4 Gy IR. Relative expression levels of proteins as compared to β-actin (B); three gels were analyzed and values are presented as the mean ± SEM, asterisks and pound signs represent significant differences from controls: *P < 0.05, **P < 0.01, #P < 0.001. Immunoblotting analysis of caspase 3 and caspase 9 expression in GC-1 cells at 24 h after IR (C); the GC-1 cells were transfected with siRNA for 36 h, then irradiated with 4 Gy IR. Relative expression levels of proteins as compared to β-actin (D); three gels were analyzed and values are presented as the mean ± SEM, asterisks and pound signs represent significant differences from controls: *P < 0.05, #P < 0.001. Immunoblotting analysis of Bax, Bcl-2, Cyc and PUMA expression in GC-1 cells at 24 h after IR (E); the GC-1 cells were transfected with siRNA for 36 h, then irradiated with 4 Gy IR. Relative expression levels of proteins as compared to β-actin (F); three gels were analyzed and values are presented as the mean ± SEM, asterisks and pound signs represent significant differences from controls: *P < 0.05, **P < 0.01, #P < 0.001. Abbreviations: IR, ionizing radiation; NC, negative control; L23a siRNA, RPL23a siRNA; Cyc, cytochrome C.
1. The sequences of primers. Supplementary
Name Primer Sequence (5'-3') Size (bp) β-actin Forward CACGATGGAGGGGCCGGACTCATC 240 Reverse TAAAGACCTCTATGCCAACACAGT RPL23a Forward TGCTATCATCAAATTCCCAC 192 Reverse ACATACGCCTTCTTCTCTCC p53 Forward GGACAGCTTTGAGGTTCGTG 237 Reverse TCATTCAGCTCCCGGAACAT MDM2 Forward CGGTGGAACTTTGACTTCGT 212 Reverse AGAGTGCAAGACAGCGACAA P21 Forward CTTCGTGAGAACTGGCTTCC 225 Reverse CGATGGTTGGGAATAGTCGT  下载: 导出CSV
2. The sequences of RPL11 using three different siRNAs
Gene Sequence Sense (5'-3') Antisense (5'-3') Rpl23a-mus-47 GCCGAAAGCGAAGAAGGAATT UUCCUUCUUCGCUUUCGGCTT Rpl23a-mus-352 CCAAUAAGCAUCAGAUCAATT UUGAUCUGAUGCUUAUUGGTT Rpl23a-mus-455 UCGCUUGGCUCCUGAUUAUTT AUAAUCAGGAGCCAAGCGATT
下载: 导出CSV
-
[1] Fukunaga H, Kaminaga K, Sato T, et al. Application of an Ex Vivo Tissue Model to Investigate Radiobiological Effects on Spermatogenesis. Radiat Res, 2018; 189, 661−7. doi: 10.1667/RR14957.1 [2] Jahnukainen K, Ehmcke J, Hou M, et al. Testicular function and fertility preservation in male cancer patients. Best Pract Res Clin Endocrinol Metab, 2011; 25, 287−302. doi: 10.1016/j.beem.2010.09.007 [3] Lambrot R, Coffigny H, Pairault C, et al. High radiosensitivity of germ cells in human male fetus. J Clin Endocrinol Metab, 2007; 92, 2632−9. doi: 10.1210/jc.2006-2652 [4] Gong EJ, Shin IS, Son TG, et al. Low-dose-rate radiation exposure leads to testicular damage with decreases in DNMT1 and HDAC1 in the murine testis. J Radiat Res, 2014; 55, 54−60. doi: 10.1093/jrr/rrt090 [5] Dohle GR. Male infertility in cancer patients: Review of the literature. Int J Urol, 2010; 17, 327−31. doi: 10.1111/j.1442-2042.2010.02484.x [6] Li W, Zeng Y, Zhao J, et al. Upregulation and nuclear translocation of testicular ghrelin protects differentiating spermatogonia from ionizing radiation injury. Cell Death Dis, 2014; 5, e1248. doi: 10.1038/cddis.2014.223 [7] Zhou X, Liao WJ, Liao JM. Ribosomal proteins: functions beyond the ribosome. J Mol Cell Biol, 2015; 7, 92−104. doi: 10.1093/jmcb/mjv014 [8] Wang W, Nag S, Zhang X, et al. Ribosomal proteins and human diseases: pathogenesis, molecular mechanisms, and therapeutic implications. Med Res Rev, 2015; 35, 225−85. doi: 10.1002/med.21327 [9] Holmberg Olausson K, Nistér M, Lindström MS. p53 -Dependent and -Independent Nucleolar Stress Responses. Cells, 2012; 1, 774−98. doi: 10.3390/cells1040774 [10] Russo A, Pagliara V, Albano F, et al. Regulatory role of rpL3 in cell response to nucleolar stress induced by Act D in tumor cells lacking functional p53. Cell Cycle, 2016; 15, 41−51. doi: 10.1080/15384101.2015.1120926 [11] Kardos GR, Dai MS, Robertson GP. Growth inhibitory effects of large subunit ribosomal proteins in melanoma. Pigment Cell Melanoma Res, 2014; 27, 801−12. doi: 10.1111/pcmr.12259 [12] Meng X, Tackmann NR, Liu S, et al. RPL23 Links Oncogenic RAS Signaling to p53-Mediated Tumor Suppression. Cancer Res, 2016; 76, 5030−9. doi: 10.1158/0008-5472.CAN-15-3420 [13] Wei F, Ding L, Wei Z, et al. Ribosomal protein L34 promotes the proliferation, invasion and metastasis of pancreatic cancer cells. Oncotarget, 2016; 7, 85259−72. doi: 10.18632/oncotarget.13269 [14] Zhou X, Hao Q, Liao J. Ribosomal protein S14 unties the MDM2-p53 loop upon ribosomal stress. Oncogene, 2013; 32, 388−96. doi: 10.1038/onc.2012.63 [15] Golomb L, Volarevic S, Oren M. p53 and ribosome biogenesis stress: the essentials. FEBS Lett, 2014; 588, 2571−9. doi: 10.1016/j.febslet.2014.04.014 [16] Kim TH, Leslie P, Zhang Y. Ribosomal proteins as unrevealed caretakers for cellular stress and genomic instability. Oncotarget, 2014; 5, 860−71. doi: 10.18632/oncotarget.1784 [17] Li H, Zhang H, Huang G, et al. Heavy ion radiation-induced DNA damage mediates apoptosis via the Rpl27a-Rpl5-MDM2-p53/E2F1 signaling pathway in mouse spermatogonia. Ecotoxicol Environ Saf, 2020; 201, 110831. doi: 10.1016/j.ecoenv.2020.110831 [18] Sun B, Hou YL, Hou WR, et al. cDNA cloning, overexpression, purification and pharmacologic evaluation for anticancer activity of ribosomal protein L23A gene (RPL23A) from the Giant Panda. Int J Mol Sci, 2012; 13, 2133−47. doi: 10.3390/ijms13022133 [19] He Y, Zhang Y, Li H, et al. Comparative Profiling of MicroRNAs Reveals the Underlying Toxicological Mechanism in Mice Testis Following Carbon Ion Radiation. Dose Response, 2018; 16, 1559325818778633. [20] Li H, Zhang W, Zhang H, et al. Mitochondrial proteomics reveals the mechanism of spermatogenic cells apoptosis induced by carbon ion radiation in zebrafish. J Cell Physiol, 2019; 234, 22439−49. doi: 10.1002/jcp.28808 [21] Jiang X, Du Y, Meng X, et al. Low-Dose Radiation Enhanced Inhibition of Breast Tumor Xenograft and Reduced Myocardial Injury Induced by Doxorubicin. Dose Response, 2018; 16, 1559325818813061. [22] He N, Xiao C, Sun Y, et al. Radiation Responses of Human Mesenchymal Stem Cells Derived From Different Sources. Dose Response, 2019; 17, 1559325819893210. [23] Chen J, Bian R, Li J, et al. Chronic exposure to microcystin-LR reduces thyroid hormone levels by activating p38/MAPK and MEK/ERK signal pathway. Ecotoxicol Environ Saf, 2019; 173, 142−8. doi: 10.1016/j.ecoenv.2019.02.024 [24] Zhang Y, Su YL, Li LS, et al. Mouse dead end 1-β interacts with c-Jun and stimulates activator protein 1 transactivation. Mol Med Rep, 2015; 11, 1701−7. doi: 10.3892/mmr.2014.2950 [25] Hung JH, Chen CY, Omar HA, et al. Reactive oxygen species mediate Terbufos-induced apoptosis in mouse testicular cell lines via the modulation of cell cycle and pro-apoptotic proteins. Environ Toxicol, 2016; 31, 1888−98. doi: 10.1002/tox.22190 [26] Chen R, Cui Y, Zhang X, et al. Chlorpyrifos Induction of Testicular-Cell Apoptosis through Generation of Reactive Oxygen Species and Phosphorylation of AMPK. J Agric Food Chem, 2018; 66, 12455−70. doi: 10.1021/acs.jafc.8b03407 [27] Hoskin PJ, Price P, Easton D, et al. A prospective randomised trial of 4 Gy or 8 Gy single doses in the treatment of metastatic bone pain. Radiotherapy & Oncology, 1992; 23, 74−8. [28] Kawamura K, Qi F, Meng Q, et al. Nucleolar protein nucleolin functions in replication stress-induced DNA damage responses. J Radiat Res, 2019; 60, 281−8. doi: 10.1093/jrr/rry114 [29] Manku G, Culty M. Mammalian gonocyte and spermatogonia differentiation: recent advances and remaining challenges. Reproduction, 2015; 149, R139−R157. doi: 10.1530/REP-14-0431 [30] Hasegawa M, Zhang Y, Niibe H, et al. Resistance of differentiating spermatogonia to radiation-induced apoptosis and loss in p53-deficient mice. Radiat Res, 1998; 149, 263−2670. doi: 10.2307/3579959 [31] Liu G, Gong P, Bernstein LR, et al. Apoptotic cell death induced by low-dose radiation in male germ cells: hormesis and adaptation. Crit Rev Toxicol, 2007; 37, 587−605. doi: 10.1080/10408440701493061 [32] Jaako P, Ugale A, Wahlestedt M, et al. Induction of the 5S RNP-Mdm2-p53 ribosomal stress pathway delays the initiation but fails to eradicate established murine acute myeloid leukemia. Leukemia, 2017; 31, 213−21. doi: 10.1038/leu.2016.159 [33] Liu Y, Deisenroth C, Zhang Y. RP-MDM2-p53 Pathway: Linking Ribosomal Biogenesis and Tumor Surveillance. Trends Cancer, 2016; 2, 191−204. doi: 10.1016/j.trecan.2016.03.002 [34] Cho J, Park J, Shin SC, et al. Ribosomal protein S2 interplays with MDM2 to induce p53. Biochem Biophys Res Commun, 2020; 523, 542−7. doi: 10.1016/j.bbrc.2020.01.038 [35] El Motiam A, Vidal S, de la Cruz-Herrera CF, et al. Collado M, Rivas C. Interplay between SUMOylation and NEDDylation regulates RPL11 localization and function. FASEB J, 2019; 33, 643−51. doi: 10.1096/fj.201800341RR [36] Fumagalli S, Ivanenkov VV, Teng T, et al. Suprainduction of p53 by disruption of 40S and 60S ribosome biogenesis leads to the activation of a novel G2/M checkpoint. Genes Dev, 2012; 26, 1028−40. doi: 10.1101/gad.189951.112 [37] Donati G, Peddigari S, Mercer CA, et al. 5S ribosomal RNA is an essential component of a nascent ribosomal precursor complex that regulates the Hdm2-p53 checkpoint. Cell Rep, 2013; 4, 87−98. doi: 10.1016/j.celrep.2013.05.045 [38] Wang J, Zhang ZQ, Li FQ, et al. Triptolide interrupts rRNA synthesis and induces the RPL23-MDM2-p53 pathway to repress lung cancer cells. Oncol Rep, 2020; 43, 1863−74. -
 20518Supplementary Materials.pdf

-

 点击查看大图

计量
- 文章访问数: 2092
- HTML全文浏览量: 1190
- PDF下载量: 200
- 被引次数: 0

 Quick Links