

 下载:
下载:

-
C oronavirus disease 2019 (COVID-19) was declared a pandemic disease by the World Health Organization (WHO) on March 11, 2020, and has infected tens of millions of people globally [1]. Since there is no specific medicine to cure the disease and insufficient vaccine to prevent its spread, a better understanding of its characteristics may be beneficial to alleviate disease symptoms and control the epidemic. Severe acute respiratory syndrome coronavirus 2 (SARS-CoV-2) has higher pathogenicity than severe acute respiratory syndrome coronavirus (SARS) or Middle East respiratory syndrome coronavirus (MERS), but is less lethal than either of these viruses [2-4]. Neutralizing antibodies (NAbs) are naturally produced by the body to target the virus for destruction. However, our understanding of how patient and disease characteristics affect the levels of NAbs remains limited [5]. In particular, knowledge regarding dynamic changes in Nab levels following infection may be beneficial to the development of vaccines.
In this study, we applied a neutralization assay to measure SARS-CoV-2 NAbs in serum from COVID-19 patients with varying symptoms and analyzed the kinetics of NAbs following infection. This work provides information that may be important for vaccine development and highlights serotherapy as a potential strategy to prevent and cure COVID-19.
-
A total of 125 patients were diagnosed as SARS-CoV-2-positive by the results of a real-time fluorescence reverse transcription–polymerase chain reaction (RT–PCR) assay of throat swab samples collected from Guangzhou Eighth People's Hospital (GZEP), Guangzhou, China, between January 1 and March 14, 2020. The throat swab samples were collected every day to study the decline in RNA-positivity, and the period of RNA-positivity for each patient was recorded. RT–PCR was performed to detect two target genes, the open reading frame 1ab (ORF1ab) gene and the nucleocapsid protein (N) gene [6].
Data on the demographic characteristics, clinical manifestations, and underlying diseases of patients were collected. None of the patients had an immunodeficiency disease, but 57 patients had more than one underlying disease, which included diabetes, cardiovascular disease, and chronic organ diseases. The classification of SARS-CoV-2-infected patients with mild, moderate, severe, or critical symptoms was based on the guidelines published in “Diagnosis and treatment of pneumonitis caused by new coronavirus (trial version 7),” issued by the National Health Commission of China on March 3, 2020 [7]. In total, 605 serum samples from 125 patients, with disease durations ranging from 1 to 85 days, were obtained for serological analysis; these included samples taken at follow-up for 51 patients previously discharged from hospital. The serum samples were taken every 3–7 days for each patient. The study protocol was reviewed and approved by the Medical Ethical Committee of Guangzhou Eighth People’s Hospital (approval number: 202001134). Informed consent was obtained from each patient before enrollment.
-
The micro-neutralization assay was performed according to a previous study with some modifications [8]. SARS-CoV-2 strain (No. 20SF014) isolated from bronchoalveolar lavage fluid of a SARS-COV-2-infected patient was used in this study. Serum samples were inactivated at 56 °C for 30 minutes, then serially diluted across a gradient (from 1:4 to 1:1,024, with two replicate wells per dilution). Diluted serum (60 μL/well) was added to the 96-well plate with 180 μL/well maintenance media [MEM (Gibco, Life, USA) containing 2% fetal bovine serum, 1% 4-(2-hydroxyethyl)-1-piperazineethanesulfonic acid (Gibco, Life, USA), and 1% 100 IU/mL penicillin-streptomycin (Gibco, Life, USA)]. Each dilution (125 μL/well) was transferred to the neutralizing plates, and then added into the same volume of virus solution containing a median tissue culture infective dose (TCID50) of SARS-CoV-2. The mixture was cultured for 2 h. After incubation, 100 μL/well of this mixture was added in sequence to the cell plates containing sub-confluent cell monolayers of Vero-E6 cells (1.5 × 10⁵ cells/well). The plates were cultured at 37 °C in a 5% CO2 incubator and then inspected for the appearance of cytopathic effects every day during the 4-day experiment using an inverted microscope. All of the experiments with live virus were performed in a certified Biosafety level 3 laboratory.
-
The mean ± standard deviation was used for continuous variables, and the number expressed as a percentage was used for categorical variables. The median value, along with the minimum and maximum values, was used to describe the days of antibody testing since the onset of symptoms. Mann–Whitney U test was used to compare log-transformed neutralizing antibody values, as the values were not normally distributed. Student’s t-test was used to compare the durations in each group. The comparison of categorical data was performed using the Chi-square test or Fisher's exact test. A P value of 0.05 or below was considered to be statistically significant. Analyses were conducted using SPSS 20.0 (IBM).
-
A total of 125 confirmed COVID-19 cases were studied to assess the NAb response in a variety of patients with differing symptoms. As shown in Table 1, 4 (3.2%) were classified as mild cases based on their clinical manifestations, 81 (64.8%) were moderate, 33 (26.4%) were severe, and the remaining 7 (5.6%) were critical cases. Males and females were equally distributed regarding their clinical classification (χ2 = 2.21, P = 0.529). The average age of these patients was 53.4 years, ranging from 19 to 90. Oxygen supplementation was required in most cases (72%), with nine cases (7.2%) requiring mechanical ventilation or extracorporeal membrane oxygenation (ECMO). The average hospital duration for patients was 26.2 days, with a 95% confidence interval (CI) of 24.5 to 27.8 for cases who had been discharged. The symptoms of the mild cases [12 days post-onset (dpo)] lasted a significantly shorter time than those of the moderate (24 dpo) and severe (31 dpo) cases.
Table 1. Characteristics of the COVID-19 patients in this study
Characteristic Clinical classification Total Mild case Moderate case Severe case Critical cases Sex, n (%) Male 1 (1.47) 44 (64.71) 18 (26.47) 5 (7.35) 68 (100.00) Female 3 (5.26) 37 (64.91) 15 (26.32) 2 (3.51) 57 (100.00) Age (years) 40.5 ± 15.4 51.3 ± 14.8 56.0 ± 12.5 72.4 ± 8.0 53.4 ± 15.0 ≤ 60, n (%) 3 (3.80) 55 (69.62) 21 (26.58) 0 (0) 79 (100.00) > 60, n (%) 1 (2.17) 26 (56.52) 12 (26.09) 7 (15.22) 46 (100.00) Underlying disease, n (%) No disease 2 (2.94) 48 (70.59) 14 (20.59) 4 (5.88) 68 (100.00) ≥ One disease 2 (3.51) 33 (57.89) 19 (33.33) 3 (5.26) 57 (100.00) Oxygen supplement requirement, n (%) No requirement 3 (8.57) 32 (91.43) 0 (0) 0 (0) 35 (100.00) Low flow oxygen 1 (1.72) 48 (82.76) 9 (15.52) 0 (0) 58 (100.00) High flow oxygen 0 (0) 1 (4.35) 22 (95.65) 0 (0) 23 (100.00) Mechanical ventilation 0 (0) 0 (0) 2 (40.00) 3 (60.00) 5 (100.00) ECMOa 0 (0) 0 (0) 0 (0) 4 (100.00) 4 (100.00) Disease duration (days) 12.3 ± 5.9 24.5 ± 8.0 31.2 ± 7.8 39.4 ± 24.3 26.7 ± 10.5 ≤ 21, n (%) 4 (10.00) 30 (75.0) 3 (7.50) 3 (7.50) 40 (100.00) > 21, n (%) 0 (0) 51 (60.00) 30 (35.29) 4 (4.71) 85 (100.00) Note. aECMO, Extracorporeal membrane oxygenation. -
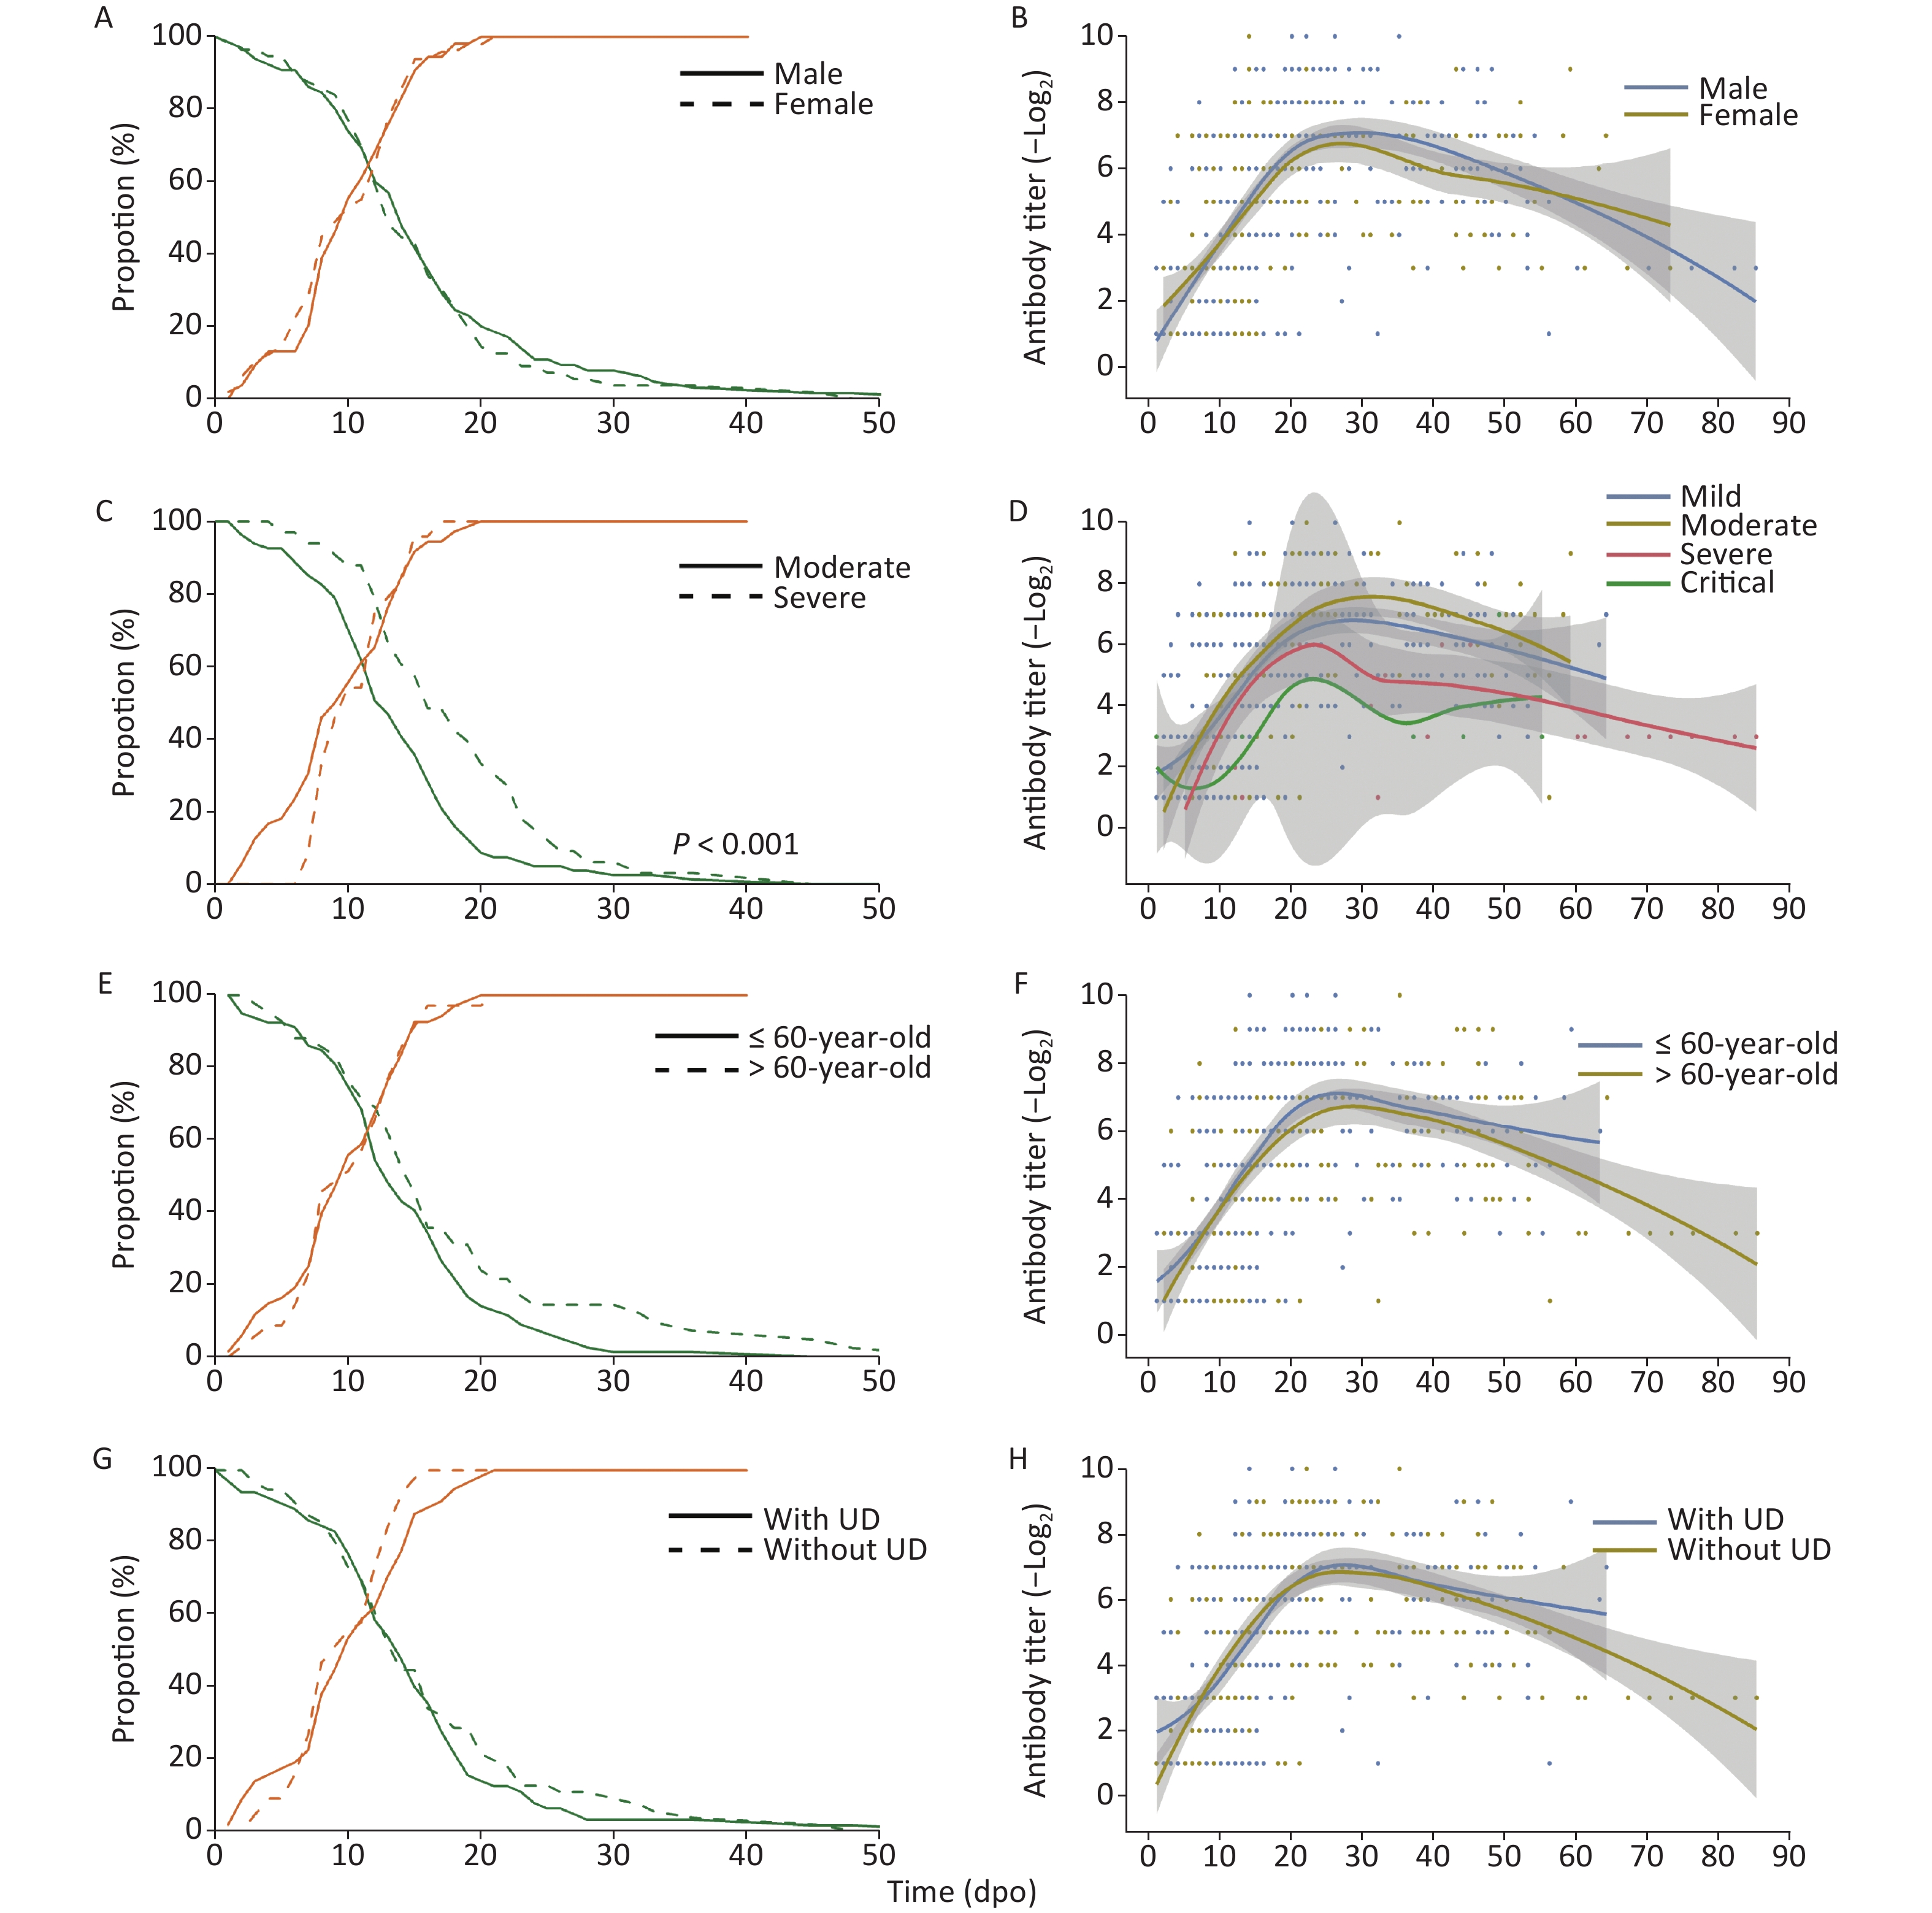
The proportion of RNA-positive patients declined gradually (Figure 1) with a median of 15 dpo, while the duration of RNA-positivity in severe patients was significantly longer (P < 0.001) than in patients with moderate symptoms. However, no significant difference was observed in the sex, age, and underlying disease classifications. The proportion of seropositive patients continuously increased and reached 100% after 21 dpo of symptoms.
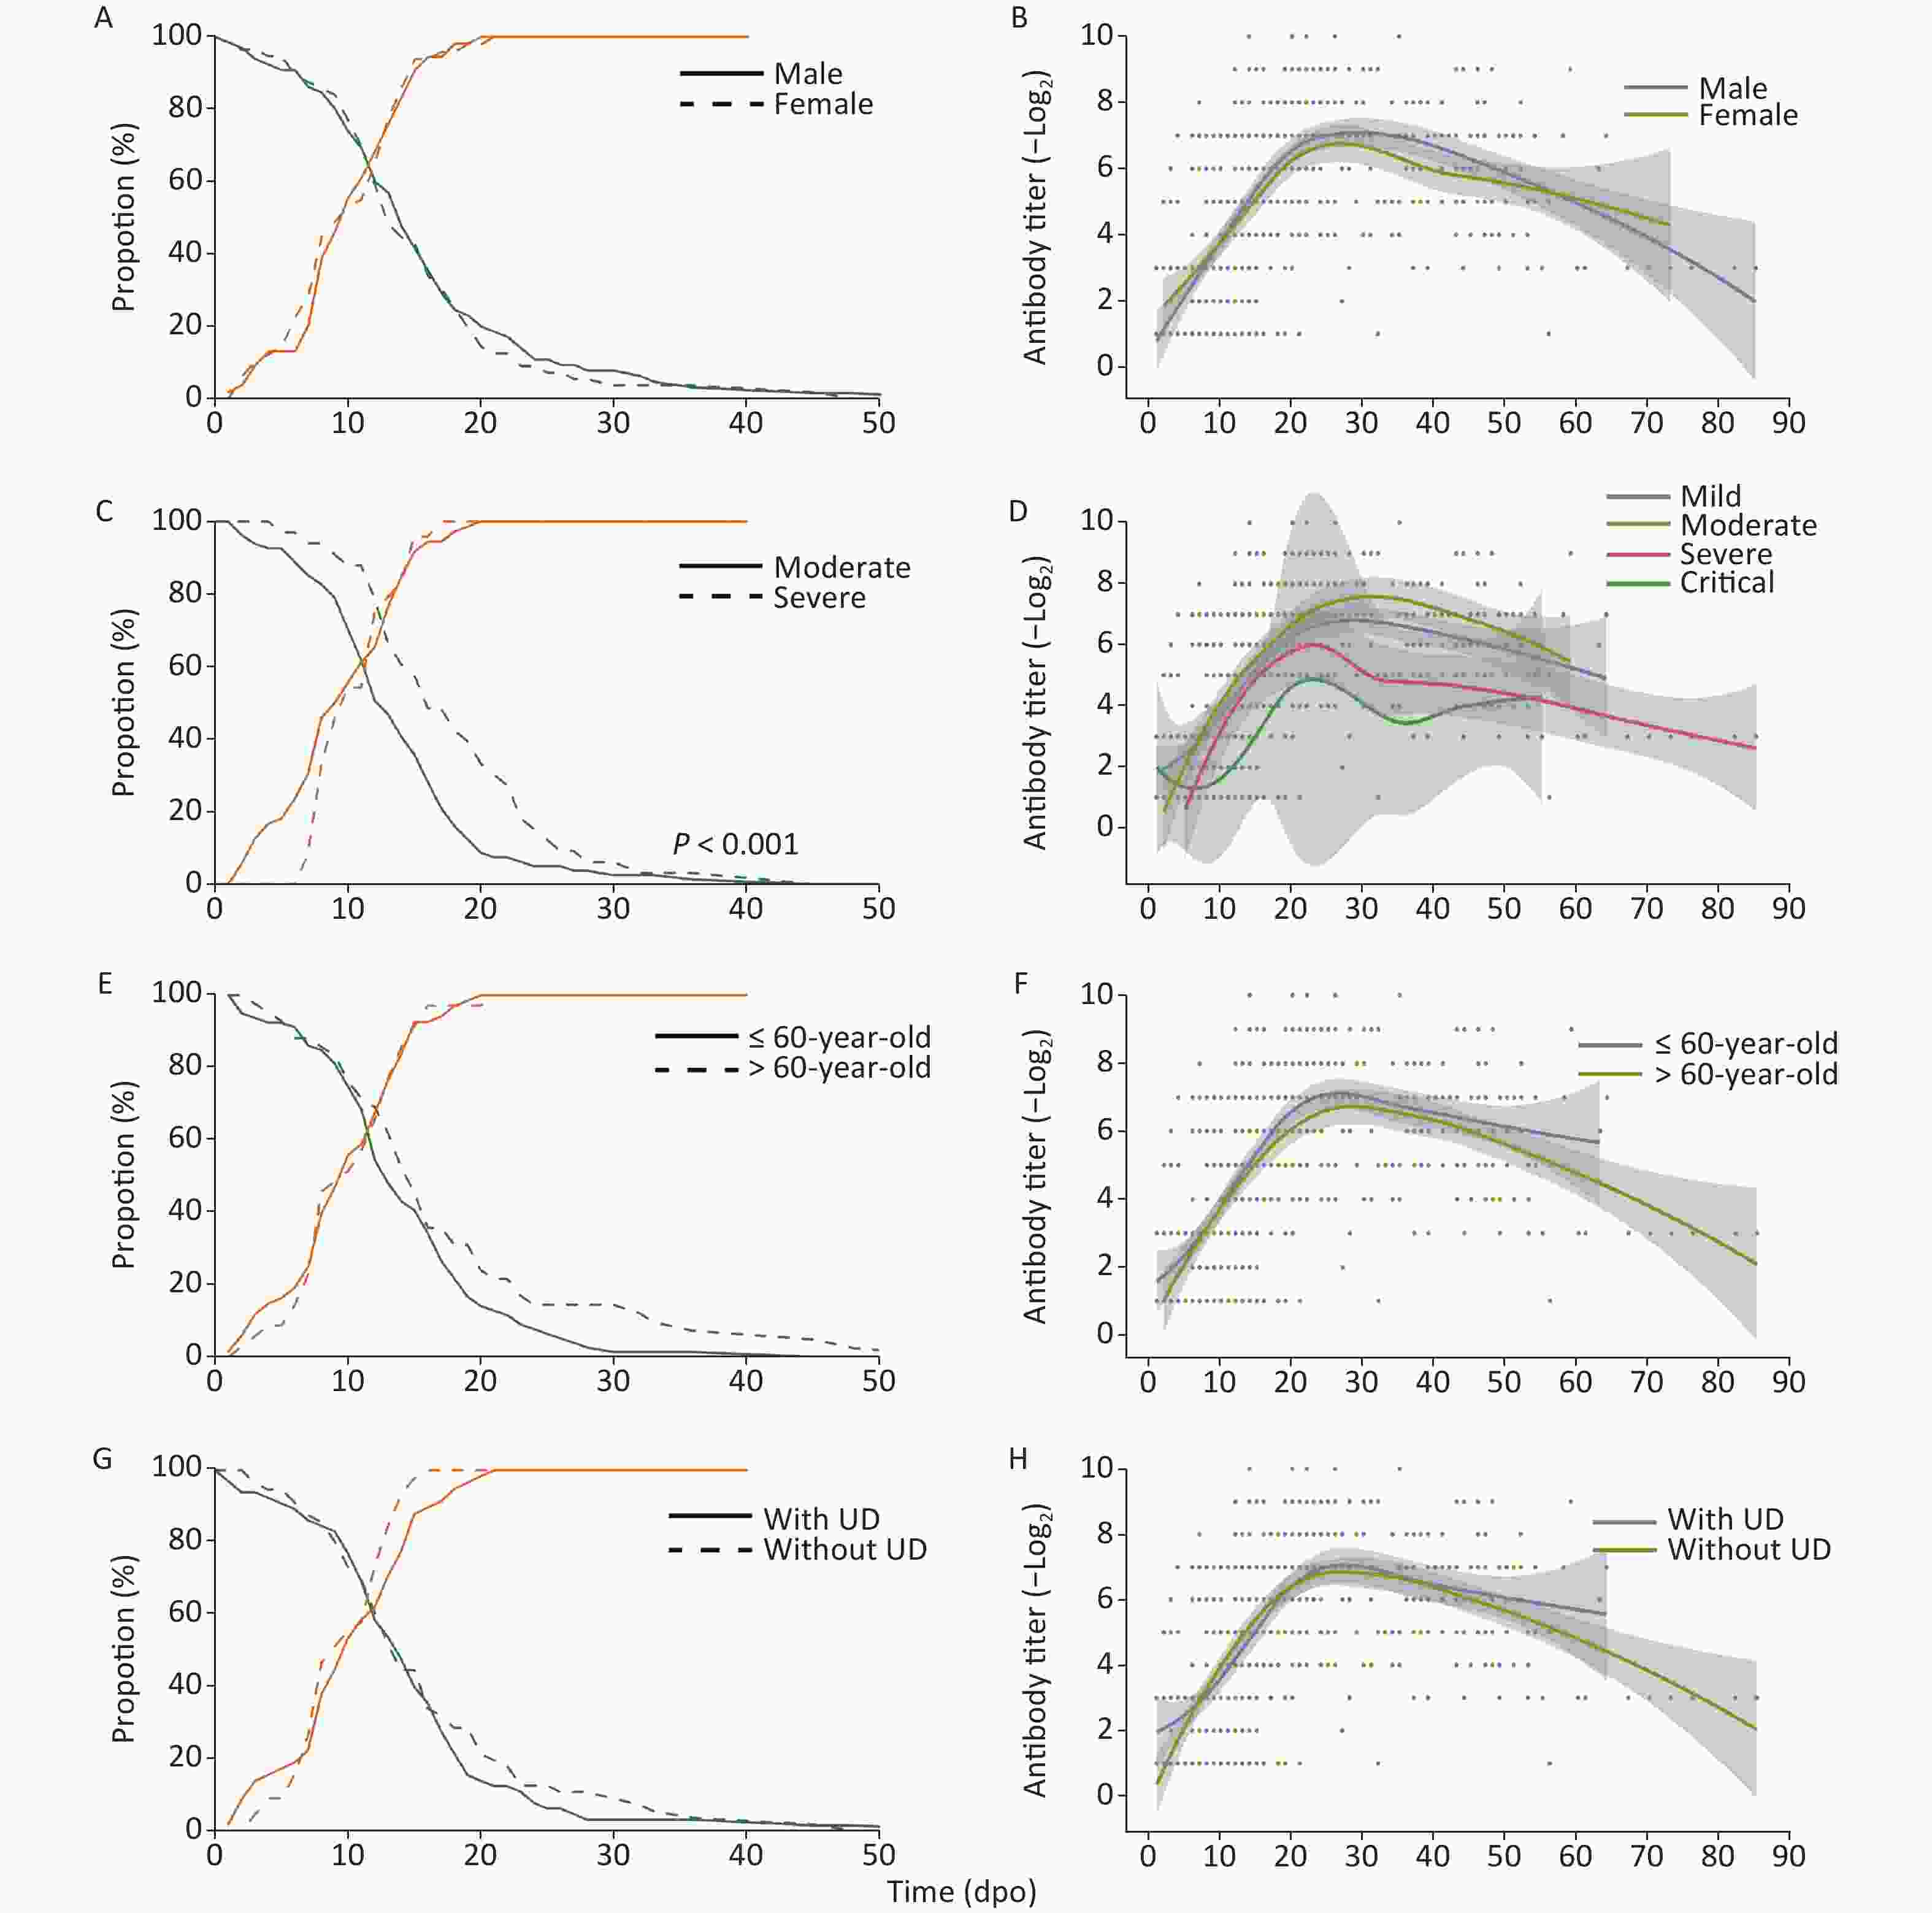
Figure 1. RNA-positive levels and the kinetics of NAbs in COVID-19 patients over time. UD, underlying diseases
Meanwhile, NAb levels increased, peaked at approximately 20–30 dpo, and then decreased as symptoms abated with three different trends detected: 1. stable type, 2. drop type, and 3. wave type (Figure 1 & Table 2) trends. As the NAb testing period may interfere with variability, 51 follow-up cases were selected to study the changes in NAbs. A total of 18 cases (35.3%) showed a stable-type trend since their NAb titers continuously increased or were maintained at a stable level after the peak; 26 cases (51.0%) showed a drop-type trend where NAb expression decreased by at least four times compared with their peak titer; and 7 cases (13.7%) showed a large fluctuation in NAb levels. However, there was no significant difference in trend types between each classification (Table 2). Among all of the cases, six cases older than 60 years and one case that was 58 years showed a wave-type trend, indicating that this type of trend may be associated with older patients. Moreover, the NAb levels of a severe patient were lower than 1:4 in the last antibody test at 56 dpo.
Table 2. Distribution of neutralizing antibody trends in each classificationa
Characteristic Neutralizing antibody trend, n (%) Total χ2 P value Rising type Drop type Wave type Sex 4.46 0.094 Male 8 (26.67) 19 (63.34) 3 (10.00) 30 Female 10 (47.62) 7 (33.33) 4 (19.05) 21 Age (years) 4.73 0.089 ≤ 60 11 (40.74) 15 (55.56) 1 (3.70) 27 > 60 7 (29.17) 11 (45.83) 6 (25.00) 24 Underlying disease 1.89 0.430 No disease 8 (33.33) 11 (45.83) 5 (20.83) 24 ≥ One disease 10 (37.04) 15 (55.56) 2 (7.41) 27 Clinical classification 3.92b 0.166 Mild case 2 (66.67) 1 (33.33) 0 (0) 3 Moderate case 11 (37.93) 16 (55.17) 2 (6.90) 29 Severe case 5 (29.41) 7 (41.18) 5 (29.41) 17 Critical case 0 (0) 2 (100.00) 0 (0) 2 Note. aThere was no statistical difference in the final testing times for each classification. bOnly moderate and severe cases were compared. -
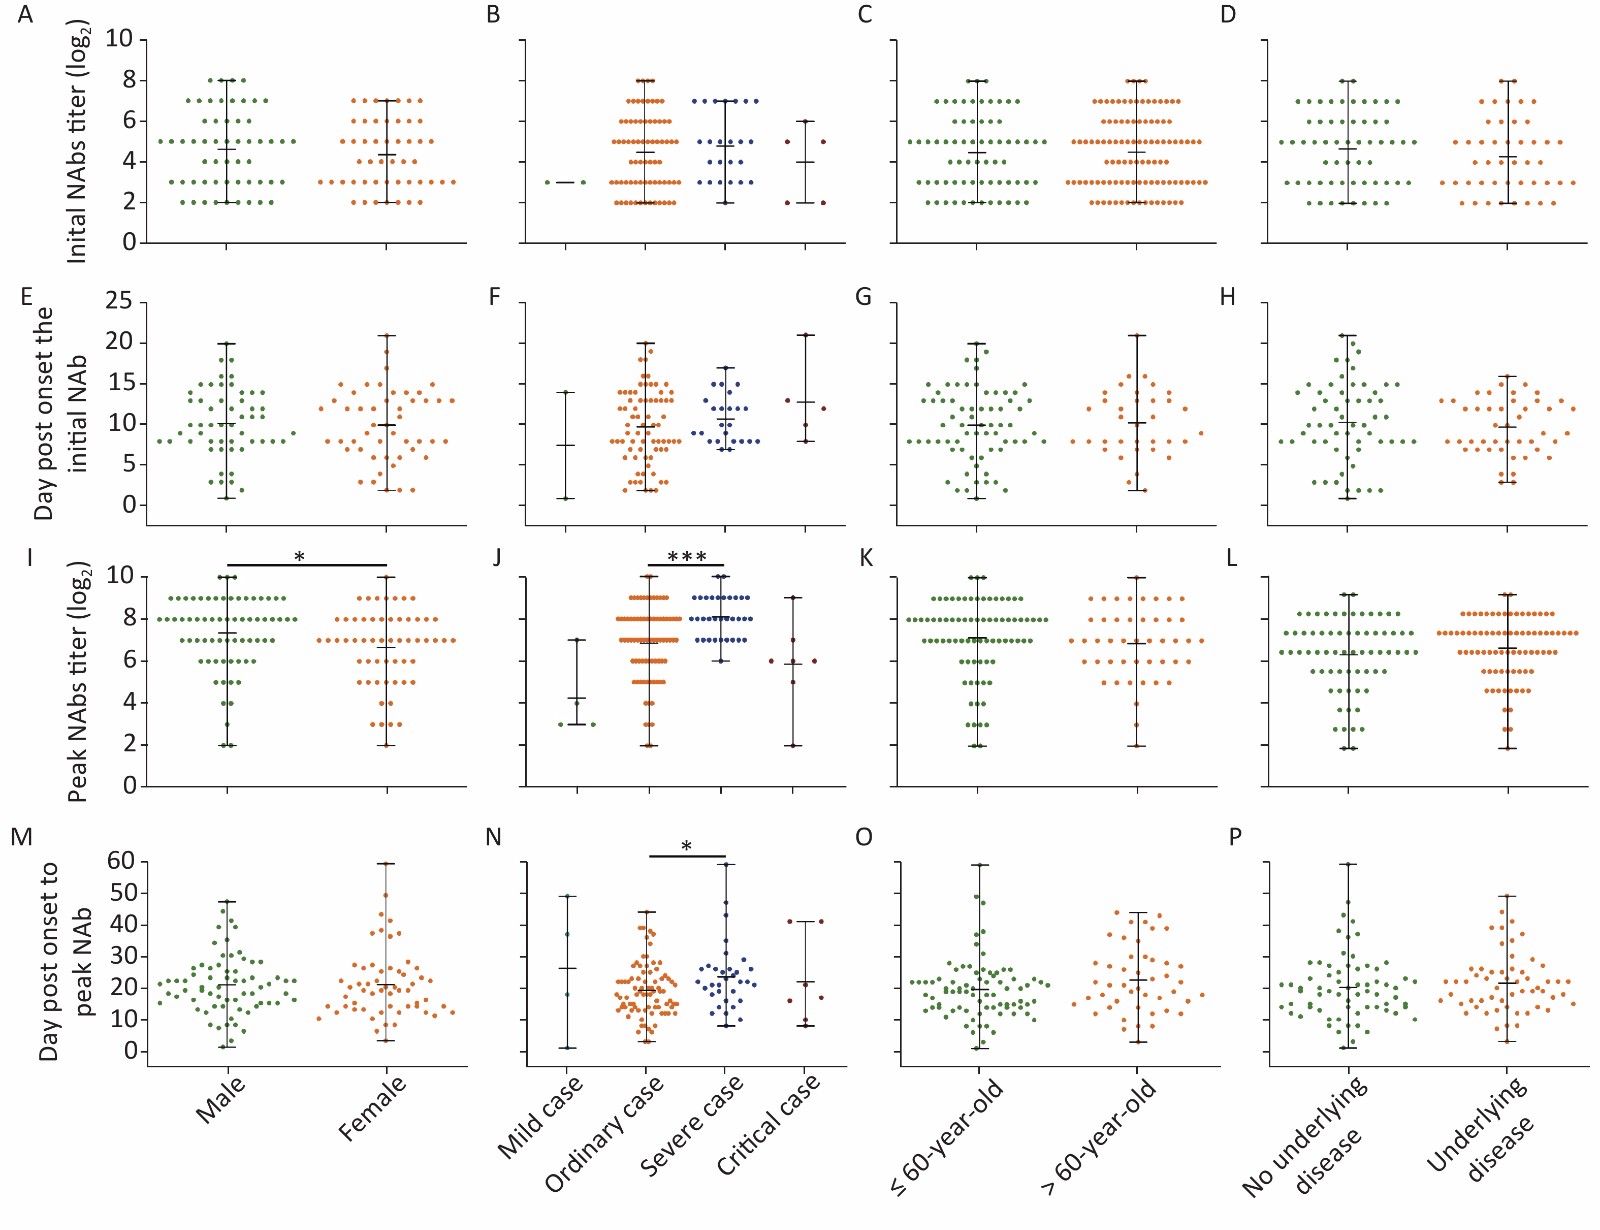
We further analyzed the NAb levels of each group at two time points: the initial detection of NAb formation and the peak titer of NAbs. As the enrollment of patients and serum sampling times were not planned or predictable, the first NAb-positive serum of a patient collected after 10 dpo may interfere with the estimation of the first day of detection of NAb. Therefore, 104 cases were analyzed to estimate the initial day of NAb formation (10.4 ± 5.2 dpo). Peak NAb titers were based on 121 cases (20.8 ± 10.0 dpo), with mild cases that were discharged before their NAb levels reached their peak being omitted from the analysis. Follow-up tests were performed for 51 patients with NAbs, and NAbs were still detectable in one case at 85 dpo with a titer of 1:8.
There was no significant difference between each classification in both NAb levels and the time of initial detection of antibody formation indicating a similar response of NAbs to SARS-CoV-2 (Figure 2). The peak NAb titer in males was slightly higher than that in females (P = 0.019), and the geometric means of the antibody titer were 1:163.14 and 1:101.83, respectively. The peak level of NAbs between each disease severity type was significantly different (P < 0.001); the levels in severe patients were the highest, with a geometric mean antibody titer of 1:272.48, followed by moderate patients with a mean titer of 1:115.36. In addition, the time taken to reach peak NAb titer in severe cases was slightly longer than in moderate cases (Figure 2).
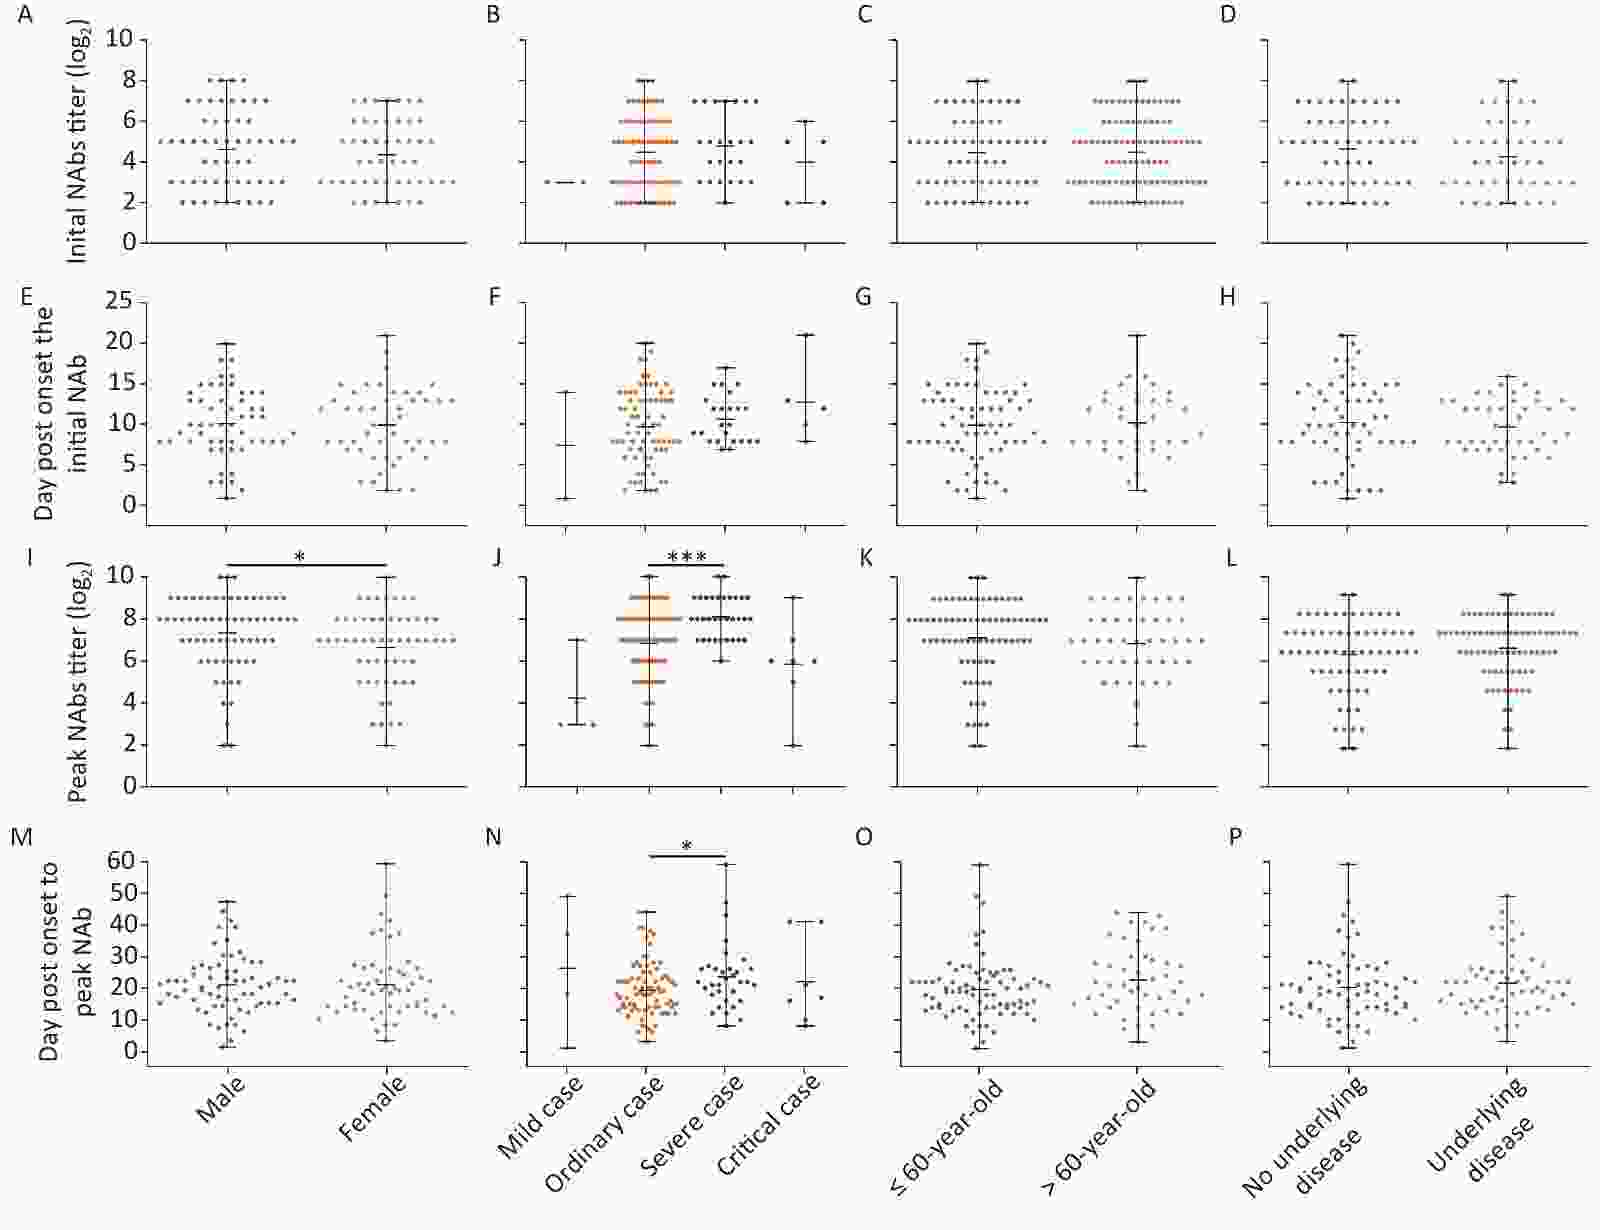
Figure 2. Differences in initial and peak NAb titers against SARS-CoV-2 in patients varying in sex, disease severity, age stratification, and underlying disease status. (A)–(D) Initial NAb levels; (E)–(H) Day(s) post-onset of initial NAb formation; (I)–(L) Highest NAb levels; (M)–(P) Day(s) post-onset to reach the highest NAb levels. Statistical significance was determined using the Student’s t-test (E–H and M–P), Mann–Whitney U test (A, C, D, I, K, L), or Kruskal–Wallis H test (B, F, J, N). *, P < 0.05; ***, P < 0.001.
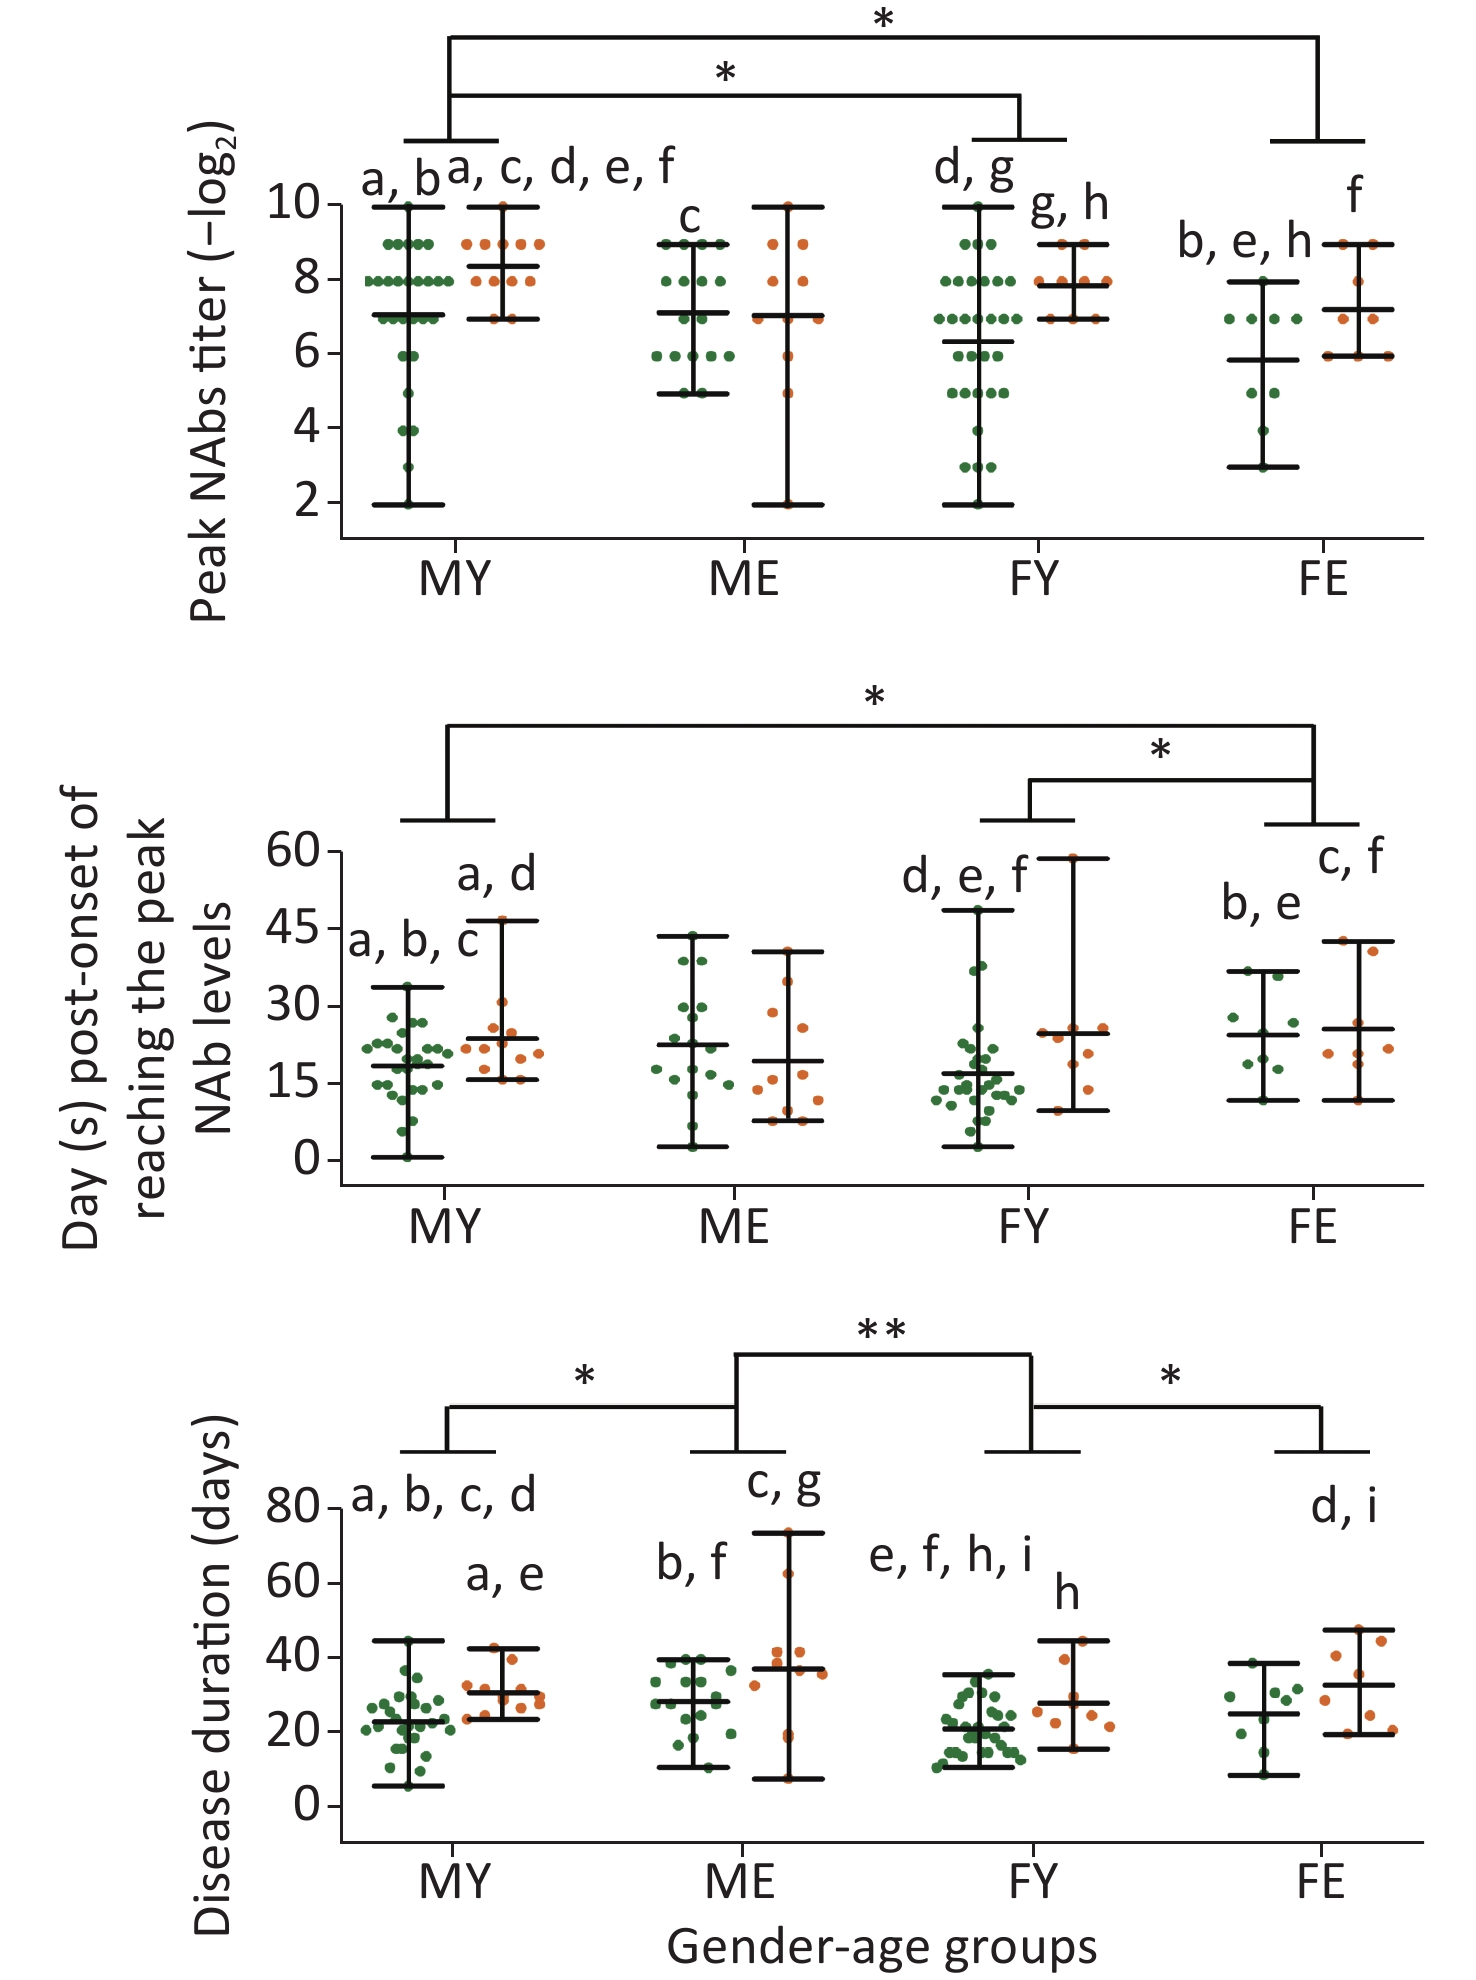
As sex and disease levels showed a discrepancy in the peak NAb levels, we further classified these cases into four groups based on sex and age: younger or equal to 60 years of age, and older than 60 years of age (younger males, MY; younger females, FY; elder males, ME; elder females, FE). The MY group showed higher NAb levels than the FY and FE groups, suggesting that younger men have the fastest response to SARS-CoV-2 (Figure 3).
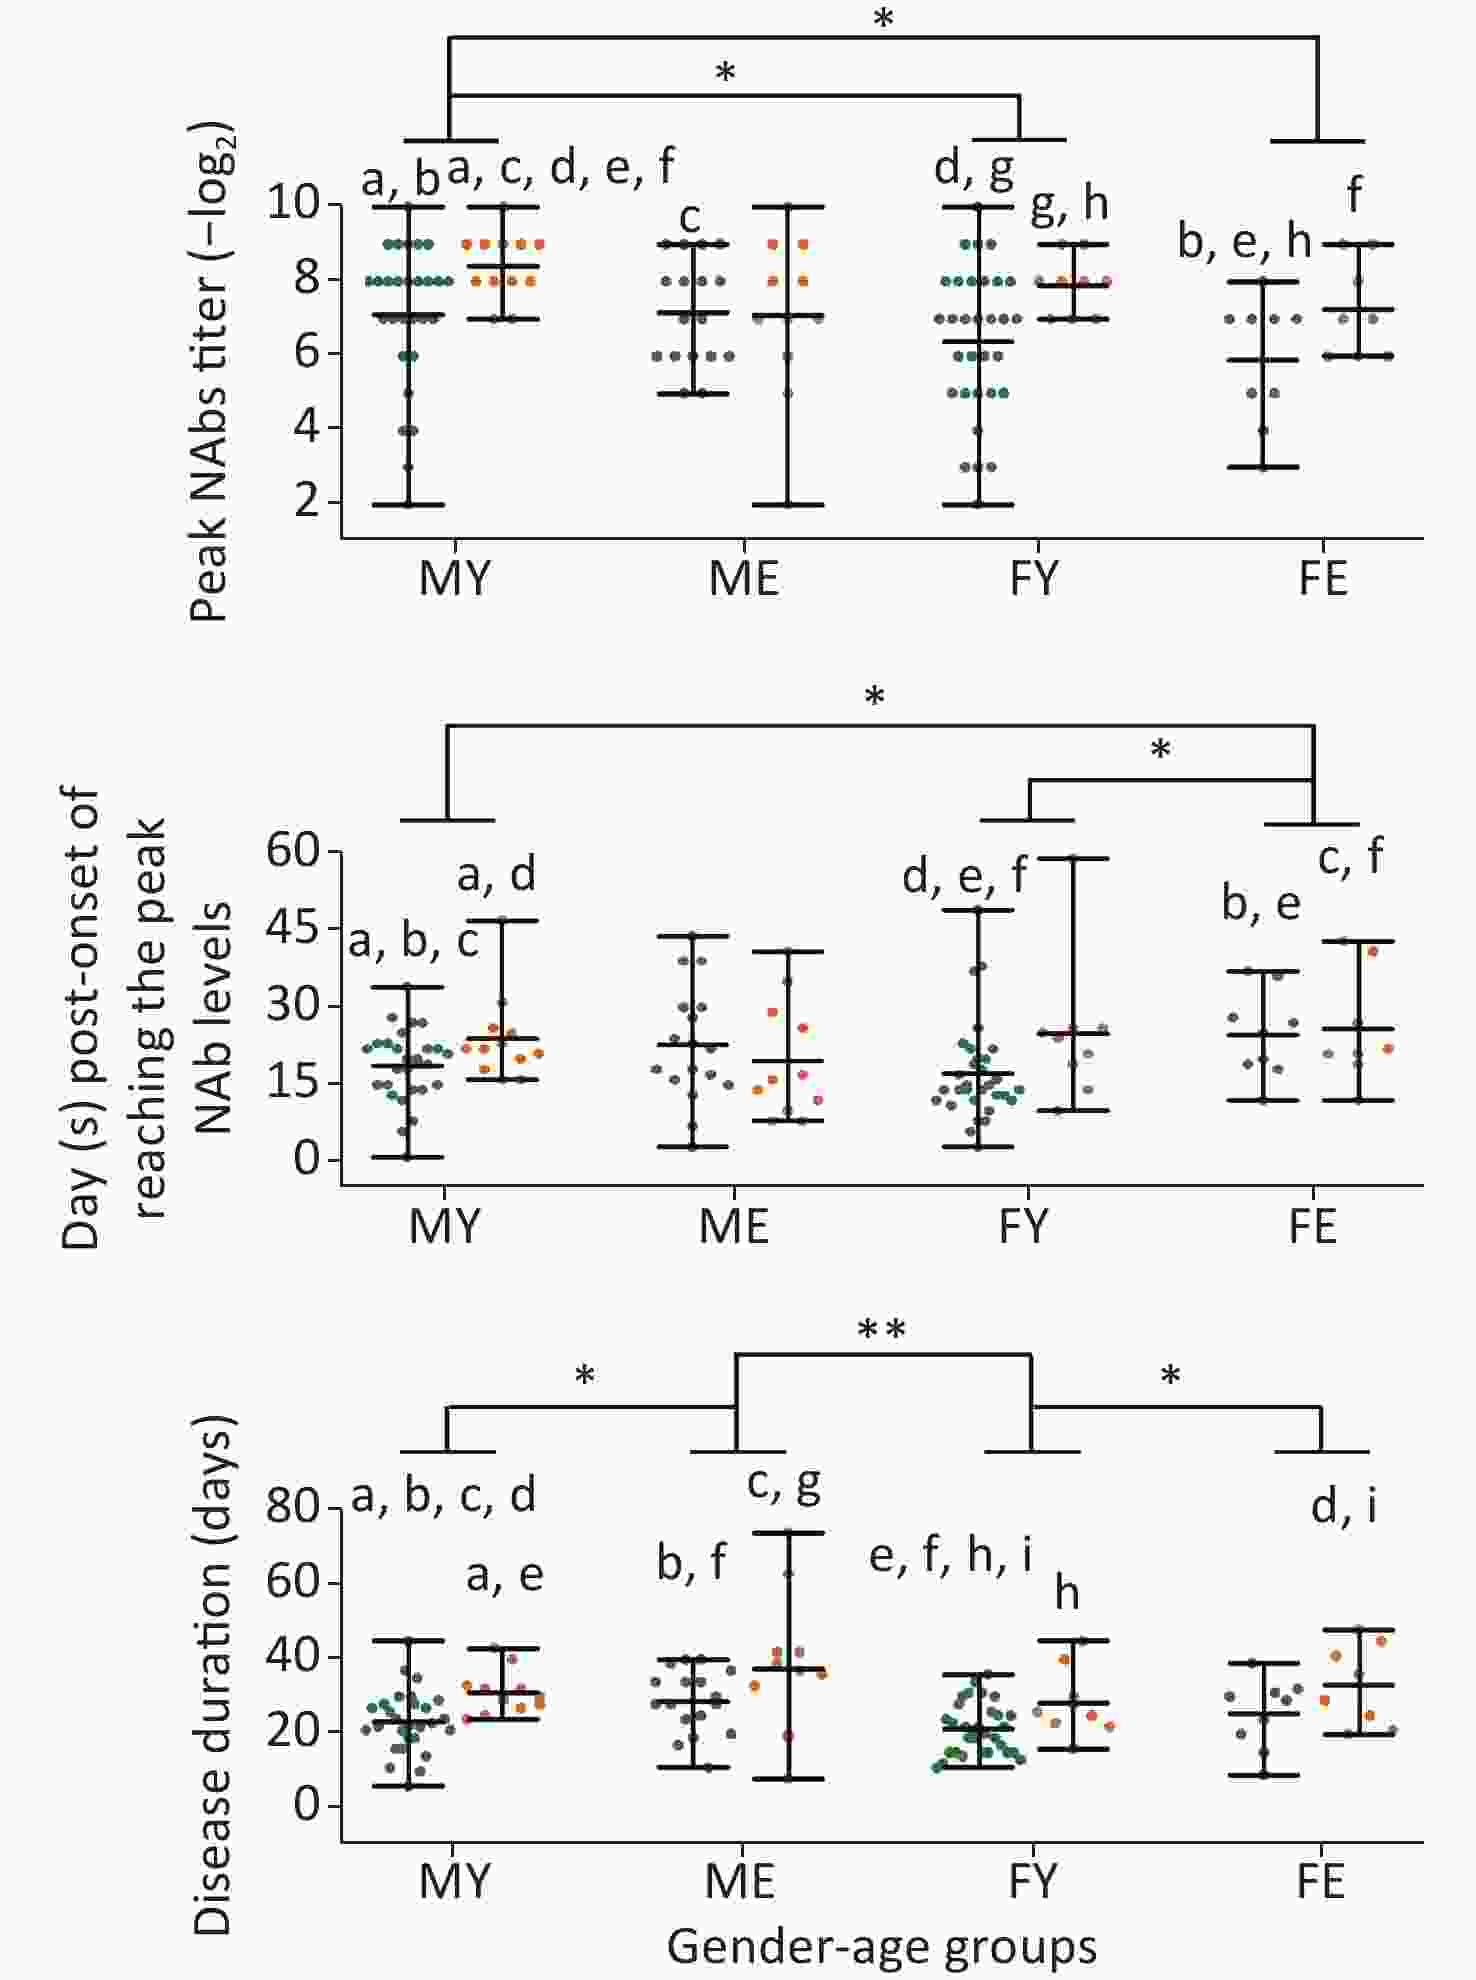
Figure 3. Differences in the peak titer levels, days required to reach peak NAb levels, and disease duration between different sex/age groups. MY, males ≤ 60 years old; ME, males > 60 years old; FY, females ≤ 60 years old; FE, females > 60 years old. Green dots represent mild cases and yellow dots represent severe cases. Statistical significance was determined using the Student’s t-test and Mann–Whitney U test. a–i, indicates a statistically significant difference (P < 0.05) between groups that have the same letter in each graph. *, P < 0.05; **, P < 0.01.
In addition, severe cases younger than 60 years of age had higher NAb levels than mild cases; however, this trend was not observed for older patients. The MY and FY groups reached peak Nab levels quickly and were discharged, whereas no difference was observed for the ME and FE groups, indicating that older patients experience weaker responses to SARS-CoV-2, thereby prolonging the disease duration.
-
Similar to a previous report on the induction of NAbs by coronaviruses [9], it took an average of 10 dpo for NAbs to be initially detected in this study. We found that the peak NAb levels correlated with disease severity, with the exception of critical cases, which was consistent with previous studies [10,11]. In severe cases, the peak NAb titer was reached slightly later than in moderate cases, and as the clearance of RNA was notably late in severe cases, the delay in the NAb peak may reflect conflict between antibody production and the presence of SARS-CoV-2 particles.
The longevity of NAbs is an important factor in assessing the risk of infection and in the development of vaccines against SARS-CoV-2. In one study, the IgG levels against the viral spike protein of SARS-CoV-2 were relatively stable for at least 5 months [12]. A recent study reported that NAbs against the wild-type virus and S protein-IgG persisted in 89% and 97% of cases, respectively, for at least a year after infection, the levels of which were higher in severe cases [13]. However, another study reported that 33% of samples collected on 39 dpo showed a rapid decline in antibody levels [14]. In this study, only one follow-up case showed an absence of detectable NAbs at 56 dpo, whereas NAbs remained in the other samples at 85 dpo.
Another key factor is the level of protection offered by NAbs, which is an important indicator of the vaccine’s availability. An early study of porcine reproductive and respiratory syndrome virus (PRRSV) demonstrated that an NAb titer of 1:8 in blood was enough to block viremia but could not block local replication in peripheral tissue and transmission to other animals. A titer of 1:32 or higher was suggested to induce sterilizing immunity [15]. In this study, NAbs in samples collected after 60 dpo were still detectable, with titers ranging from 1:8 to 1:128. This indicated that the protective effects of the NAbs may persist for at least 2–3 months after SARS-CoV-2 infection and suggested that protection from reinfection may be strengthened by vaccine boosters [11]. However, the strong fluctuation of NAb levels in some older patients may affect their resistance to the virus. Moreover, with the increasing prevalence of various mutant strains, antibodies induced by wild-type virus may not effectively neutralize mutant strains [16]. Some variants have shown antibody escape against vaccines developed based on wild-type viruses [17]. Therefore, continuous monitoring of NAb is needed to provide the basis for risk assessment of variants in this pandemic.
Males younger than 60 years of age exhibited the highest titer and required the shortest time period for reaching peak NAb levels compared with all other groups; whereas, peak NAb formation was not significant between older males and females, which may be due to a generally weaker immune system in older people and a weaker response to SARS-CoV-2 infections compared with younger people. However, it has been previously reported that females generally have greater antibody responses to viral infection and vaccination, albeit with higher levels of autoreactivity [18,19]. In recent studies, stronger T-cell activation was observed in female patients after SARS-CoV-2 infection [20], while males exhibited reduced expression of B and NK cell-specific transcripts and an increase in levels of inhibitors of nuclear factor-κB [21]. Although the response to SARS-CoV-2 was stronger in males in this study, based on the titer and the speed of the response, they also had a stronger tendency for drop-type trends, indicative of a shorter protective period for NAbs.
-
We demonstrated the trend for NAb levels in a wide variety of COVID-19 patients by performing a SARS-CoV-2 neutralization assay. It took an average of 10 days for patients to produce NAbs, with young males exhibiting the highest peak levels in the shortest time period. However, NAb levels were more likely to decrease over time in males, suggesting that this group is more susceptible to reinfection. NAbs remained at a protective level in some samples at the end of our observation. Long-term studies are needed in the future to determine the reactivation and protective efficiency of NAbs induced by SARS-CoV-2 vaccines.
-
Dr. LI Ling Hua collected and collated basic information from patients and wrote the manuscript; Dr. TU Hong Wei constructed figures, analyzed data, and wrote the manuscript; Ms. LIANG Dan performed micro-neutralization assays, analyzed data, and wrote the manuscript; Dr. LI Ling Hua, Dr. TU Hong Wei, and Ms. LIANG Dan contributed equally. WEN Chun Yan, HU Feng Yu, and LIN Wei Yin collected and collated clinical information from patients. LI An An, HONG Wen Shan, SU Juan, YUAN Run Yu, and ZHOU Ping Ping performed micro-neutralization assays. HU Ke Qi constructed figures and analyzed data; LI Yue Ping, ZHAO San Tao, LI Wei, and TANG Xiao Ping collated basic information from patients. KE Chang Wen, KE Bi Xia, and CAI Wei Ping designed this study and interpreted the data.
-
The protocol of the study was reviewed and approved by the Medical Ethical Committee of Guangzhou Eighth People's Hospital (approval number: 202001134).
-
The authors declare no conflicts of interest.
-
No financial disclosures were reported by the authors of this paper.
doi: 10.3967/bes2021.133
Kinetic Characteristics of Neutralizing Antibody Responses Vary among Patients with COVID-19
-
Abstract:
Objective The coronavirus disease 2019 (COVID-19) pandemic continues to present a major challenge to public health. Vaccine development requires an understanding of the kinetics of neutralizing antibody (NAb) responses to severe acute respiratory syndrome coronavirus 2 (SARS-CoV-2). Methods In total, 605 serum samples from 125 COVID-19 patients (from January 1 to March 14, 2020) varying in age, sex, severity of symptoms, and presence of underlying diseases were collected, and antibody titers were measured using a micro-neutralization assay with wild-type SARS-CoV-2. Results NAbs were detectable approximately 10 days post-onset (dpo) of symptoms and peaked at approximately 20 dpo. The NAb levels were slightly higher in young males and severe cases, while no significant difference was observed for the other classifications. In follow-up cases, the NAb titer had increased or stabilized in 18 cases, whereas it had decreased in 26 cases, and in one case NAbs were undetectable at the end of our observation. Although a decreasing trend in NAb titer was observed in many cases, the NAb level was generally still protective. Conclusion We demonstrated that NAb levels vary among all categories of COVID-19 patients. Long-term studies are needed to determine the longevity and protective efficiency of NAbs induced by SARS-CoV-2. -
Key words:
- Sex /
- Kinetics /
- Neutralizing antibody /
- SARS-CoV-2
注释: -
Figure 1. RNA-positive levels and the kinetics of NAbs in COVID-19 patients over time. UD, underlying diseases
Left panels present the decline of RNA-positive cases (green) as a percentage of the total number of patients and a cumulative frequency of seroconversion (orange) in each classification. Right panels present the kinetics of NAbs, with the line showing the mean NAb levels from a Loess regression model and the gray area indicating the pointwise 95% confidence interval. (A–B) represent male patients with a solid line (LHS) and a blue line (RHS), and female patients with a dashed line (LHS) and a yellow line (RHS), respectively; (C–D) represent mild cases with a green line (RHS), moderate cases with a solid line (LHS) and blue line (RHS), severe cases with a dashed line (LHS, significantly longer duration of RNA-positive levels compared with moderate cases) and a yellow line (RHS), respectively, and critical cases each with a red line; (E–F) represent patients less than or equal to 60 years of age as a solid line (LHS) or a blue line (RHS) and patients over 60 year of age as a dashed line (LHS) or a yellow line (RHS), respectively; (G–H) show patients with underlying diseases as solid lines (LHS) and blue lines (RHS), and without underlying diseases as dashed lines (LHS) and yellow lines (RHS), respectively.
Figure 2. Differences in initial and peak NAb titers against SARS-CoV-2 in patients varying in sex, disease severity, age stratification, and underlying disease status. (A)–(D) Initial NAb levels; (E)–(H) Day(s) post-onset of initial NAb formation; (I)–(L) Highest NAb levels; (M)–(P) Day(s) post-onset to reach the highest NAb levels. Statistical significance was determined using the Student’s t-test (E–H and M–P), Mann–Whitney U test (A, C, D, I, K, L), or Kruskal–Wallis H test (B, F, J, N). *, P < 0.05; ***, P < 0.001.
Figure 3. Differences in the peak titer levels, days required to reach peak NAb levels, and disease duration between different sex/age groups. MY, males ≤ 60 years old; ME, males > 60 years old; FY, females ≤ 60 years old; FE, females > 60 years old. Green dots represent mild cases and yellow dots represent severe cases. Statistical significance was determined using the Student’s t-test and Mann–Whitney U test. a–i, indicates a statistically significant difference (P < 0.05) between groups that have the same letter in each graph. *, P < 0.05; **, P < 0.01.
Table 1. Characteristics of the COVID-19 patients in this study
Characteristic Clinical classification Total Mild case Moderate case Severe case Critical cases Sex, n (%) Male 1 (1.47) 44 (64.71) 18 (26.47) 5 (7.35) 68 (100.00) Female 3 (5.26) 37 (64.91) 15 (26.32) 2 (3.51) 57 (100.00) Age (years) 40.5 ± 15.4 51.3 ± 14.8 56.0 ± 12.5 72.4 ± 8.0 53.4 ± 15.0 ≤ 60, n (%) 3 (3.80) 55 (69.62) 21 (26.58) 0 (0) 79 (100.00) > 60, n (%) 1 (2.17) 26 (56.52) 12 (26.09) 7 (15.22) 46 (100.00) Underlying disease, n (%) No disease 2 (2.94) 48 (70.59) 14 (20.59) 4 (5.88) 68 (100.00) ≥ One disease 2 (3.51) 33 (57.89) 19 (33.33) 3 (5.26) 57 (100.00) Oxygen supplement requirement, n (%) No requirement 3 (8.57) 32 (91.43) 0 (0) 0 (0) 35 (100.00) Low flow oxygen 1 (1.72) 48 (82.76) 9 (15.52) 0 (0) 58 (100.00) High flow oxygen 0 (0) 1 (4.35) 22 (95.65) 0 (0) 23 (100.00) Mechanical ventilation 0 (0) 0 (0) 2 (40.00) 3 (60.00) 5 (100.00) ECMOa 0 (0) 0 (0) 0 (0) 4 (100.00) 4 (100.00) Disease duration (days) 12.3 ± 5.9 24.5 ± 8.0 31.2 ± 7.8 39.4 ± 24.3 26.7 ± 10.5 ≤ 21, n (%) 4 (10.00) 30 (75.0) 3 (7.50) 3 (7.50) 40 (100.00) > 21, n (%) 0 (0) 51 (60.00) 30 (35.29) 4 (4.71) 85 (100.00) Note. aECMO, Extracorporeal membrane oxygenation.  下载: 导出CSV
Table 2. Distribution of neutralizing antibody trends in each classificationa
Characteristic Neutralizing antibody trend, n (%) Total χ2 P value Rising type Drop type Wave type Sex 4.46 0.094 Male 8 (26.67) 19 (63.34) 3 (10.00) 30 Female 10 (47.62) 7 (33.33) 4 (19.05) 21 Age (years) 4.73 0.089 ≤ 60 11 (40.74) 15 (55.56) 1 (3.70) 27 > 60 7 (29.17) 11 (45.83) 6 (25.00) 24 Underlying disease 1.89 0.430 No disease 8 (33.33) 11 (45.83) 5 (20.83) 24 ≥ One disease 10 (37.04) 15 (55.56) 2 (7.41) 27 Clinical classification 3.92b 0.166 Mild case 2 (66.67) 1 (33.33) 0 (0) 3 Moderate case 11 (37.93) 16 (55.17) 2 (6.90) 29 Severe case 5 (29.41) 7 (41.18) 5 (29.41) 17 Critical case 0 (0) 2 (100.00) 0 (0) 2 Note. aThere was no statistical difference in the final testing times for each classification. bOnly moderate and severe cases were compared.
下载: 导出CSV
-
[1] Chen C, Shi Q, Dong XP. Analyses of the duration and dynamics of the COVID-19 epidemic in 11 severely affected countries. Biomed Environ Sci, 2021; 34, 739−42. [2] Yang YS, Peng FJ, Wang RS, et al. The deadly coronaviruses: The 2003 SARS pandemic and the 2020 novel coronavirus epidemic in China. J Autoimmun, 2020; 109, 102434. doi: 10.1016/j.jaut.2020.102434 [3] Goh GKM, Dunker AK, Foster JA, et al. Rigidity of the outer shell predicted by a protein intrinsic disorder model sheds light on the COVID-19 (Wuhan-2019-nCoV) infectivity. Biomolecules, 2020; 10, 331. doi: 10.3390/biom10020331 [4] Petersen E, Koopmans M, Go U, et al. Comparing SARS-CoV-2 with SARS-CoV and influenza pandemics. Lancet Infect Dis, 2020; 20, e238−44. doi: 10.1016/S1473-3099(20)30484-9 [5] Subbarao K, Mcauliffe J, Vogel L, et al. Prior infection and passive transfer of neutralizing antibody prevent replication of severe acute respiratory syndrome coronavirus in the respiratory tract of mice. J Virol, 2004; 78, 3572−7. doi: 10.1128/JVI.78.7.3572-3577.2004 [6] Yu FT, Yan LT, Wang N, et al. Quantitative detection and viral load analysis of SARS-CoV-2 in infected patients. Clin Infect Dis, 2020; 71, 793−8. doi: 10.1093/cid/ciaa345 [7] Diagnosis and treatment of pneumonitis caused by new coronavirus (trial version 7). http://bgs.satcm.gov.cn/zhengcewenjian/2020-03-04/13594.html. [2020-03-03]. (In Chinese) [8] Kenny MT, Albright KL, Sanderson RP. Microneutralization test for the determination of mumps antibody in vero cells. Appl Microbiol, 1970; 20, 371−3. doi: 10.1128/am.20.3.371-373.1970 [9] Chan JFW, Lau SKP, To KKW, et al. Middle East respiratory syndrome coronavirus: another zoonotic betacoronavirus causing SARS-like disease. Clin Microbiol Rev, 2015; 28, 465−522. doi: 10.1128/CMR.00102-14 [10] Wang YQ, Zhang L, Sang L, et al. Kinetics of viral load and antibody response in relation to COVID-19 severity. J Clin Invest, 2020; 130, 5235−44. doi: 10.1172/JCI138759 [11] Seow J, Graham C, Merrick B, et al. Longitudinal observation and decline of neutralizing antibody responses in the three months following SARS-CoV-2 infection in humans. Nat Microbiol, 2020; 5, 1598−607. doi: 10.1038/s41564-020-00813-8 [12] Wajnberg A, Amanat F, Firpo A, et al. Robust neutralizing antibodies to SARS-CoV-2 infection persist for months. Science, 2020; 370, 1227−30. doi: 10.1126/science.abd7728 [13] Haveri A, Ekström N, Solastie A, et al. Persistence of neutralizing antibodies a year after SARS-CoV-2 infection. medRxiv, 2021. [14] Robbiani DF, Gaebler C, Muecksch F, et al. Convergent antibody responses to SARS-CoV-2 in convalescent individuals. Nature, 2020; 584, 437−42. doi: 10.1038/s41586-020-2456-9 [15] Lopez OJ, Oliveira MF, Garcia EA, et al. Protection against porcine reproductive and respiratory syndrome virus (PRRSV) infection through passive transfer of PRRSV-neutralizing antibodies is dose dependent. Clin Vaccine Immunol, 2007; 14, 269−75. doi: 10.1128/CVI.00304-06 [16] Carreño JM, Alshammary H, Singh G, et al. Reduced neutralizing activity of post-SARS-CoV-2 vaccination serum against variants B. 1.617. 2, B. 1.351, B. 1.1. 7+E484K and a sub-variant of C. 37. medRxiv, 2021. [17] Bates TA, Leier HC, Lyski ZL, et al. Neutralization of SARS-CoV-2 variants by convalescent and BNT162b2 vaccinated serum. Nat Commun, 2021; 12, 5135. doi: 10.1038/s41467-021-25479-6 [18] Sakiani S, Olsen NJ, Kovacs WJ. Gonadal steroids and humoral immunity. Nat Rev Endocrinol, 2013; 9, 56−62. doi: 10.1038/nrendo.2012.206 [19] Scully EP, Haverfield J, Ursin RL, et al. Considering how biological sex impacts immune responses and COVID-19 outcomes. Nat Rev Immunol, 2020; 20, 442−7. doi: 10.1038/s41577-020-0348-8 [20] Takahashi T, Ellingson MK, Wong P, et al. Sex differences in immune responses that underlie COVID-19 disease outcomes. Nature, 2020; 588, 315−20. doi: 10.1038/s41586-020-2700-3 [21] Lieberman NAP, Peddu V, Xie H, et al. In vivo antiviral host transcriptional response to SARS-CoV-2 by viral load, sex, and age. PLoS Biol, 2020; 18, e3000849. doi: 10.1371/journal.pbio.3000849 -

 点击查看大图
计量
- 文章访问数: 814
- HTML全文浏览量: 311
- PDF下载量: 124
- 被引次数: 0

 Quick Links