

 下载:
下载:


-
Since the outbreak of COVID-19, countries and regions worldwide have implemented multifaceted prevention and control measures, including vaccinations, antiviral drugs, mask wearing, and social distancing. However, omicron variants, with significantly increased endogenous and occult transmission, have significantly complicated epidemic prevention and control[1]. Thus, studying the key and difficult aspects that affect the effectiveness of prevention and control of omicron can provide a reference for the spread of other respiratory infectious diseases. SARS-CoV-2 infection is influenced by multiple factors such as viral transmission, ventilation, personal protective equipment (PPE), population density, and contact time[2]. In November 2022, a new wave of the COVID-19 pandemic occurred in Beijing, China. Gene sequencing analysis indicated that the majority of SARS-CoV-2 cases at this stage were omicron variants BA.7 and BA.5.2[3]. To better understand the characteristics of the population infected with the omicron variant, our study adopted a case-control design to analyze the factors that affect SARS-CoV-2 infection in Beijing.
Our study used a 1:4 case-control design. Participants were community-identified cases (case group) reported in Beijing in November 2022 and healthy people (control group) in the same community. A total of 995 participants completed the questionnaires. Subsequently, 434 were selectedvia Propensity Score Matching (PSM). The sample size estimation and investigation processes are presented in Supplementary 1 (available in www.besjournal.com).
The inclusion criteria in the case group were as follows: 1) positive nucleic acid of SARS-CoV-2; 2) community-identified cases, defined as cases diagnosed in the community, who could freely transmit the virus through social interactions before quarantine or medical treatment; 3) age ≥ 18 years old; 4) willing to participate in this study based on the principle of informed consent.
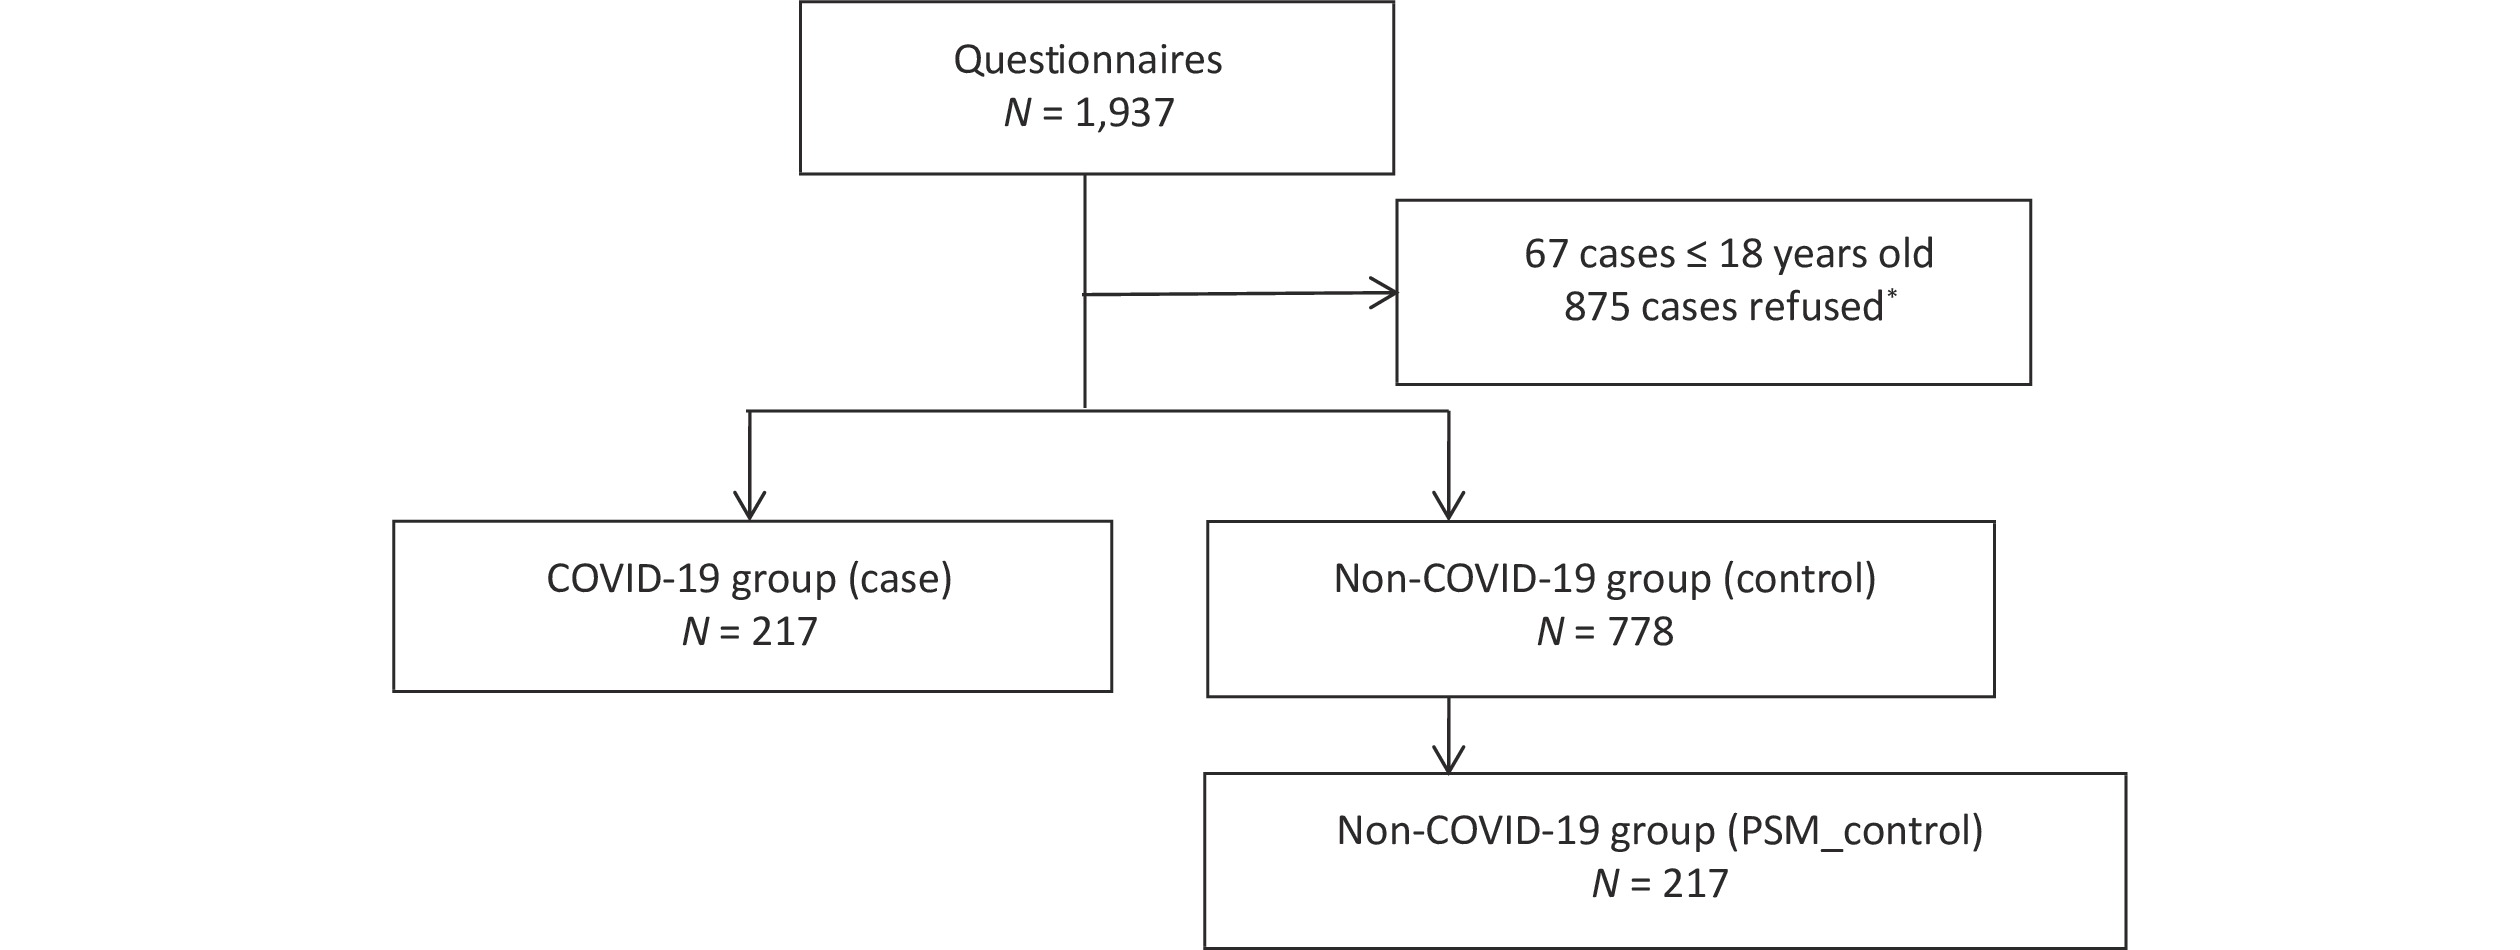
The exclusion criteria in the case group were as follows: 1) close contacts of known confirmed cases, 2) re-infection cases, 3) patients with severe conditions who could not cooperate with the investigators, and 4) individuals judged by the researchers as unsuitable for the study. Flow chart of study participants as shown in Supplementary Figure S1 (available in www.besjournal.com).

Figure S1. Flow chart of study participants. Participants with or without history of SARS-CoV-2 infection Beijing during November 2022 were considered. The left side of the diagram represents the flowchart for the COVID-19 group (community-found cases). The community-found cases were defined as cases, who could freely transmit the virus through social interactions before quarantine or medical treatment. The right side shows the inclusion flowchart for the non-COVID-19 group and matched through PSM, who living in the same community as the infected person. *There was no significant difference in age and gender between those refused and agreed to participate (P > 0.05).
The inclusion criteria for the control group were as follows: 1) living in the same community as the infected person; 2) no positive antigen or nucleic acid detected within seven days after the infected person in the community was detected; 3) same sex; and 4) age difference of less than five years.
The exclusion criteria for the control group were as follows: 1) living with infected individuals, 2) living on the same floor or in the same building as the infected person, and 3) a previous infection.
All information was obtained via questionnaire conducted through face-to-face and telephone interviews. The information collected in the questionnaire included: 1) demographic data, including age, gender, vaccination status, and chronic diseases (defined broadly as conditions that last 1 year or more and require ongoing medical attention or limit activities of daily living or both, such as heart disease, cancer, and diabetes); 2) residential environment, including residential type, ventilation condition, and number of roommates; 3) personal hygiene, including daily mask type, and hand disinfection; 4) nucleic acid sampling, including sampling frequency, type and position of sampling sites, ventilation conditions, arrangements of sampling site, mask type when sampling, and standardization of operation; 5) social activity in the November 2022, including complexity of activity, number of social places visited, and restaurants visited.
R4.2.2 was used for exploratory factor analysis (EFA), Propensity Score Matching (PSM), matched conditional logistic regression, and other statistical analyses. EFA was used to determine the analytical dimensions of the nucleic acid sampling factor[4], and the results are shown in Supplementary 2 (available in www.besjournal.com). PSM was used to mitigate the influence of age, gender, residential type, ventilation of residence, and compare “case” and “control” groups. Matched conditional logistic regression was used to determine independent risk factors associated with infection, expressedasoddsratios (OR) and 95% confidence intervals (95% CI). Descriptive statistics and $ {\chi }^{2} $/F test were used to analyze the differences of basic characteristics between cases and controls. Statistical significance was set at P < 0.05.
Of the 995 participants, 217 were from the case group and 778 were from the control group. There were 522 males, accounting for 52.5% of the sample size, and of all participants, 159 were aged 60 years or above, accounting for 16.0% of the sample size. The difference between “case” and “control” groups before and after matching were not statistically significant (P > 0.05), as shown in Table 1.
Table 1. Basic characteristics of the study groups, n (%)
Variables Before matching After matching Case (N = 217) Control (N = 778) P Case (N = 217) Control (N = 217) P Gender Male 121 (55.76) 401 (51.54) 0.271 119 (54.84) 121 (55.76) 0.847 Female 96 (44.24) 377 (48.46) 98 (45.16) 96 (44.24) Age (years)a 18–29 35 (16.13) 154 (19.79) 0.317 39 (17.97) 35 (16.13) 0.405 30–39 54 (24.88) 220 (28.28) 67 (30.88) 54 (24.88) 40–49 49 (22.58) 156 (20.05) 35 (16.13) 49 (22.58) 50–59 46 (21.20) 122 (15.68) 40 (18.43) 46 (21.20) 60–69 24 (11.06) 94 (12.08) 29 (13.36) 24 (11.06) ≥ 70 9 (4.15) 32 (4.11) 7 (3.23) 9 (4.15) Vaccination Yes 195 (89.86) 701 (90.10) 0.769 191 (88.02) 195 (89.86) 0.540 No 22 (10.14) 77 (9.90) 26 (11.98) 22 (10.14) Chronic disease Yes 46 (21.20) 113 (14.52) 0.018 36 (16.59 ) 46 (21.20) 0.220 No 171 (78.80) 665 (85.48) 181 (83.41) 171 (78.80) Residential type Community 203 (93.55) 727 (93.46) 0.754 196 (90.32) 203 (93.55) 0.217 Urban fringe area 0 (0.00) 2 (0.25) 0 (0.00) 0 (0.00) Cottage area 14 (6.45) 49 (6.29) 21 (9.68) 14 (6.45) Ventilation of residencea Not ventilated 8 (3.69) 23 (2.96) 0.569 7 (3.23) 8 (3.69) 0.657 1–2 times a day 190 (87.56) 703 (90.36) 195 (89.86) 190 (87.56) Always ventilated 19 (8.75) 52 (6.68) 15 (6.91) 19 (8.76) Number of cohabitantsa 0 33 (15.21) 98 (12.60) 0.477 31 (14.29) 33 (15.21) 0.715 1–2 119 (54.84) 438 (56.30) 118 (54.38) 119 (54.84) ≥ 3 65 (29.95) 242 (31.10) 68 (31.34) 65 (29.95) Type of daily mask N95 84 (38.71) 397 (51.03) 0.003 107 (49.31) 84 (38.71) 0.044 Disposable medical mask 129 (59.45) 375 (48.20) 109 (50.23) 129 (59.45) Disposable Face Mask 4 (1.84) 6 (0.77) 1 (0.46) 4 (1.84) Use of hand sanitizera Every time 194 (89.41) 733 (94.22) 0.046 210 (96.77) 194 (89.40) 0.002 Occasional 13 (5.99) 28 (3.60) 5 (2.30) 13 (5.99) Hardly 5 (2.30) 5 (0.64) 0 (0.00) 5 (2.30) Never 5 (2.30) 12 (1.54) 2 (0.92) 5 (2.30) Complexity of activitya Simple activity history 190 (87.56) 713 (91.65) 0.074 201 (92.63) 190 (87.56) 0.101 Complex 24(11.06) 51 (6.56) 8 (3.69) 24 (11.06) More complex 3 (1.38) 14 (1.80) 8 (3.69) 3 (1.38) Social places visiteda 1 112 (51.61) 425 (54.63) 0.169 126 (58.06) 112 (51.61) 0.097 2 74 (34.10) 286 (36.76) 72 (33.18) 74 (34.10) 3 19 (8.76) 47 (6.04) 12 (5.53) 19 (8.76) 4 12 (5.53) 20 (2.57) 7 (3.23) 12 (5.53) Visit of restaurant Yes 37 (17.05) 70 (9.00) < 0.001 21 (9.68) 37 (17.05) < 0.001 No 180 (82.95) 708 (91.00) 196 (90.32) 180 (82.95) Sampling frequencya Daily 111 (51.16) 249 (32.01) < 0.001 69 (31.80) 111 (51.15) < 0.001 Once every 1–3 days 102 (47.00) 509 (65.41) 147 (67.74) 102 (47.00) Once every 4–5 days 2 (0.92) 2 (0.26) 1 (0.46) 2 (0.92) Rarely 2 (0.92) 15 (1.93) 0 (0.00) 2 (0.92) Hardly 0 (0.00) 3 (0.39) 0 (0.00) 0 (0.00) Note. aF test was used for analysis, and other variables were analyzed using the chi-square test. The results of the statistical analysis indicated that chronic diseases, daily wearing of non-N95 masks, infrequent use of hand sanitizers, restaurant visits, and a high frequency of nucleic acid sampling significantly increased the risk of SARS-CoV-2 infection, as shown in Table 1.
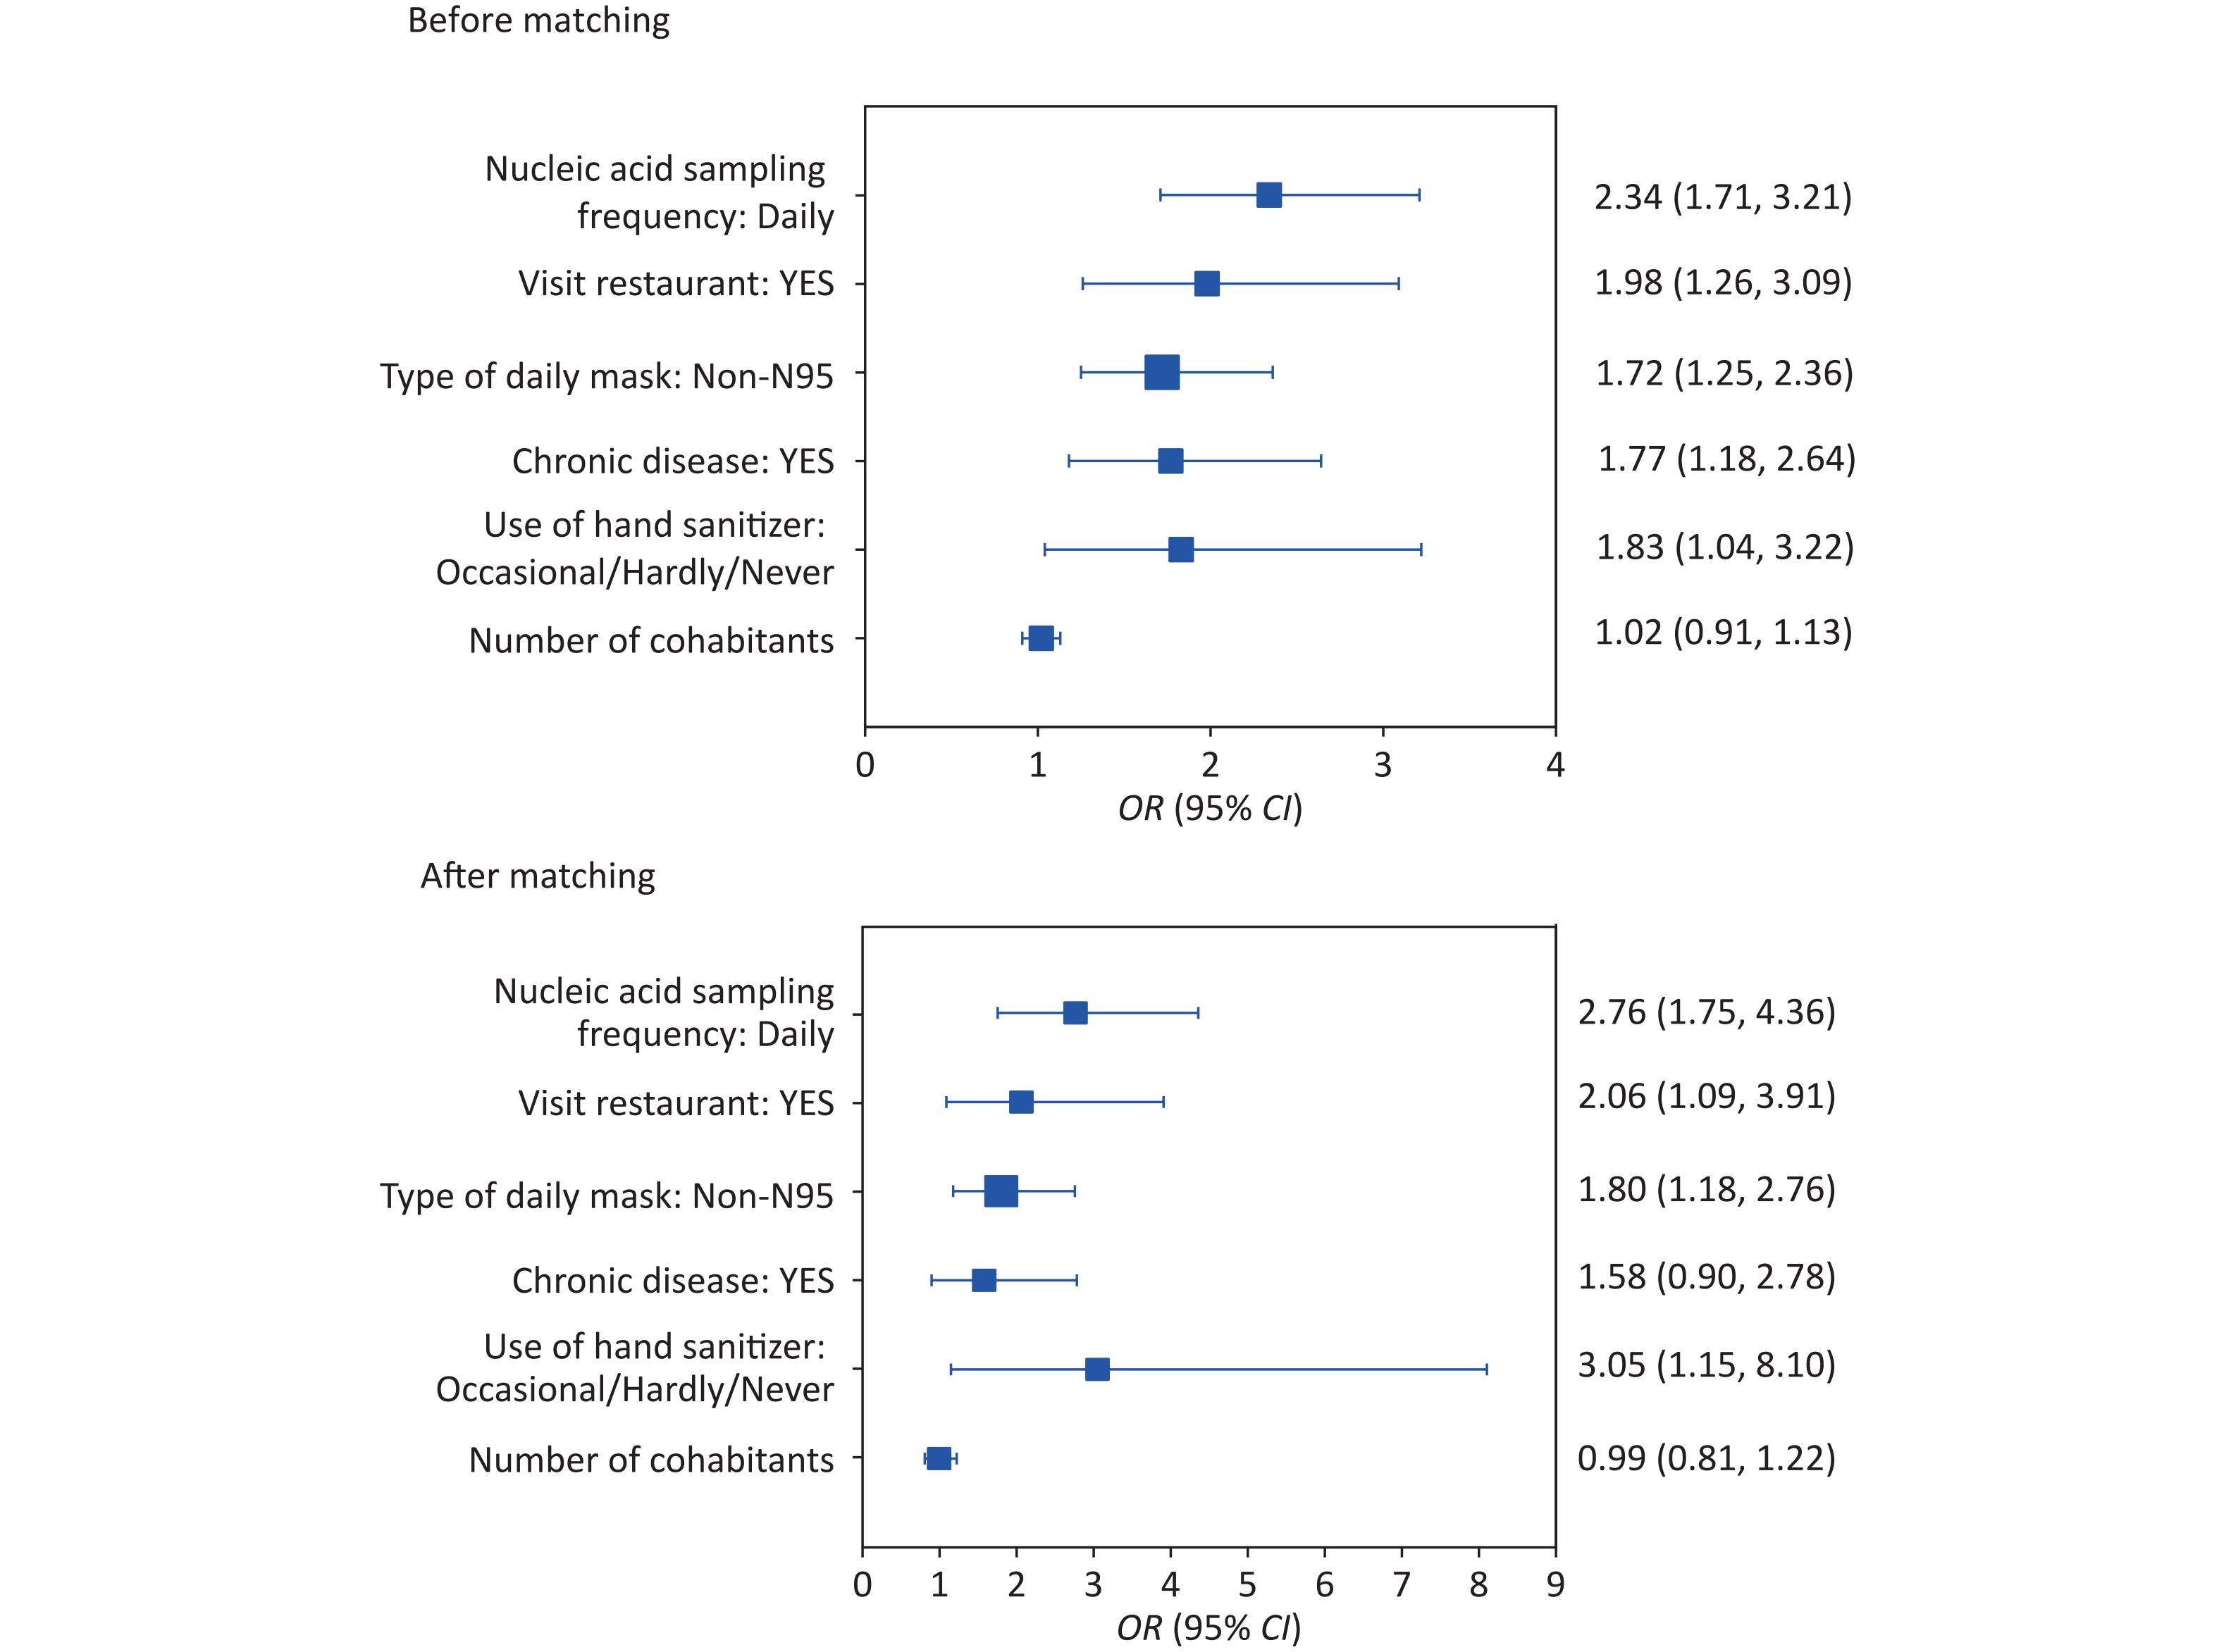
The proportion of patients with chronic diseases (21.20%) was higher in the case group than that in the control group (14.52%). Compared with a chronic disease, a non-chronic disease reduced the infection rate of COVID-19 by 77% or 58% before and after matching, respectively, as shown in Table 1 and Figure 1. Liu's[5] meta-analysis showed that the prevalence of hypertension, diabetes, cardiovascular disease, and chronic lung disease among SARS-CoV-2 patients was 20.0%, 10.0%, 8.0%, and 3.0%, respectively. These findings are consistent with the results of this study on chronic diseases, suggesting that underlying chronic diseases increase the risk of SARS-CoV-2 infection. Approximately one-third of Chinese adults have hypertension, which increases the susceptibility of the Chinese population to SARS-CoV-2[6]. Therefore, it is necessary to strengthen early prevention measures for patients with chronic diseases, such asimmunization and disease monitoring.
Figure 1. Risk of SARS-CoV-2 infection with different influencing factors of before and after matching. The participants were coded as follows: 0 = control and 1 = case. The dots indicate the odds ratios (OR) and the horizontal lines indicate the lower and upper limits of the 95% confidence interval (95% CI).
From a personal hygiene perspective, wearing masks and maintaining hand hygiene reduced the infection rate of COVID-19 in our study. Compared to non-N95, wearing N95 masks reduced the infection of COVID-19 by approximately 80%, as shown in Figure 1. The spatial grid structure of a mask provides a physical barrier that selectively retains particulate matter, effectively reducing the amount of viral exposure and the risk of infection for susceptible individuals. Jayaweera[7] demonstrated that wearing surgical masks can reduce droplet and aerosol leakage by 70%–80% when coughing, while wearing N95 or protective masks can reduce it by 95%, thus significantly reducing the risk of epidemic recurrence, which is consistent with the results of this study. Hand hygiene is crucial for preventing cross-infection, and proper hand washing can effectively remove microorganisms from the hand surface. Comparing occasional/hardly/never use of hand sanitizer, maintaining hand hygiene reduced the infection of COVID-19 by 83% or 205% before and after matching, as shown in Figure 1. Allison[8] showed that hand washing can reduce the risk of respiratory tract infection by 16% to 21%, which is also consistent with the findings of this study. This indicates that wearing masks and hand hygiene play essential roles in preventing infectious respiratory diseases during the COVID-19 epidemic.
In our study, visiting restaurants improved the infection rate of COVID-19 by 98% and 106% before and after matching, respectively, as shown in Figure 1. Restaurants, which are closed environments where people gather and remain for long periods, can facilitate the transmission of SARS-CoV-2 through aerosols and droplets[9]. Thus, during the COVID-19 pandemic, the public should reduce their activities in poorly ventilated or confined spaces.
Daily nucleic acid sampling increased the incidence of COVID-19 by 134% and 176% before and after matching, respectively, as shown in Figure 1. However, our study did not find any significant influence of the setting and arrangement of nucleic acid sampling sites and sampling practices on the infection risk, suggesting that the infection risk of COVID-19 might not come from nucleic acid sampling. With COVID-19 entering its peak during november 2022 in Beijing, the probability of healthy people encountering infected people during nucleic acid sampling was increased gradually[3]. The cases and controls selected in our study were from the same community, and the environment and number of positive cases were similar. Therefore, the number of surrounding infectious sources was similar during nucleic acid sampling, and an increase in the frequency of sampling may have increased the exposure risk at the sampling site or queuing period. These results suggested that gathering activities should be reduced during the COVID-19 pandemic.
Based on the risk factors for COVID-19 infection in our study, it is suggested that during the epidemic period of other respiratory infectious diseases, a multi-faced prevention and control approach should be adopted. In susceptible populations, especially those with chronic diseases, disease monitoring and vaccination should be enforced in medical institutions, so as to prevent progression to serious disease. Personal protective measures such as mask wearing and hand hygiene should be promoted, and activities in confined spaces should be reduced. A combined approach will prevent worsening of the epidemic.
doi: 10.3967/bes2023.141
SARS-CoV-2 Infection Risk Factors in Beijing during November 2022: A Case Control Study
-
The authors declare no conflicts of interest in the present study.
&These authors contributed equally to this work.
注释:1) Conflict of Interest: -
S1. Flow chart of study participants. Participants with or without history of SARS-CoV-2 infection Beijing during November 2022 were considered. The left side of the diagram represents the flowchart for the COVID-19 group (community-found cases). The community-found cases were defined as cases, who could freely transmit the virus through social interactions before quarantine or medical treatment. The right side shows the inclusion flowchart for the non-COVID-19 group and matched through PSM, who living in the same community as the infected person. *There was no significant difference in age and gender between those refused and agreed to participate (P > 0.05).
Figure 1. Risk of SARS-CoV-2 infection with different influencing factors of before and after matching. The participants were coded as follows: 0 = control and 1 = case. The dots indicate the odds ratios (OR) and the horizontal lines indicate the lower and upper limits of the 95% confidence interval (95% CI).
Table 1. Basic characteristics of the study groups, n (%)
Variables Before matching After matching Case (N = 217) Control (N = 778) P Case (N = 217) Control (N = 217) P Gender Male 121 (55.76) 401 (51.54) 0.271 119 (54.84) 121 (55.76) 0.847 Female 96 (44.24) 377 (48.46) 98 (45.16) 96 (44.24) Age (years)a 18–29 35 (16.13) 154 (19.79) 0.317 39 (17.97) 35 (16.13) 0.405 30–39 54 (24.88) 220 (28.28) 67 (30.88) 54 (24.88) 40–49 49 (22.58) 156 (20.05) 35 (16.13) 49 (22.58) 50–59 46 (21.20) 122 (15.68) 40 (18.43) 46 (21.20) 60–69 24 (11.06) 94 (12.08) 29 (13.36) 24 (11.06) ≥ 70 9 (4.15) 32 (4.11) 7 (3.23) 9 (4.15) Vaccination Yes 195 (89.86) 701 (90.10) 0.769 191 (88.02) 195 (89.86) 0.540 No 22 (10.14) 77 (9.90) 26 (11.98) 22 (10.14) Chronic disease Yes 46 (21.20) 113 (14.52) 0.018 36 (16.59 ) 46 (21.20) 0.220 No 171 (78.80) 665 (85.48) 181 (83.41) 171 (78.80) Residential type Community 203 (93.55) 727 (93.46) 0.754 196 (90.32) 203 (93.55) 0.217 Urban fringe area 0 (0.00) 2 (0.25) 0 (0.00) 0 (0.00) Cottage area 14 (6.45) 49 (6.29) 21 (9.68) 14 (6.45) Ventilation of residencea Not ventilated 8 (3.69) 23 (2.96) 0.569 7 (3.23) 8 (3.69) 0.657 1–2 times a day 190 (87.56) 703 (90.36) 195 (89.86) 190 (87.56) Always ventilated 19 (8.75) 52 (6.68) 15 (6.91) 19 (8.76) Number of cohabitantsa 0 33 (15.21) 98 (12.60) 0.477 31 (14.29) 33 (15.21) 0.715 1–2 119 (54.84) 438 (56.30) 118 (54.38) 119 (54.84) ≥ 3 65 (29.95) 242 (31.10) 68 (31.34) 65 (29.95) Type of daily mask N95 84 (38.71) 397 (51.03) 0.003 107 (49.31) 84 (38.71) 0.044 Disposable medical mask 129 (59.45) 375 (48.20) 109 (50.23) 129 (59.45) Disposable Face Mask 4 (1.84) 6 (0.77) 1 (0.46) 4 (1.84) Use of hand sanitizera Every time 194 (89.41) 733 (94.22) 0.046 210 (96.77) 194 (89.40) 0.002 Occasional 13 (5.99) 28 (3.60) 5 (2.30) 13 (5.99) Hardly 5 (2.30) 5 (0.64) 0 (0.00) 5 (2.30) Never 5 (2.30) 12 (1.54) 2 (0.92) 5 (2.30) Complexity of activitya Simple activity history 190 (87.56) 713 (91.65) 0.074 201 (92.63) 190 (87.56) 0.101 Complex 24(11.06) 51 (6.56) 8 (3.69) 24 (11.06) More complex 3 (1.38) 14 (1.80) 8 (3.69) 3 (1.38) Social places visiteda 1 112 (51.61) 425 (54.63) 0.169 126 (58.06) 112 (51.61) 0.097 2 74 (34.10) 286 (36.76) 72 (33.18) 74 (34.10) 3 19 (8.76) 47 (6.04) 12 (5.53) 19 (8.76) 4 12 (5.53) 20 (2.57) 7 (3.23) 12 (5.53) Visit of restaurant Yes 37 (17.05) 70 (9.00) < 0.001 21 (9.68) 37 (17.05) < 0.001 No 180 (82.95) 708 (91.00) 196 (90.32) 180 (82.95) Sampling frequencya Daily 111 (51.16) 249 (32.01) < 0.001 69 (31.80) 111 (51.15) < 0.001 Once every 1–3 days 102 (47.00) 509 (65.41) 147 (67.74) 102 (47.00) Once every 4–5 days 2 (0.92) 2 (0.26) 1 (0.46) 2 (0.92) Rarely 2 (0.92) 15 (1.93) 0 (0.00) 2 (0.92) Hardly 0 (0.00) 3 (0.39) 0 (0.00) 0 (0.00) Note. aF test was used for analysis, and other variables were analyzed using the chi-square test.  下载: 导出CSV
-
[1] Du ZW, Hong HP, Wang SQ, et al. Reproduction number of the Omicron variant triples that of the Delta variant. Viruses, 2022; 14, 821. doi: 10.3390/v14040821 [2] Jones NR, Qureshi ZU, Temple RJ, et al. Two metres or one: what is the evidence for physical distancing in covid-19? BMJ, 2020; 370, m3223. [3] Pan Y, Wang L, Feng ZM, et al. Characterisation of SARS-CoV-2 variants in Beijing during 2022: an epidemiological and phylogenetic analysis. Lancet, 2023; 401, 664−72. doi: 10.1016/S0140-6736(23)00129-0 [4] Chen P. Principal component analysis and its application in feature extraction. Shaanxi Normal University. 2014. (In Chinese [5] Liu H, Chen SY, Liu M, et al. Comorbid chronic diseases are strongly correlated with disease severity among COVID-19 patients: a systematic review and meta-analysis. Aging Dis, 2020; 11, 668−78. doi: 10.14336/AD.2020.0502 [6] Yao X, Pei X T, Qu Z. Prevalence, awareness, treatment and control rates of hypertension in Chinese adults: trend and associated factors from 1991 to 2015. Chin Gen Pract, 2022; 25, 803−14. (In Chinese [7] Jayaweera M, Perera H, Gunawardana B, et al. Transmission of COVID-19 virus by droplets and aerosols: A critical review on the unresolved dichotomy. Environ Res, 2020; 188, 109819. doi: 10.1016/j.envres.2020.109819 [8] Aiello AE, Coulborn RM, Perez V, et al. Effect of hand hygiene on infectious disease risk in the community setting: a meta-analysis. Am J Public Health, 2008; 98, 1372−81. doi: 10.2105/AJPH.2007.124610 [9] Li YG, Qian H, Hang J, et al. Probable airborne transmission of SARS-CoV-2 in a poorly ventilated restaurant. Build Environ, 2021; 196, 107788. doi: 10.1016/j.buildenv.2021.107788 -
 23177+Supplementary Materials.pdf

-

 点击查看大图
计量
- 文章访问数: 481
- HTML全文浏览量: 191
- PDF下载量: 25
- 被引次数: 0

 Quick Links