

 下载:
下载:


-
Natural enzymes have a broad range of bioanalytical and biomedical applications[1,2]. However, intrinsic shortcomings, i.e., ease of denaturation, laborious preparation, and high cost, have limited the widespread applicability of enzymes[3]. To circumvent these issues, considerable attention has been paid to the exploration of artificial enzymes. Nanomaterials that mimic enzyme properties, i.e., nanozymes, have recently garnered interest[4-7]. In the past decade, various nanozymes have been developed. Among these nanozymes, carbon-based nanozymes, including graphene, fullerenes, carbon dots, graphene quantum dots, carbon nanospheres, and carbon nanotubes, have received considerable attention due to their unique physiochemical properties, low cost, and high stability[8-10]. Carbide-derived carbons (CDCs) have attracted interest due to their large surface areas, electric properties, and high energy densities[11,12]. Atomic-level control of the carbon structure of CDCs can be derived from three-dimensional structured metal carbides. Mn+1AXn phases are a family of inherently ternary carbides and nitrides with hexagonal crystal structures, which are excellent precursors of two-dimensional materials synthesized through selective extraction. Here, M is an early transition metal, A is typically a group 13 or 14 element, and X represents C and/or N, with n = 1, 2, or 3. To date, CDCs, including porous carbon and carbon/sulfur nanolaminates, have been prepared through the electrochemical (EC) etching of MAX phase carbides[13,14]. However, the exfoliation of MAX phase carbides typically employs high concentration hydrogen fluoride (HF)[15], a mixture of hydrochloric acid (HCl) and lithium fluoride (LiF)[16], or high temperatures[17,18], which can be safety hazards and dangerous to the environment. The synthesis of CDCs with bienzymatic activities via environmentally conscious reagents and mild reaction conditions is rarely reported.
Here, CDCs were synthesized via a one-step EC method directly from MAX precursors using an ammonium bifluoride (NH4HF2) electrolyte at ambient conditions. As-synthesized CDCs showed efficient bienzymatic activities similar to that of peroxidase and superoxide dismutase (SOD). We studied the dependence of the enzyme-like activity of CDCs on different electrolytes and electrolysis times of the Ti3AlC2 MAX. We discussed the electrochemical exfoliation mechanism of the CDCs and tested the practicality of the CDC nanozymes via cholesterol detection.
-
Bulk Ti3AlC2 (MAX) was obtained from Beijing Jinhezhi Materials Co., Ltd. NH4HF2, NaHF2, NH4F, acetic acid, sodium acetate, hydrogen peroxide (H2O2), sodium hydroxide (NaOH), HCl, riboflavin, methionine, nitrotetrazolium blue chloride (NBT), and 3,3',5,5'-Tetramethylbenzidine (TMB) were obtained from Sigma-Aldrich Chemical Co. (Milwaukee, WI). 3-(N-morpholino)propanesulfonic acid (MOPS) sodium salt (98%), peroxidase from horseradish (HRP), cholesterol oxidase (ChOx), cholesterol, tetracycline hydrochloride, and europium (III) chloride (EuCl3·6 H2O) were purchased from Shanghai Macklin Biochemical Co. Ltd., China. All reagents were analytical grade and used without further purification. Ultrapure water (18.2 MΩ/cm) was obtained from a MilliQ ultrapure system (Qingdao, China).
-
UV-vis absorbance spectra were measured on a Mapada UV 6300 spectrophotometer (Shanghai, China). Generated O2 was measured using a JPB portable oxygen-sensitive electrode (Hangzhou Qiwei Instrument Power Equipment Research Institute, China). Atom force microscopy (AFM) was carried out on a SPI3800N microscope (Seiko Instruments Inc.) operating in tapping mode. Powder X-ray diffraction (XRD) patterns were measured by a Bruker D2 PHASER diffractometer using Cu-Kα radiation (λ = 0.1542 nm). The morphology of as-prepared CDCs was characterized via transmission electron microscopy (TEM, JEOL JEM-2100F, Japan) with an accelerating voltage of 200 kV. Fourier transform infrared (FTIR) spectra were measured on a Nicolet 5700 FTIR spectrometer (Thermo Electron Scientific Instruments Corp., USA). X-ray photoelectron spectroscopy (XPS) was carried out using a surface analysis system with monochromatic Al-Kα (1486.6 eV) radiation (Kratos AXIS UltraDLD, Manchester, UK).
-
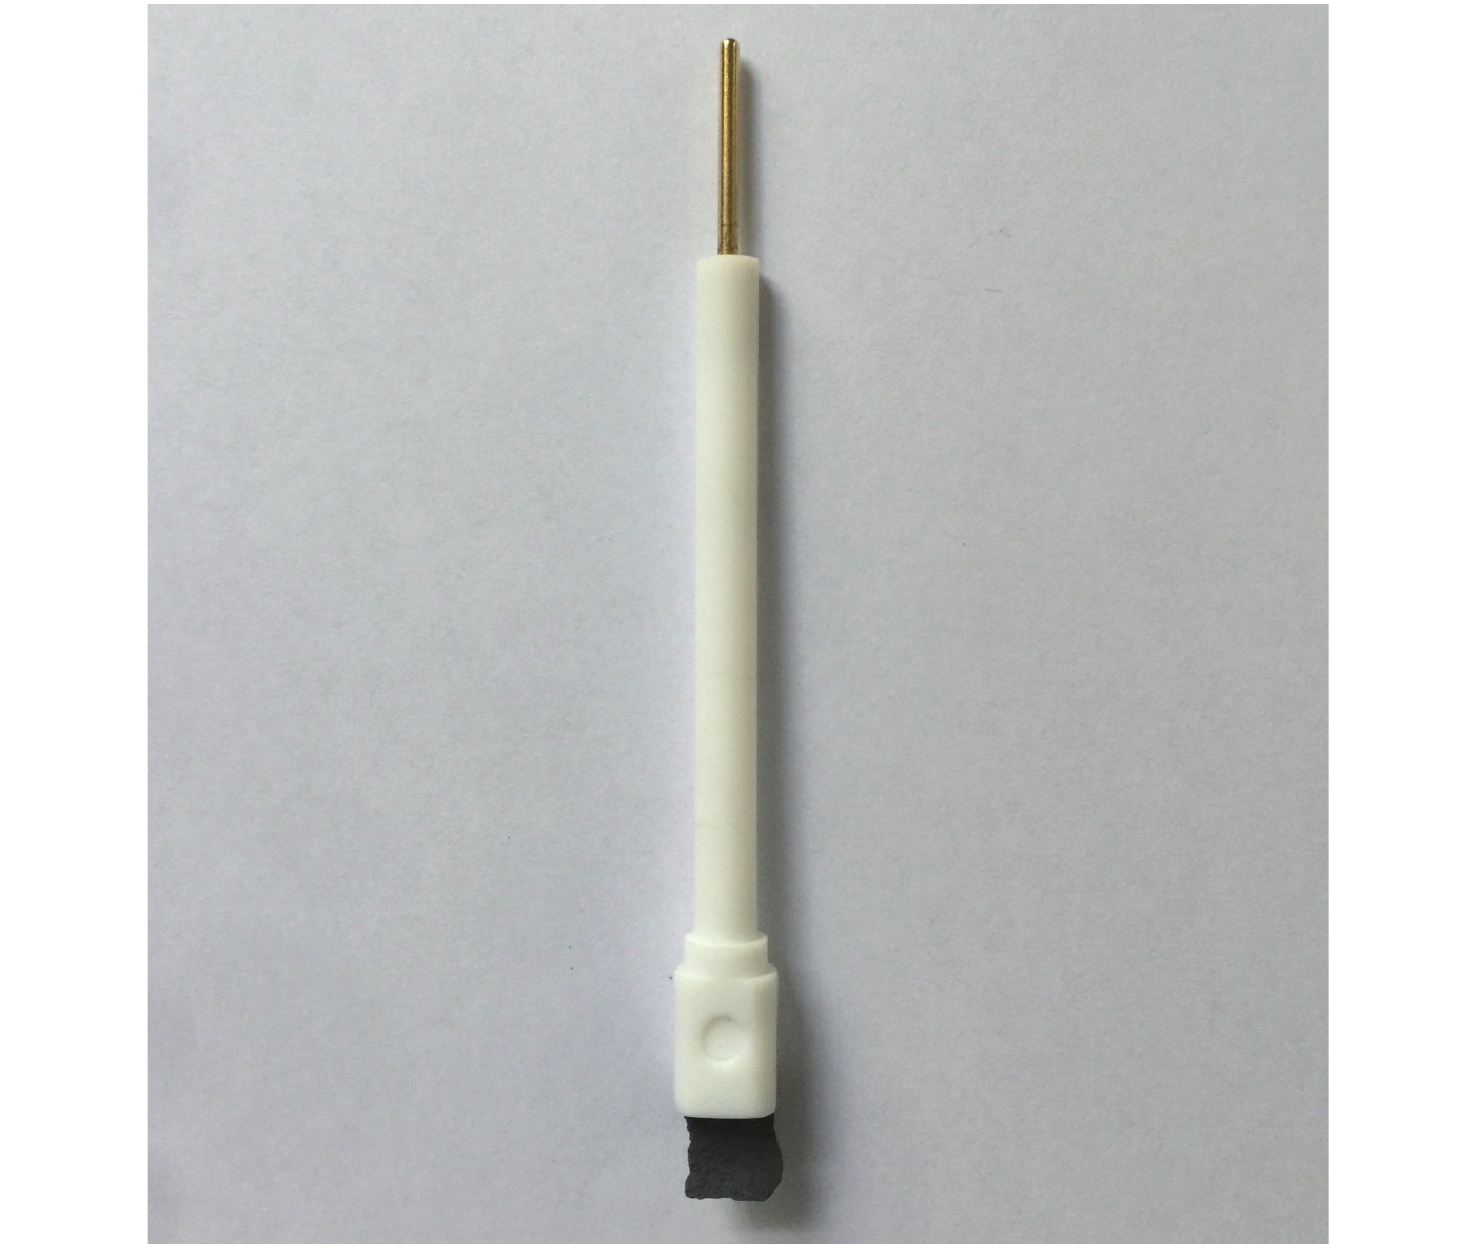
In a typical experiment, bulk MAX was applied as the anode (Supplementary Figure S1, available in www.besjournal.com) and a Pt electrode was used as the cathode. A constant 3 V DC potential was applied to the system with varying times and electrolytes (NH4HF2, NaHF2, NH4F) at room temperature. The suspension was collected by centrifuging at 10,000 rpm for 10 min, and the precipitate was freeze-dried without post-washing. The suspension was then dialyzed in a 1,000 Da dialysis bag for 6 h and stored at room temperature for further characterization and application.
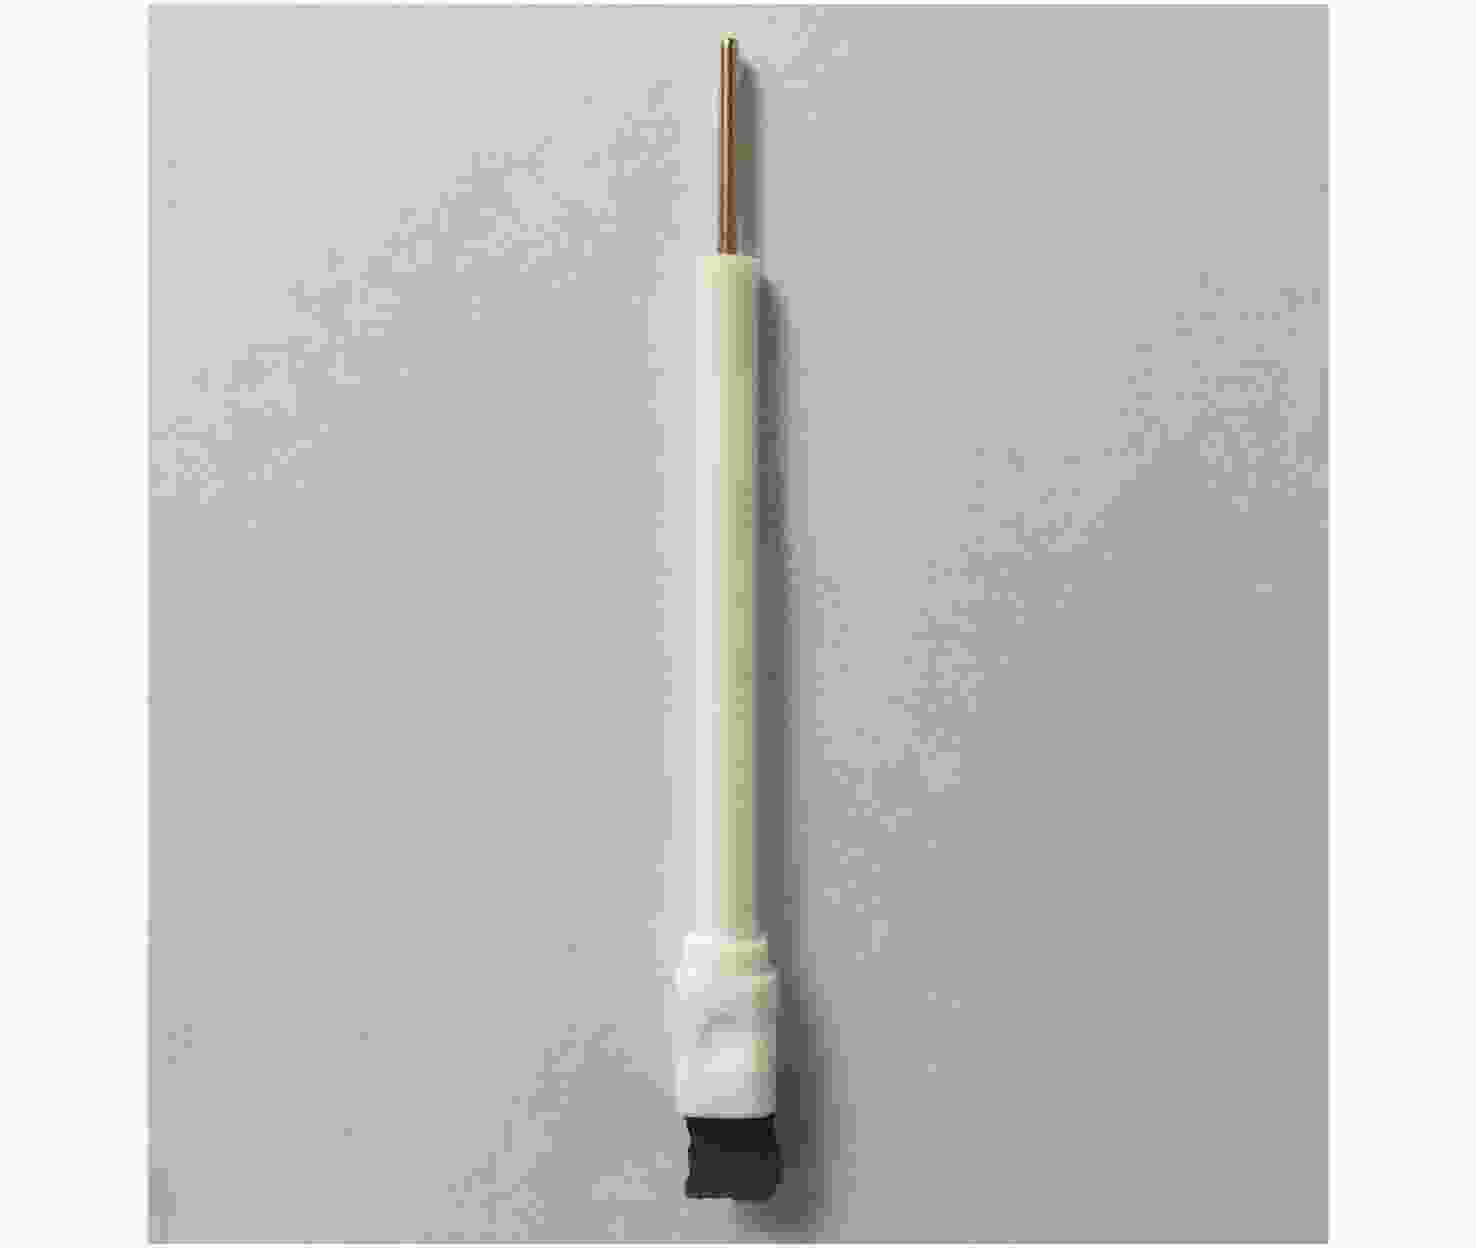
Figure S1. The installation of positive electrode.
-
The enzyme kinetics of CDC samples were monitored at 652 nm at 40 °C after 10 min incubation. Experiments were carried out using 200 μL of CDCs in 50 mmol/L NaAc buffer (pH 5.0) containing different concentrations of H2O2 and TMB as the substrates. The apparent kinetic parameters were obtained via the Michaelis-Menten equation:
$$ V = \frac{{{V_{\max }} \times [S]}}{{{K_m} + [S]}} $$ where V stands for the initial velocity, Vmax represents the maximal reaction velocity, [S] is the substrate concentration, and Km stands for the Michaelis constant. Km and Vmax were obtained by the Lineweaver-Burk plot method.
-
The SOD behavior of CDCs were measured via NBT inhibition. Mixtures containing 20 μmol/L riboflavin, 0.013 mol/L methionine, 75 μmol/L NBT, and different volumes of CDCs were prepared in 50 mmol/L NaAc buffer at pH 7.0 and 25 °C. Upon UV illumination for 10 min, reduced NBT was detected at 560 nm. For control experiments, the reaction mixture was kept in the dark before the absorbance measurement. Detailed information is presented in the Supporting Information.
-
To confirm SOD-like catalytic activity, europium (III) chloride hexahydrate, MOPS sodium salt, tetracycline hydrochloride, and H2O2 were used. The weakly fluorescent Eu3+-tetracycline complex (EuTc) was used as a fluorescent probe for H2O2 detection. Various volumes of CDC-NH4HF2-16h, ranging from 10 to 150 μL, were added to a 3 mL EuTc solution. A dissolved oxygen meter was used to monitor the concentration of O2 generated during the catalytic process. Different volumes of CDC-NH4HF2-16h were added to a 10 mL 50 mmol/L NaAc buffer solution (pH 5).
To investigate H2O2 catalyzed by CDC-NH4HF2-16h, the following solutions were used:
A) MOPS buffer solution (10 mmol/L): MOPS sodium salt was dissolved in 800 mL of MilliQ water, and the pH was set to 6.9. A volumetric flask was filled with 1 L with MilliQ water, and the solution was homogenized.
B) EuCl3 solution (6.3 mmol/L of Eu3+): 115.3 mg of EuCl3·6 H2O was dissolved in 50 mL of solution (A).
C) Tetracycline hydrochloride solution (2.1 mmol/L): 50.5 mg of tetracycline hydrochloride was dissolved in 50 mL of solution (A).
D) EuTc solution: 5 mL of solution (B) and (C) were mixed and with solution (A) for a final volume of 100 mL.
-
10 μL ChOx (0.5 mg/mL) and 200 μL of different cholesterol concentrations were added to NaAc buffer (800 μL, 0.5 mmol/L, pH 7.0) and incubated at 37 ℃ for 120 min. Then, 500 μL of CDC and 200 μL of TMB (5 mmol/L) were added to the reaction mixture, followed by incubation at 40 °C for 5 min. The maximum absorbance of TMB•+ was measured at 652 nm.
-
Optimization calculations were performed using B97X-D/Def2-TZVP[19,20]. Molecular surface evaluation and cation size measurements were carried out via the Multiwfn program (version 3.6) [21] using DFT-ωB97X-D/def2-TZVP.
-
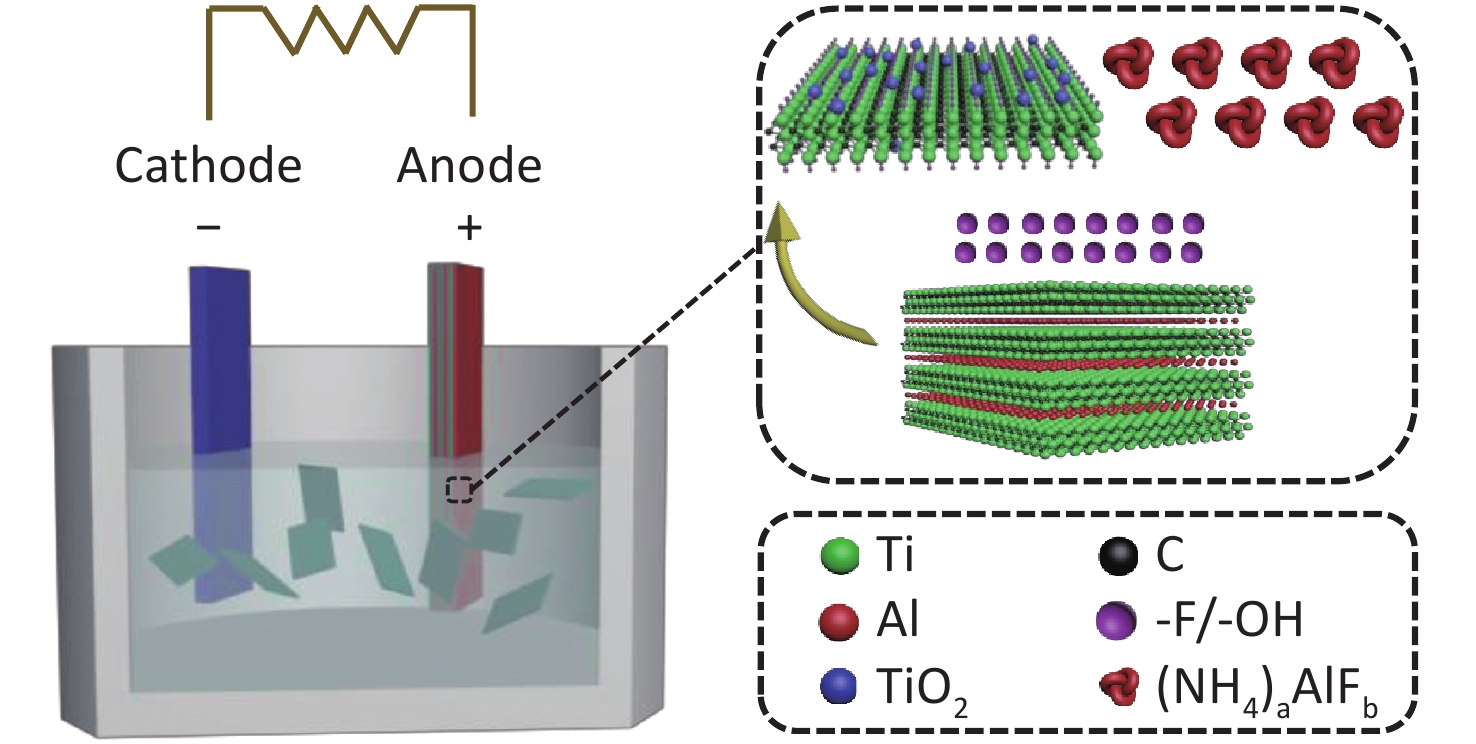
The EC exfoliation of MAX was conducted using bulk Ti3AlC2 MAX and a Pt electrode as the anode and cathode, at ambient conditions, respectively (Figure 1). An aqueous solution of 0.5 mol/L NH4HF2 was used as the electrolyte, which contained the necessary cations for interplanar intercalation as well as fluoro-containing groups for Al layer etching in the MAX exfoliation. This process avoids the utilization of concentrated HF. To confirm the role of the electrolyte in the EC exfoliation process, two other inorganic salts, i.e., ammonium fluoride (NH4F) and sodium acid fluoride (NaHF2), which possess either the same cation or anion as NH4HF2, respectively, were applied as electrolytes for comparison.
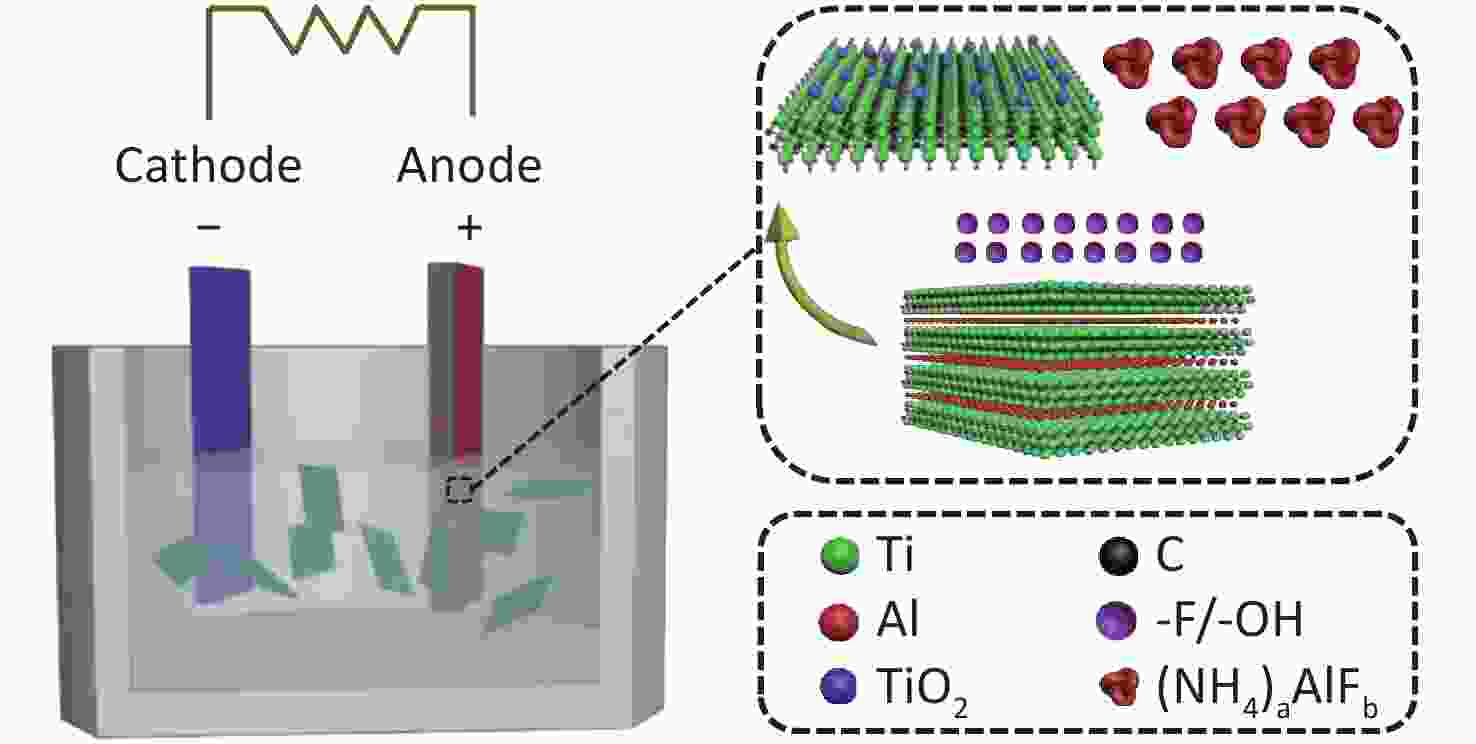
Figure 1. Schematic illustration of the exfoliation process of Ti3AlC2 with NH4HF2 as the electrolyte using the one-step EC method.
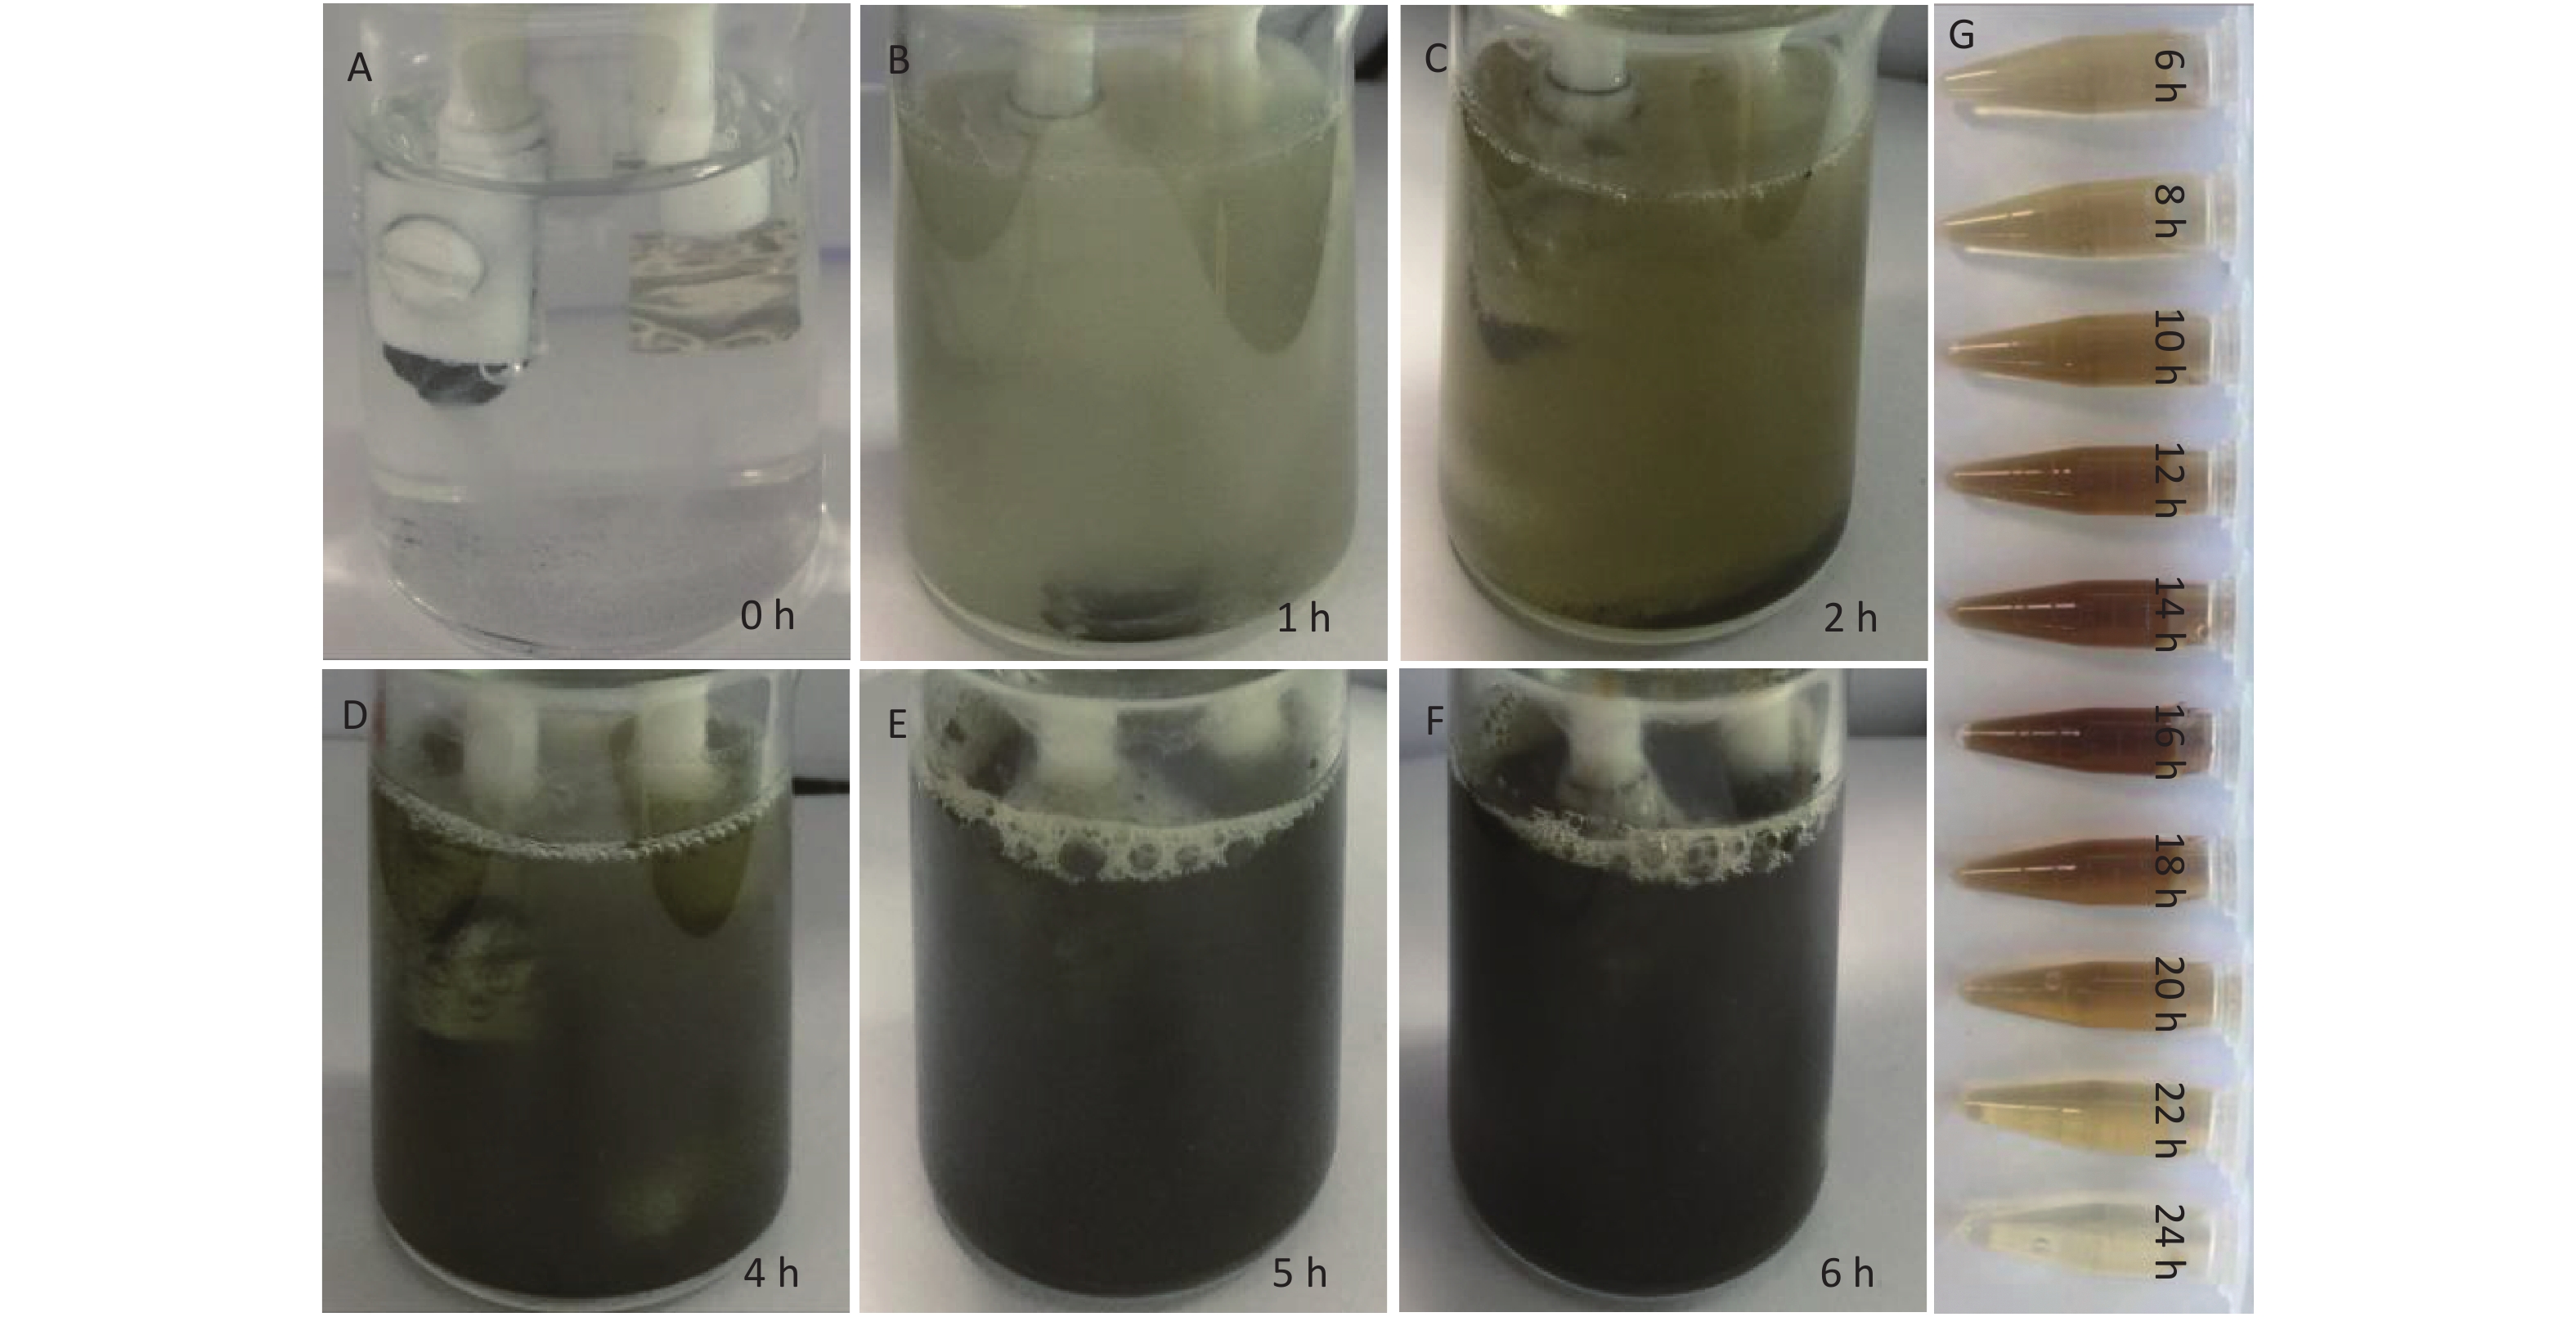
The influence of a constant 3V potential during the EC process at different time points (0, 1, 2, 4, 5, 6, 8, 10, 16, 20, 22, and 24 h) on the preparation of CDCs was investigated. The color of the NH4HF2 electrolyte changed from colorless (Supplementary Figure S2A available in www.besjournal.com) to muddy after 1 h (Supplementary Figure S2B). The color then became yellow (Supplementary Figure S2C) after 2 h, and brown (Supplementary Figure S2D) after 4 h. Finally, the color of the mixture became dark brown (Supplementary Figure S2E) after 5 h, and then black after 6 h (Supplementary Figure S2F), indicating the exfoliation of Ti3AlC2 MAX to Ti3C2Tx MXene and CDCs. The color of the suspension became more brown until 16 h, after which the color faded when the electrolysis time was extended to 20 h (Supplementary Figure S2G). Gas bubbles were observed surrounding the anode throughout the entire experiment. We note that reaction times of 6 and 16 h were the two critical time points during the electrolysis process. The obtained products from these two time points, denoted as CDCs-NH4HF2-6h and CDCs-NH4HF2-16h, respectively, were collected for further characterization. When NH4F or NaHF2 were used as electrolytes at the same concentration as NH4HF (0.5 mol/L), the electrolyte solution also changed color over time. However, the color changes were not as obvious as that of NH4HF2, and only a gray color was observed for NH4F, even after 24 h. This phenomenon demonstrated the superior efficiency of NH4HF2 for the exfoliation of MAX to MXene. Three obtained products at the 6 h time point, termed CDCs-NH4HF2-6h, CDCs-NH4F-6h, and CDCs-NaHF2-6h, were selected for further characterization.
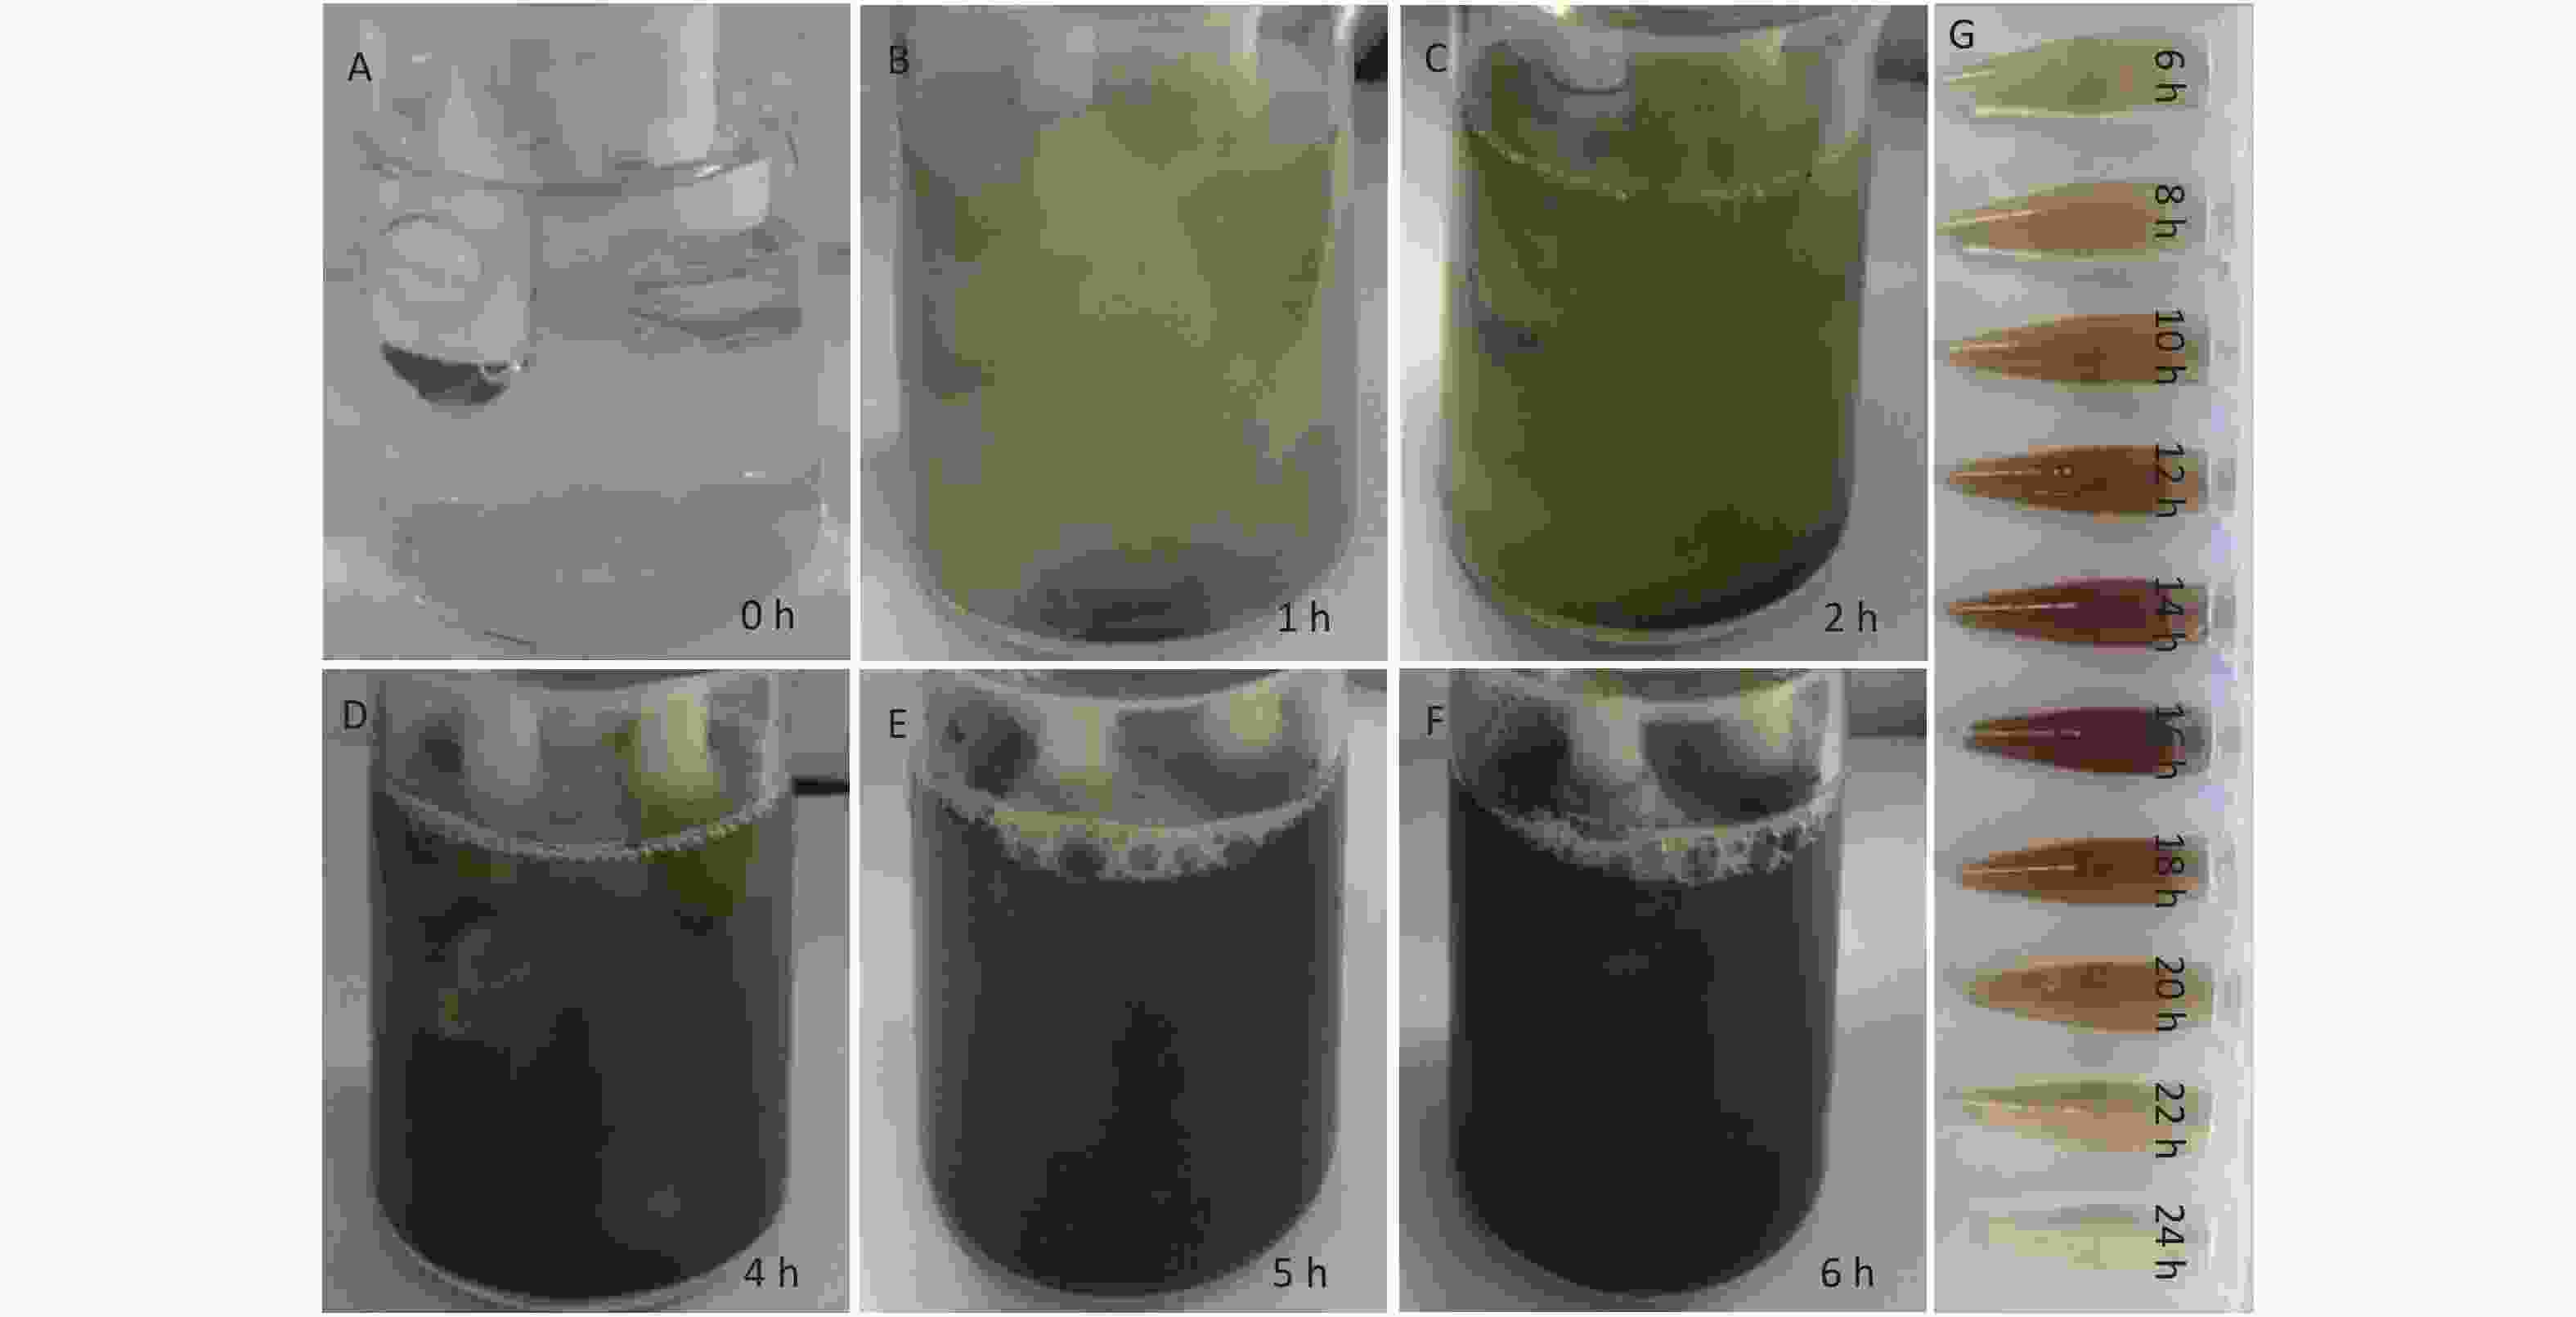
Figure S2. Photographs of the reaction mixtures from the EC generation process at different time periods: (A) 0 h, (B) 1 h, (C) 2 h, (D) 4 h, (E) 5 h, and (F) 6 h, respectively; (G) The photographs of the supernatant upon different electrolytic time.
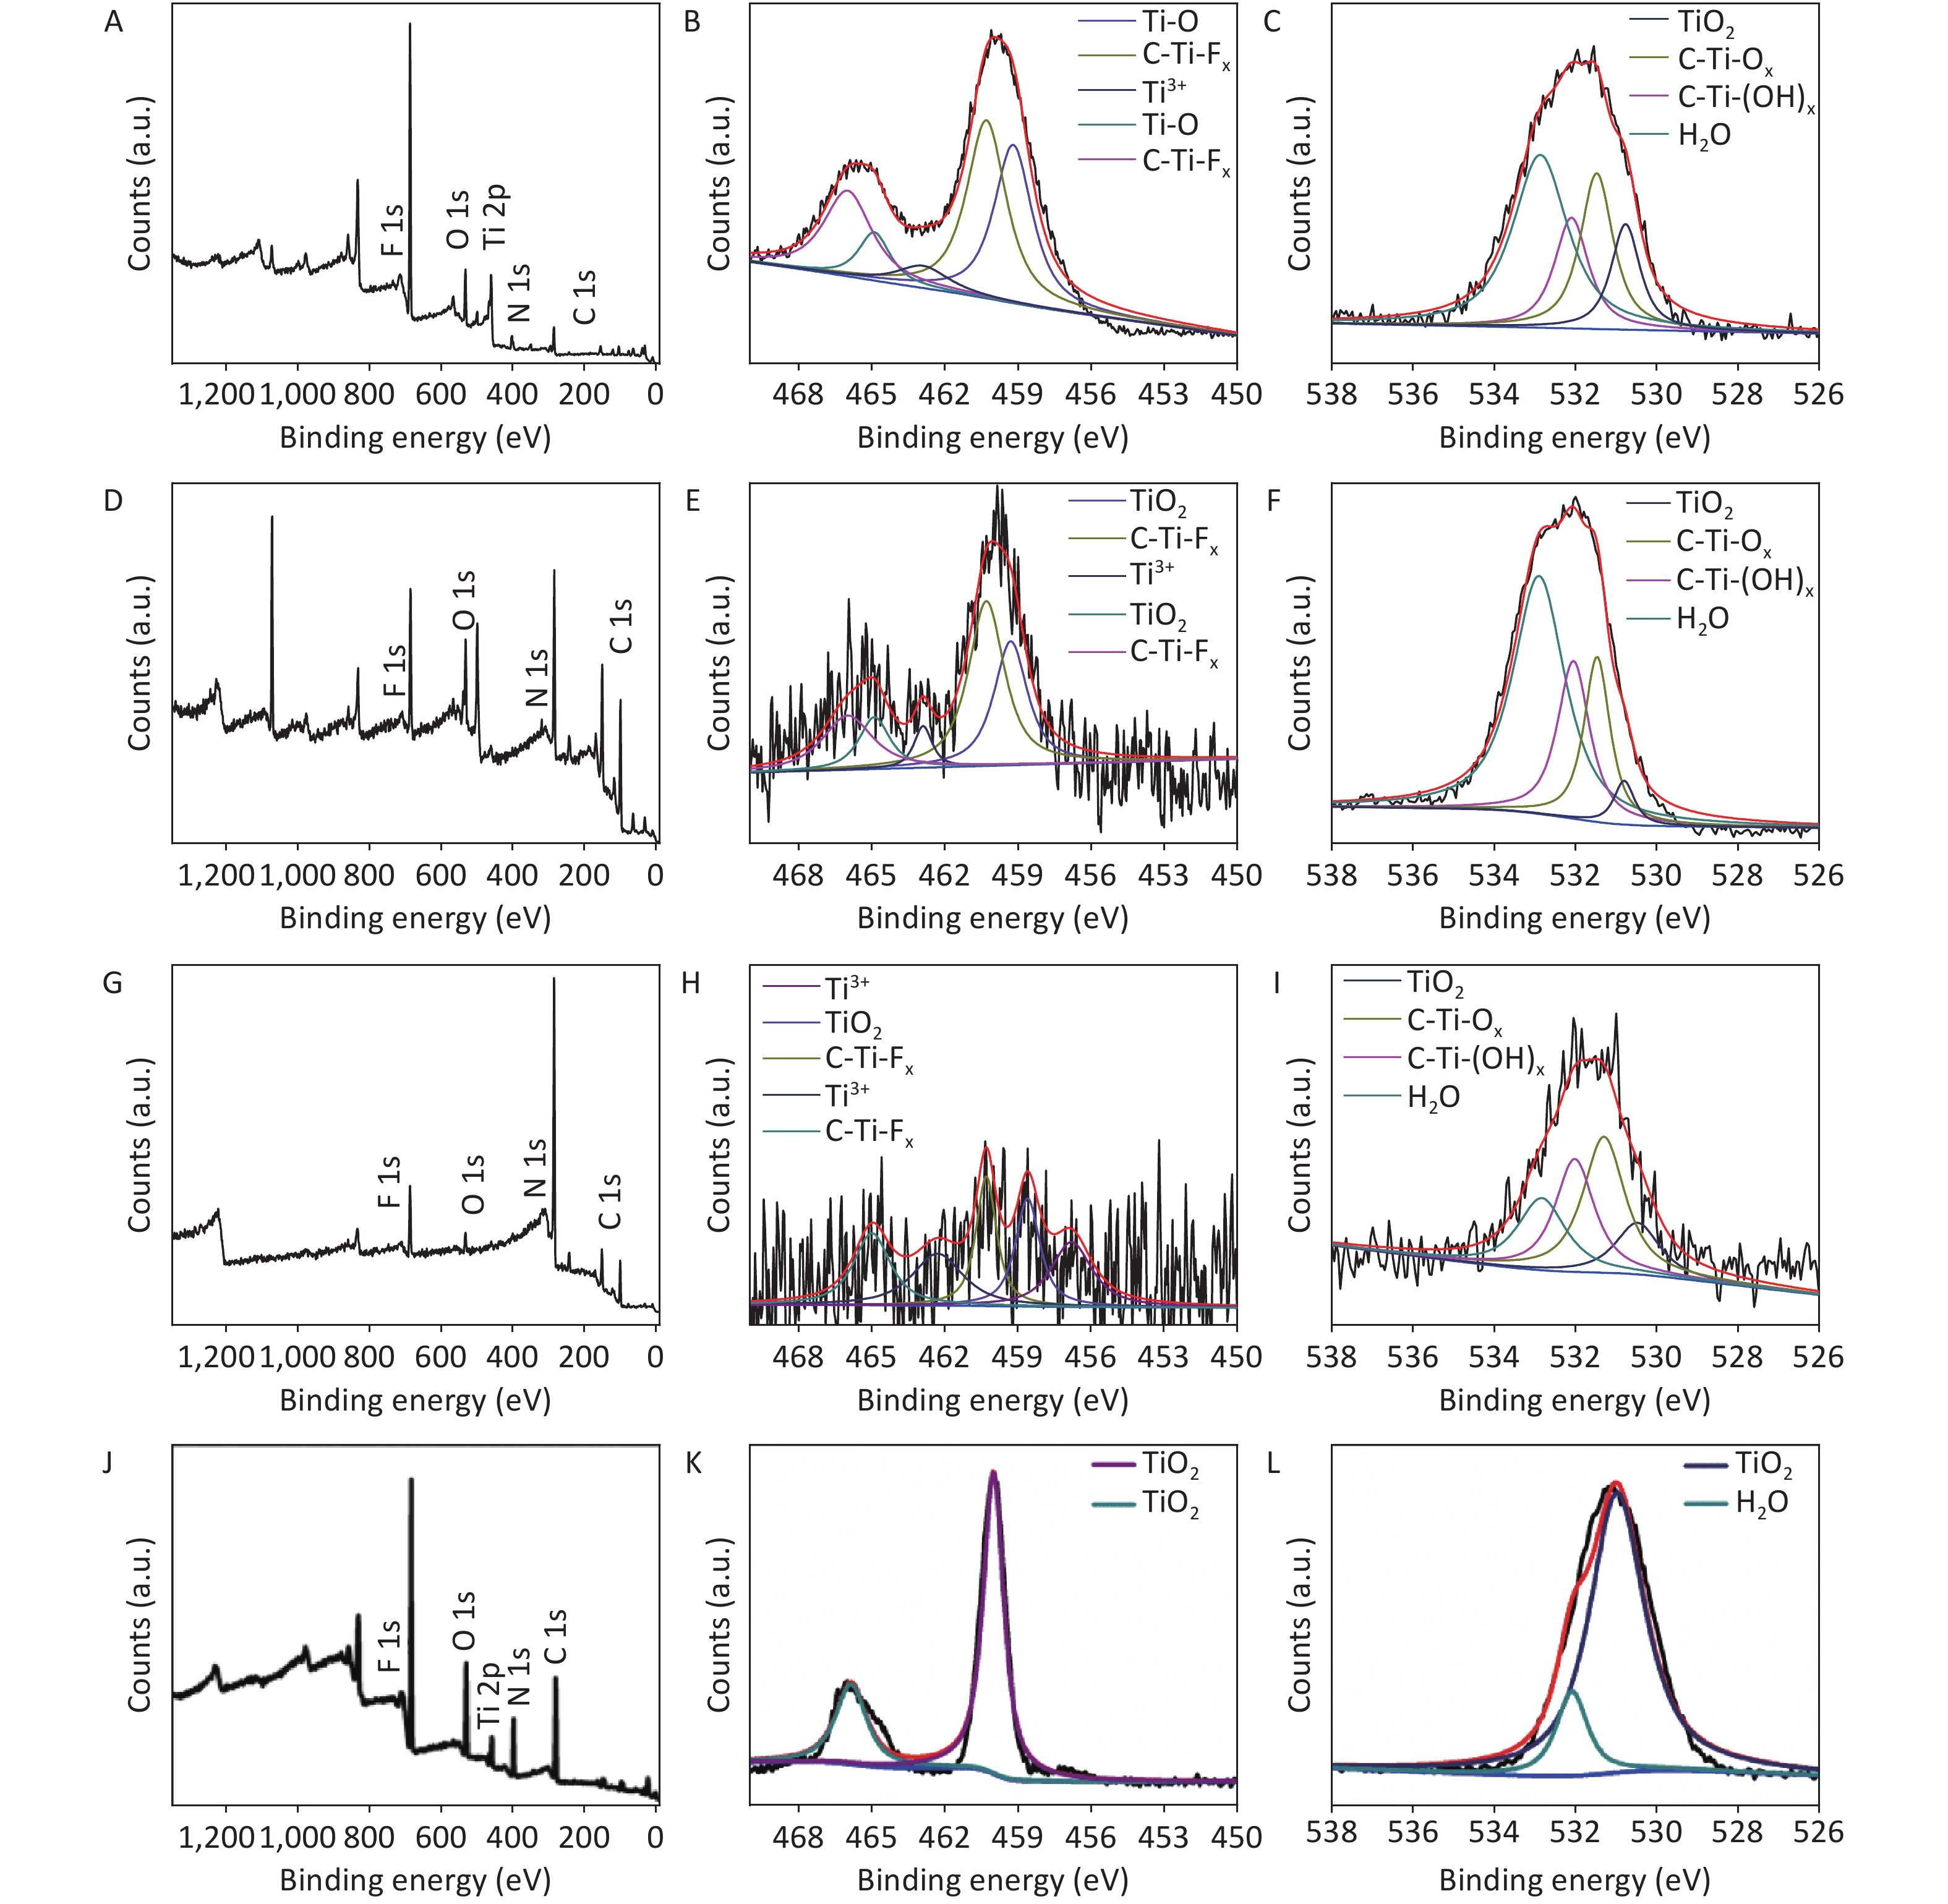
XRD patterns of CDCs-NH4HF2-6h, CDCs-NaHF2-6h, and CDCs-NH4F-6h are shown in Supplementary Figure S3 (available in www.besjournal.com). The (002) reflection of Ti3C2Tx at ca. 8.84° from CDCs-NH4HF2-6h was more obvious compared with CDCs-NaHF2-6h, indicating that NH4HF2 had a greater MAX exfoliation than that of NaHF2. However, the characteristic MXene peak was faintly detected for NH4F, indicating that HF− is more favorable for the EC exfoliation of MAX to MXene. XPS spectra of CDCs-NH4HF2-6h, CDCs-NaHF2-6h, and CDCs-NH4F-6h are shown in Supplementary Figure S4, available in www.besjournal.com. Ti 2p and O 1s peak positions of the samples are shown in Supplementary Table S1, available in www.besjournal.com. The atomic ratios of Ti from the XPS survey spectra were 8.75%, 1.59%, and 0.71% in CDCs-NH4HF2-6h, CDCs-NaHF2-6h, and CDCs-NH4F-6h, respectively. These results were consistent with the XRD patterns. Na+ and NH4+ cations could be inserted into the interspace of Ti3C2Tx nanosheets, thus enlarging interplanar spacing during the etching process (Supplementary Figure S5, available in www.besjournal.com). The diameters of Na+ and NH4+ were the farthest spacings between all surface points. The cation surfaces were defined as isosurfaces with an electron density of ρ = 0.002 a.u.[22] Since the radius of NH4+ (1.8685 Å) is much larger than that of Na+ (0.934 Å), the geometries of these two cations were calculated via theoretical optimization using Gaussian 16 (version B01)[23]. A more effective intercalation effect from NH4HF2 compared with NaHF2 is expected for the Ti3C2Tx MXene nanosheets[24]. The better etching by NH4HF2 and NaHF2 compared with NH4F was due to volatile H2 production from HF2− at the anode during the EC process. Thus, NH4HF2 was confirmed to be the optimal electrolyte for the efficient exfoliation of MAX into CDCs through EC oxidative cleavage.
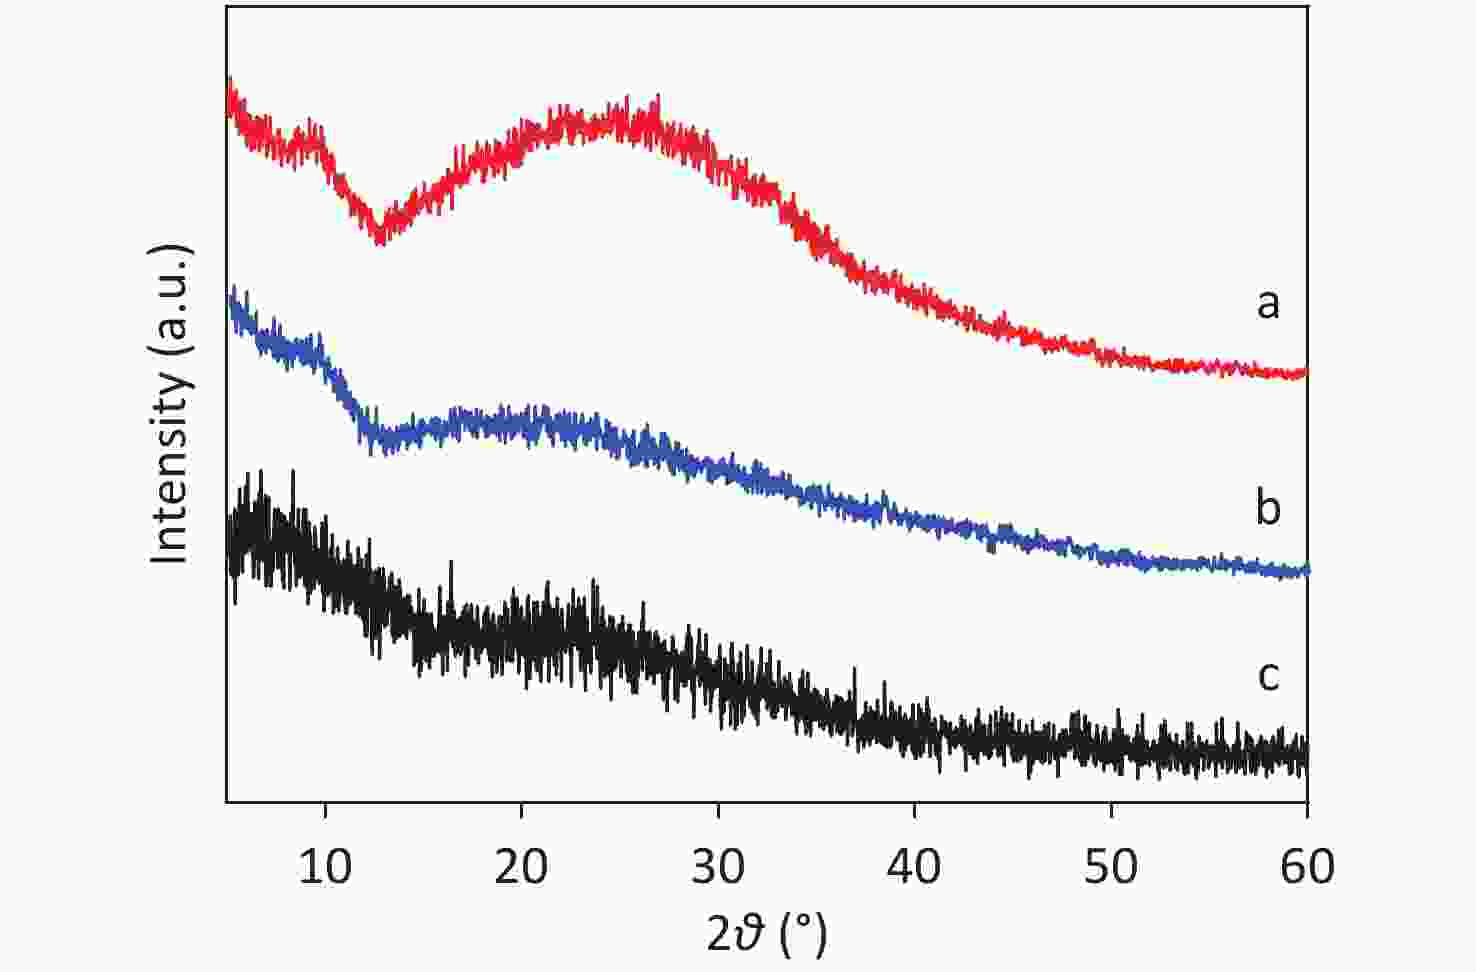
Figure S3. XRD patterns of (a) CDCs-NH4HF2-6h, (b) CDCs-NaHF2-6h, (c) CDCs-NH4F-6h, respectively.
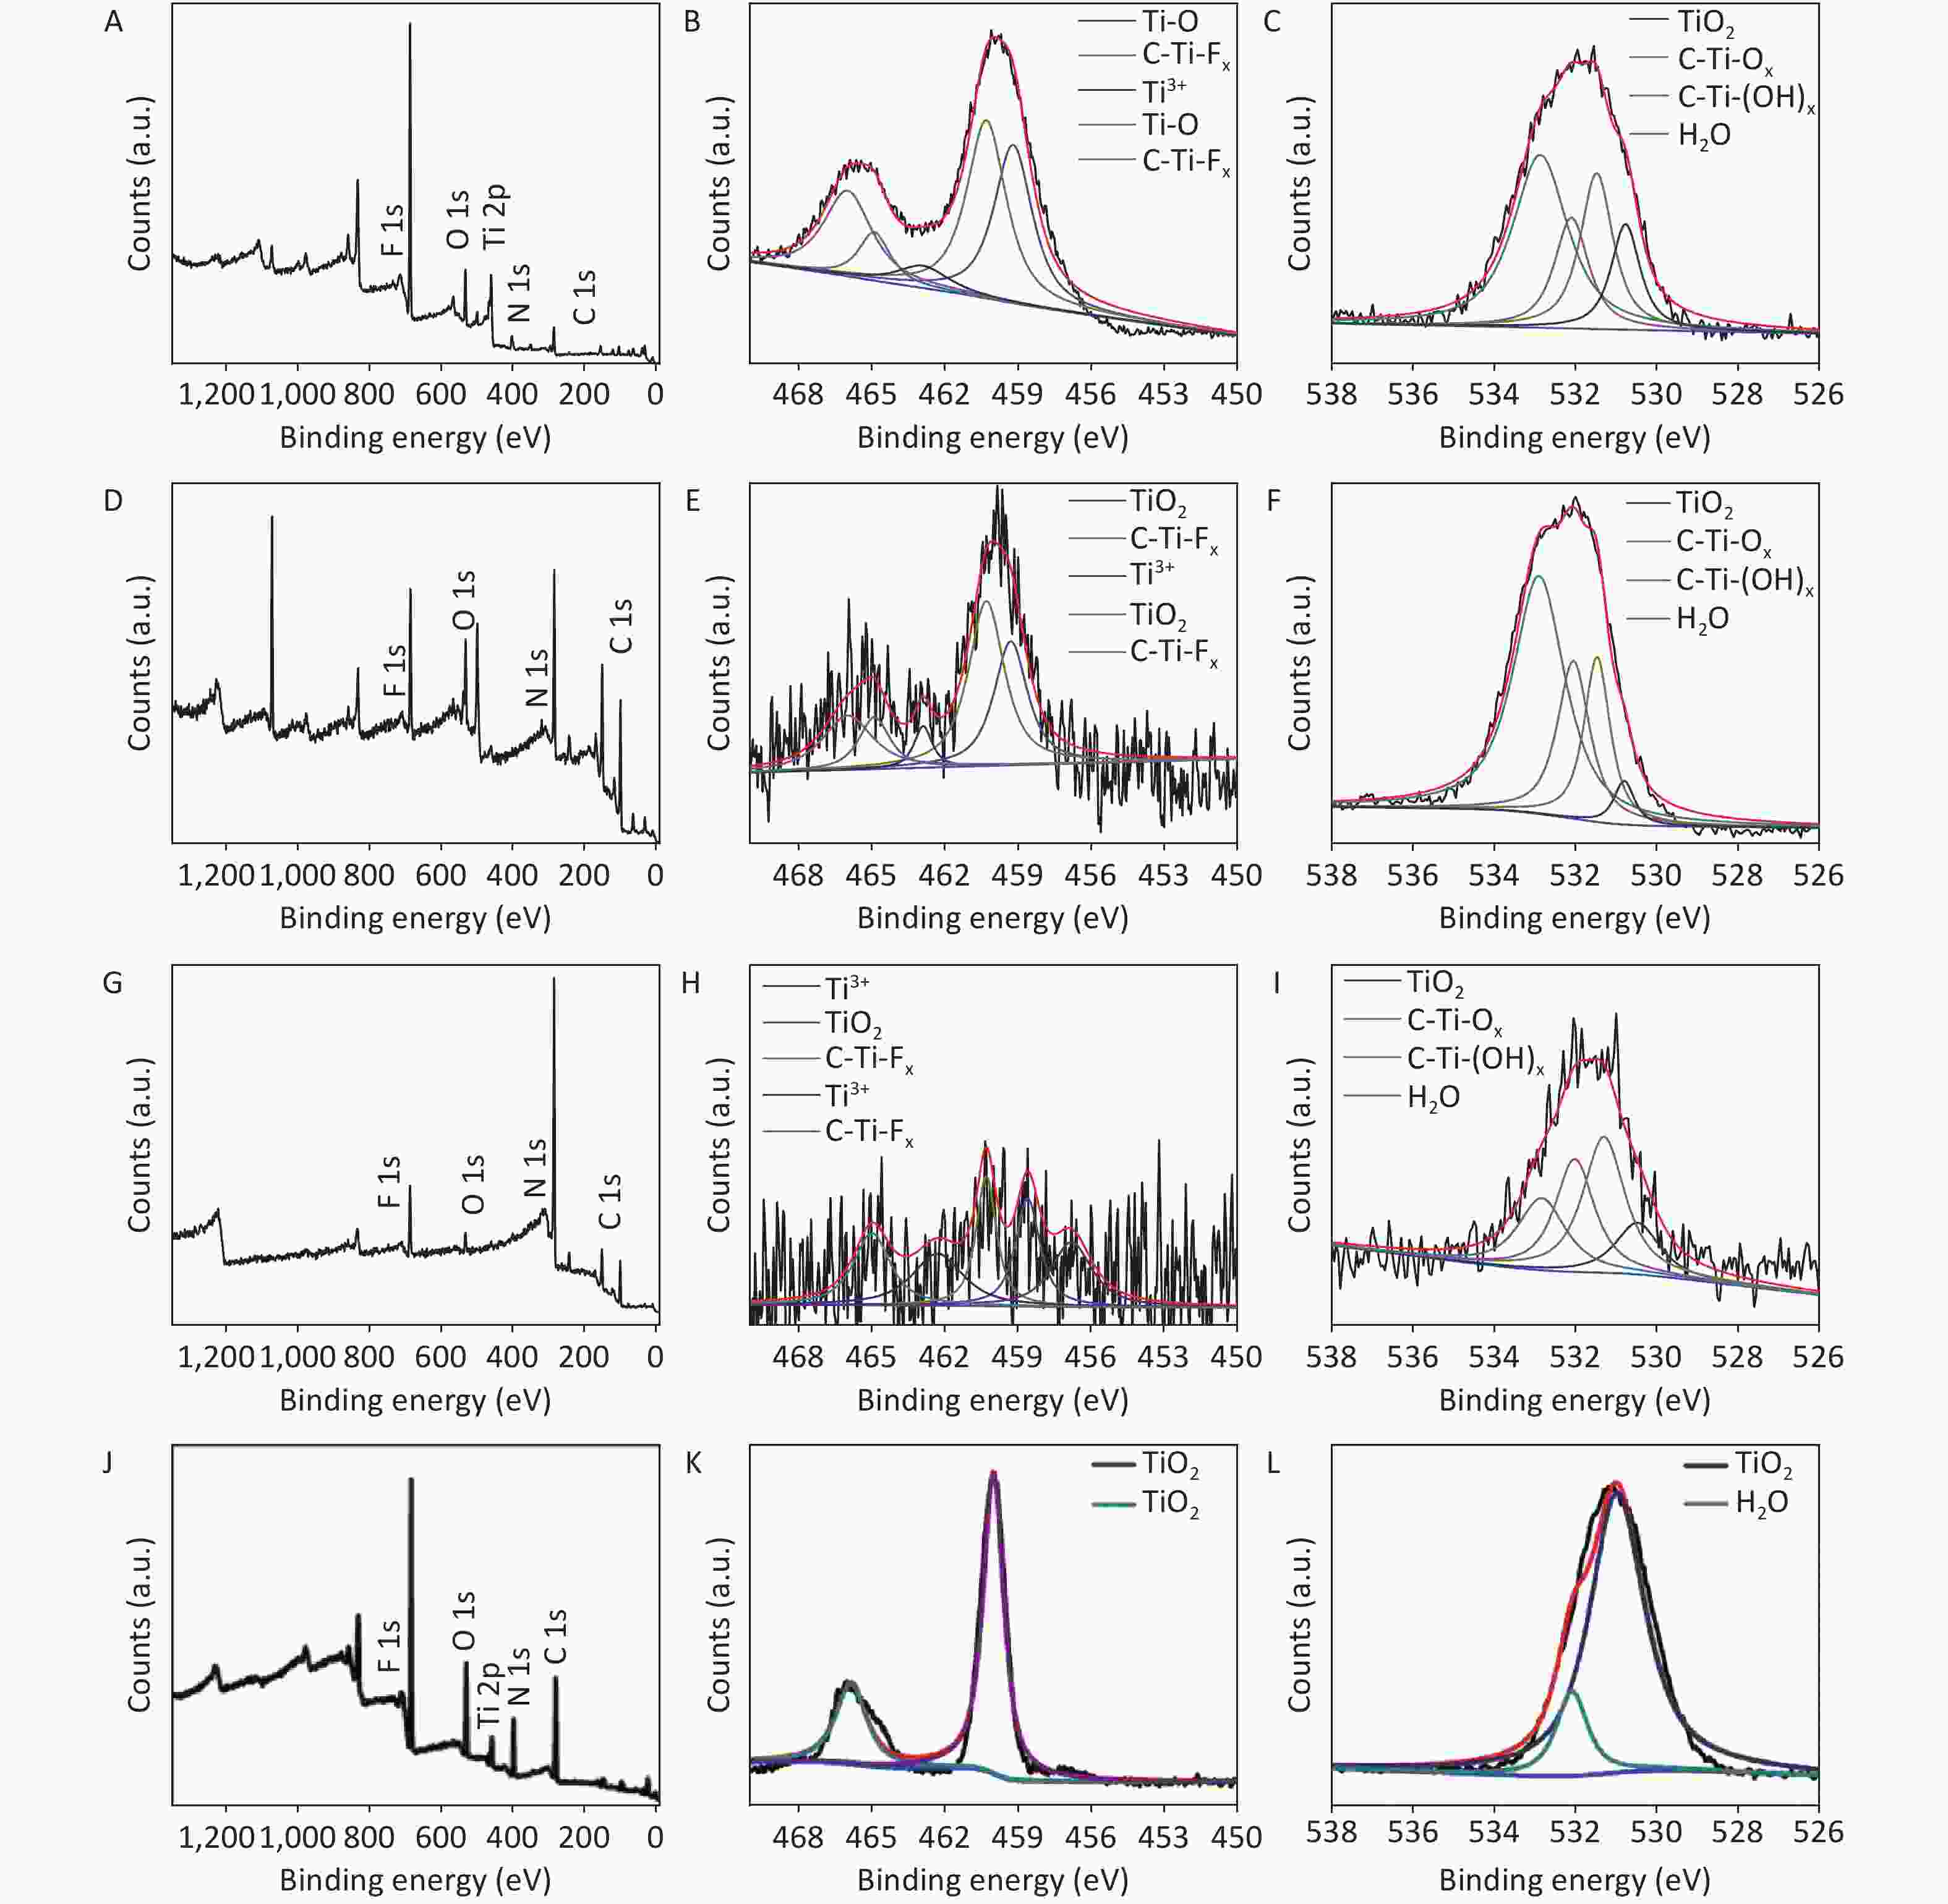
Figure S4. The survey XPS spectra (A, D, and G), the narrow scan spectra of Ti 2p (B, E, and H) and O 1s (C, F, and I) of the CDCs-NH4HF2-6h, CDCs-NaHF2-6h, and CDCs-NH4F-6h, respectively.
Table S1. XPS peak fitting results for CDCs-NH4HF2-6h, CDCs-NaHF2-6h, and CDCs-NH4F-6h
CDCs-NH4HF2-6h CDCs-NaHF2-6h CDCs-NH4F-6h Region BE [eV] BE [eV] BE [eV] Assigned to Ti 2p 466 466 TiO2 464.9 464.9 465 C-Ti-Fx 462.9 462.9 462.3 Ti3+ 460.3 460.3 460.3 TiO2 459.3 459.3 458.6 C-Ti-Fx 456.8 Ti3+ O 1s 532.6 533.3 532.8 H2O 531.8 532.5 532 C-Ti-(OH)x 531 531.8 531.3 C-Ti-Ox 530 531.1 530.5 TiO2 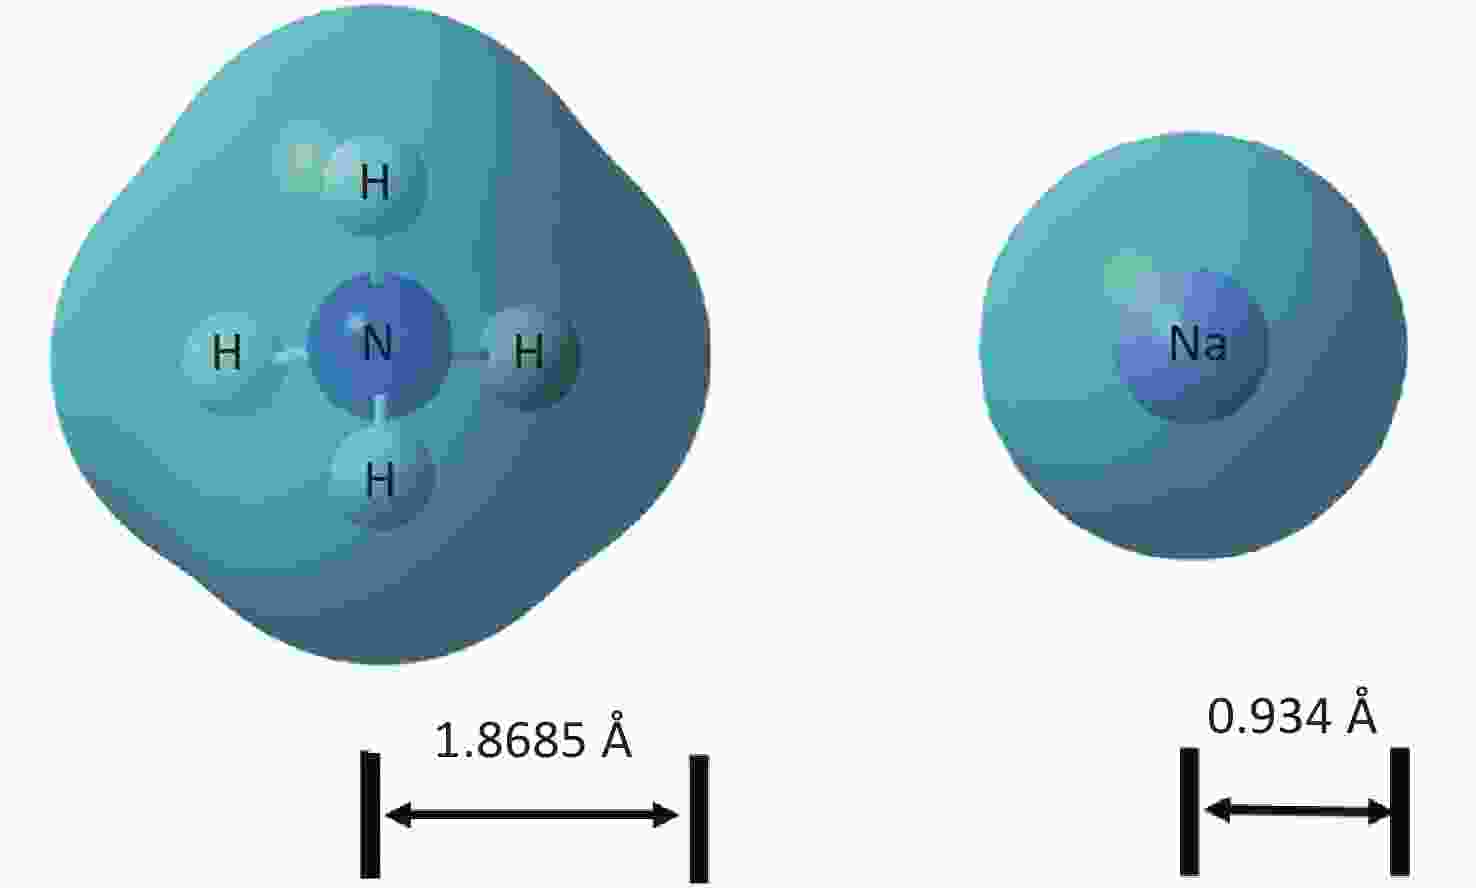
Figure S5. The cation radius of NH+4 and Na+.
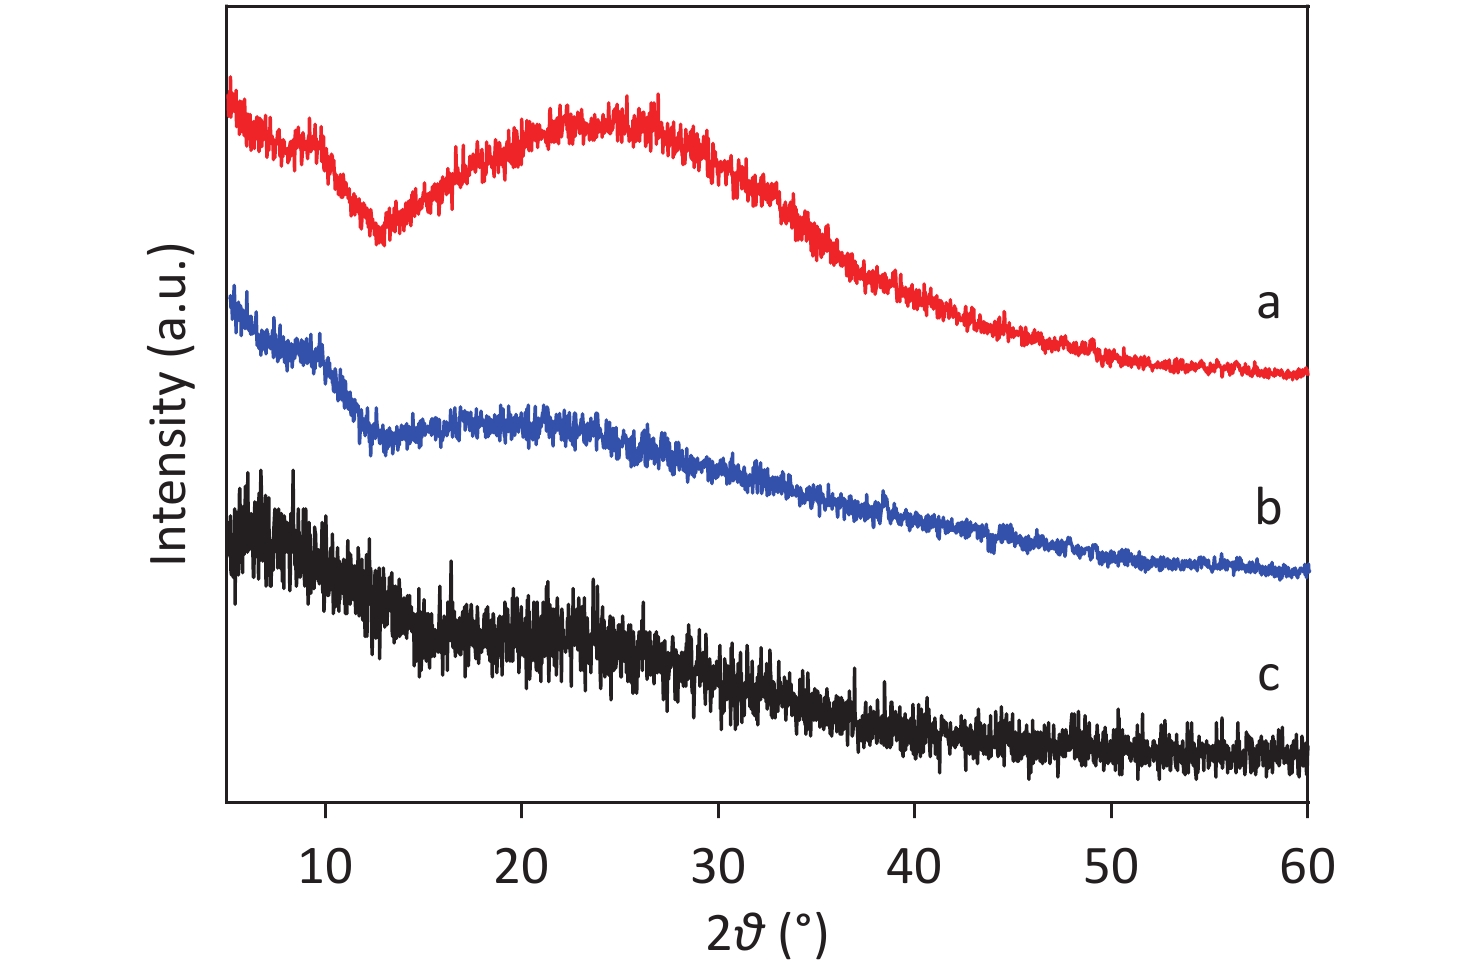
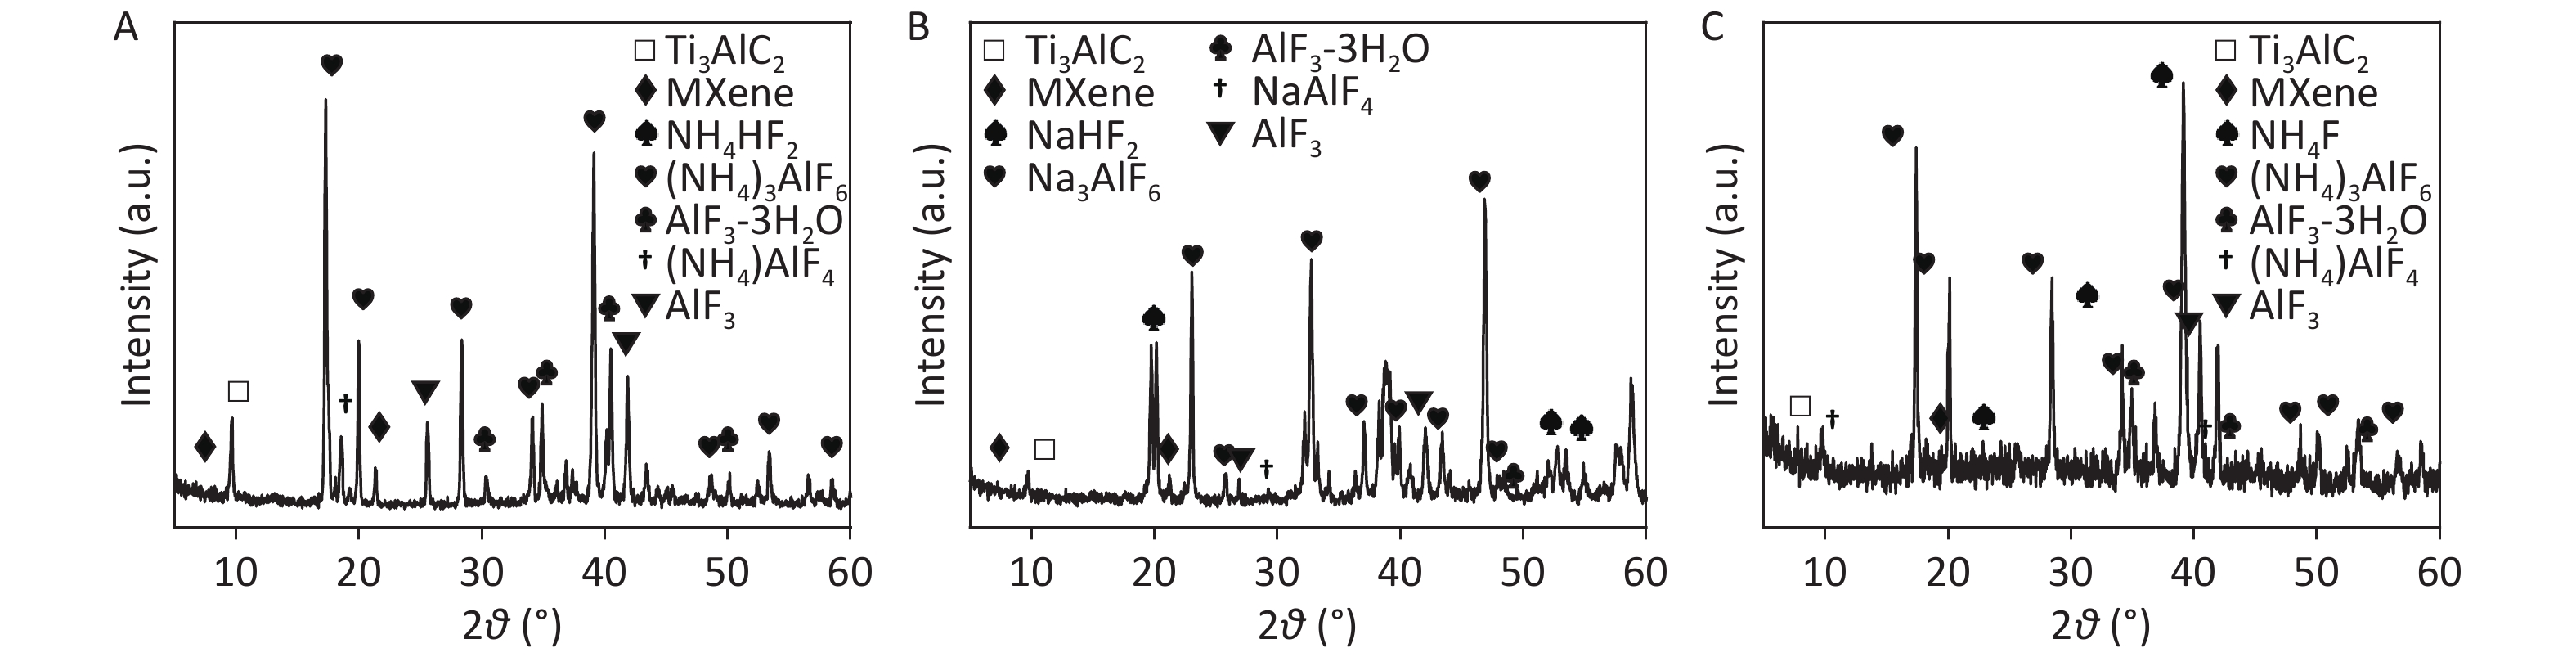
To further investigate the electrochemical exfoliation process, precipitates prepared in 0.5 mol/L NH4HF2, NaHF2, and NH4F after 6 h of EC oxidation (termed CDCsP-NH4HF2-6h, CDCsP-NaHF2-6h, and CDCsP-NH4F-6h, respectively) were collected for XRD characterization after centrifugation and freeze-drying without post-washing. As shown in Figure 2, the XRD patterns of CDCs-NH4HF2-6h and CDCs-NH4F-6h showed three main byproducts, i.e., (NH4)3AlF6, NH4AlF4, and AlF3∙3H2O. Additionally, Na3AlF6, NaAlF4, and AlF3∙3H2O were the main byproducts of CDCs-NaHF2-6h. The XRD patterns of CDCs-NH4HF2-6h and CDCs-NaHF2-6h (Supplementary Figure S3) showed a (002) peak of Ti3C2Tx in the electrolyte, with the exfoliation mechanism of this process as:
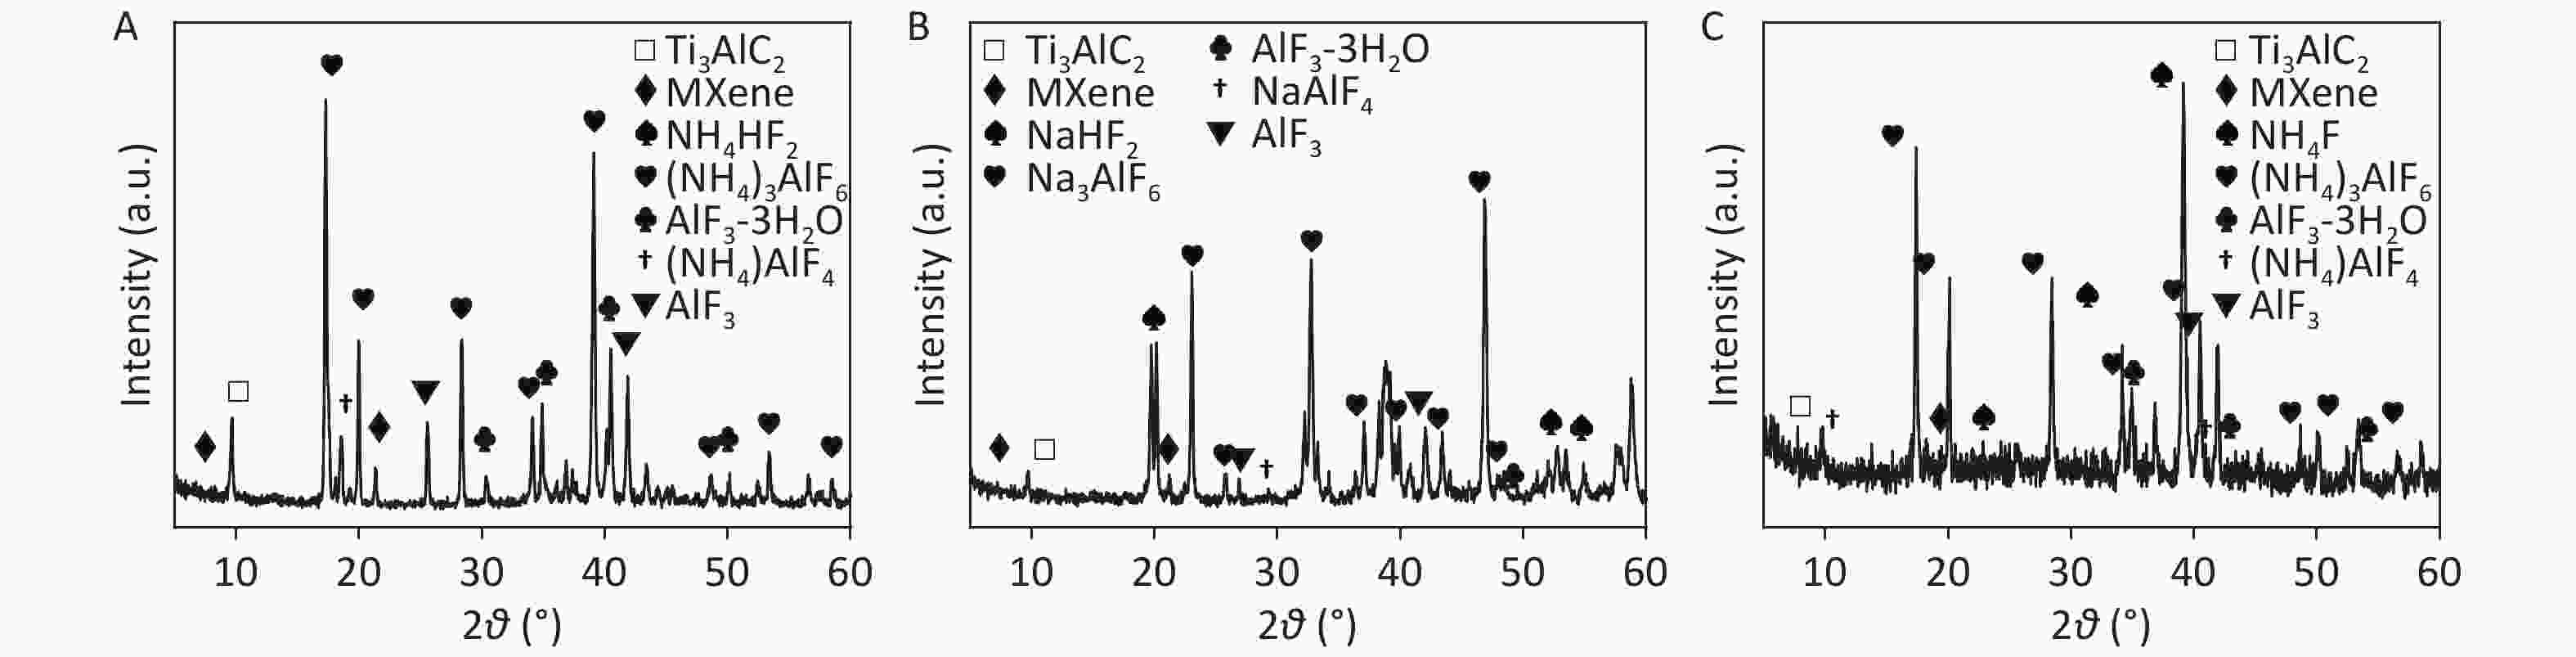
Figure 2. XRD patterns of (A) CDCs-NH4HF2-6h, (B) CDCs-NaHF2-6h, and (C) CDCs-NH4F-6h.
NH4/NaHF2 →NH+4/Na + HF−2
HF−2 → HF + F−
Ti3AlC2 + HF + NH+4/Na → (NH4)a/NaAlFb + AlF3 + H2↑ + Ti3C2
AlF3 + cH2O → AlF3∙cH2O
Ti3C2 + NH4/NaHF2 + H2O → Ti3C2Fx(OH)yXz (MXene)
${\text{T}}{{\text{i}}_{\text{3}}}{{\text{C}}_{\text{2}}}{{\text{F}}_{\text{x}}}{{\text{(OH)}}_{\text{y}}}{{\text{(N}}{{\text{H}}_{\text{4}}}{\text{)}}_{\text{z}}}\xrightarrow{{{\text{EC}}}}{\text{C}}$ where a, b, c, x, y, and z represent different numbers, while Ti3C2Fx(OH)yXz is the accurate chemical formula of Ti3C2Tx.
Metallic M‒A bonds are relatively weak compared with M‒X bonds; thus, “A” layers in MAX phases are removed. Based on these results, we conclude that the EC etching of Ti3AlC2 MAX into Ti3C2Tx and CDCs occurs in two steps. First, HF2− is ionized to HF and F−. The HF attacks the Al layer, which is successfully etched, and –F functional groups as well as –OH and –O are formed on the Ti3C2 MXene due to the dissolved oxygen in the aqueous medium. Second, the outside layer of the MXene (Ti3C2Fx(OH)yXz) is further etched, resulting in the formation of amorphous carbon with –Cl, –OH, and –O terminal groups via the simultaneous removal of both M and A atoms. More efficient etching agents and longer electrolysis times should result in higher CDC concentrations. TEM and HRTEM characterization was carried out to confirm the morphology and crystallinity of CDCs-NH4HF2-6h and CDCs-NH4HF2-16h.
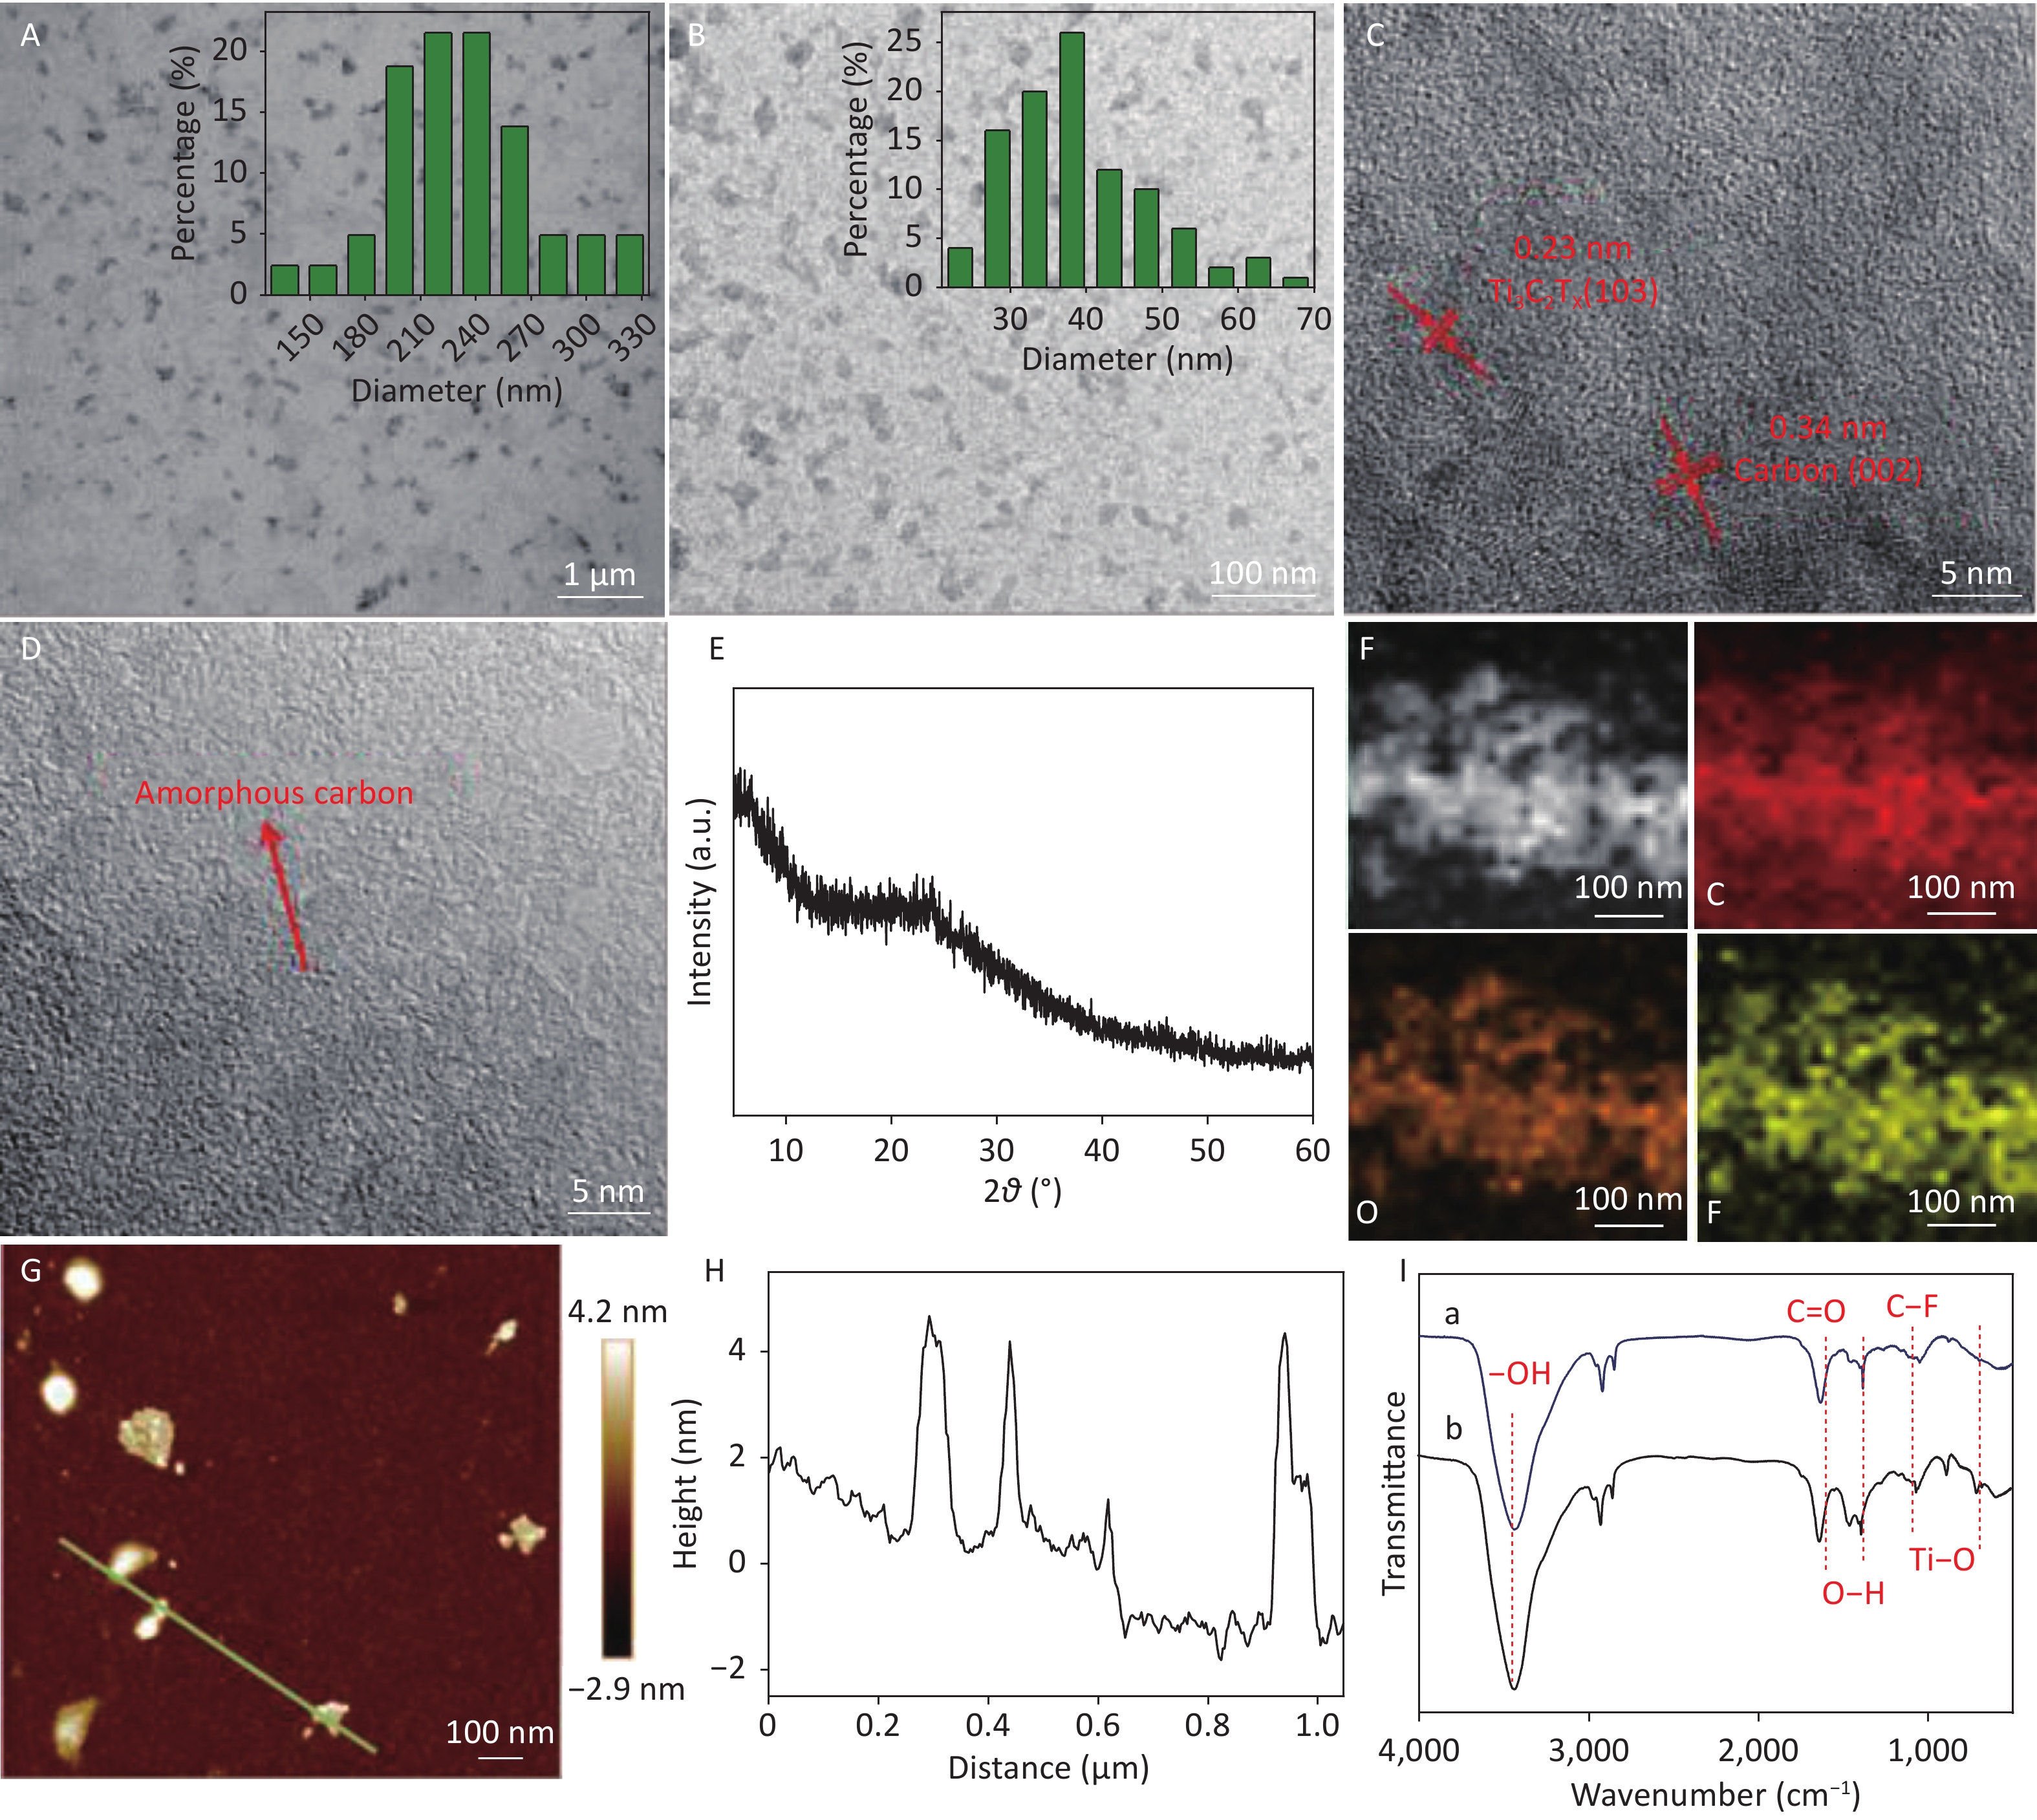
Many small CDCs were uniformly observed for the two samples (Figure 3A and 3B). The average diameter of CDCs-NH4HF2-6h and CDCs-NH4HF2-16h was calculated to be 230 ± 30 and 37 ± 5 nm, from counting 100 particles, respectively (Figure 3A and 3B insets). Additionally, an average in-plane lattice spacing of 0.34 nm was observed for the crystalline structure of CDCs-NH4HF2-6h, which indicated the (002) facet as carbon (Figure 3C). An interplanar space of 0.23 nm was also observed, which resulted from the (103) crystal face of the Ti3C2Tx MXene (Figure 3C)[25]. Less lattice fringe, corresponding to a lower crystallinity, was obtained for CDCs-NH4HF2-16h, indicative of the generation of amorphous CDCs (Figure 3D) upon extended electrochemical oxidation. The HRTEM results were consistent with the XRD data. There was also a broad peak around 2θ = 20 to 30° in the XRD pattern of CDCs-NH4HF2-6h, suggesting the appearance of a (002) facet of carbon with a low degree of graphitization (Supplementary Figure S3, red line)[26]. This graphitic peak from CDCs-NH4HF2-16h was much weaker and broader than that of CDCs-NH4HF2-6h, suggesting that CDCs-NH4HF2-16h was more disordered due to the further electrochemical oxidation of carbon[27] (Figure 3E). Elemental mapping characterization showed that C, F, and O were homogenously dispersed (Figure 3F). AFM measurements (Figure 3G) and corresponding height analyses (Figure 3H) revealed that nanosheets were well dispersed in the aqueous suspension, with topographic heights ranging from 2.7 to 4.5 nm, and that the majority of CDCs-NH4HF2-16h were 3-5-layer structures. FTIR spectra indicated that both CDCs-NH4HF2-6h and CDCs-NH4HF2-16h exhibited identical stretching vibrations, including –OH at 3,430 cm−1, C=O at 1,630 cm−1, O–H at around 1,380 cm−1, C–F at around 1,050 cm−1, and Ti-O at around 713 cm−1[28] (Figure 3I).
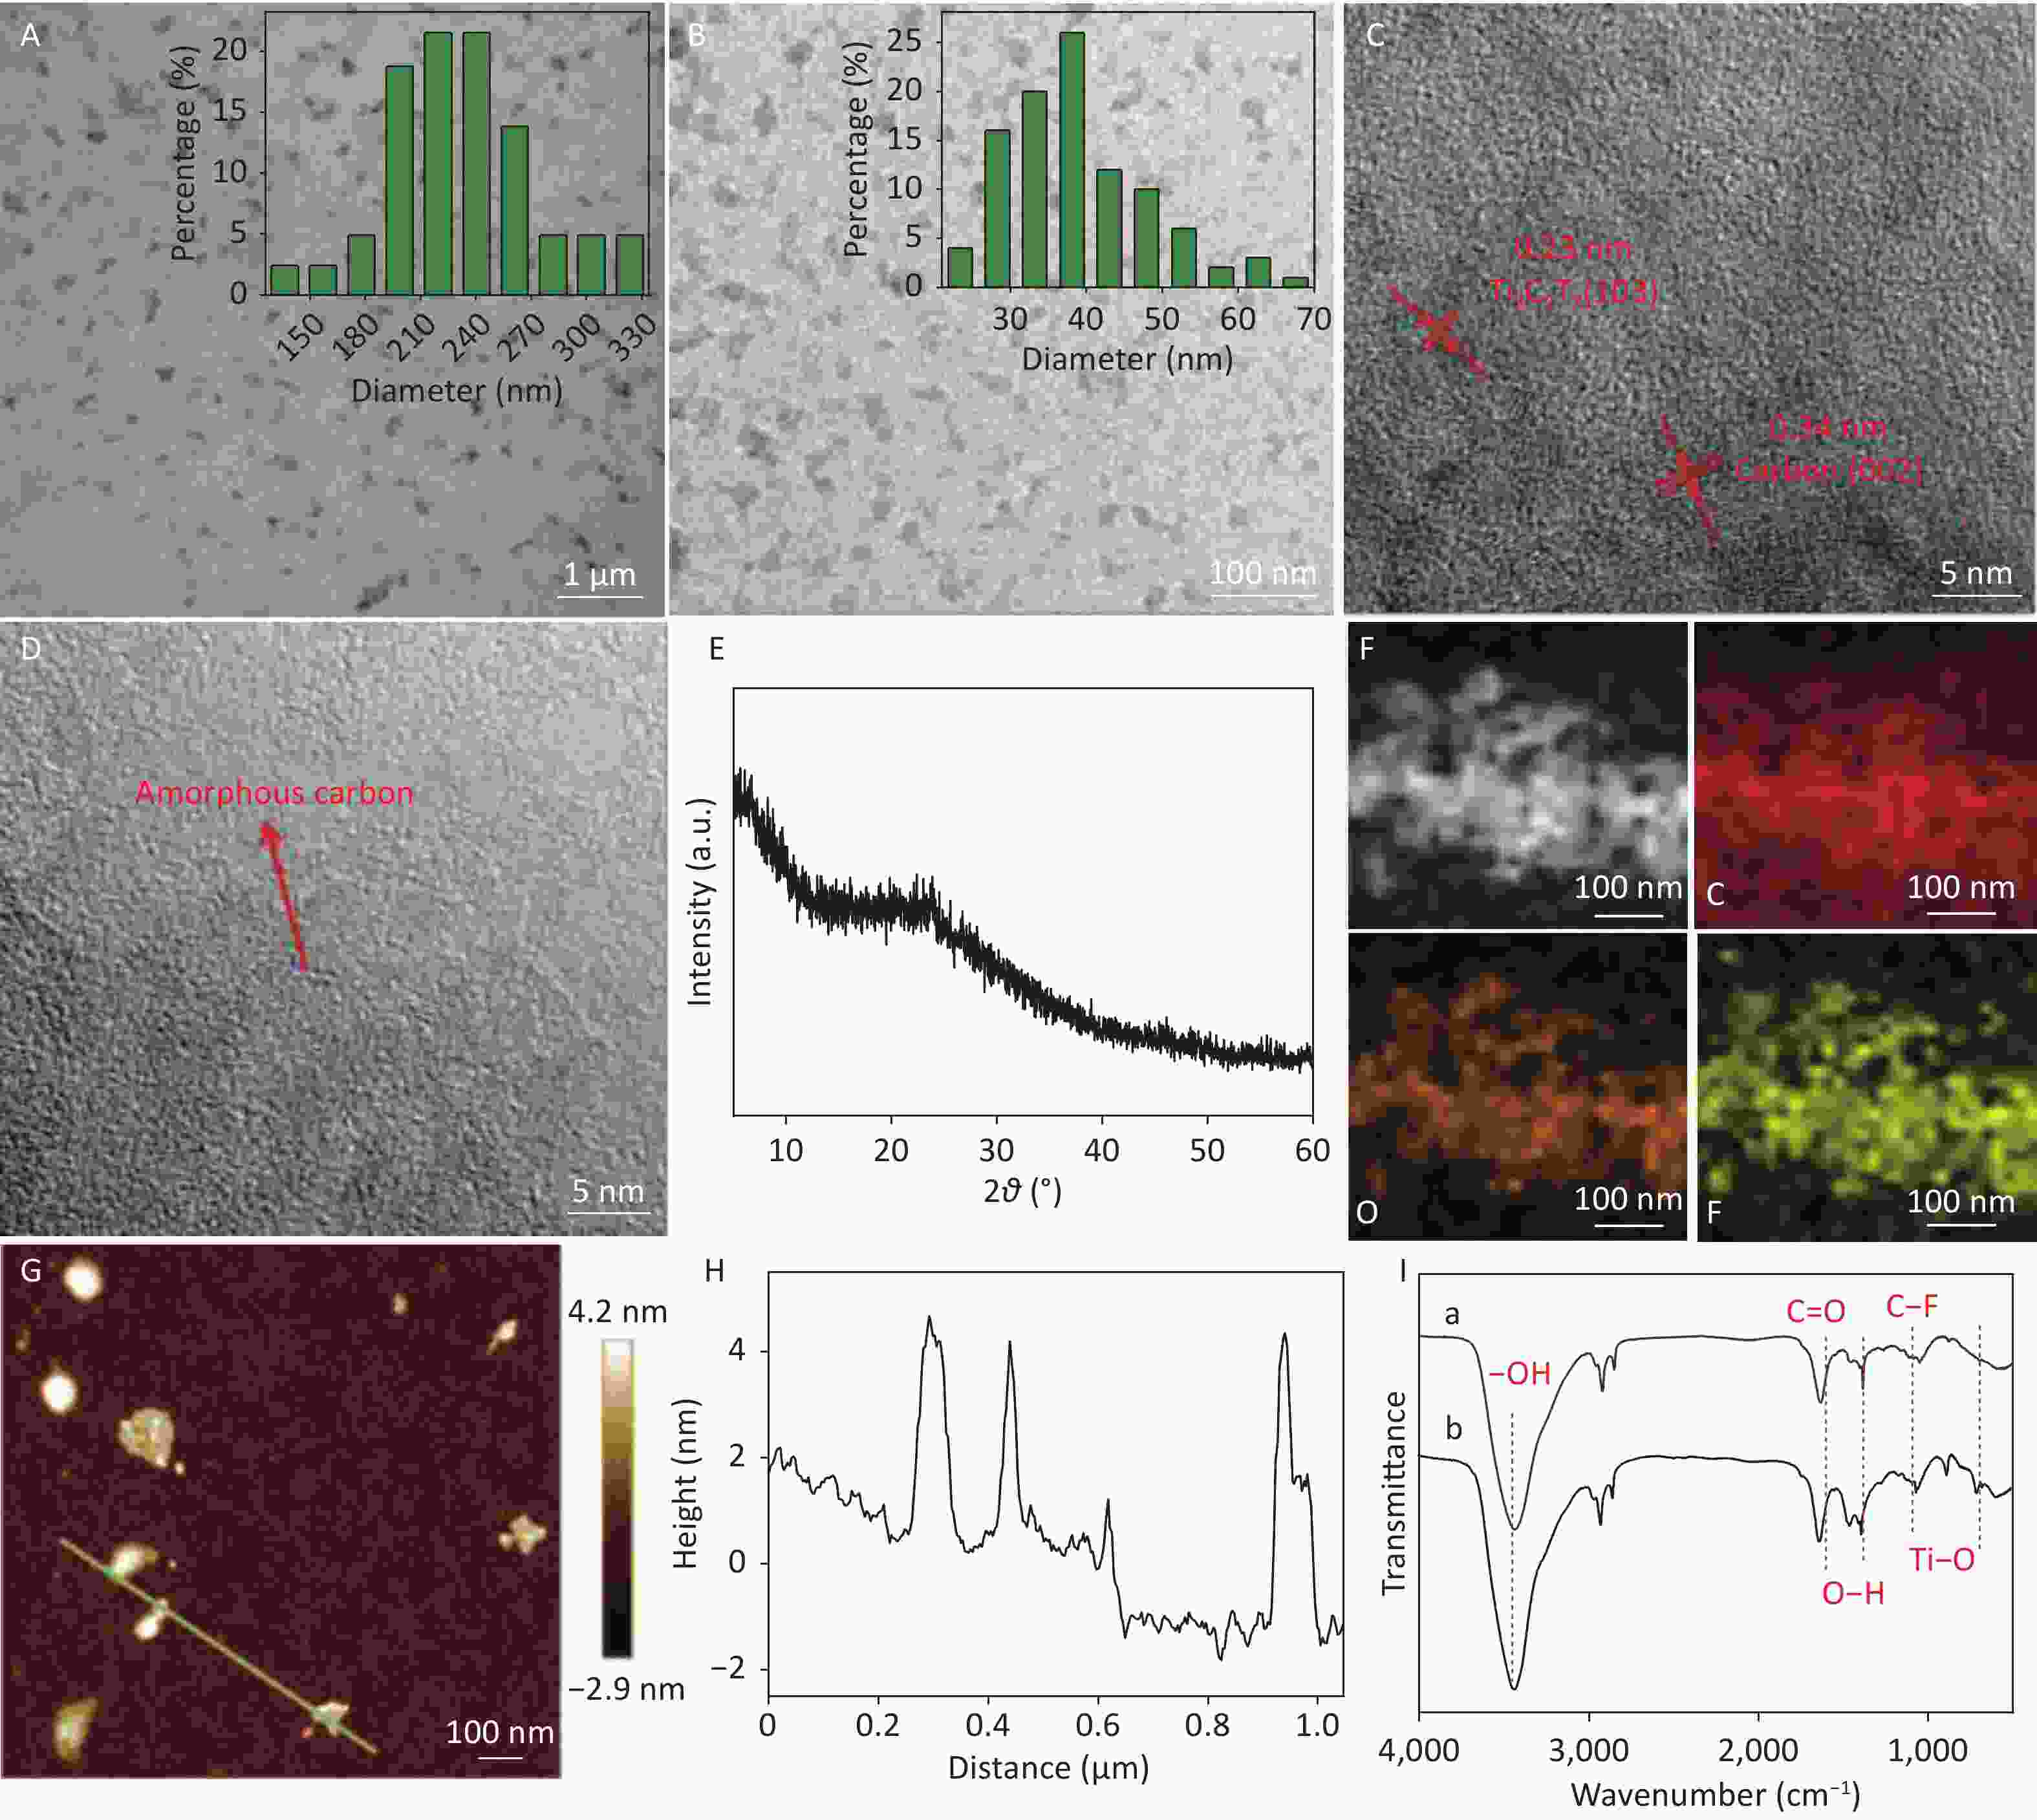
Figure 3. (A, B) TEM and (C, D) HRTEM images of (A, C) CDCs-NH4HF2-6h and (B, D) CDCs-NH4HF2-16h. (E) XRD pattern of CDCs-NH4HF2-16h; (F) TEM and corresponding elemental mapping images of C, O, and F in CDCs-NH4HF2-16h. (G) AFM topography of CDCs-NH4HF2-16h. (H) Height profiles from the white line section in the AFM image. (I) FTIR spectra of CDCs-NH4HF2-6h and CDCs-NH4HF2-16h. Insets (A, B) are particle size distributions obtained from TEM.
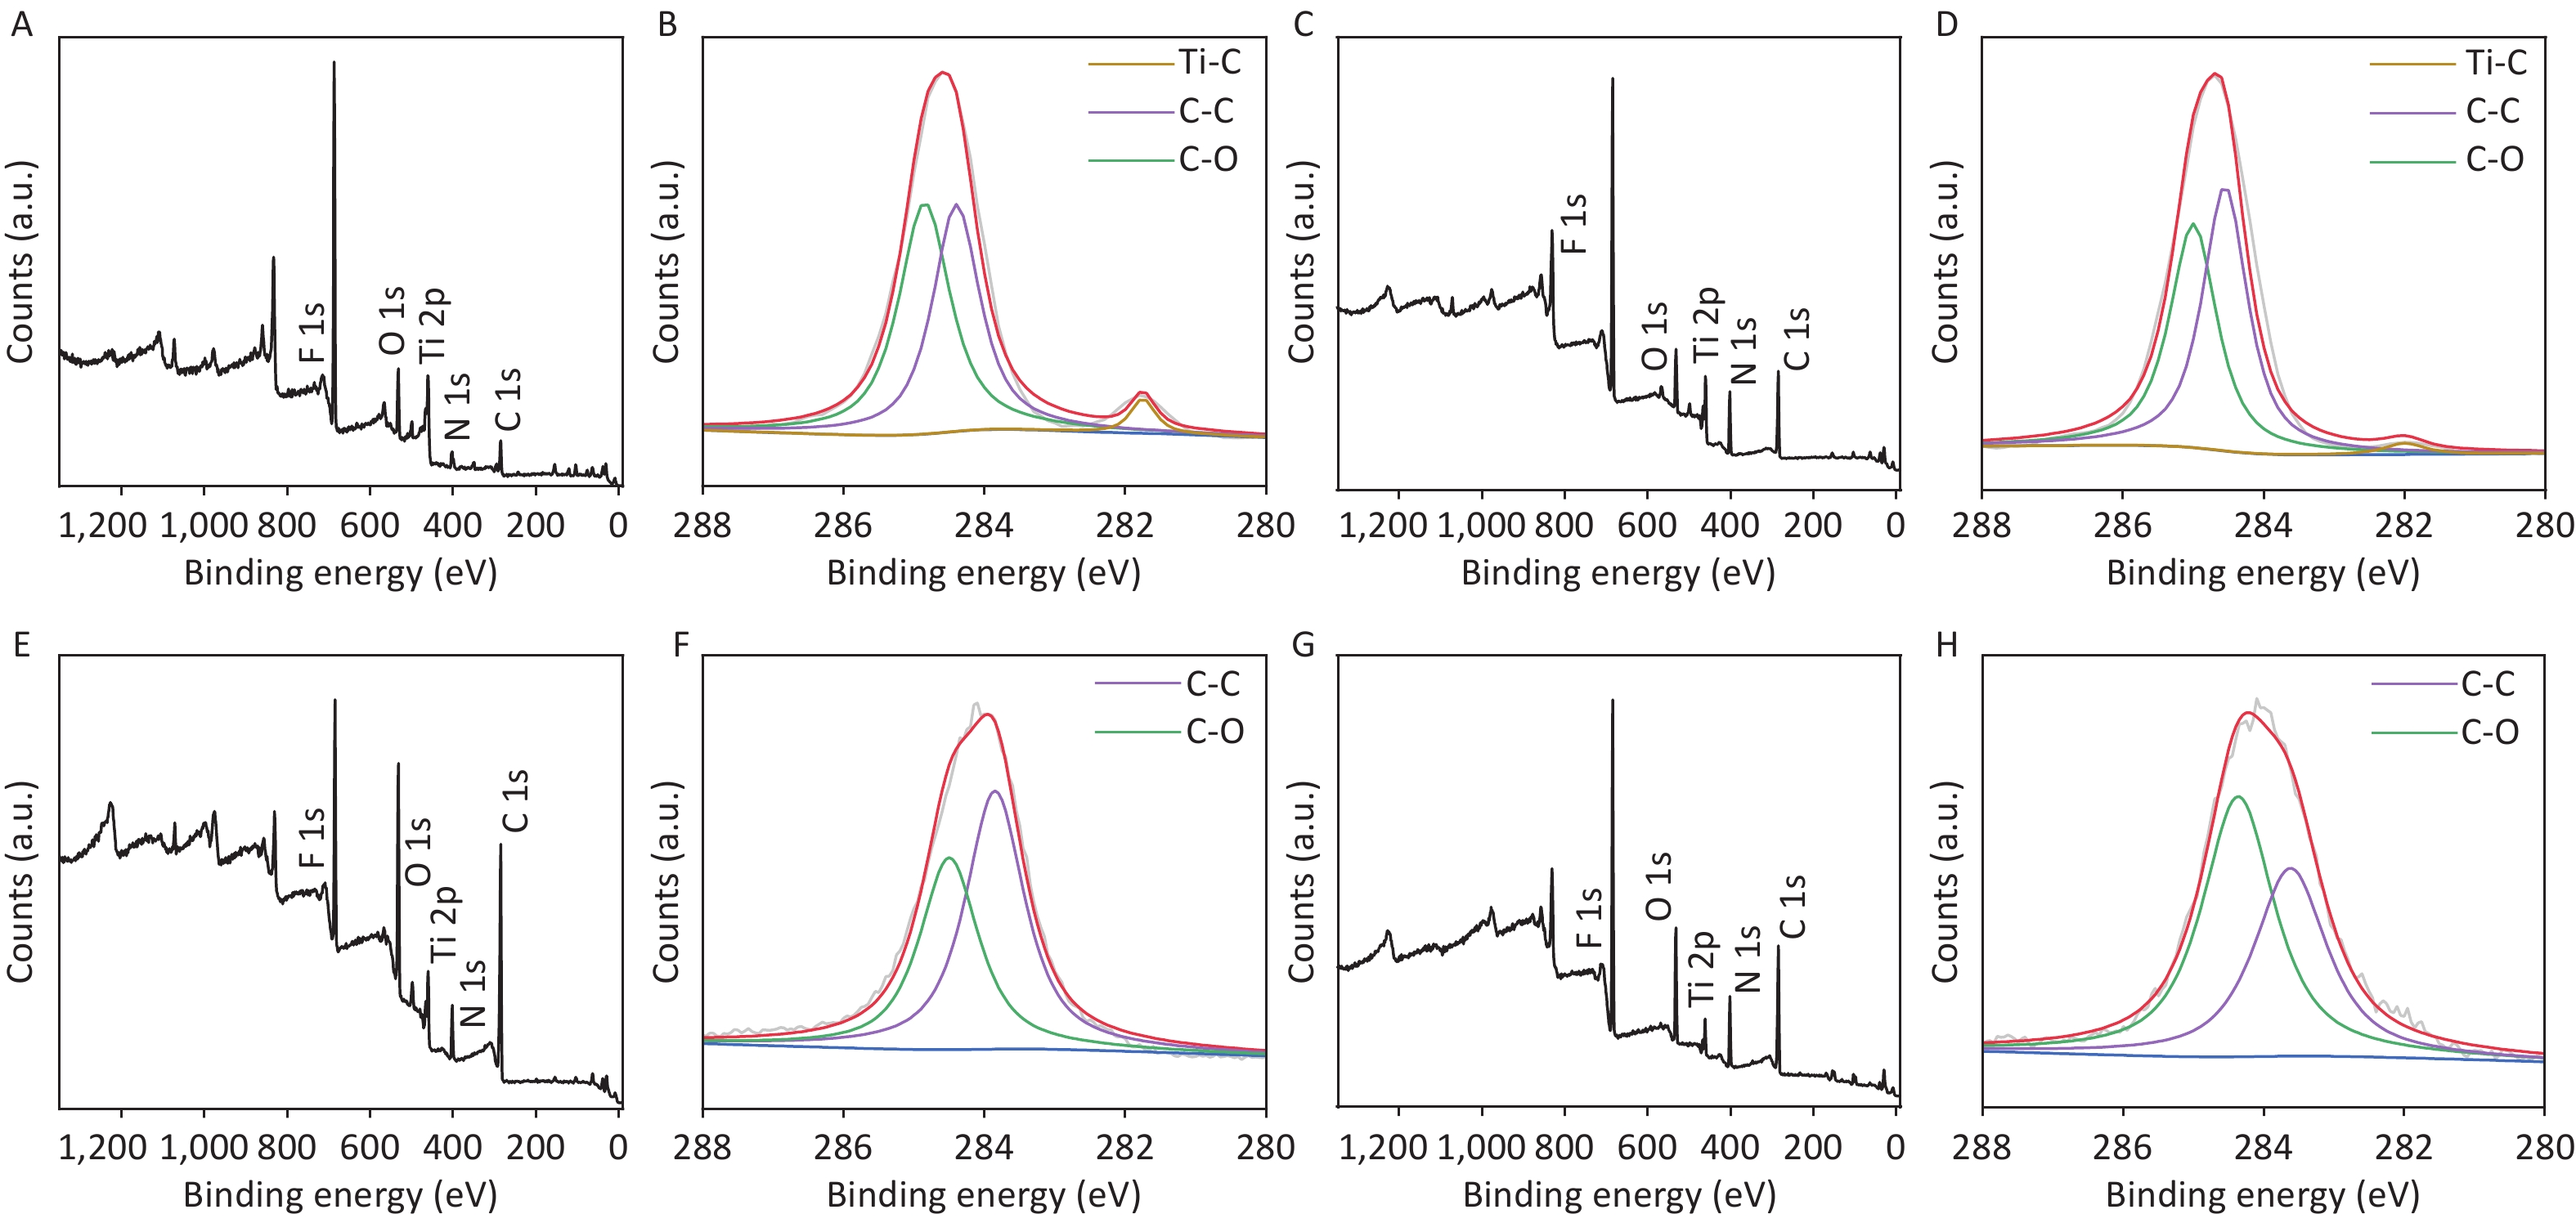
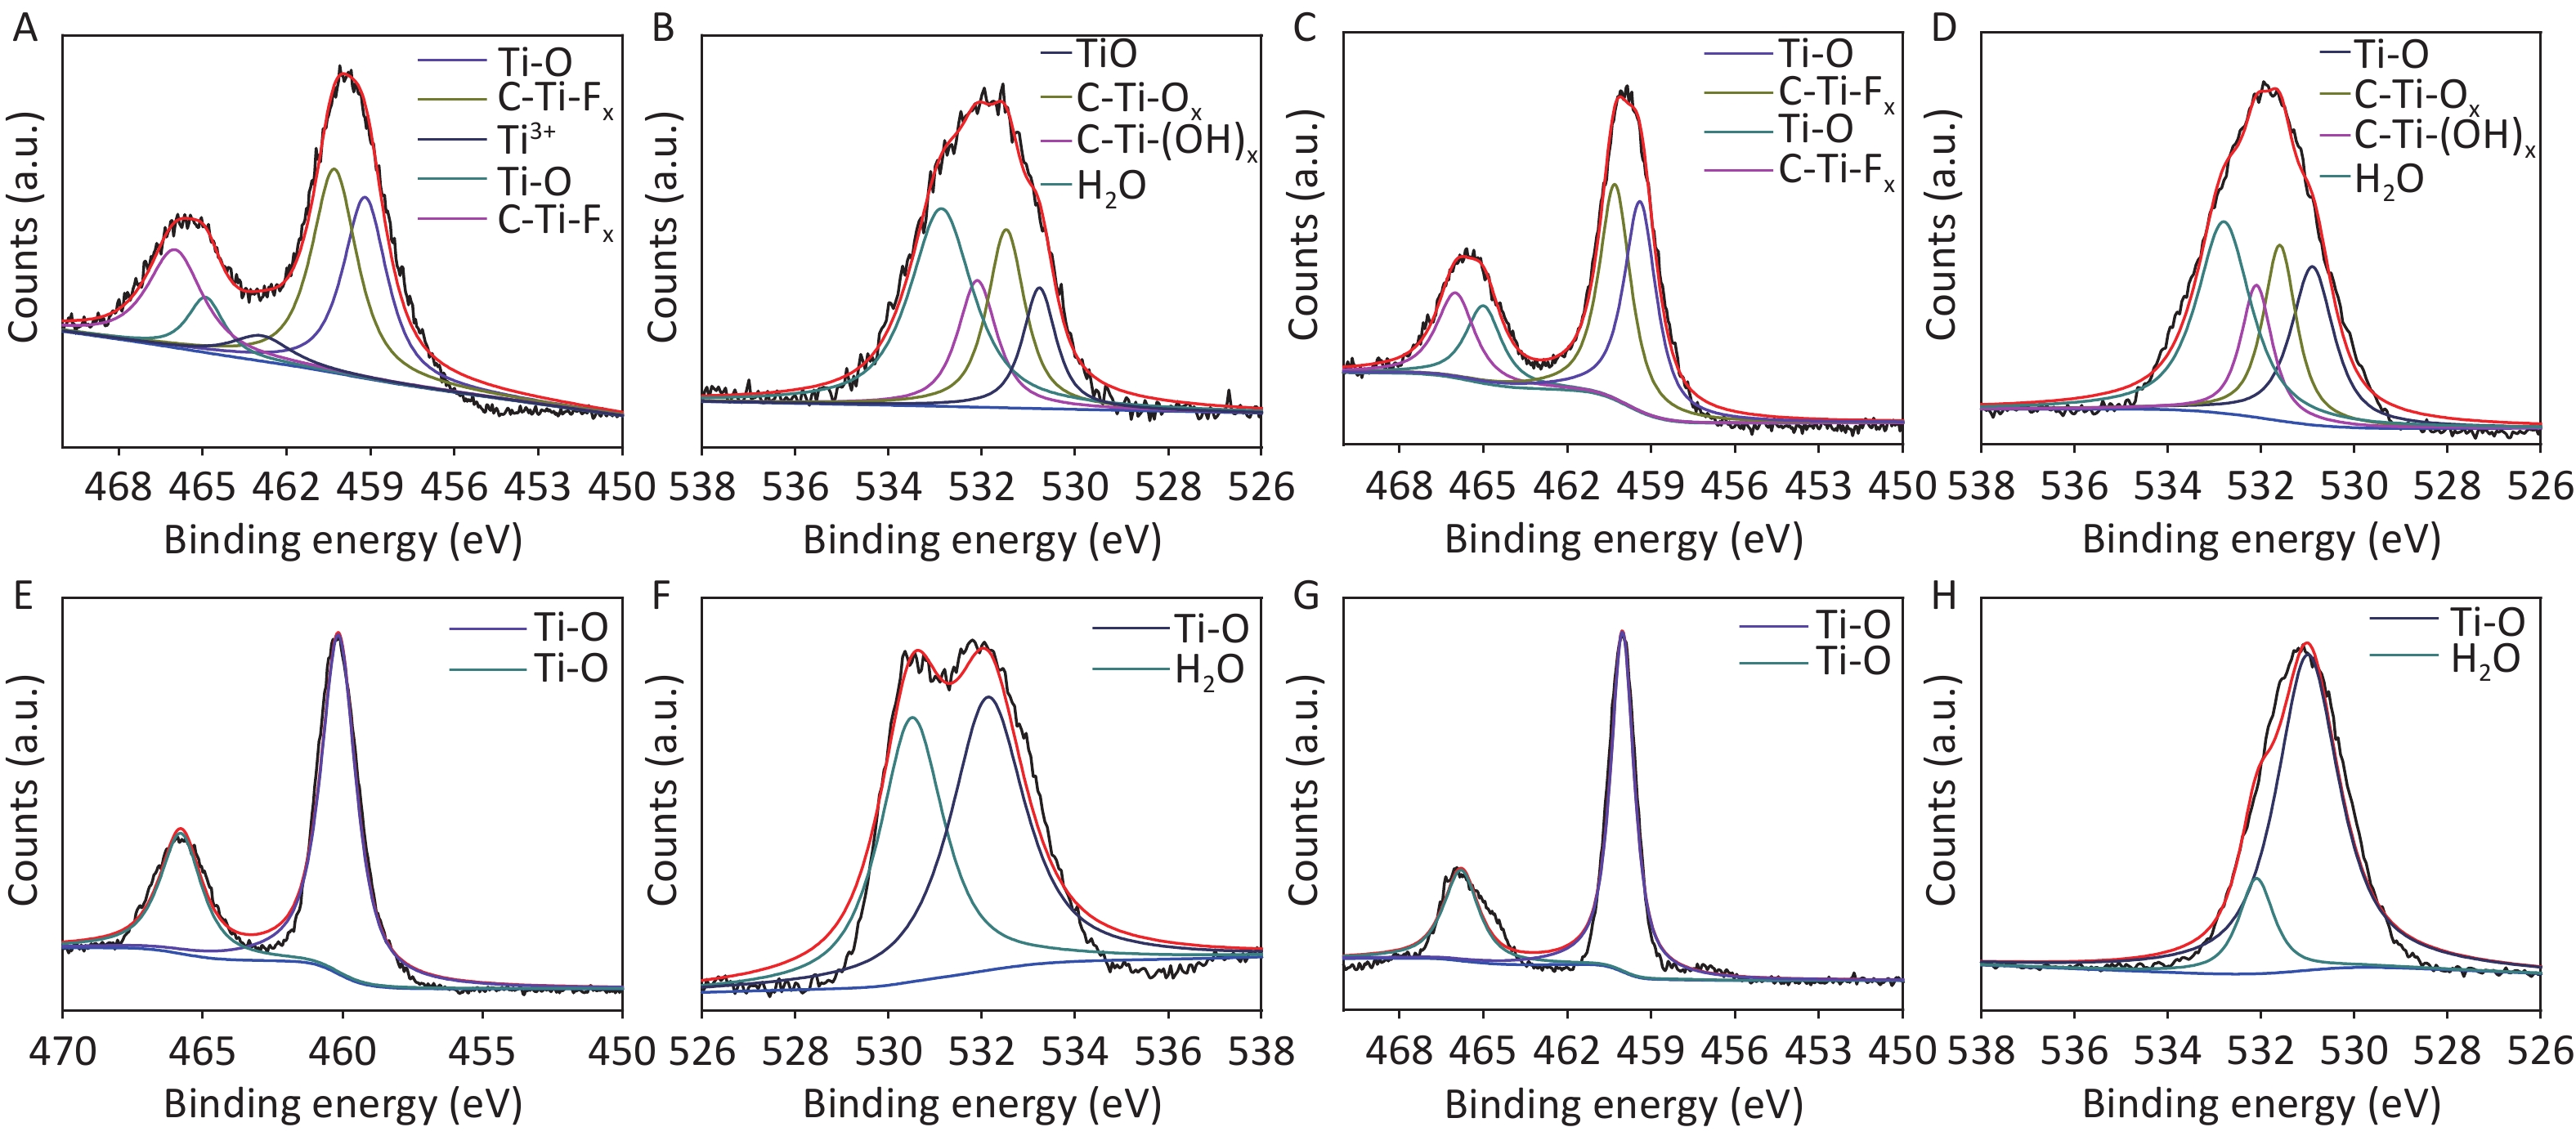
To further confirm the effects of electrolysis time, samples at two other reaction time points, i.e., CDCs-NH4HF2-10h and CDCs-NH4HF2-20h, were characterized via XPS. C, Ti, O, and F were observed in the survey spectra for all four samples (Supplementary Figure S6A, C, E, and G, available in www.besjournal.com). C 1s, Ti 2p, and O 1s peak positions of the samples are shown in Table S2. Peaks at 281.75 (282) eV, 284.4 (284.55, 284.41, or 284.3) eV, and 284.85 (285, 285, or 284.99) eV correspond to Ti–C, C–C, and C–O, respectively (Supplementary Figure S6B, D, F, and H). The intensity of the Ti–C peak gradually decreased, demonstrating that MAX was transformed into MXene, and then oxidized to C. For the Ti 2p region, peaks at 466 (466, 465.79, or 465.8) eV and 460.25 (460.3, 460.15, or 460.03) eV were attributed to Ti–O, peaks at 464.9 (465) eV and 459.15 (459.4) eV were attributed to C-Ti-Fx, and the peak at 462.9 eV corresponds to Ti3+[25] (Supplementary Figure S7A, C, E, and G, available in www.besjournal.com). The intensity of the C-Ti-Fx and Ti3+ peaks gradually decreased when the electrolysis time was extended to 16 h, consistent with the O 1s spectra. Detailed information about the O-containing groups, including Ti-O (530.03, 530.9, 530.5, or 531 eV), C-Ti-Ox (531 or 531.6 eV), C-Ti-(OH)x (531.78 or 532.1 eV), and H2O (532.6, 532.8, 532.13, or 532.1 eV) were derived from the O 1s spectra. The bond length of C-Ti-(OH)x decreased, further proving the conversion of Ti3C2Tx MXene (Supplementary Figure S7B, D, F, and H). The atomic ratios of C from XPS survey spectra were 32.6%, 41.96%, 63.08%, and 32.48% from CDCs-NH4HF2-6h, CDCs-NH4HF2-10h, CDCs-NH4HF2-16h, and CDCs-NH4HF2-20h, respectively. The carbon content reached a maximum value at an electrolysis time of 16 h, indicating that Ti3C2Tx was consumed and transformed to carbon. The carbon content in CDCs-NH4HF2-20h decreased with ongoing time, which was attributed to further carbon oxidation in the presence of dissolved oxygen from the aqueous medium[29]. These results are consistent with the color of CDCs fading after 16 h (Supplementary Figure S2G). Based on these results, CDCs-NH4HF2-16h was determined as the optimal CDC for this carbon-nanozyme study.
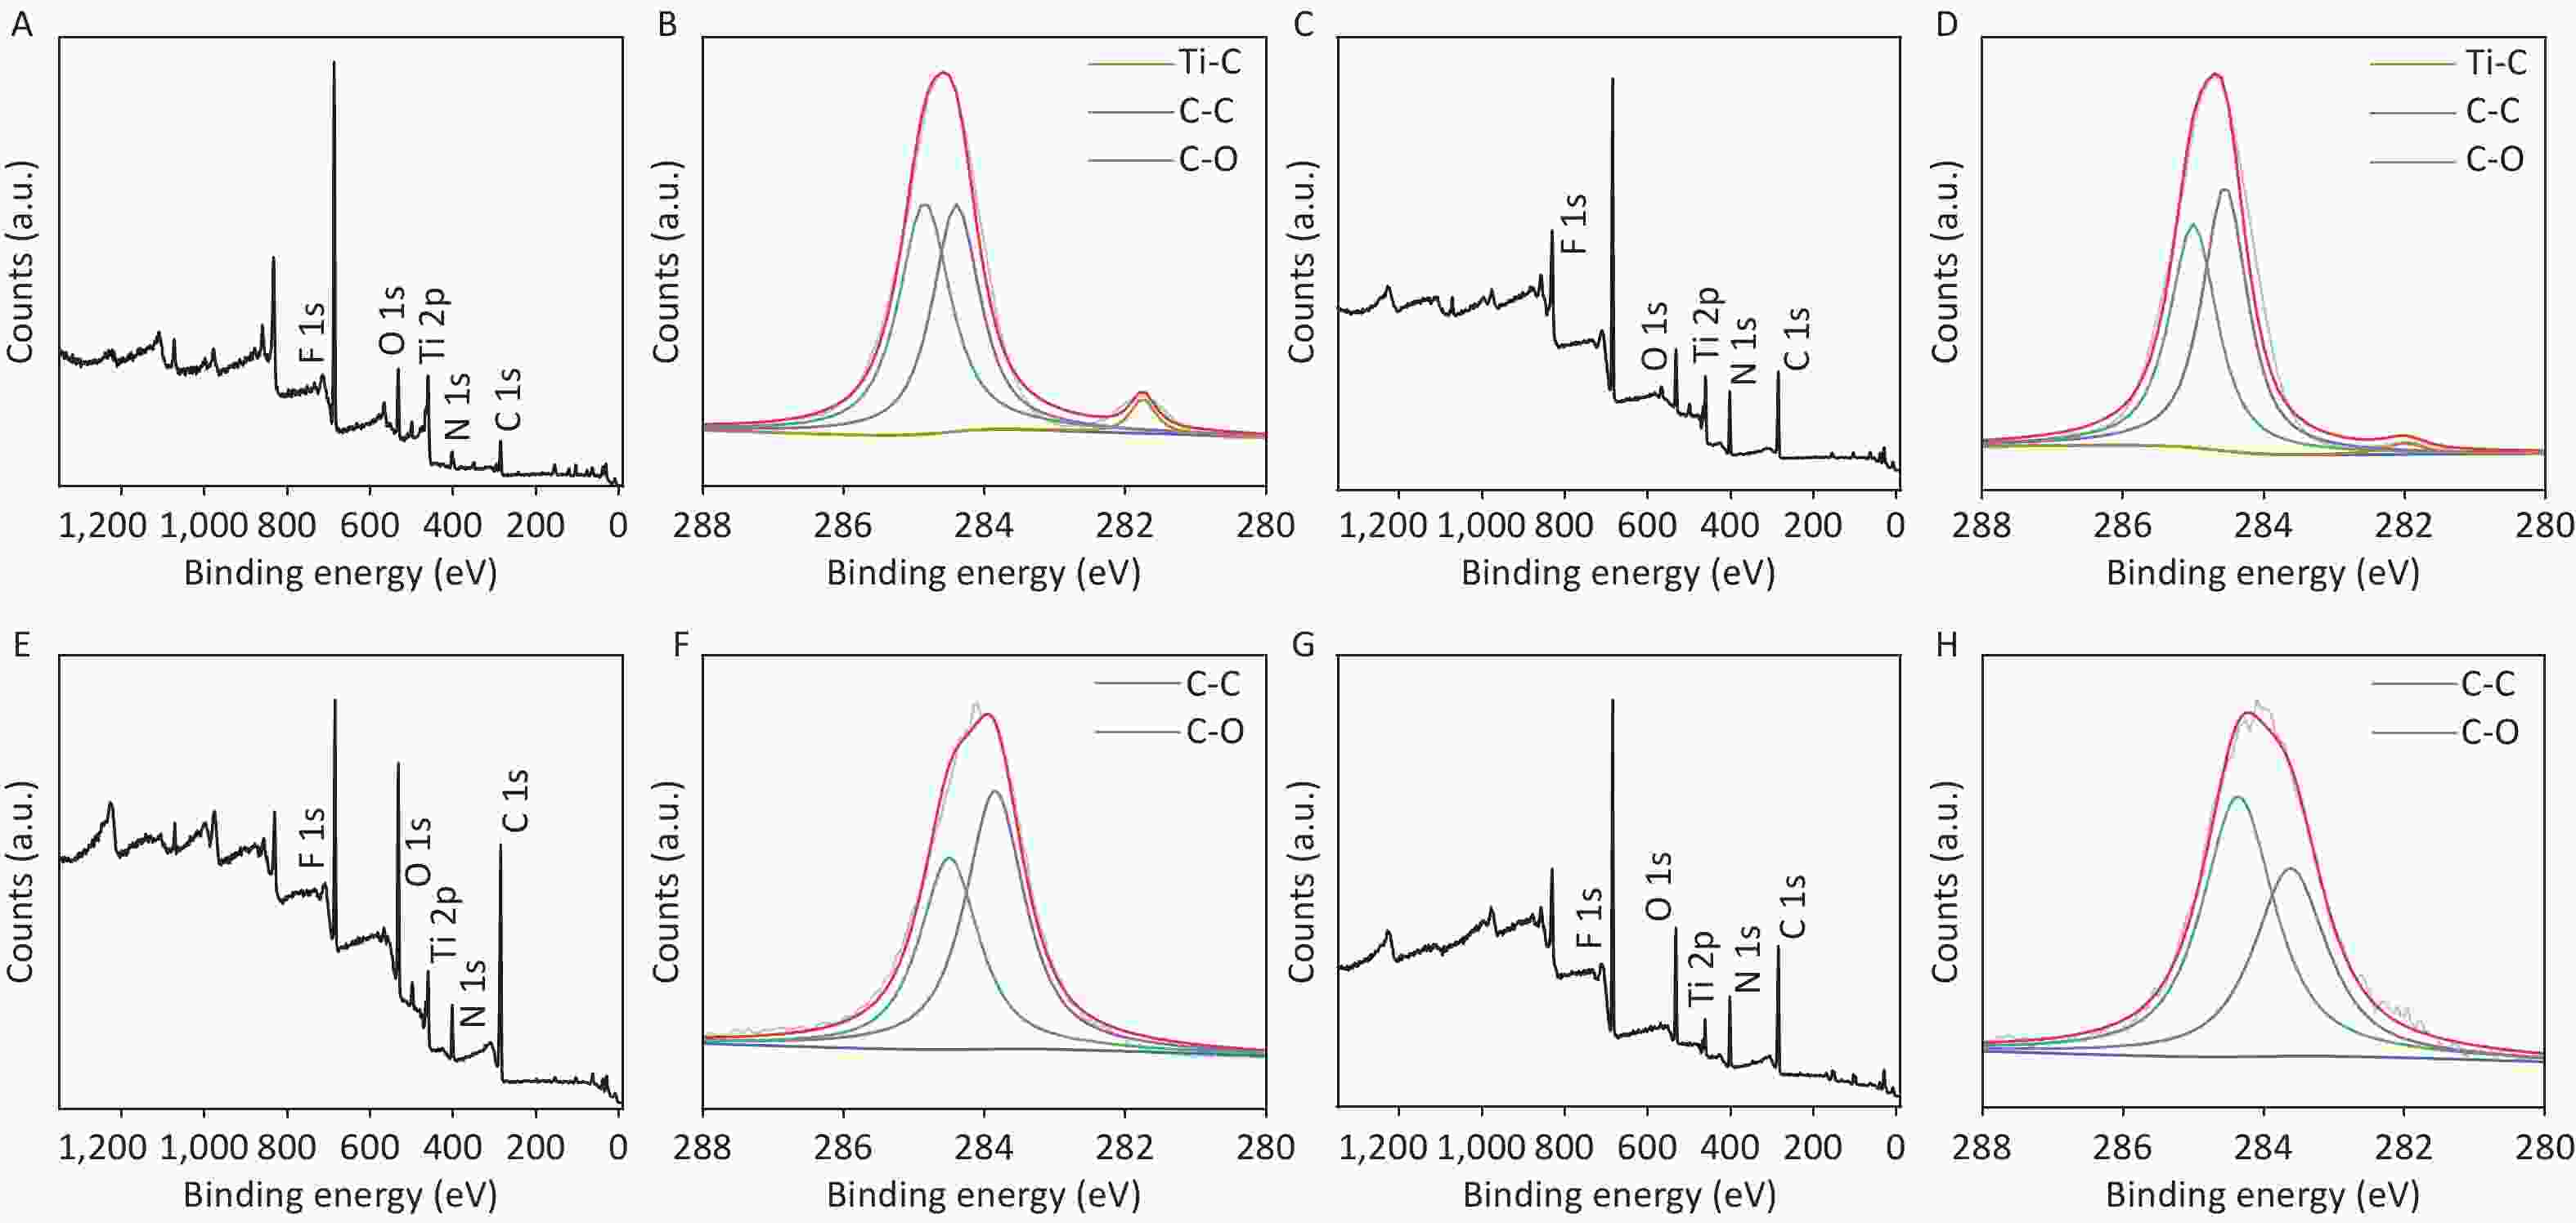
Figure S6. The survey XPS spectra (A, C, E, and G) and the narrow scan spectra of C 1 s (B, D, E, and H) of the CDCs-NH4HF2-6h, CDCs-NH4HF2-10h, CDCs-NH4HF2-16h, and CDCs-NH4HF2-20h, respectively.
Table S2. XPS peak fitting results for CDCs-NH4HF2-6h, CDCs-NH4HF2-10h, CDCs-NH4HF2-16h, and CDCs-NH4HF2-20h
CDCs-NH4HF2-6h CDCs-NH4HF2-10h CDCs-NH4HF2-16h CDCs-NH4HF2-20h Region BE [eV] BE [eV] BE [eV] BE [eV] Assigned to C 1s 281.75 282 Ti-C 284.40 284.55 284.41 284.30 C-C 284.85 285 285 284.99 C-O Ti 2p 466 466 465.79 465.80 TiO2 464.90 465 C-Ti-Fx 462.90 Ti3+ 460.25 460.30 460.15 460.03 TiO2 459.15 459.40 C-Ti-Fx O 1s 532.60 532.80 532.13 532.10 H2O 531.78 532.10 C-Ti-(OH)x 531 531.60 C-Ti-Ox 530.03 530.90 530.50 531 TiO2 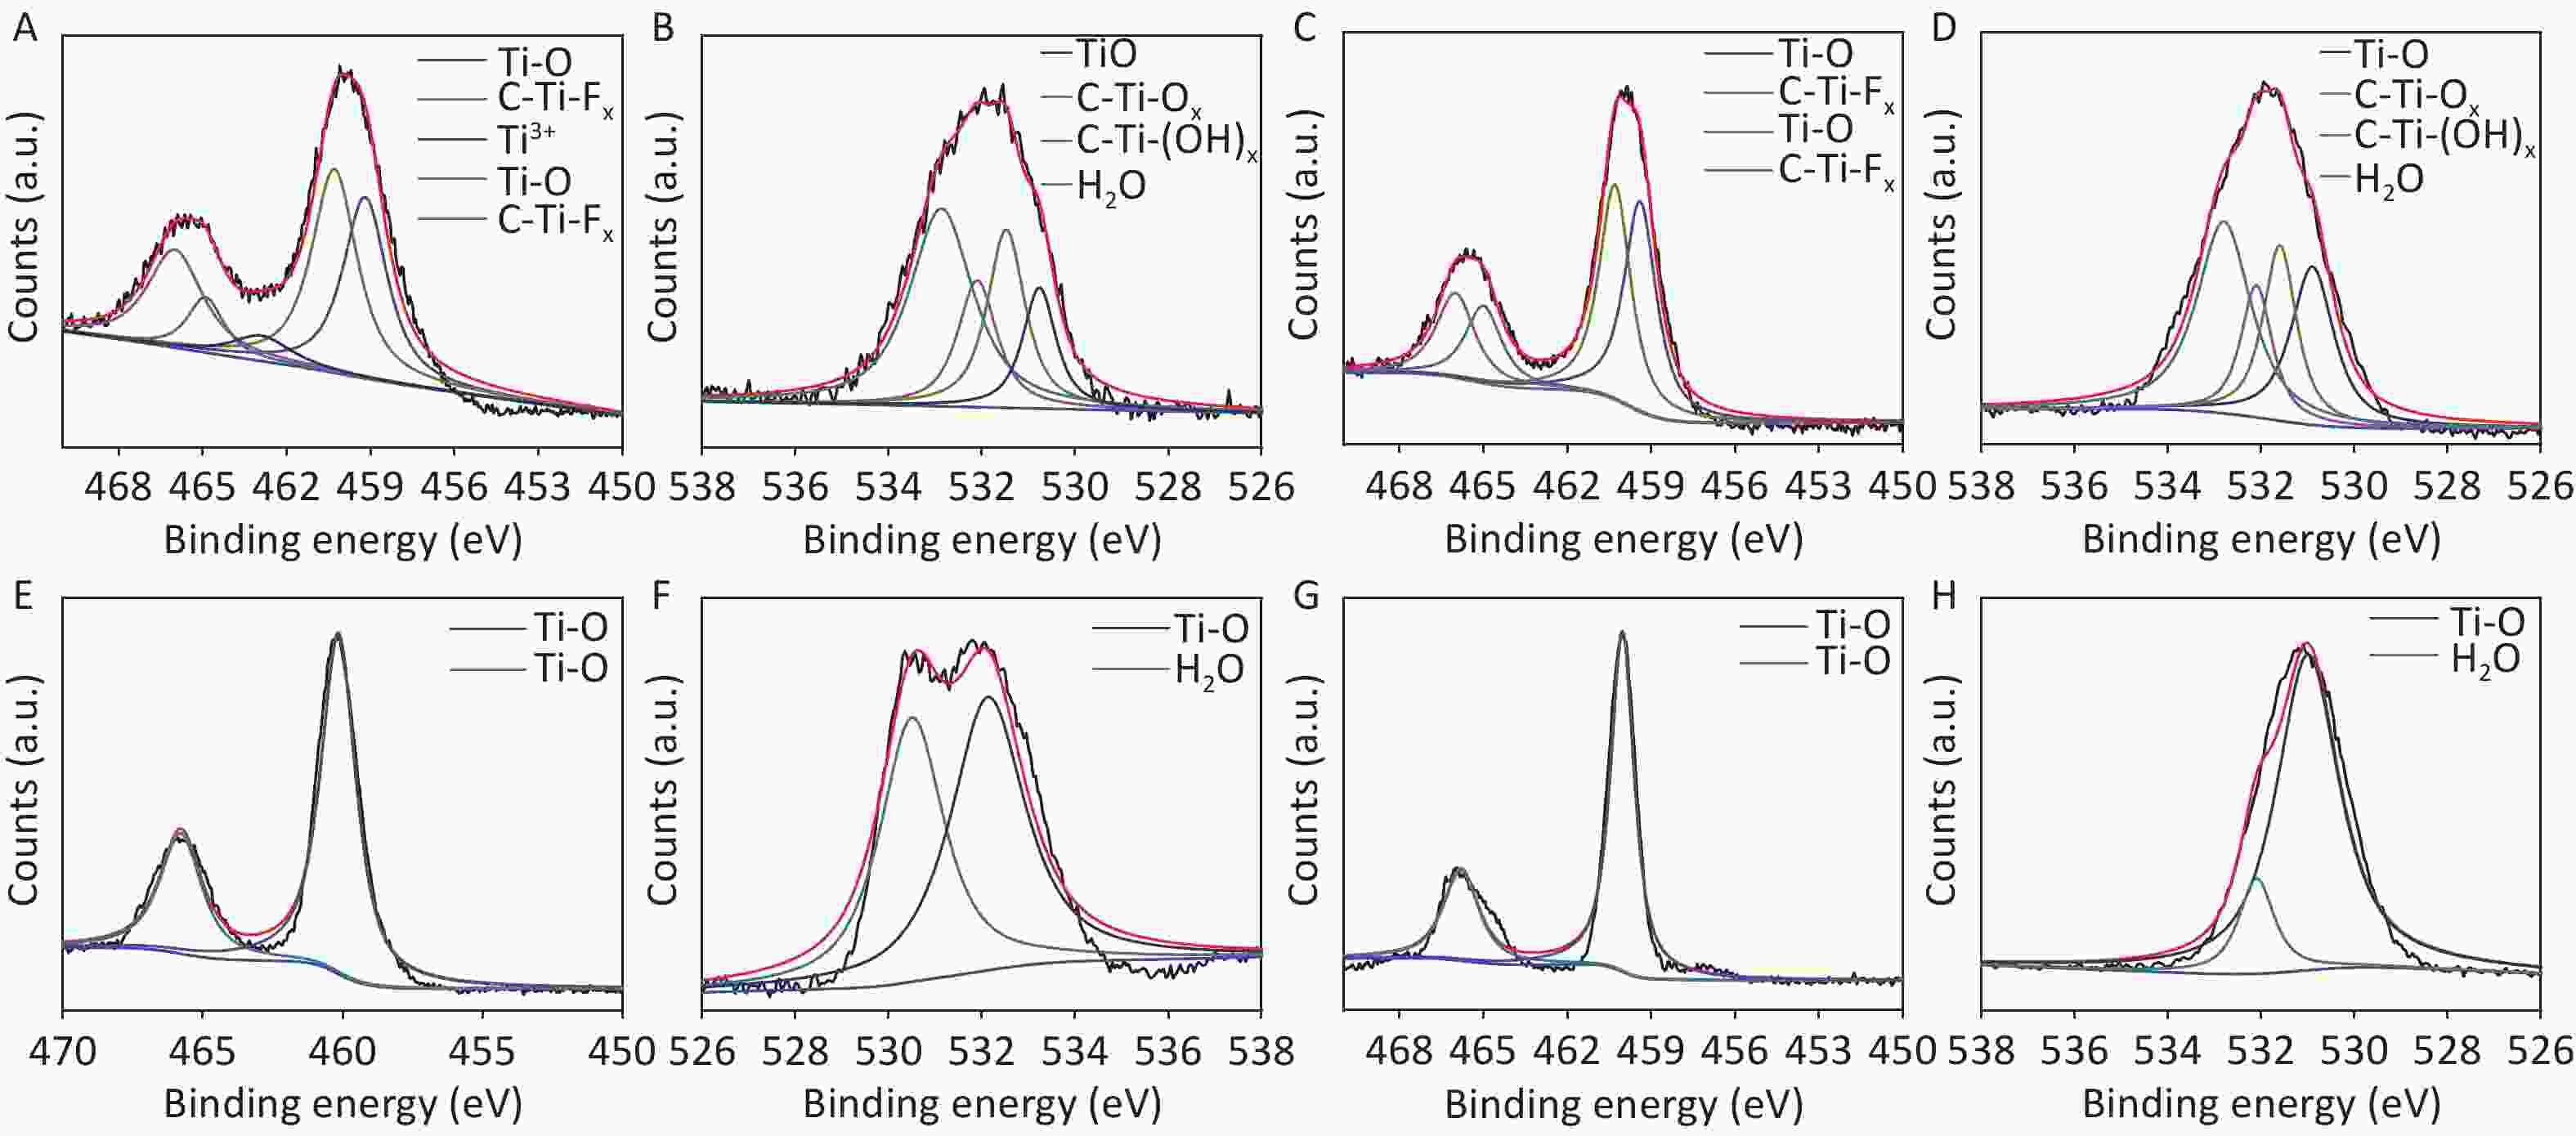
Figure S7. The survey XPS spectra of Ti 2p (A, C, E, and G) and O 1s (B, D, F, and H) of the CDCs-NH4HF2-6h, CDCs-NH4HF2-10h, CDCs-NH4HF2-16h, and CDCs-NH4HF2-20h, respectively.
-
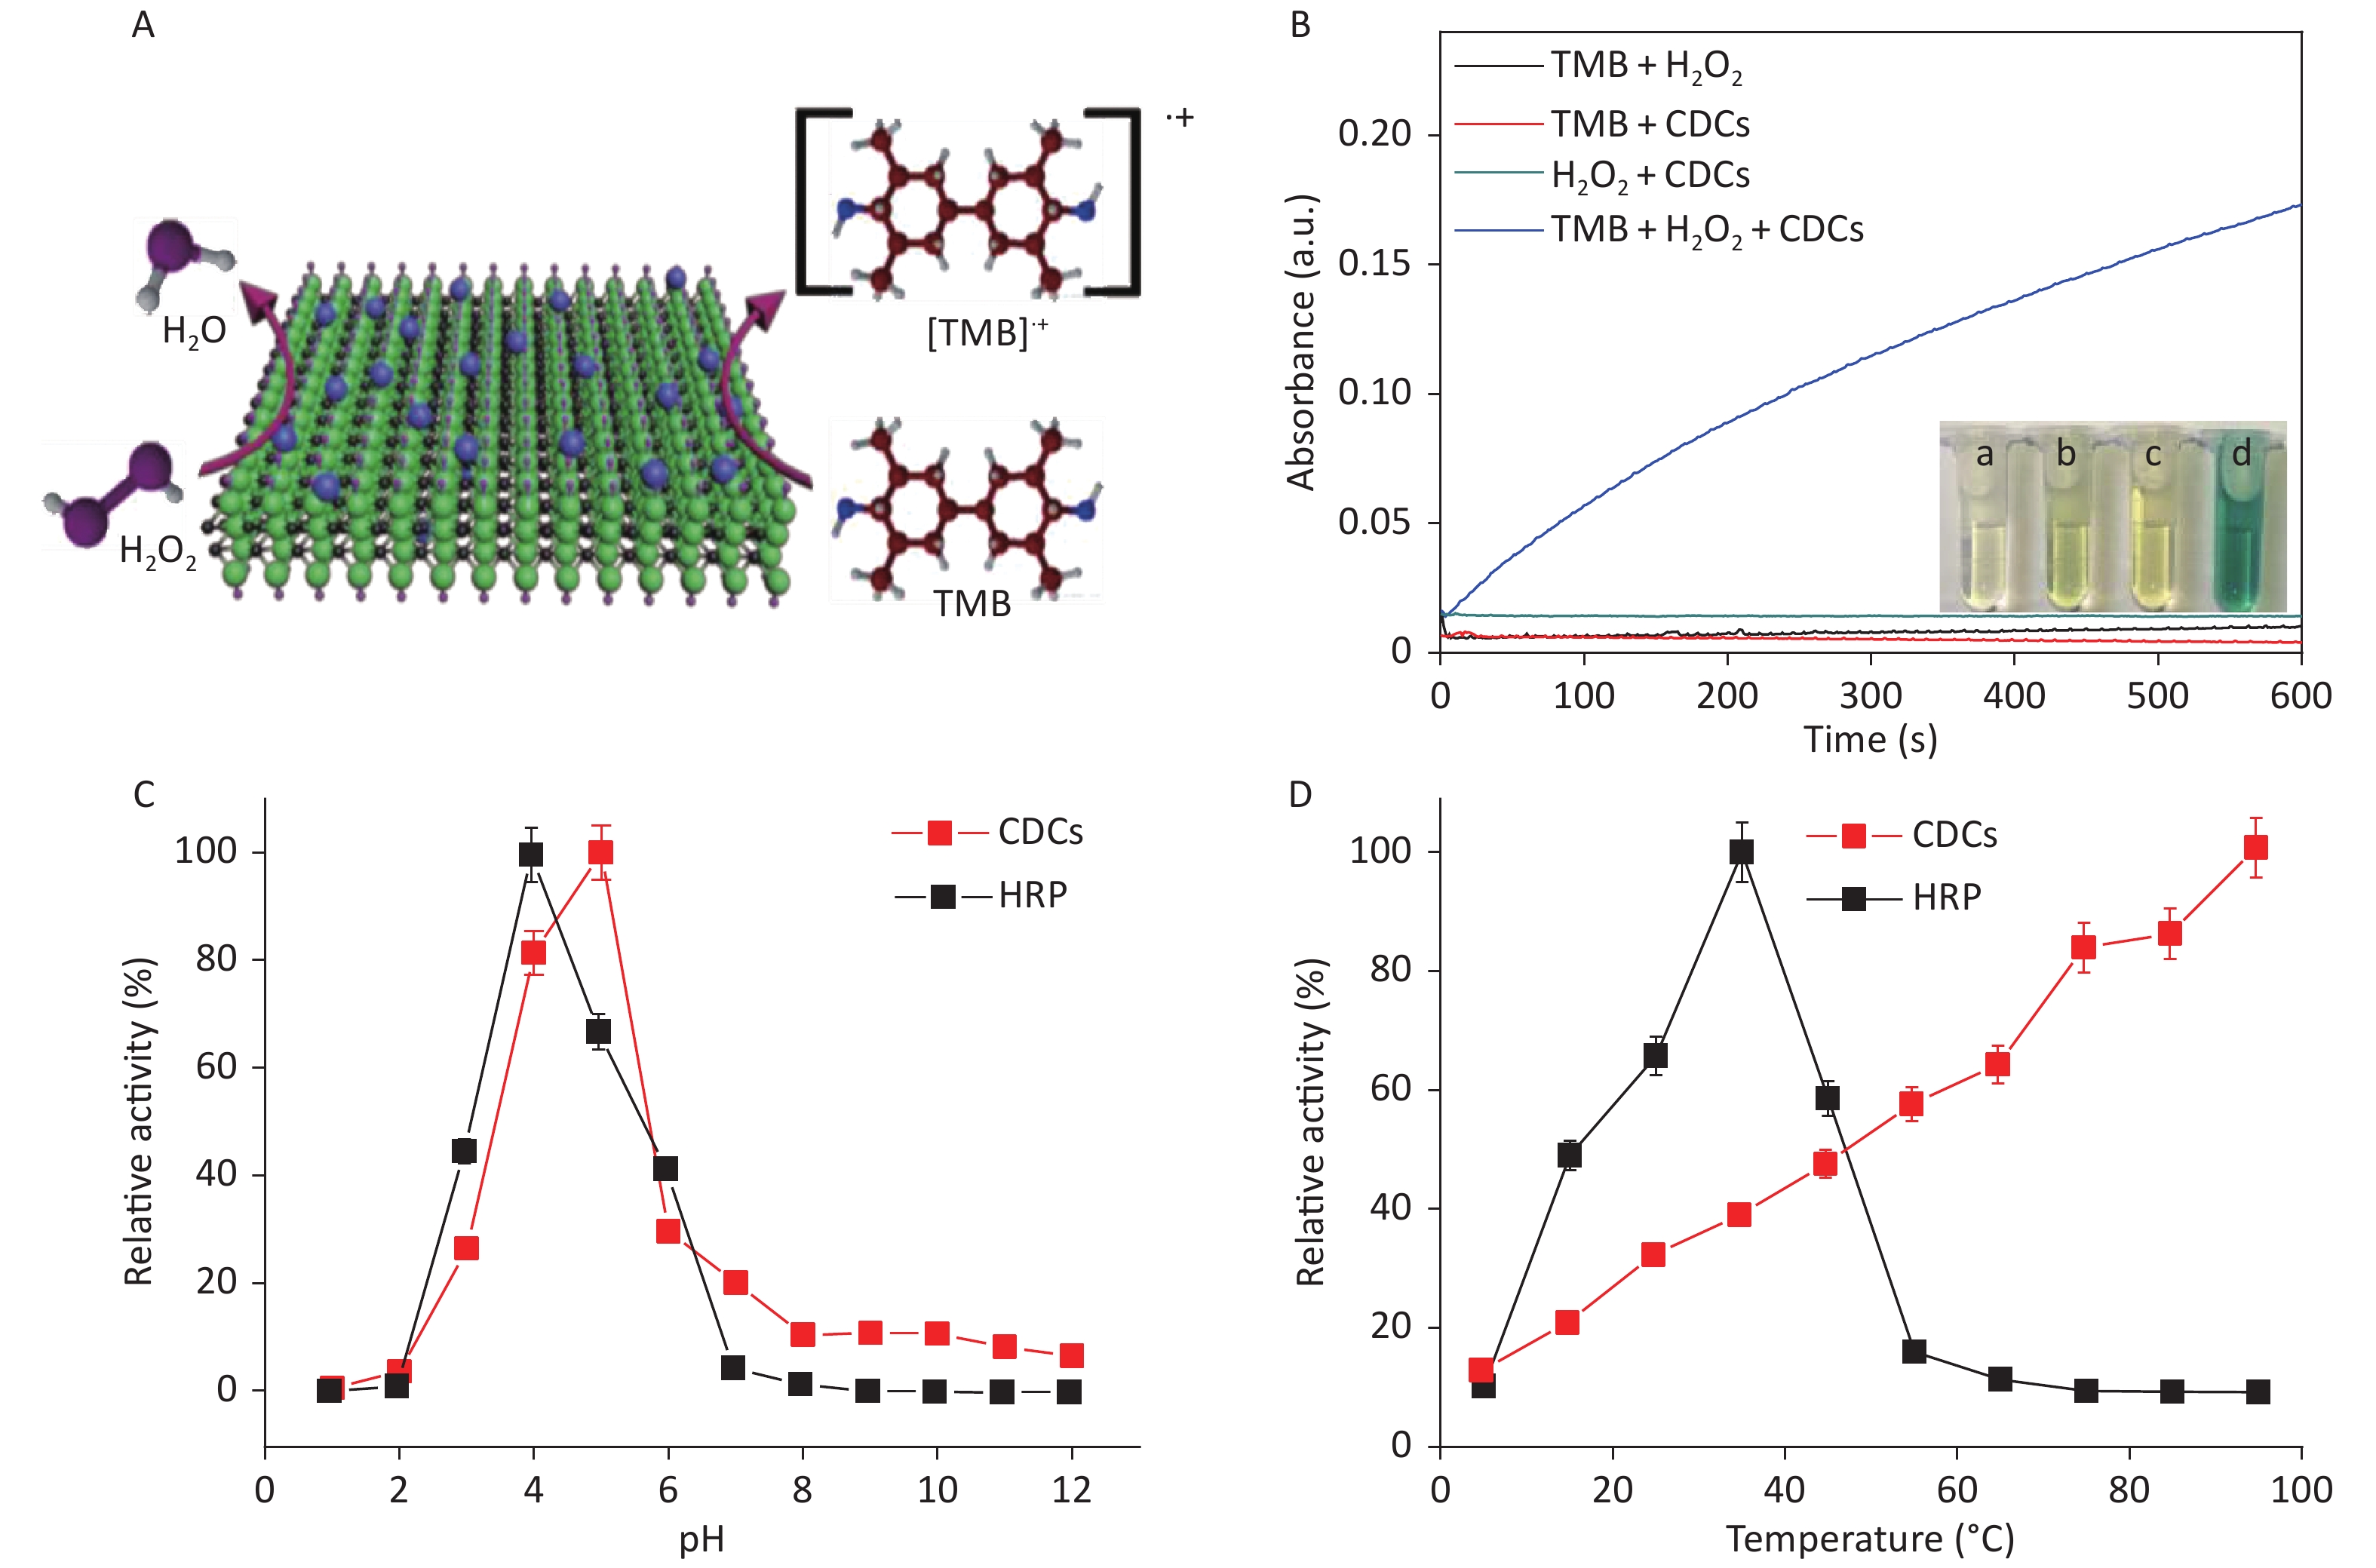
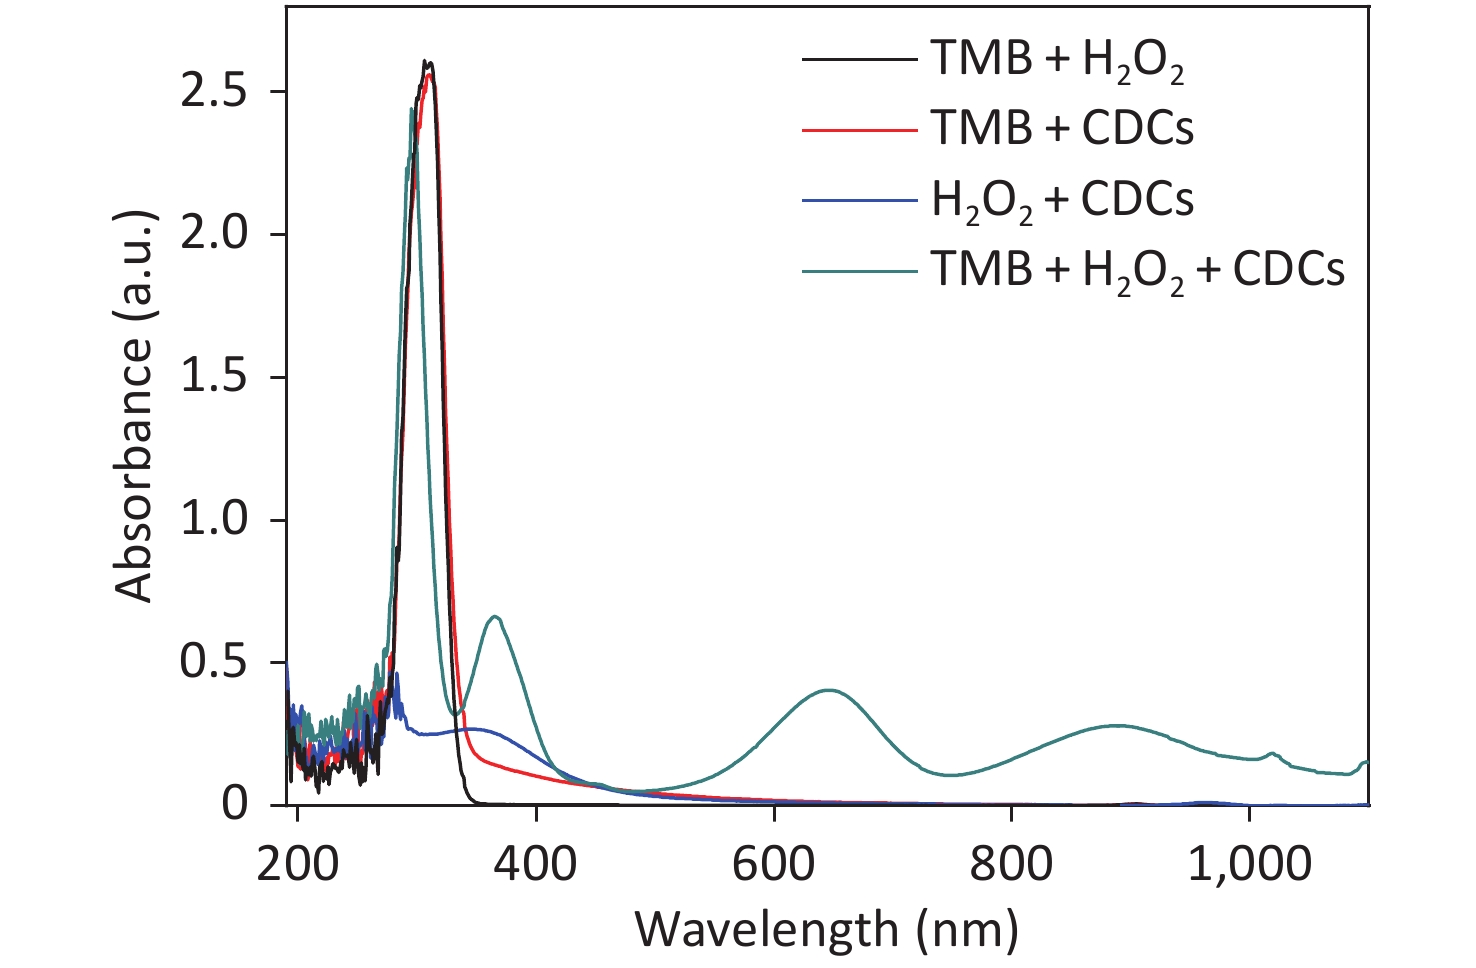
A schematic illustration of CDCs-NH4HF2-16h-catalyzed oxidation of TMB by H2O2 is shown in Figure 4A. The intrinsic peroxidase mimetic activity of CDCs-NH4HF2-16h was studied using TMB as a chromogenic substrate for H2O2. In the absence of CDCs-NH4HF2-16h, the solution of TMB and H2O2 was colorless. This phenomenon was also observed for either TMB or H2O2 alone with CDCs-NH4HF2-16h. However, in the presence of CDCs-NH4HF2-16h, TMB reacts with H2O2 to generate TMB•+, which showed a characteristic absorption peak at 652 nm (Supplementary Figure S8, available in www.besjournal.com). An obvious TMB•+ absorbance peak was observed for the system containing CDCs-NH4HF2-16h, H2O2, and TMB (Figure 4B). Photographs of the different systems are shown in the inset of Figure 4B, which confirmed the intrinsic peroxidase-like activity of CDCs-NH4HF2-16h. The pH and temperature tolerance of the peroxidase-like behavior of CDCs-NH4HF2-16h and HRP were compared at various temperatures (5–95 °C) and different pHs (1−12). The optimal pH of CDCs-NH4HF2-16h was 5.0, which was similar to the value (pH 4.0) for HRP (Figure 4C). As shown in Figure 4D, the optimal temperature for HRP was 35 °C. The catalytic performance decayed at either increasing or decreasing temperatures. In contrast, the catalytic activity of CDCs-NH4HF2-16h increased with increasing temperature (even up to 95 °C), indicating its thermal stability.

Figure 4. (A) Schematic illustration of CDCs-NH4HF2-16h catalyzing the oxidation of TMB in the presence of H2O2. (B) Time-dependent absorbance changes at 652 nm of TMB in different reaction systems in 50 mM NaAc (pH = 5) at room temperature. The inset in (B) shows the corresponding photographs: (a) a mixture of TMB and H2O2 in the absence of CDCs, (b) a mixture of TMB and CDCs in the absence of H2O2, (c) a mixture of CDCs and H2O2 in the absence of TMB, and (d) a mixture of TMB, H2O2, and CDCs. The (C) pH dependence and (D) temperature dependence of the peroxidase-like activity of nanosheets and HRP in 50 mmol/L NaAc. The H2O2 and TMB concentration were 50 mmol/L and 1 mg/mL, respectively.
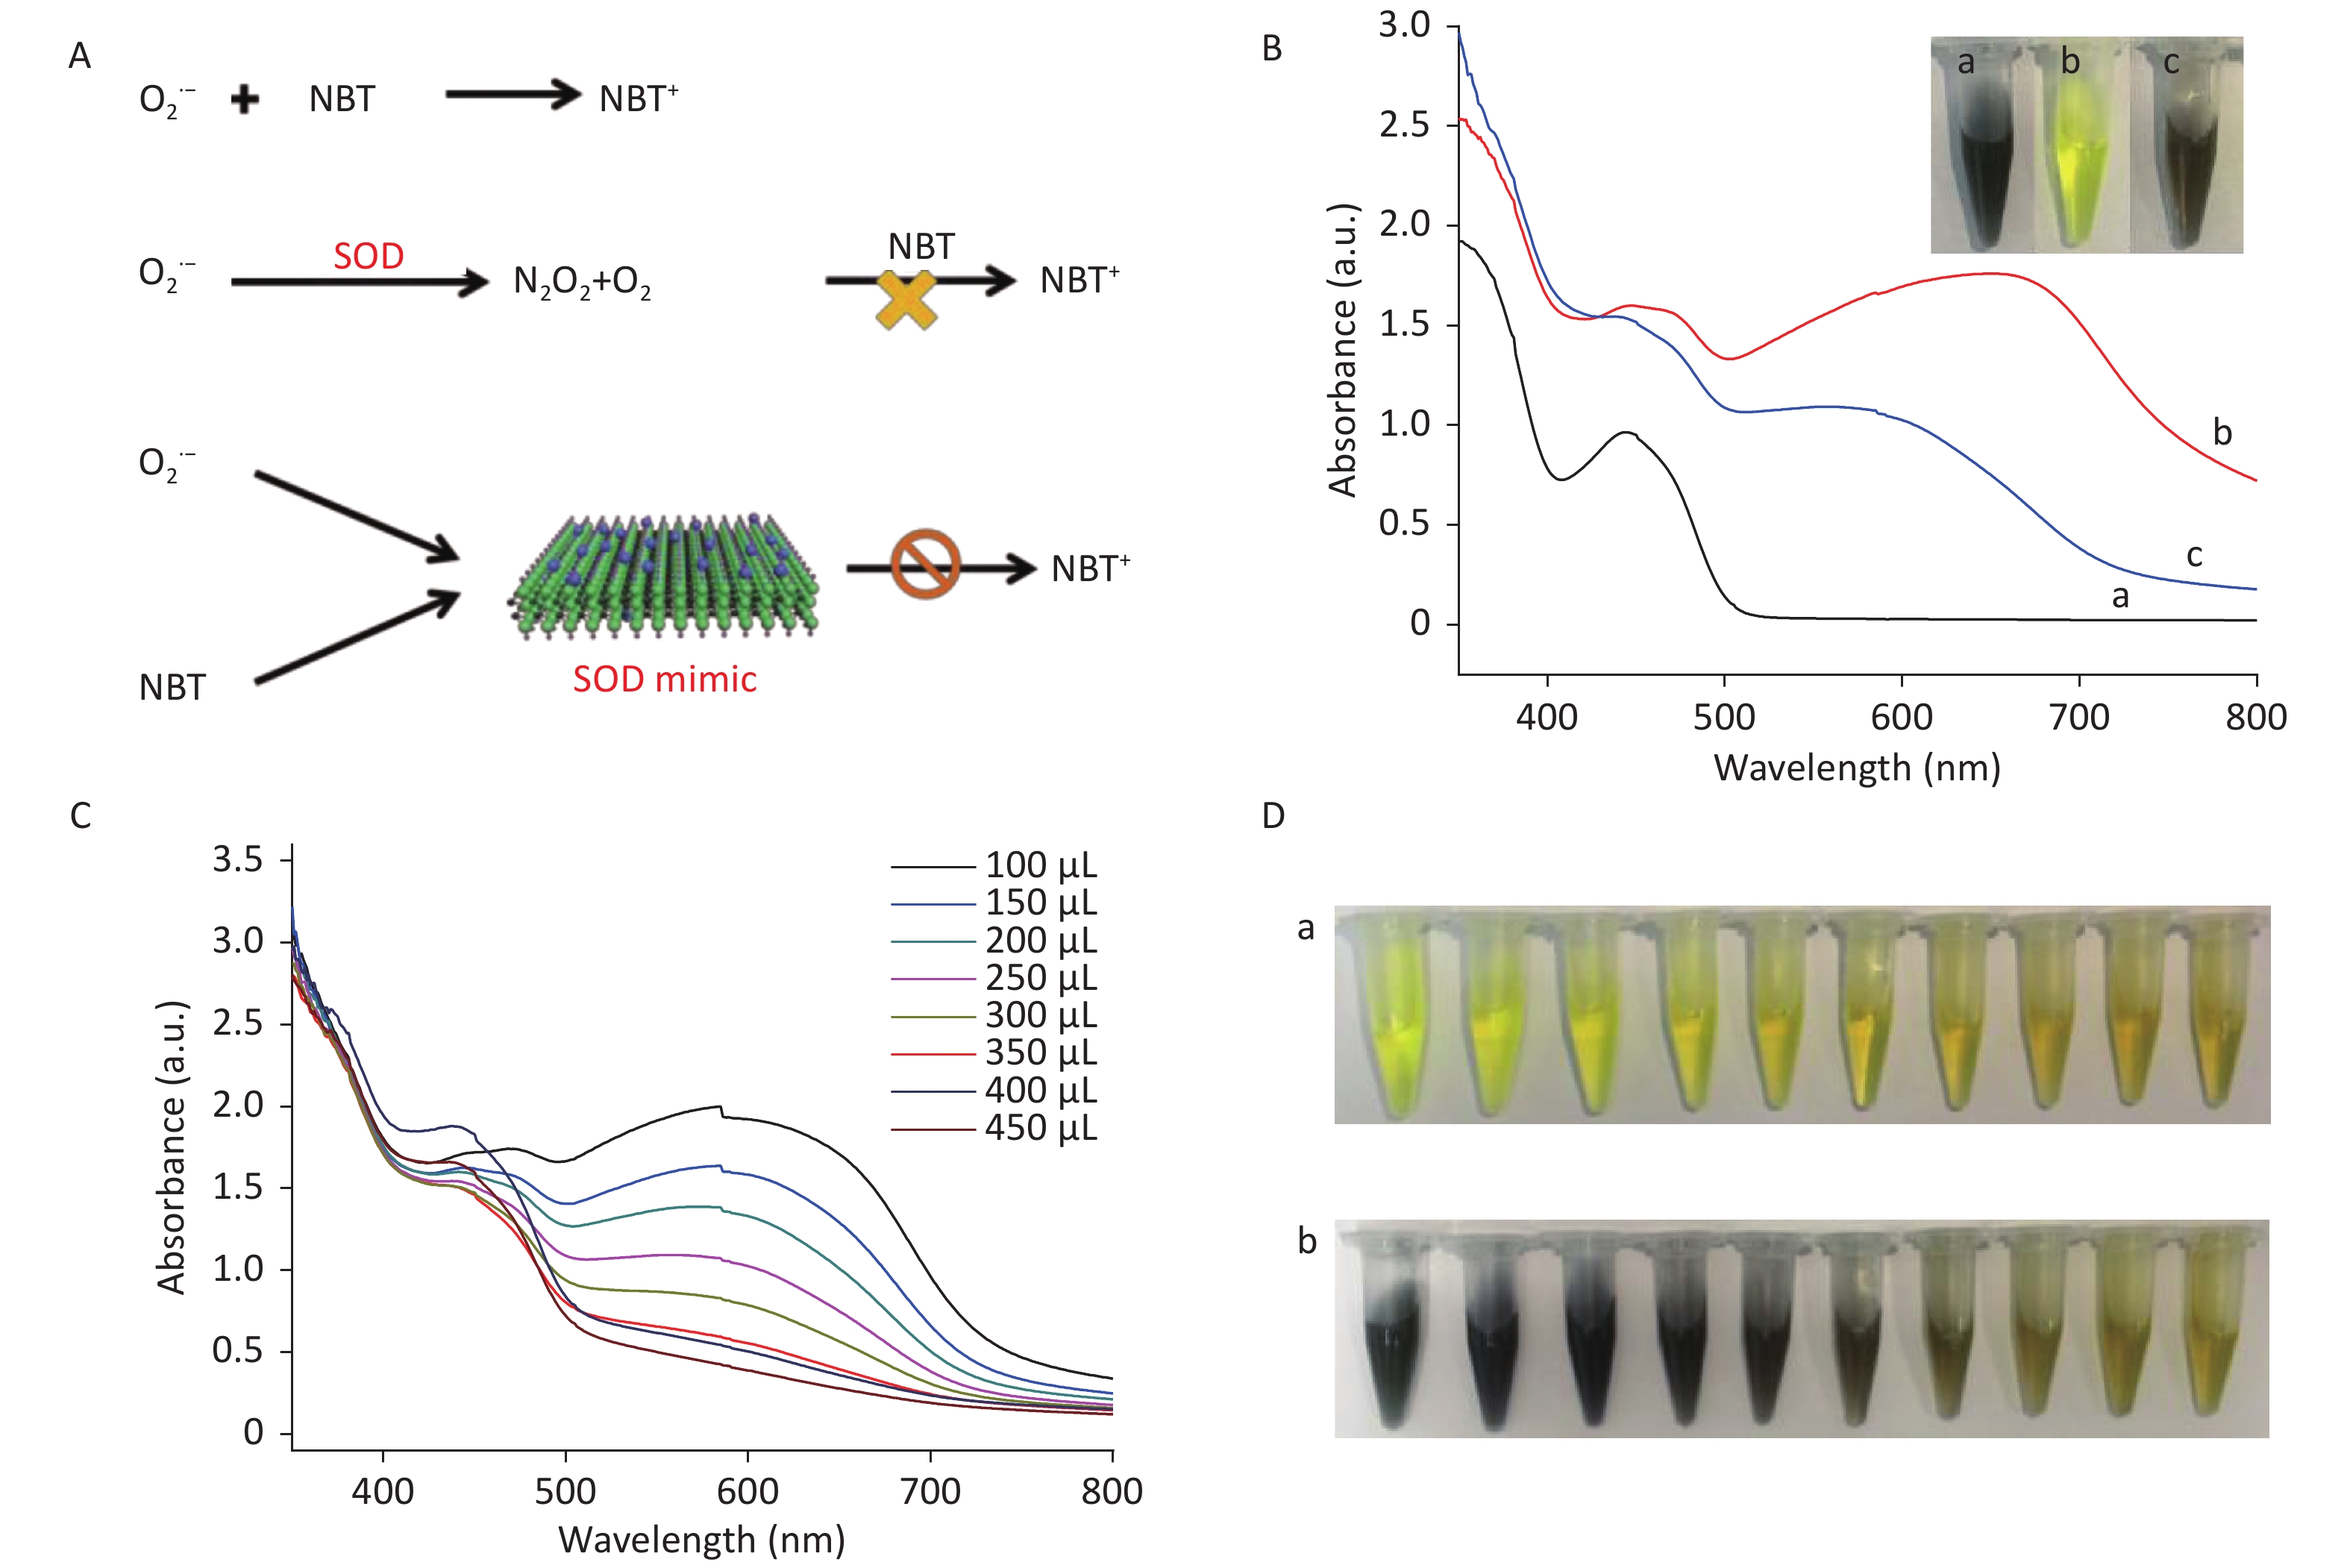
To study the SOD-like activity of CDCs, e.g., CDCs-NH4HF2-16h, the decrease of superoxide anion radicals (O2•-) and the increase of H2O2 and O2 were measured. SOD strongly enhances the disproportionation of O2•- into H2O2 and O2 and thus inhibits the reduction of NBT via the mediation of O2•- (Figure 5A). As shown in Figure 5B, no fluorescence signal was obtained without UV irradiation in the presence of riboflavin, methionine, and NBT (curve a). Upon UV irradiation, the fluorescence signal sharply increased, indicating a high level of O2•- (curve b)[4]. After addition of CDCs-NH4HF2-16h, the fluorescence signal decreased dramatically, which confirmed that CDCs-NH4HF2-16h possessed SOD-like activity and could remove O2•- (curve c). As seen in Figure 5C, the fluorescence of the reaction system decreased with increasing CDCs-NH4HF2-16h concentration, which indicated that the scavenging efficiency of O2•- was directly proportional to the amount of CDCs-NH4HF2-16h.
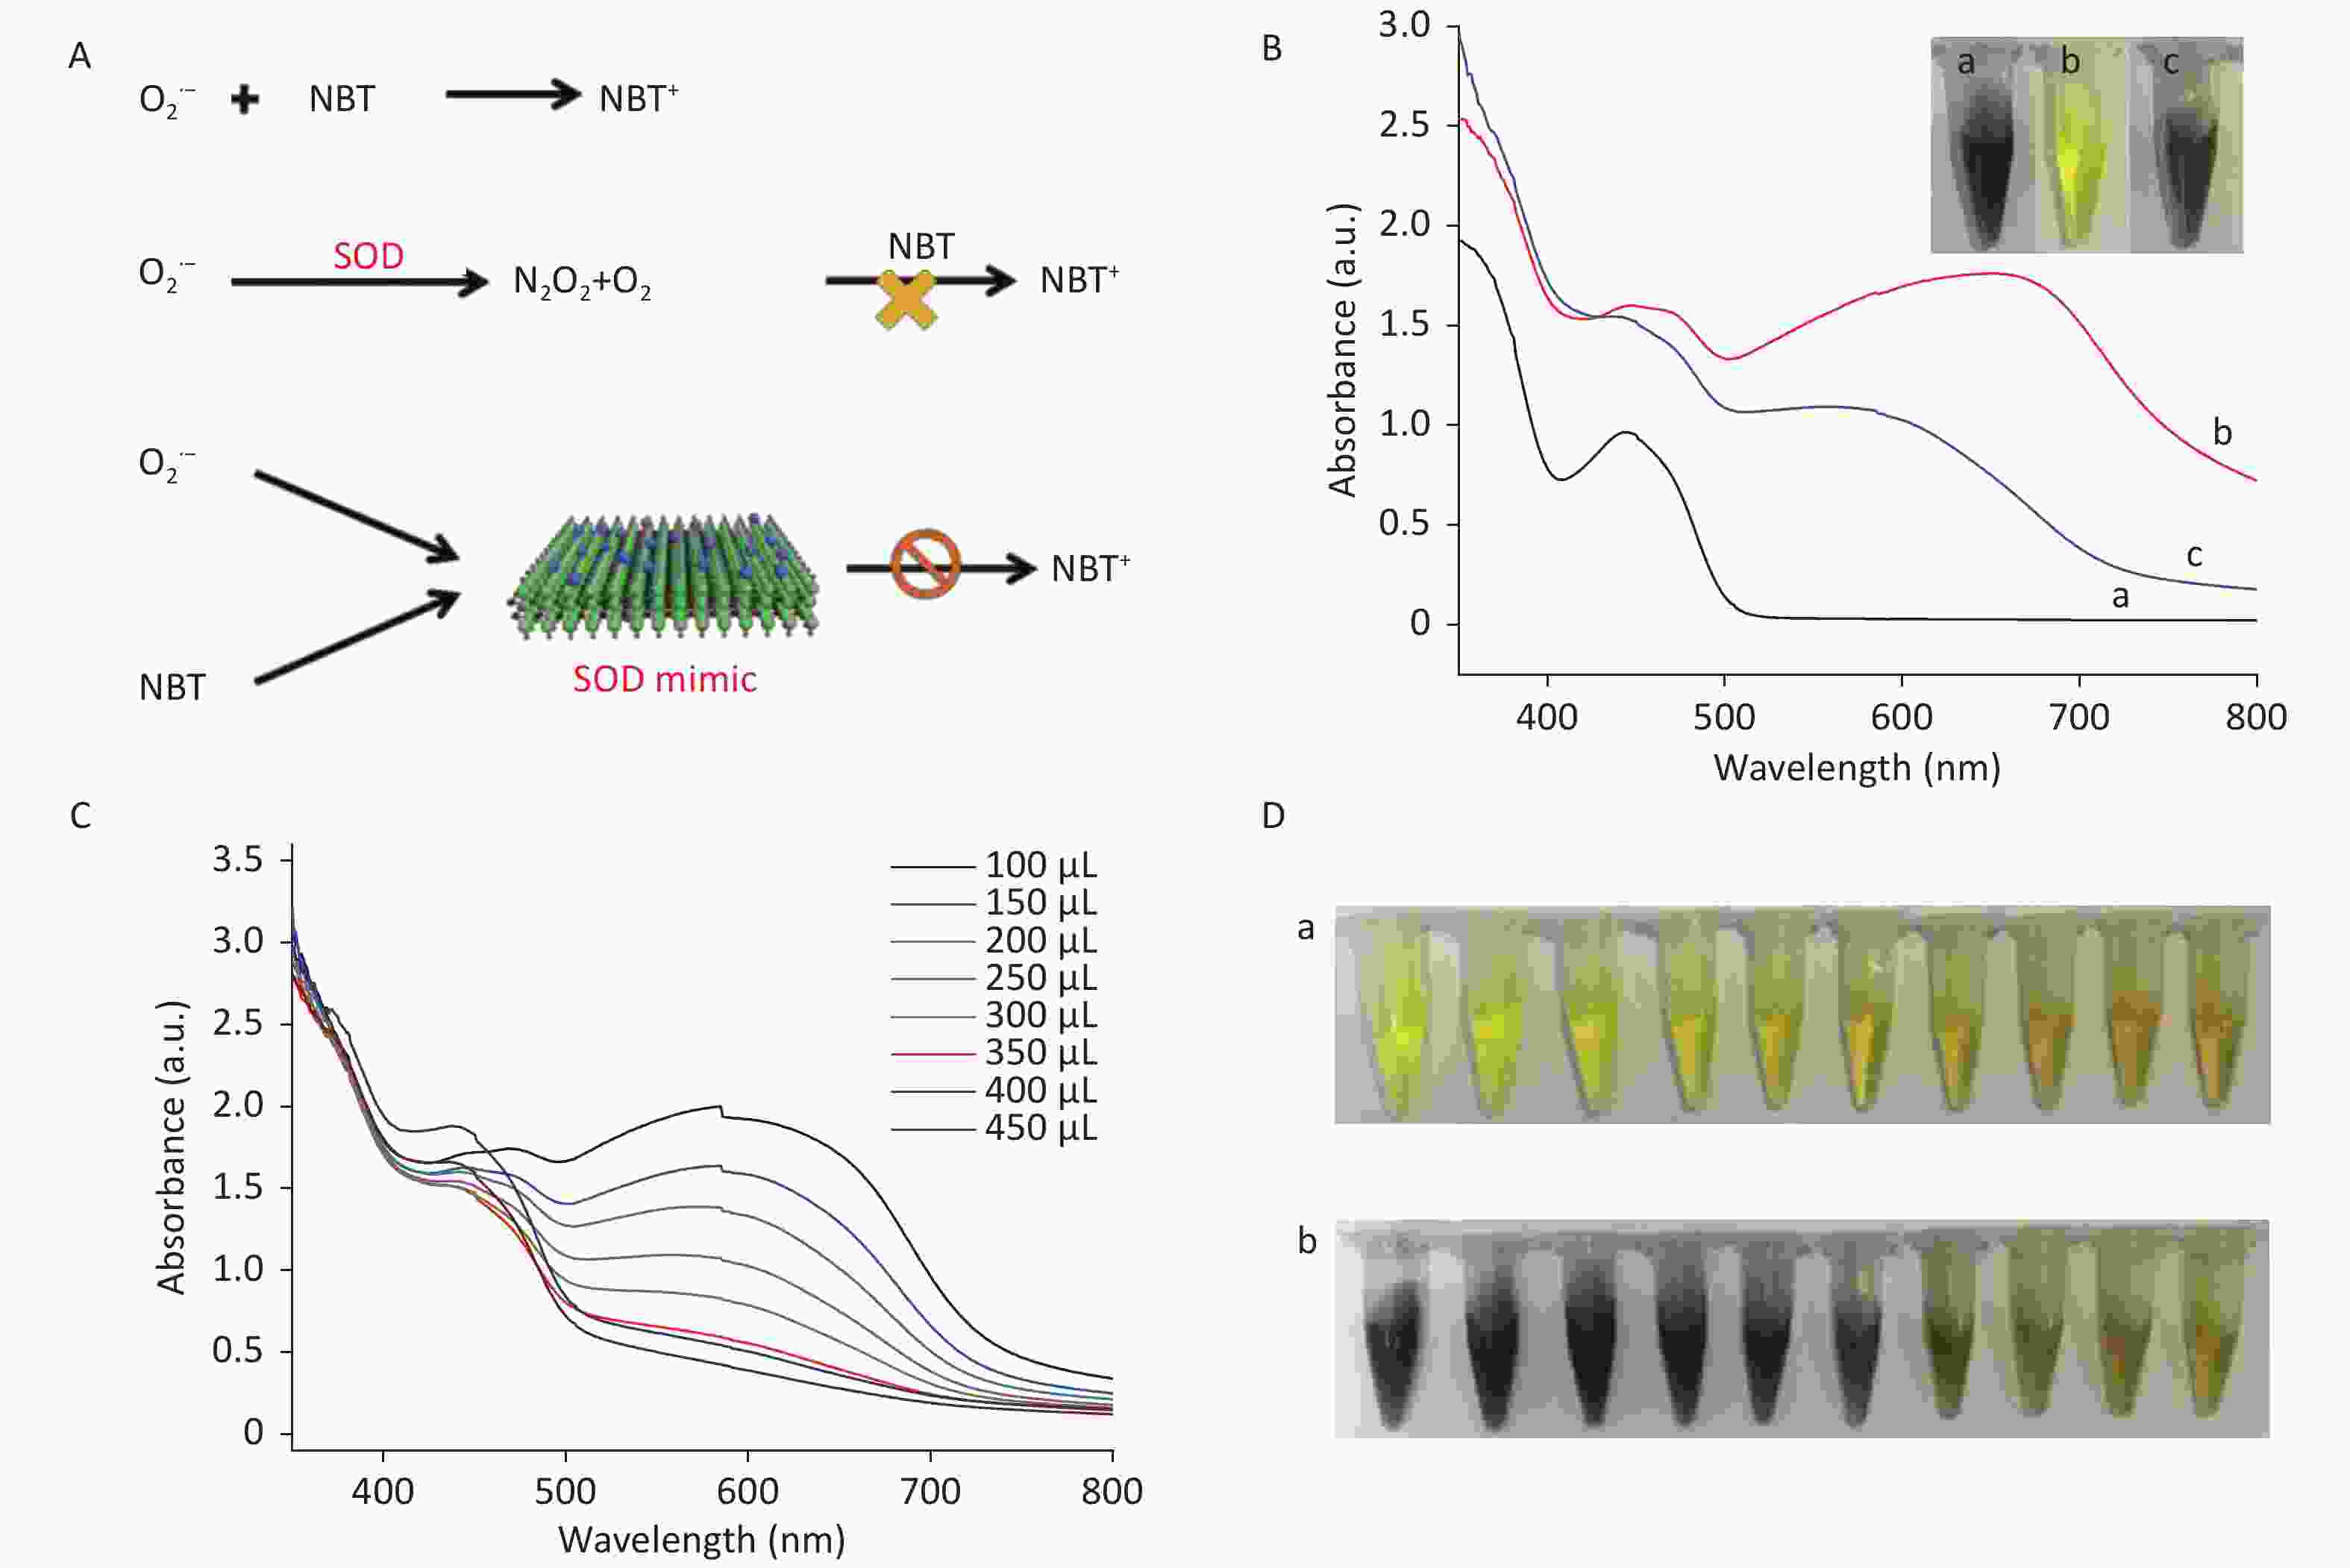
Figure 5. (A) Schematic illustration of the SOD-like activity of CDCs-NH4HF2-16h. (B) Scavenging efficiency of superoxide radicals in different conditions: (a) blank control without ultraviolet radiation, (b) absence, and (c) presence of CDCs-NH4HF2-16h after ultraviolet radiation. Inset shows corresponding photographs. (C) Scavenging efficiency of superoxide radicals with different concentrations of CDCs-NH4HF2-16h. (D) Photographs of the scavenging efficiency of superoxide radicals (a) before and (b) after ultraviolet radiation. The photographs show different volumes of CDCs ranging from 0 to 450 μL (50 μL increments), from left to right.
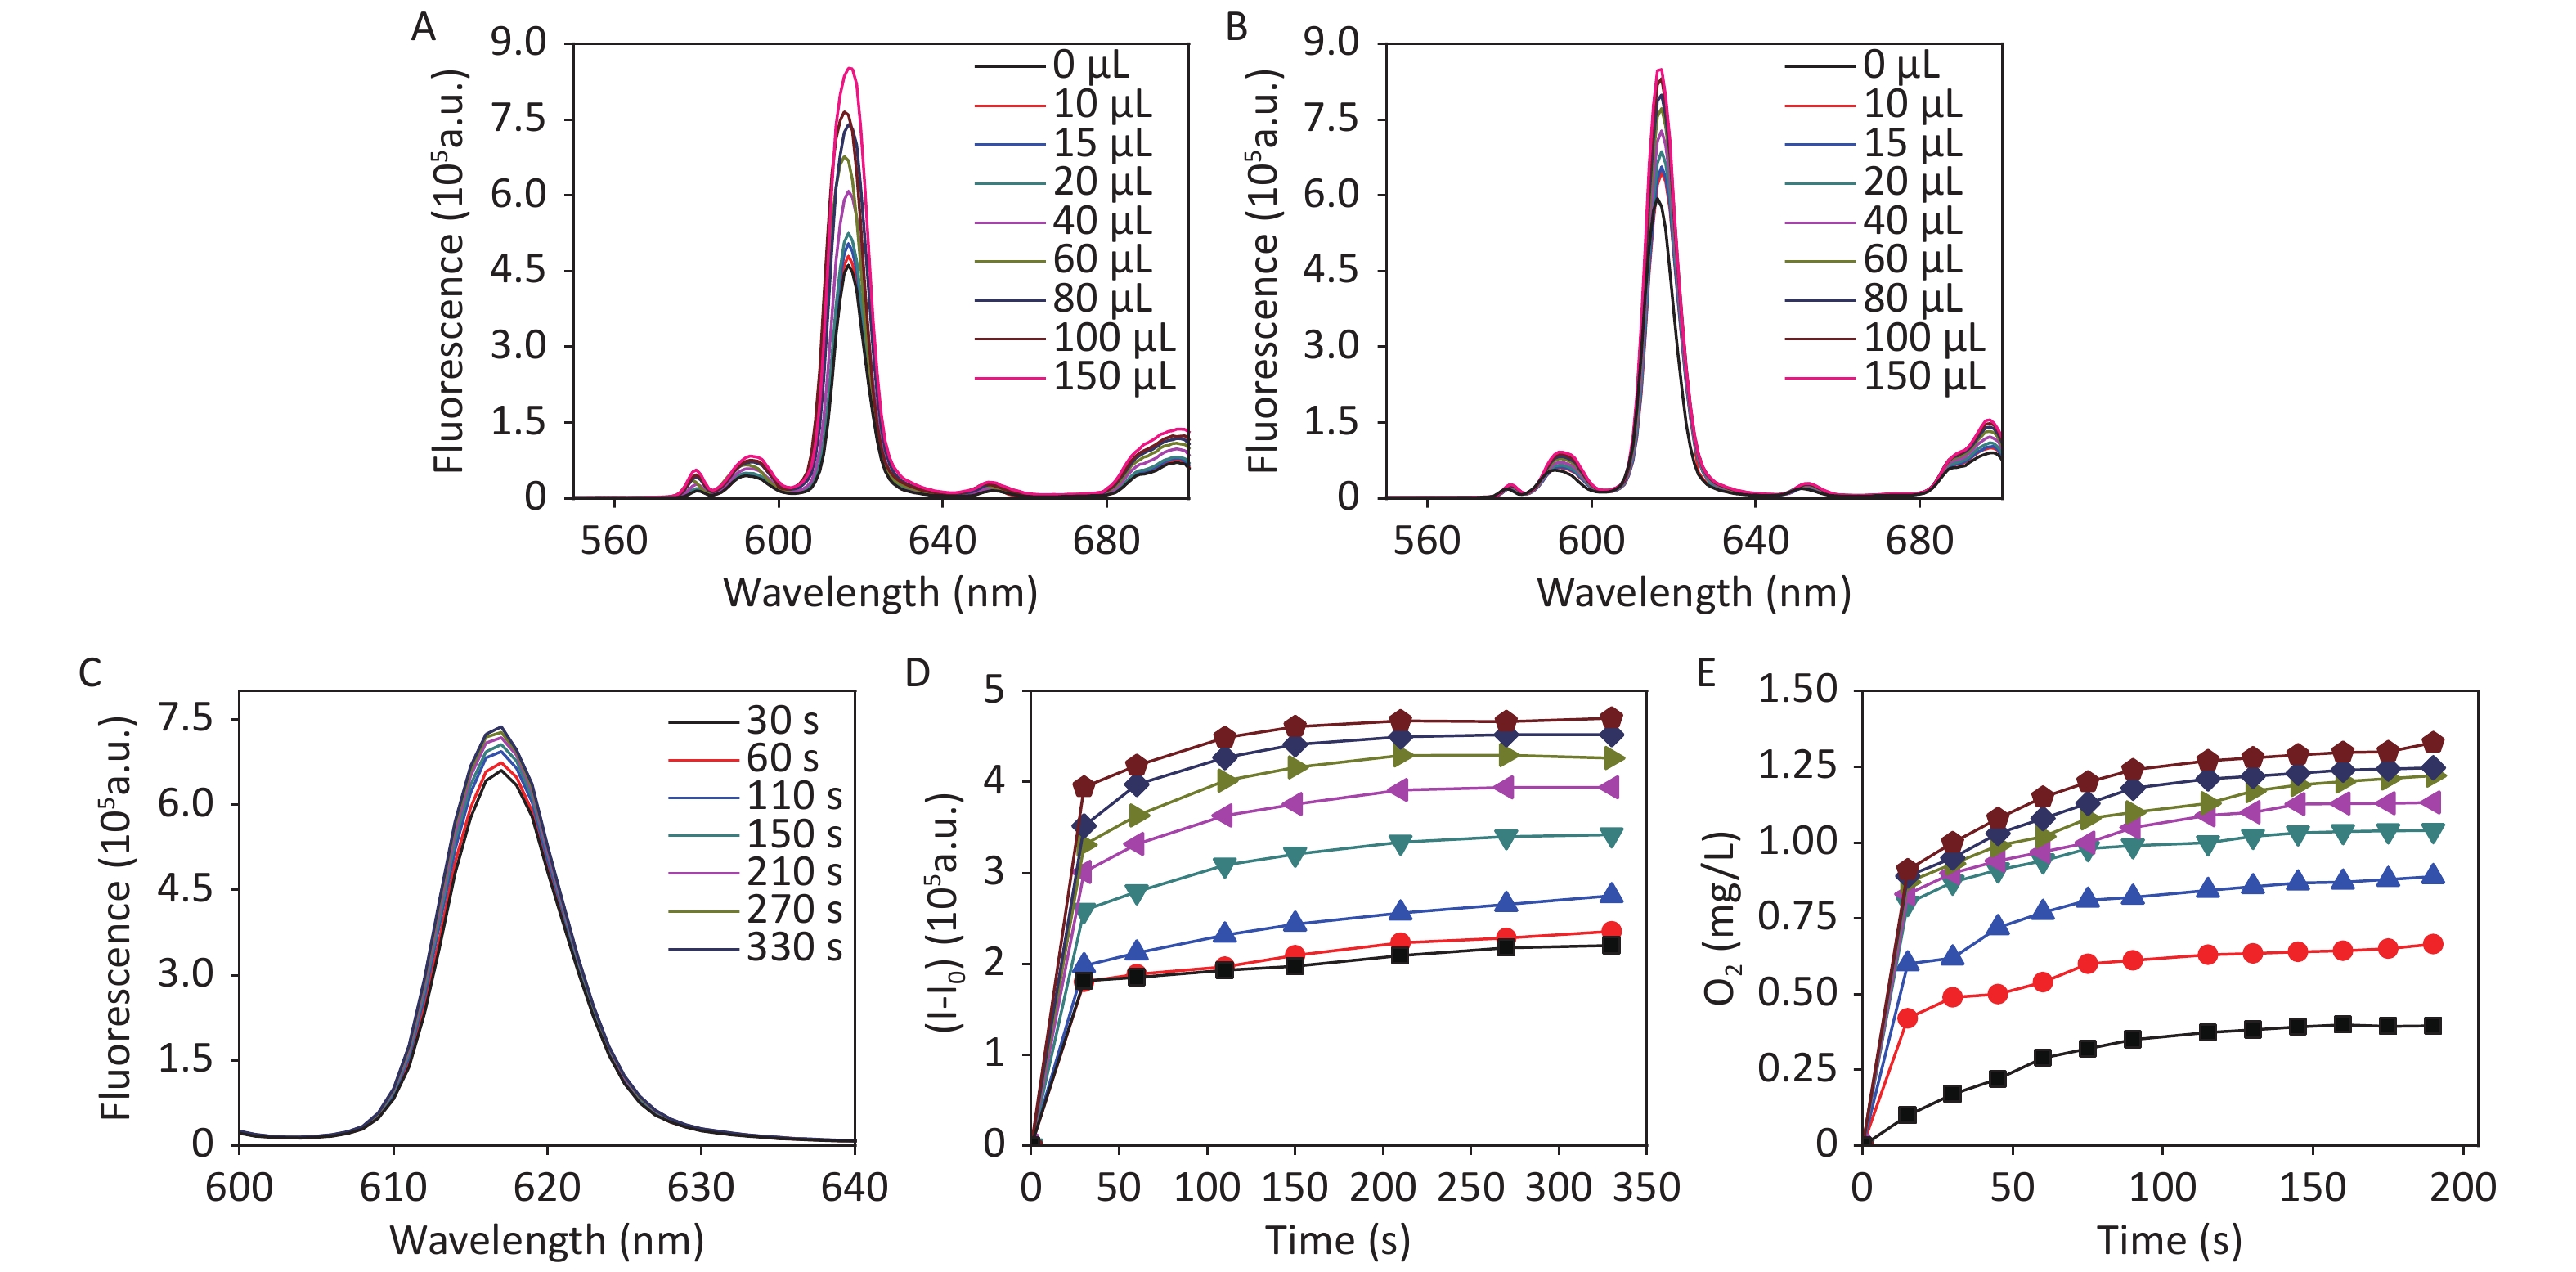
The Eu3+-tetracycline complex (EuTc) is not fluorescent; however, binding with H2O2 forms a fluorescent europium tetracycline hydrogen peroxide complex (EuTc-HP), which results in a strong enhancement in fluorescence intensity[30]. The fluorescence intensity change of EuTc at 620 nm (with λex = 405 nm) was monitored against H2O2 concentration. The fluorescence signal increased with increasing amounts of H2O2 (Supplementary Figure S9A available in www.besjournal.com).

Figure S9. The fluorescence spectra of EuTc solutions in the presence of different volumes of (A) H2O2 and (B) CDCs-NH4HF2-16h in MOPS buffers, respectively. (C) The fluorescence spectra at different times of reaction with 20 μL CDCs-NH4HF2-16h added. (D) The fluorescence intensity changes with the addition of different volumes of CDCs-NH4HF2-16h of 10, 15, 20, 40, 60, 80, 100, 150 μL. (E) The O2 emission catalyzed by CDCs-NH4HF2-16h at different volumes range from 1 mL–8 mL (1 mL as a unit) in solution of 10 mL 50 mmol/L NaAc (pH = 5).
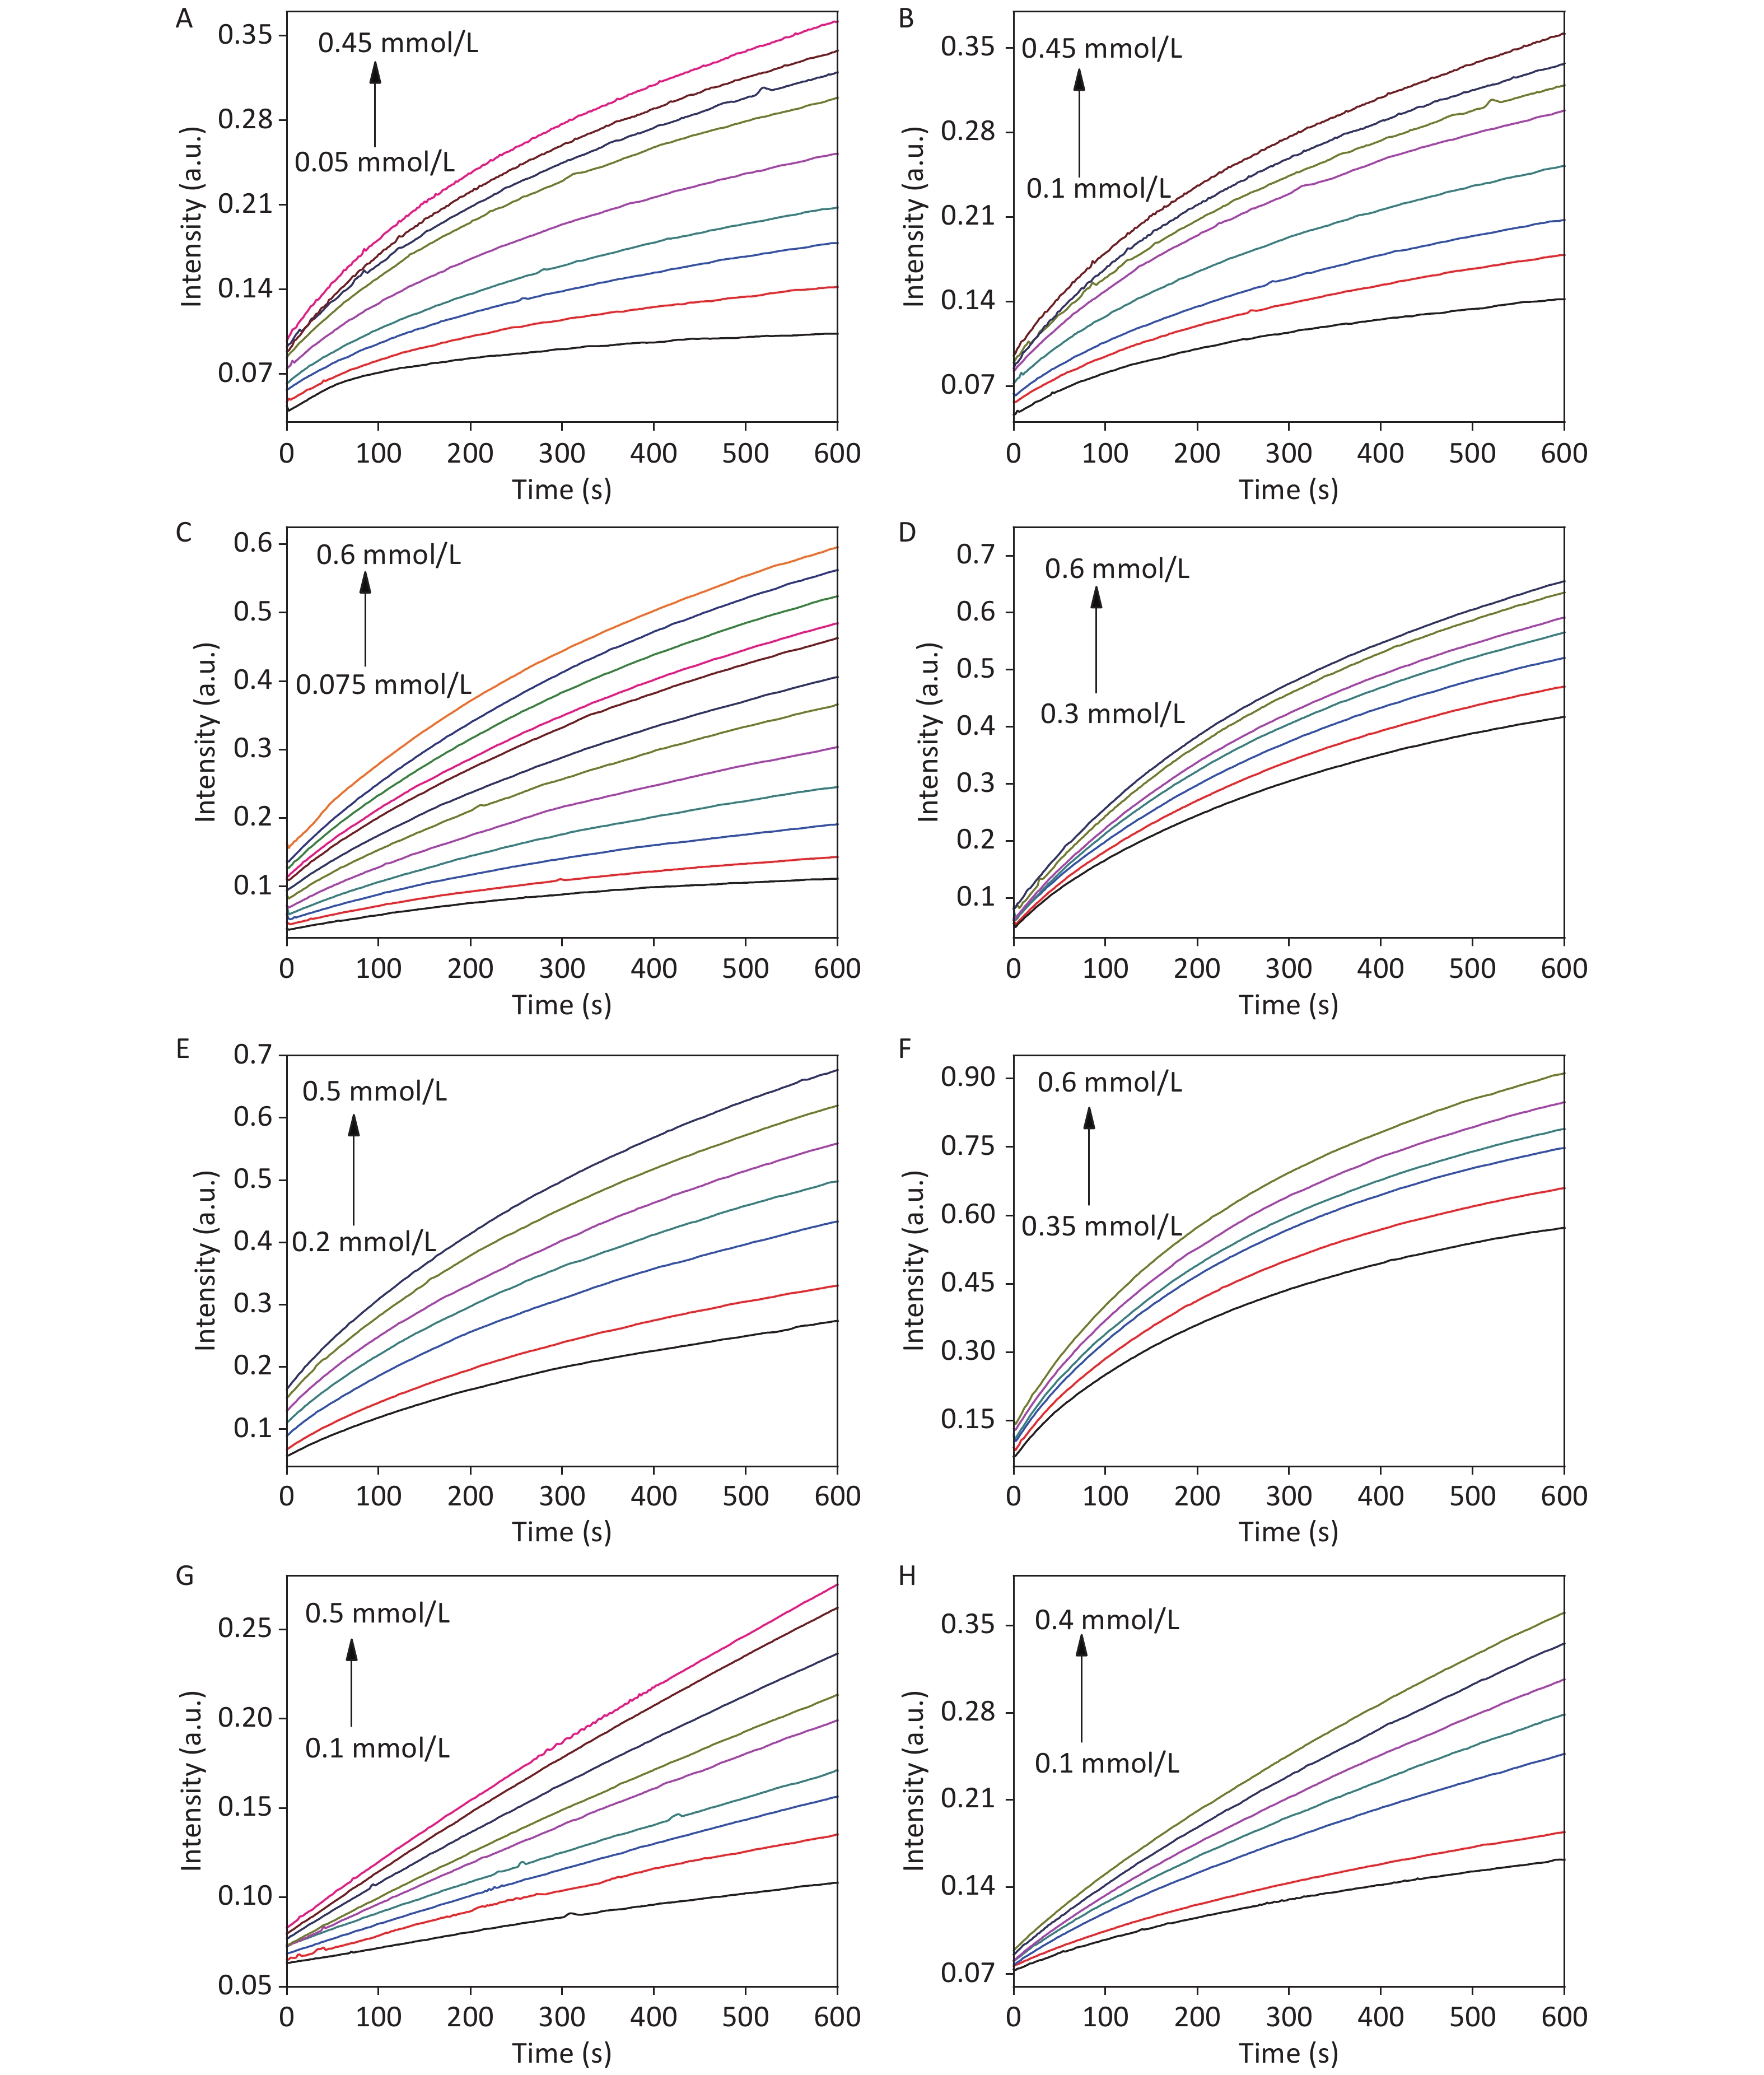
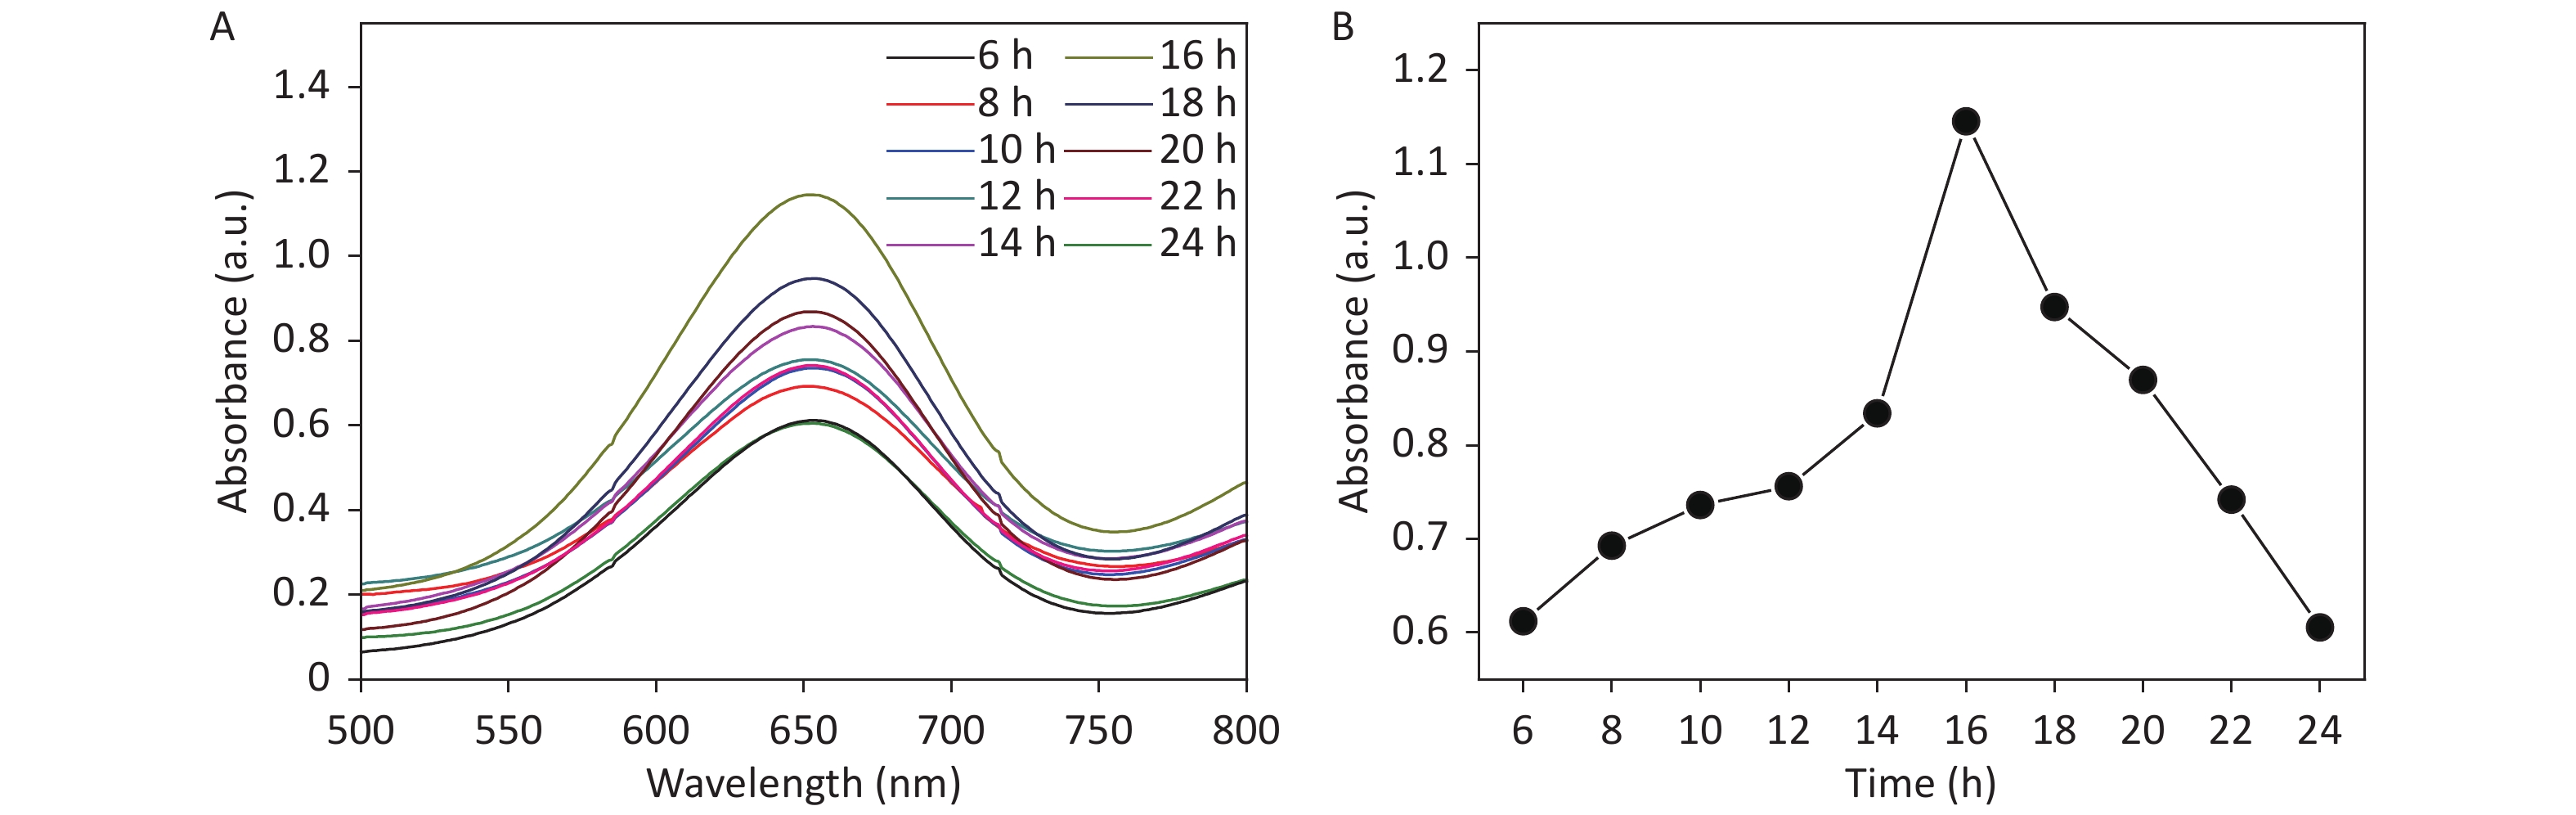
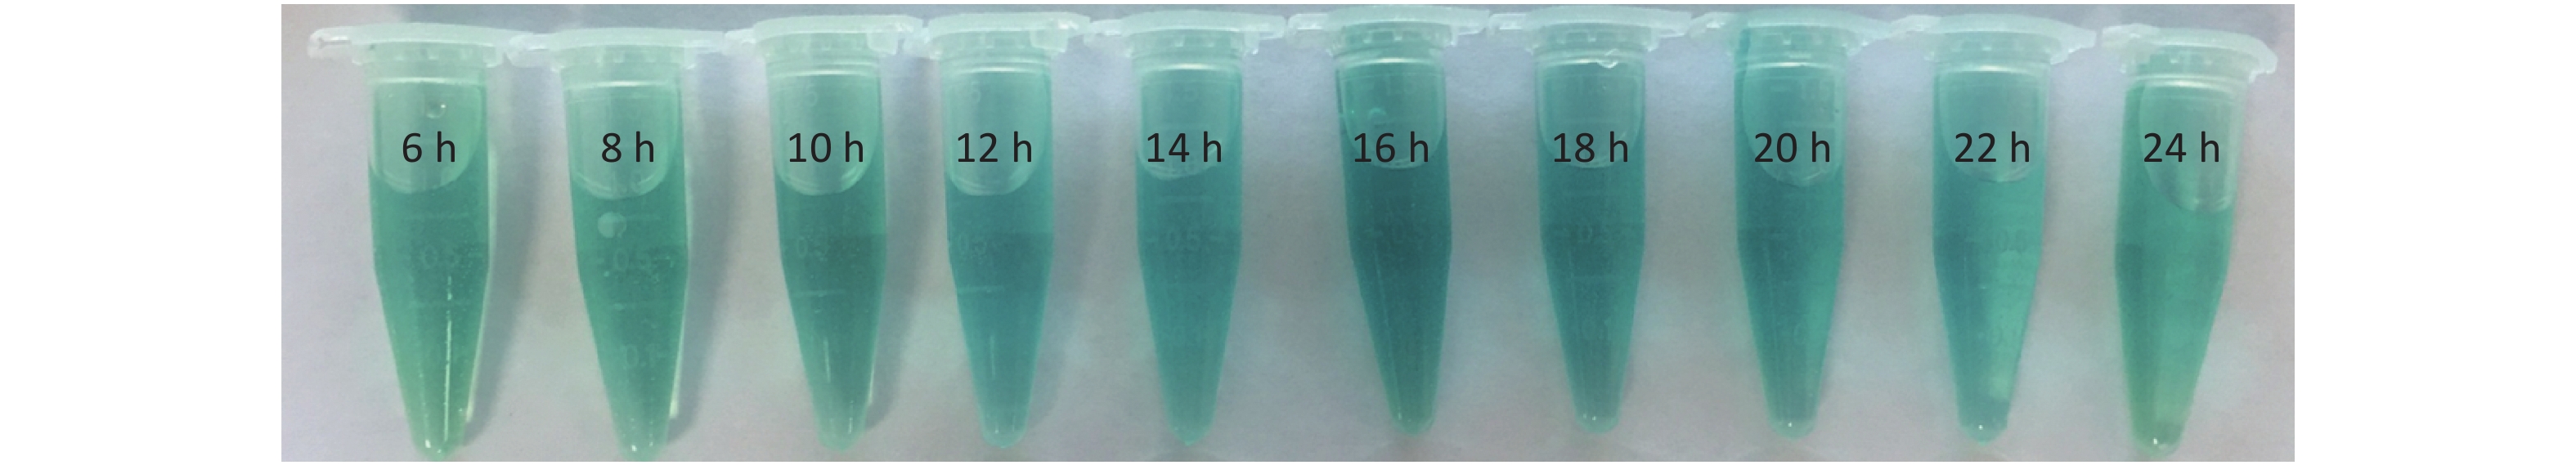
The fluorescence intensity of the EuTc system increased with increasing CDCs-NH4HF2-16h and reaction time, which confirmed the activity of CDCs-NH4HF2-16h as a SOD mimic for generating H2O2 (Supplementary Figure S9B–D). Furthermore, an oxygen-sensitive electrode was used to track the concentration of O2 generated during the reaction. Increasing the amount of CDCs-NH4HF2-16h resulted in an increased formation of O2 (Supplementary Figure S9E). These results indicated the formation of H2O2 and O2 in the presence of CDCs-NH4HF2-16h, which demonstrated the SOD-mimic activity of the CDCs. To study the kinetics of the peroxidase-mimic activity of the CDCs, the steady-state kinetics of observed color variations were analyzed by changing TMB and H2O2 concentrations (Supplementary Figure S10 available in www.besjournal.com). Maximum initial reaction rates (Vmax) were calculated from the double reciprocal of the Michaelis-Menten equation defined in the experimental section (Supplementary Table S3, Supplementary Figure S11 available in www.besjournal.com). The Vmax of CDCs was enhanced with increasing electrolysis times, from 6 to 16 h (Supplementary Table S3). However, the Vmax decreased with extended reaction times. The UV-vis absorption spectra of different electrolysis times, ranging from 6−24 h, confirmed that CDCs-NH4HF2-16h exhibited the highest enzymatic activity (Supplementary Figure S12 available in www.besjournal.com). Supplementary Figure S13 (available in www.besjournal.com) shows corresponding photographs of CDCs with different electrolysis times, ranging from 6–24 h, after the addition of TMB and H2O2 for 30 min. The peroxidase-like activity increased with increasing CDC content. These results confirmed that the peroxidase-like catalytic activity of CDCs was a result of the carbon material.
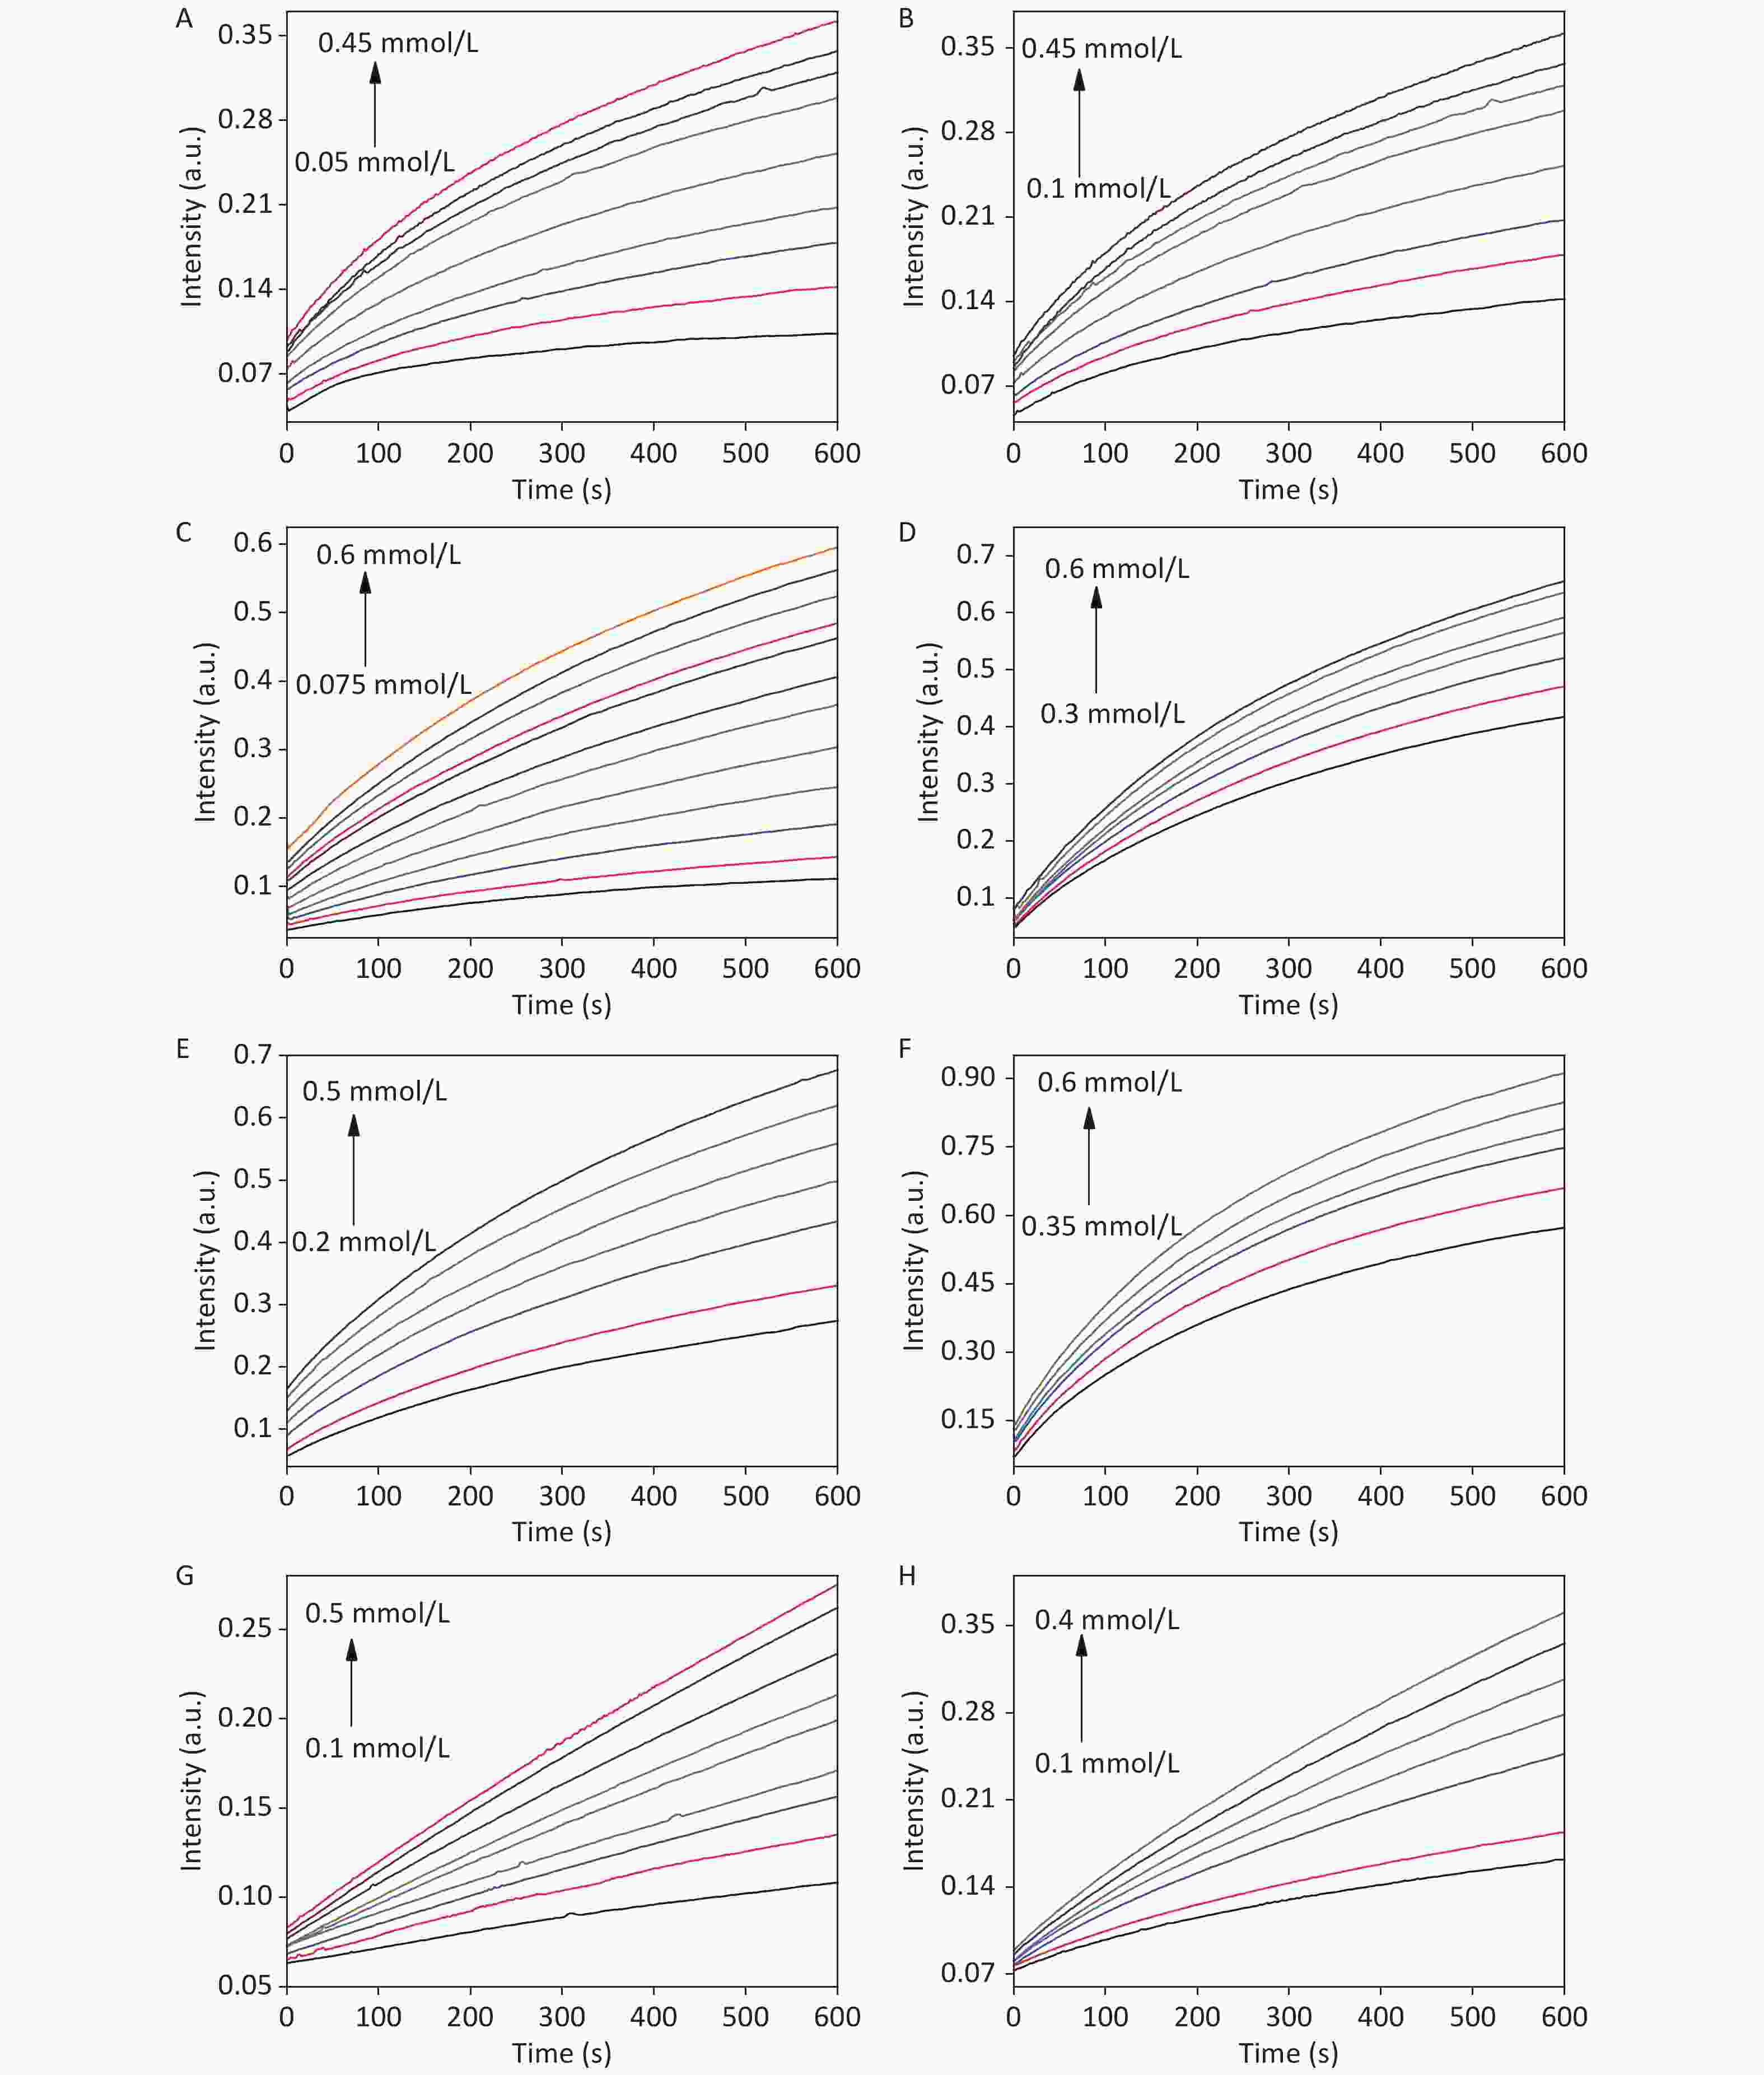
Figure S10. Time-dependent absorbance changes of TMB•+, generated upon the oxidation of TMB with variable concentrations of TMB (A, C, E, and G) and H2O2 (B, D, F, and H) of CDCs-NH4HF2-6h, CDCs-NH4HF2-12h, CDCs-NH4HF2-16h, and CDCs-NH4HF2-20h, respectively.
Table S3. Comparison of the apparent Michaelis-Menten constant (Km) and maximum reaction rate (Vmax) between of CDCs and HRP
Sample Substrate Substrate fixed (mmol/L) Vmax (mM·s − 1) Km (mmol/L) CDCs-NH4HF2-6h TMB H2O2 (50) 1.80×10⁻⁵ 0.35 CDCs-NH4HF2-6h H2O2 TMB (1) 2.30×10⁻⁵ 0.52 CDCs-NH4HF2-10h TMB H2O2 (50) 8.50×10⁻⁵ 1.98 CDCs-NH4HF2-10h H2O2 TMB (1) 6.00×10⁻⁵ 0.86 CDCs-NH4HF2-16h TMB H2O2 (50) 6.80×10⁻⁴ 14.52 CDCs-NH4HF2-16h H2O2 TMB (1) 1.35×10⁻⁴ 1.90 CDCs-NH4HF2-20h TMB H2O2 (50) 4.00×10⁻⁵ 1.96 CDCs-NH4HF2-20h H2O2 TMB (1) 4.60×10⁻⁵ 1.20 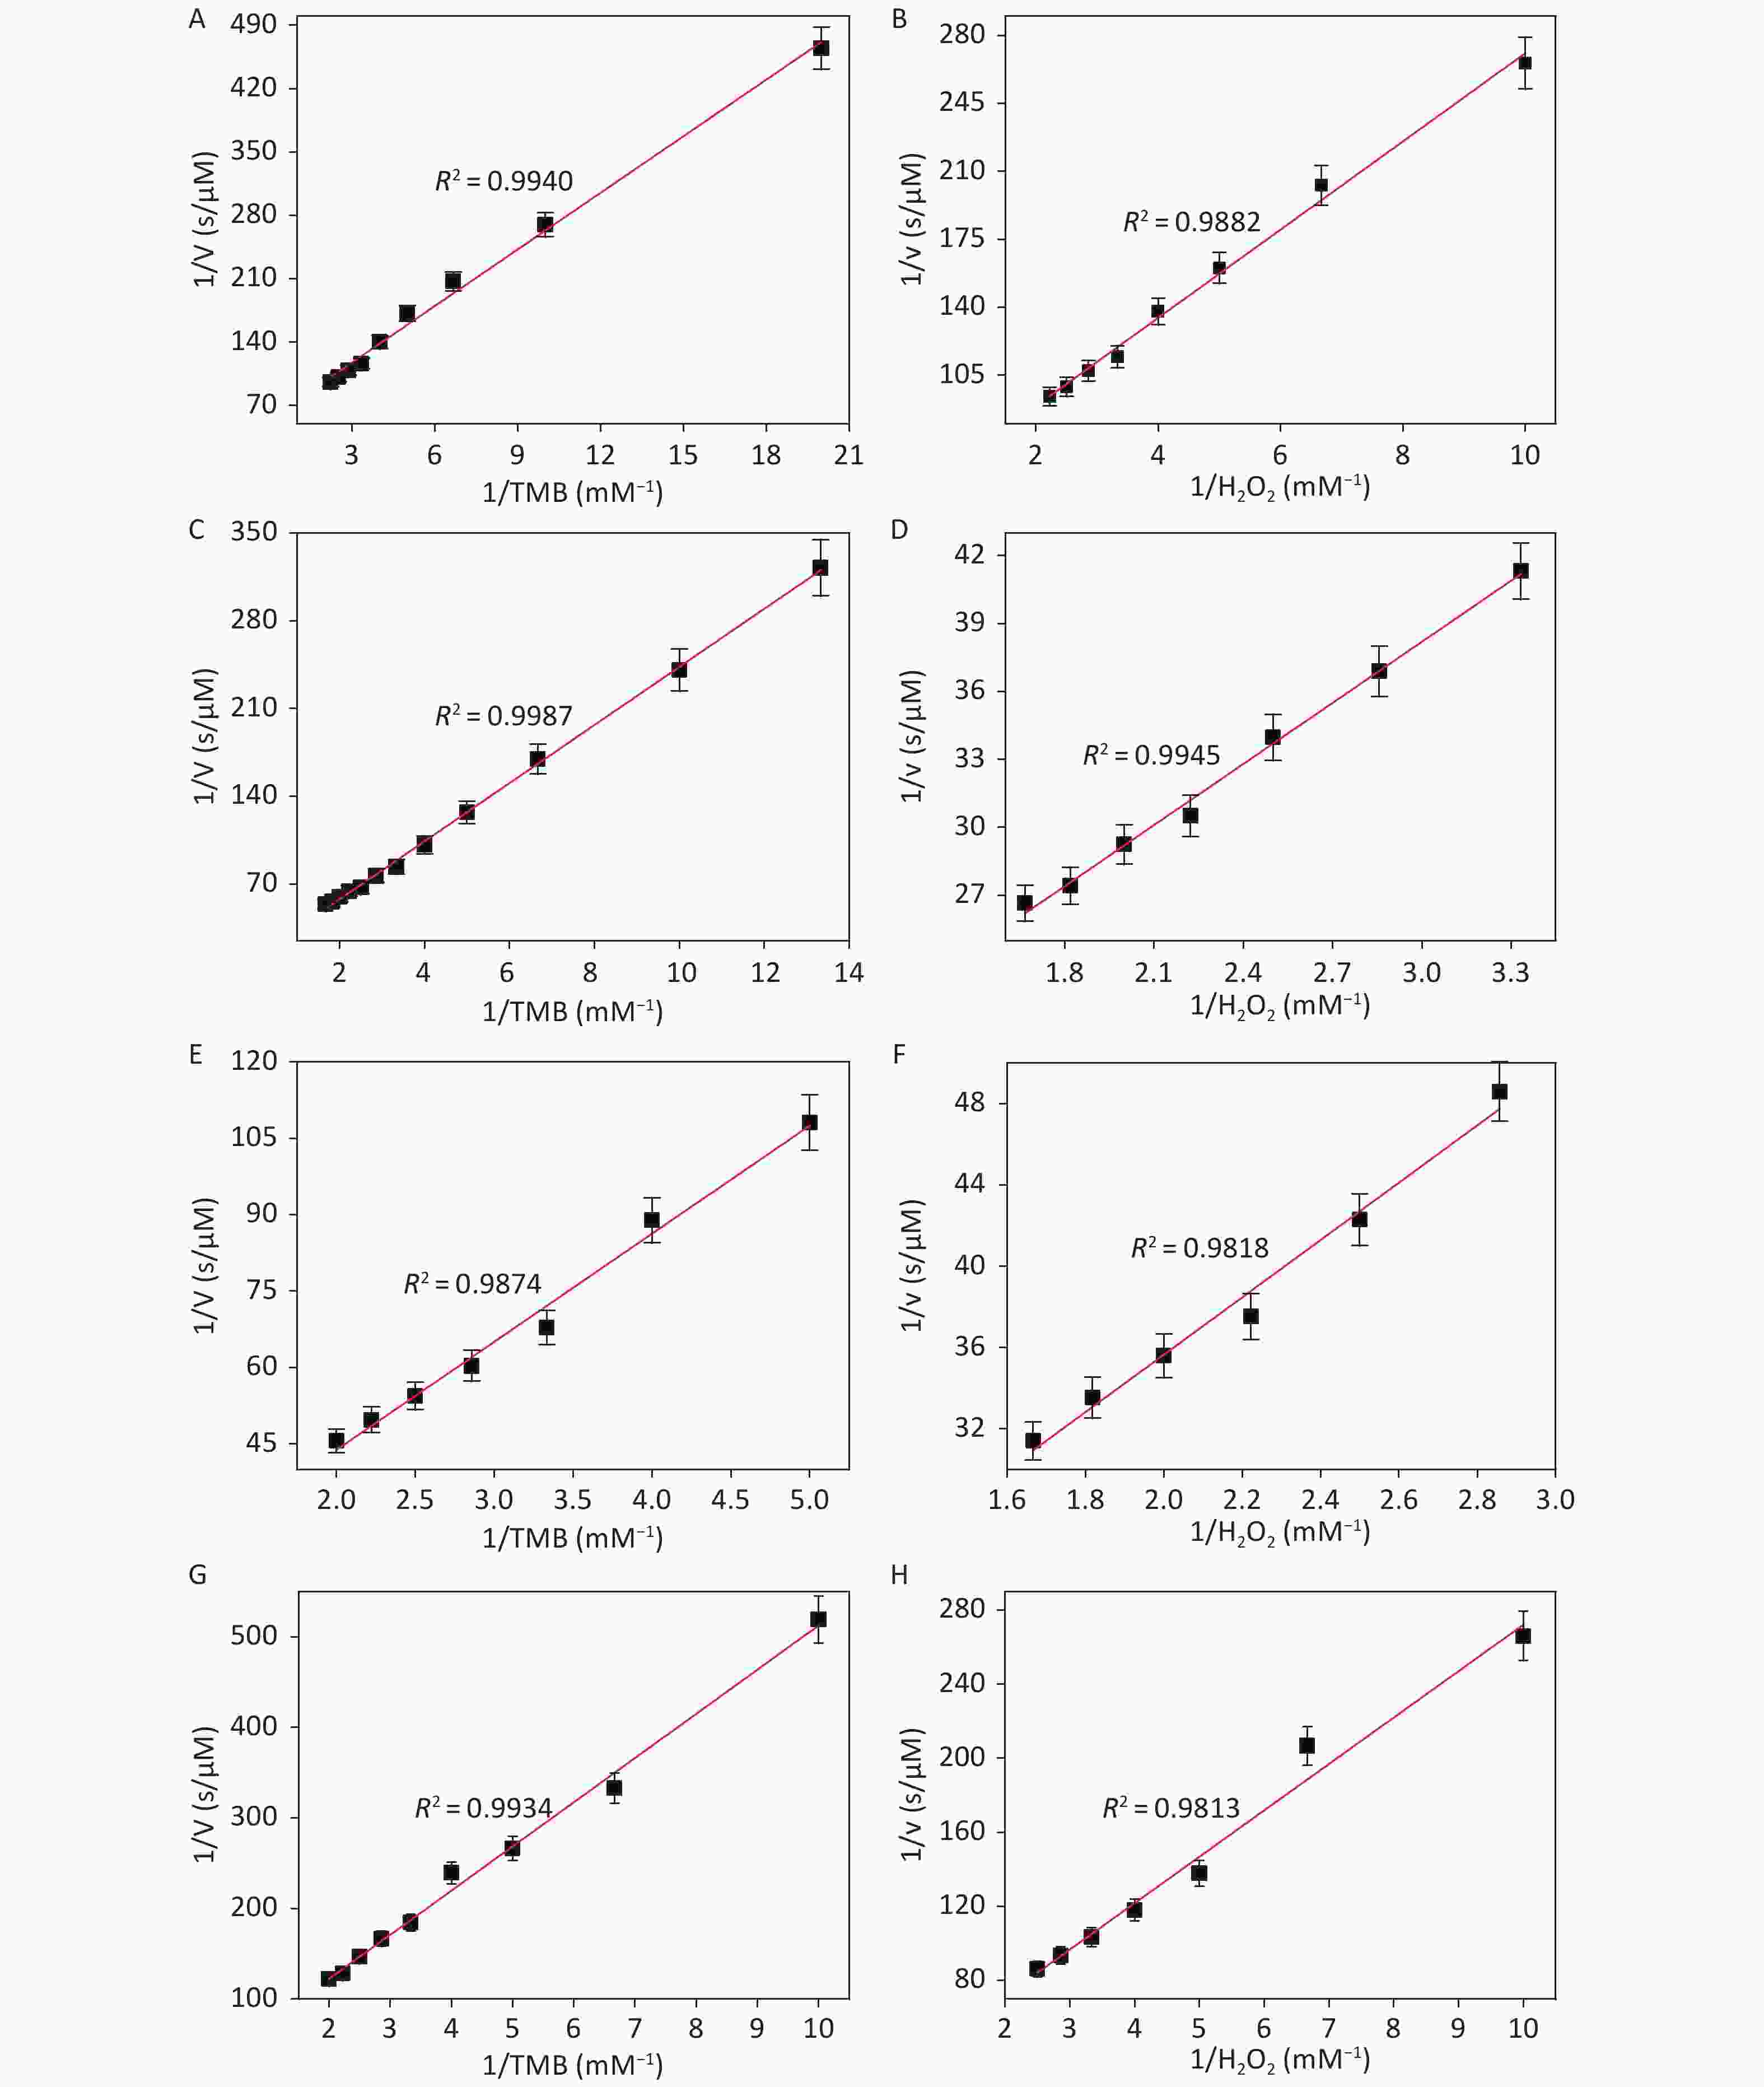
Figure S11. Steady-state kinetic assay and catalytic mechanism of CDCs-NH4HF2-6h, CDCs-NH4HF2-12h, CDCs-NH4HF2-16h and CDCs-NH4HF2-20h. The double reciprocal plots of activity of CDCs-NH4HF2-6h, CDCs-NH4HF2-12h, CDCs-NH4HF2-16h and CDCs-NH4HF2-20h with the concentration of one substrate (H2O2 or TMB) fixed and the other varied. The error bars represent the standard deviation for three measurements.

Figure S12. The UV absorption spectra of different electrolysis time from 6–24 h (2 h as a unit) after adding TMB (1 mmol/L) and H2O2 (50 mmol/L) for 30 min.
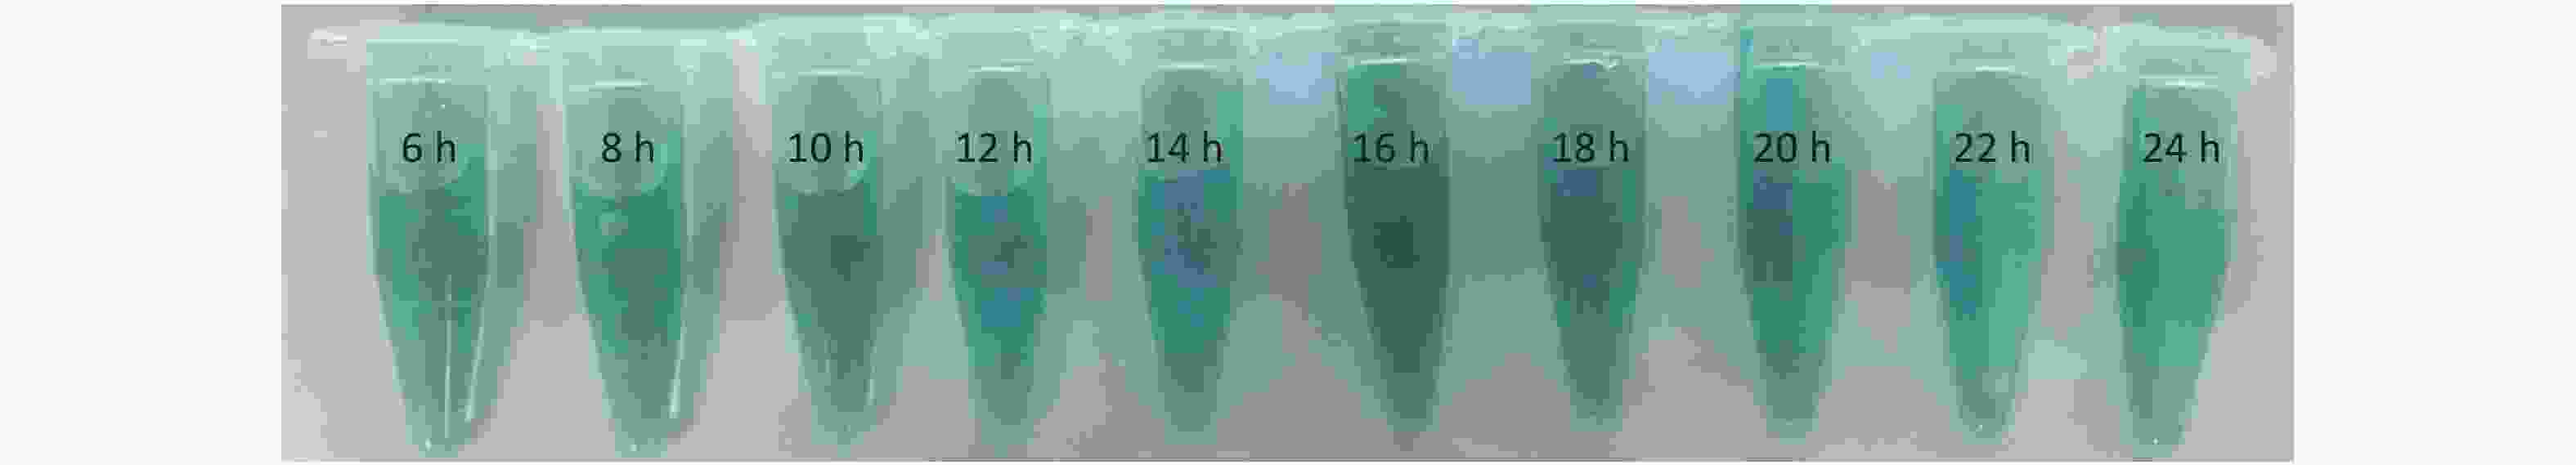
Figure S13. The photograph of nanosheets with different electrolysis time from 6–24 h (2 h as a unit) after adding TMB (1 mmol/L) and H2O2 (50 mmol/L) for 30 min.
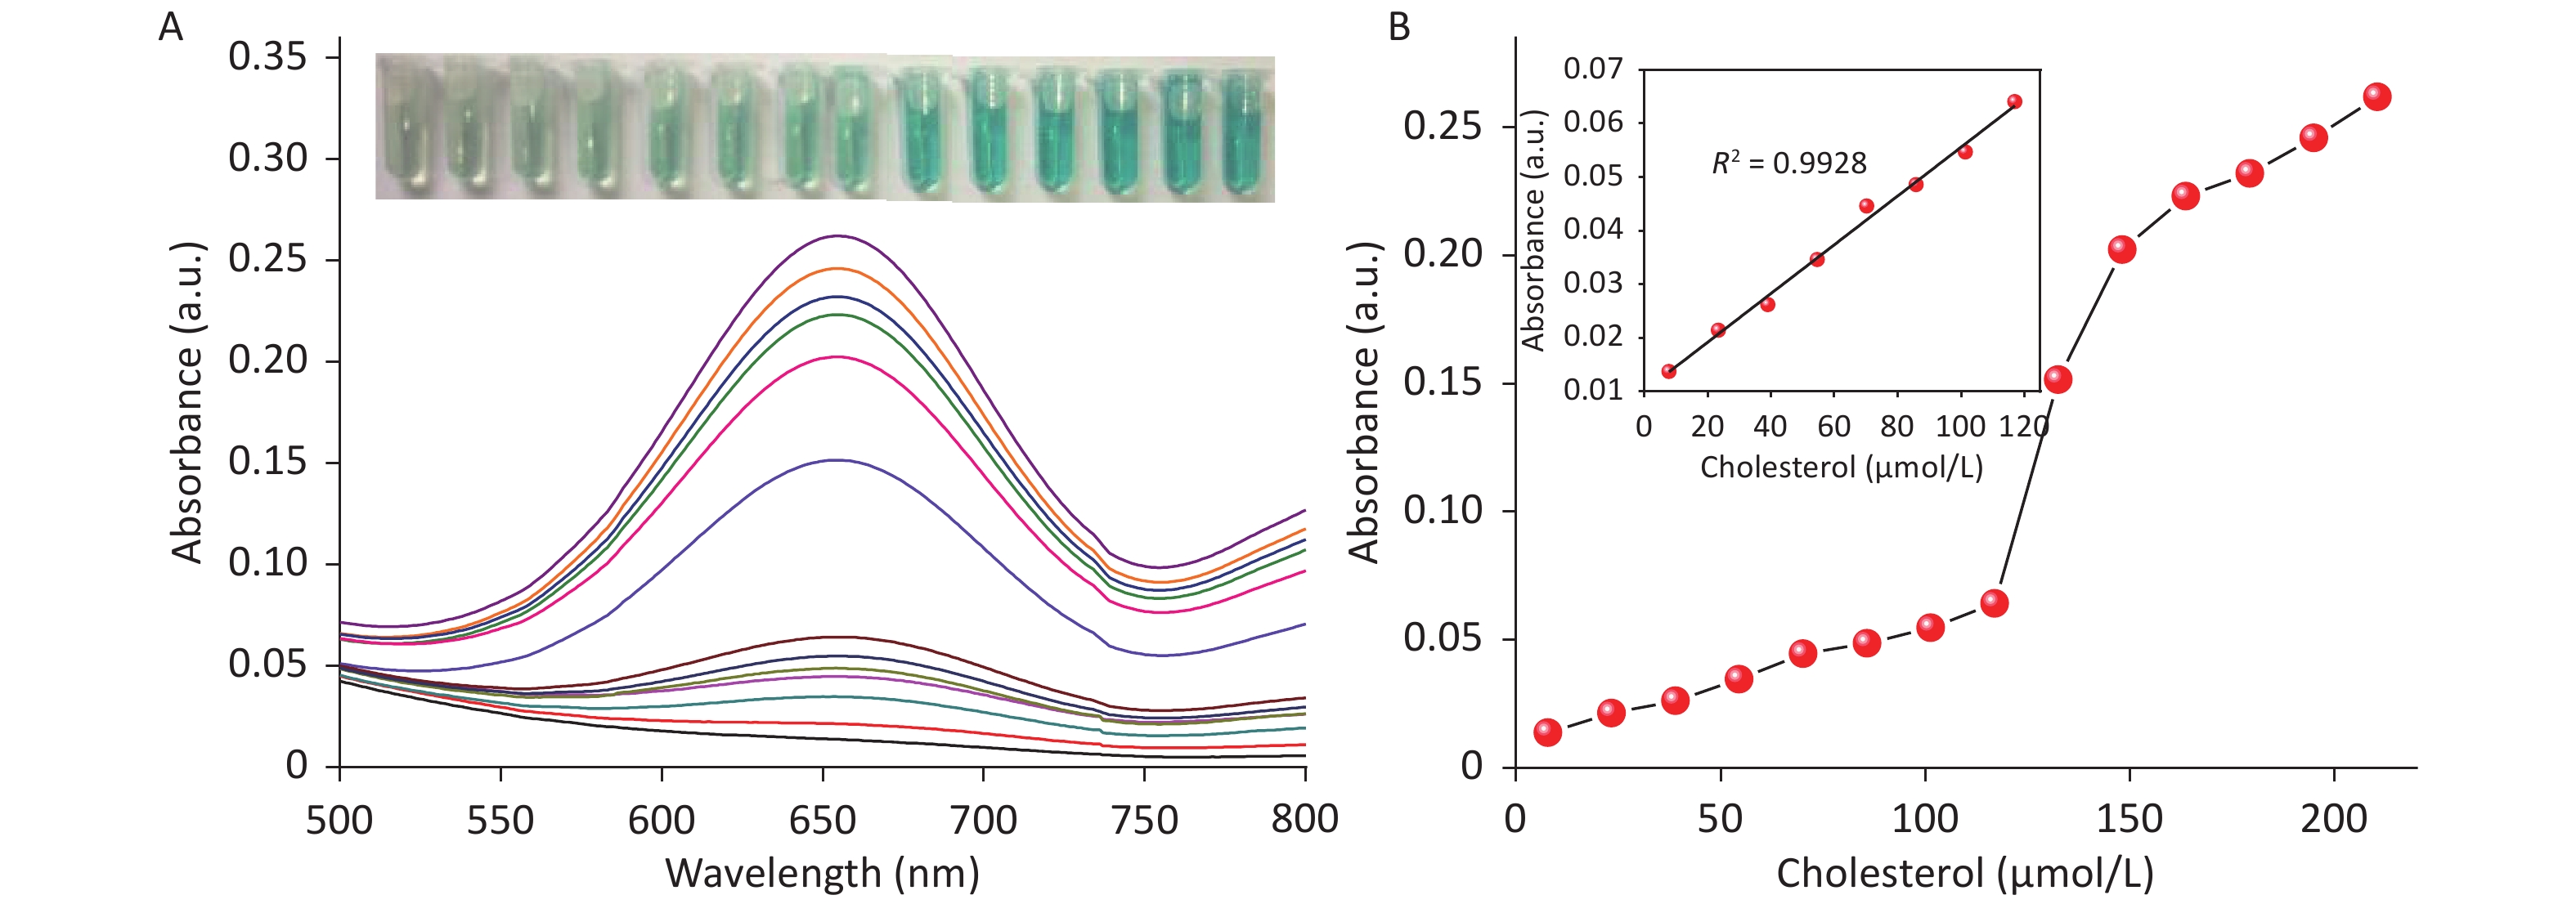
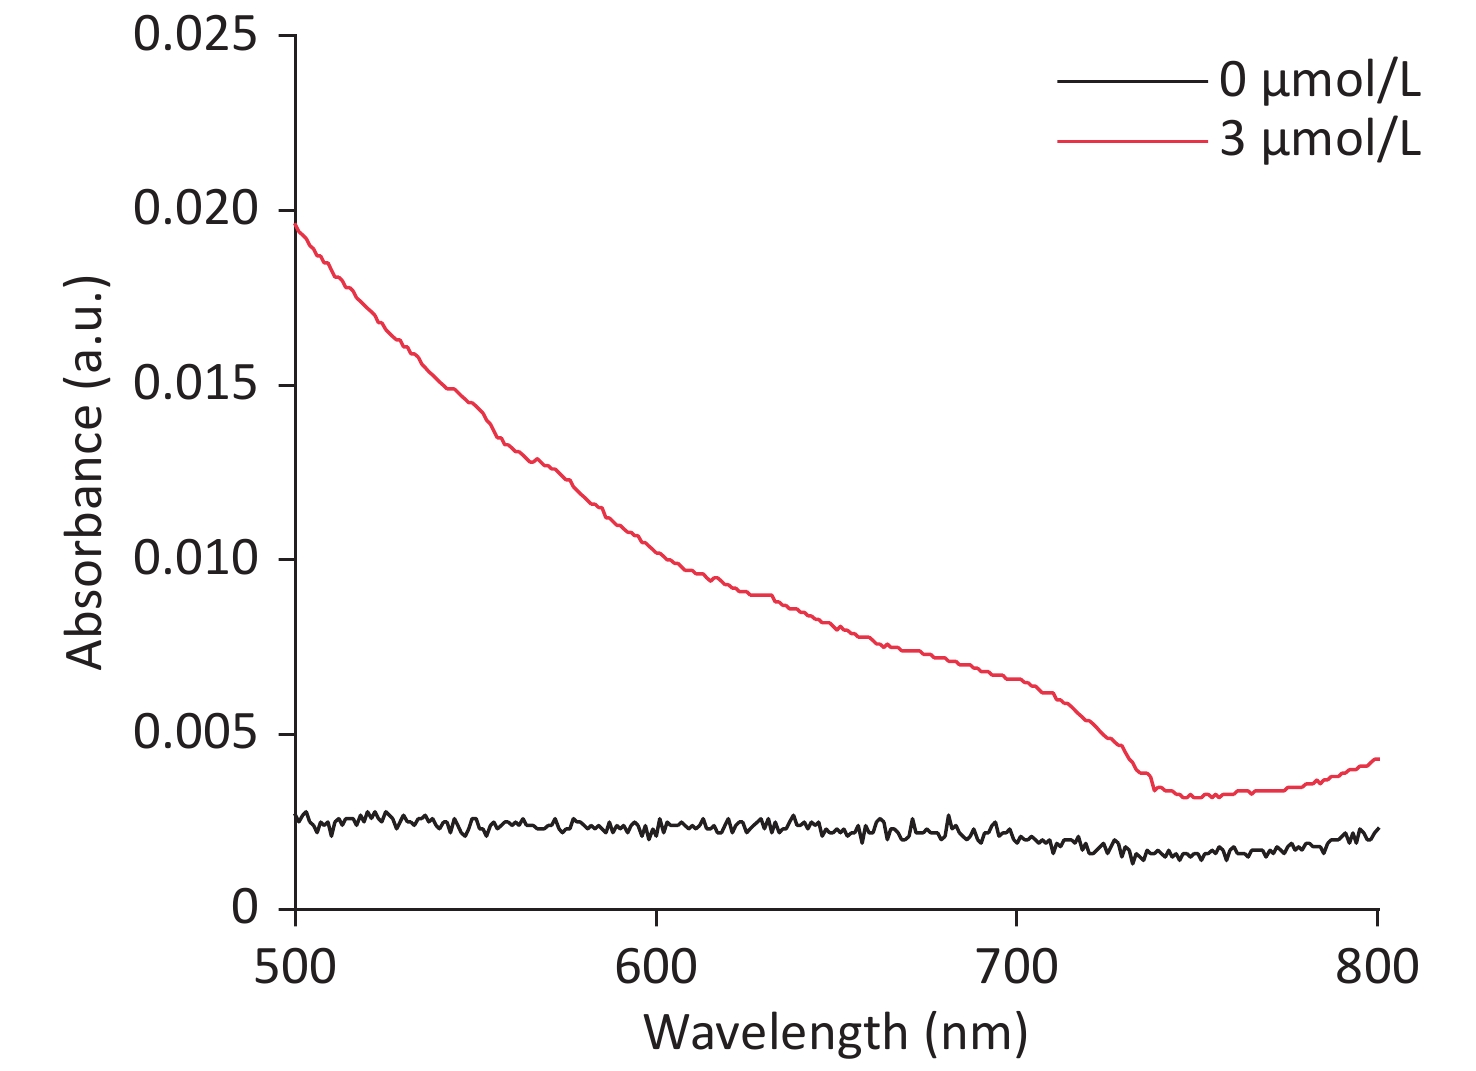
Due to the intrinsic peroxidase-like catalytic activity of CDCs, cholesterol detection was carried out by combining the mimetic enzyme with cholesterol oxidase. As shown in Figure 6A, the absorbance intensity at 652 nm was proportional to the cholesterol concentration, ranging from 7.79 μmol/L to 116.96 μmol/L. A linear regression equation of I = 0.45 × Ccholesterol + 0.01 (unit of C is μmol/L) with R2 = 0.9928 is shown in Figure 6B. The detection limit was determined to be 3 μmol/L (S N−1 ≥ 3, Supplementary Figure S14 available in www.besjournal.com), which is superior or comparable to other reported nanozyme based cholesterol detection methods. These results demonstrate the broad applicability of these CDCs in both chemical and biochemical applications.
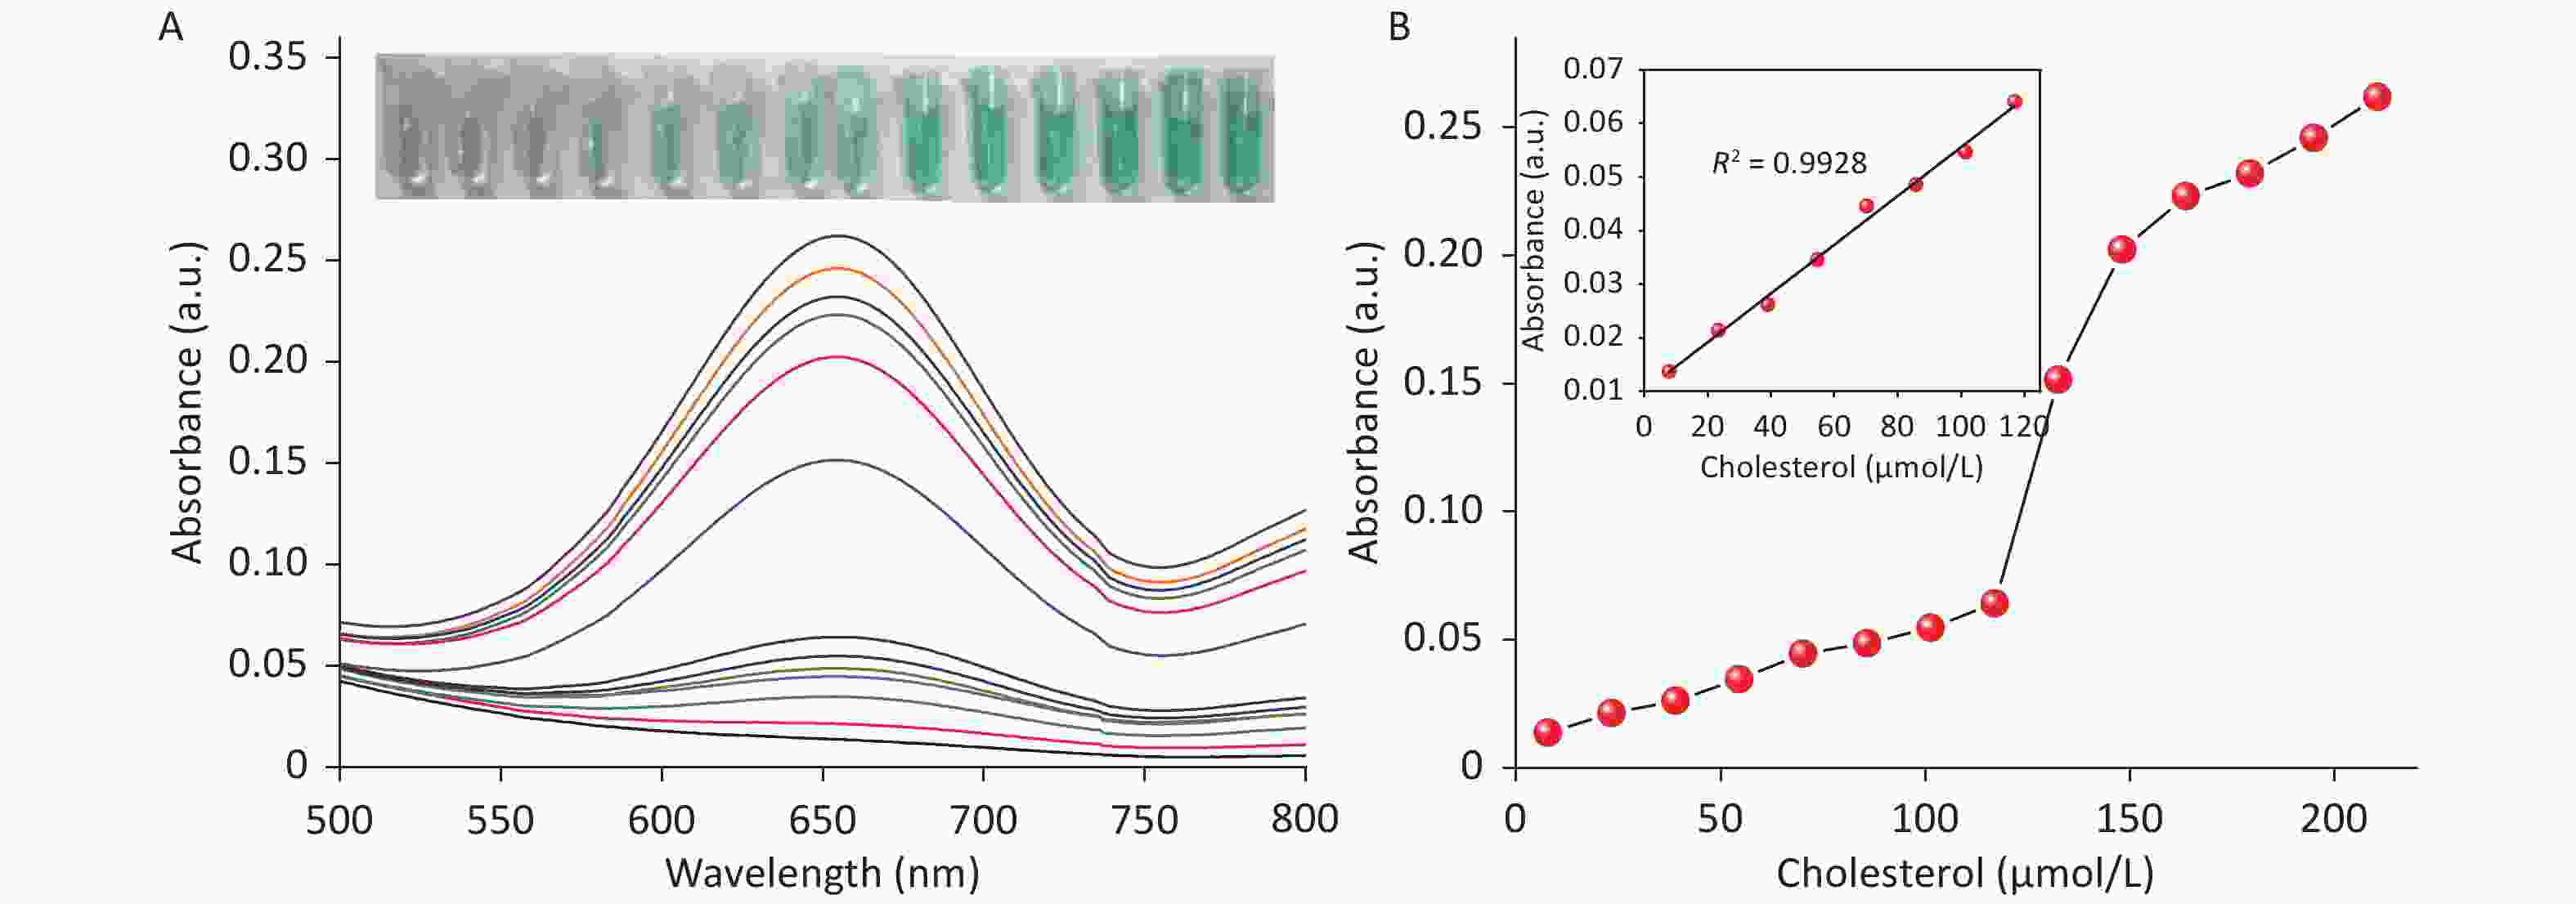
Figure 6. (A) UV-vis spectra of CDCs-NH4HF2-16h+TMB+ChOx with different concentrations of cholesterol (Inset: images of colored products for different concentrations of cholesterol). (B) Calibration curve of cholesterol detection (Inset: linear calibration plot of cholesterol detection).
-
In summary, CDCs were synthesized by the one-step electrochemical exfoliation of bulk Ti3AlC2 in NH4HF2. The CDCs possessed both peroxidase- and SOD-like activity, which increased with increasing carbon content. Thus, we confirmed that the enzymatic activity resulted from the CDC material. The optimal reaction time for the peroxidase-like catalytic activity of CDCs was determined to be 16 h of the EC process. Additionally, the synthetic mechanism of CDCs was demonstrated, and possible reaction equations between Ti3AlC2 and bifluoride were proposed. Moreover, the applicability of the nanozymes was demonstrated by the sensitive detection of cholesterol. This synthesis strategy eliminates tedious centrifugation intercalation and delamination steps and is environmentally conscious due to the avoidance of high concentration HF, high temperatures, and halogen gases. This study paves the way for designing two-dimensional material-based nanocatalysts for nanoenzyme and other applications.
-
We appreciate Dr. Tingting Zhang and Hao Wan for her help in some experiments, who works in the Biology Experimental Teaching Center of Qingdao University.
-
The authors declare no conflict of interest.

Figure S8. UV-vis adsorption spectra of different reaction systems in a 50 mmol/L NaAc (pH = 5) at room temperature. (a) Photography of the mixture of TMB and H2O2 in the absence of CDCs. (b) Photography of the mixture of TMB and CDCs in the absence of H2O2. (c) Photography of the mixture of CDCs and H2O2 in the absence of TMB. (d) Photography of the mixture of TMB, H2O2 and CDCs. The H2O2 and TMB concentration were 50 mmol/L, 1 mg/mL, respectively.
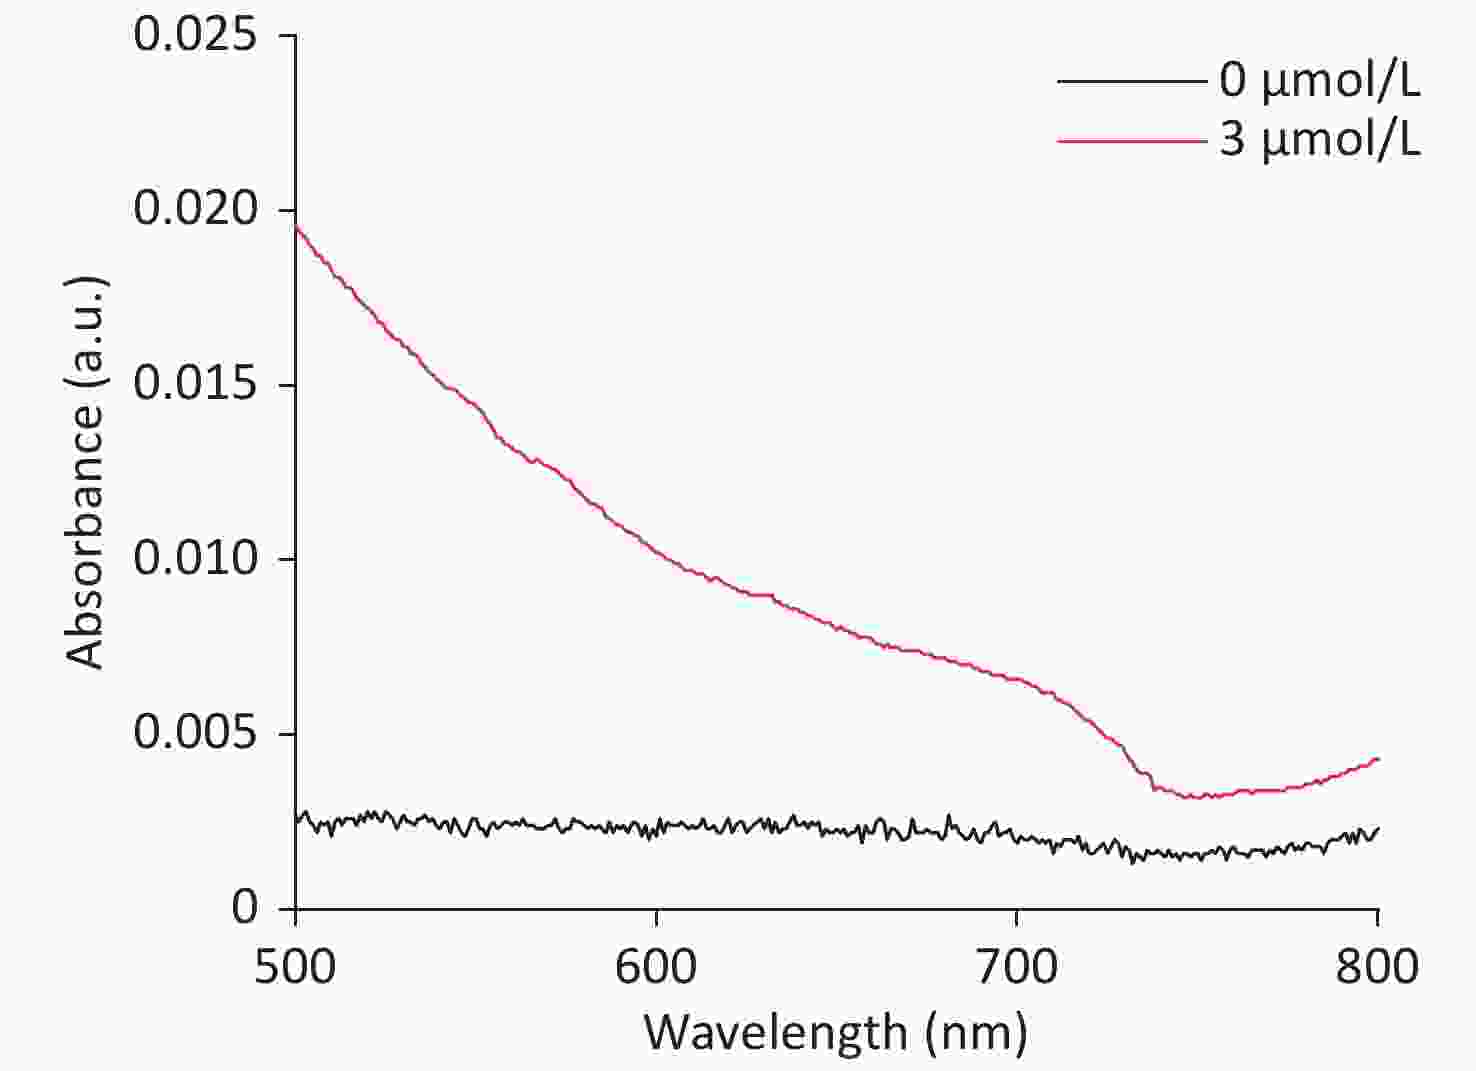
Figure S14. UV-vis spectra of CDCs-NH4HF2-16h+TMB in the absence (the black line) and presence of 3 μmol/L cholesterol (the red line).
doi: 10.3967/bes2022.030
Direct Synthesis of Bienzyme-like Carbide-derived Carbons via Mild Electrochemical Oxidation of Ti3AlC2 MAX
-
Abstract:
Objective To develop effective alternatives to natural enzymes, it is crucial to develop nanozymes that are economical, resource efficient, and environmentally conscious. Carbon nanomaterials that have enzyme-like activities have been extensively developed as substitutes for traditional enzymes. Methods Carbide-derived carbons (CDCs) were directly synthesized via a one-step electrochemical method from a MAX precursor using an ammonium bifluoride electrolyte at ambient conditions. The CDCs were characterized by systematic techniques. Results CDCs showed bienzyme-like activities similar to that of peroxidase and superoxide dismutase. We systematically studied the dependence of CDC enzyme-like activity on different electrolytes and electrolysis times to confirm activity dependence on CDC content. Additionally, the synthesis mechanism and CDC applicability were elaborated and demonstrated, respectively. Conclusion The demonstrated synthesis strategy eliminates tedious intercalation and delamination centrifugation steps and avoids using high concentrations of HF, high temperatures, and halogen gases. This study paves the way for designing two-dimensional material-based nanocatalysts for nanoenzyme and other applications. -
Key words:
- Bienzyme-like /
- Electrochemical /
- Carbide-derived carbons
注释: -
Figure 1. Schematic illustration of the exfoliation process of Ti3AlC2 with NH4HF2 as the electrolyte using the one-step EC method.
S2. Photographs of the reaction mixtures from the EC generation process at different time periods: (A) 0 h, (B) 1 h, (C) 2 h, (D) 4 h, (E) 5 h, and (F) 6 h, respectively; (G) The photographs of the supernatant upon different electrolytic time.
S3. XRD patterns of (a) CDCs-NH4HF2-6h, (b) CDCs-NaHF2-6h, (c) CDCs-NH4F-6h, respectively.
S4. The survey XPS spectra (A, D, and G), the narrow scan spectra of Ti 2p (B, E, and H) and O 1s (C, F, and I) of the CDCs-NH4HF2-6h, CDCs-NaHF2-6h, and CDCs-NH4F-6h, respectively.
Figure 2. XRD patterns of (A) CDCs-NH4HF2-6h, (B) CDCs-NaHF2-6h, and (C) CDCs-NH4F-6h.
Figure 3. (A, B) TEM and (C, D) HRTEM images of (A, C) CDCs-NH4HF2-6h and (B, D) CDCs-NH4HF2-16h. (E) XRD pattern of CDCs-NH4HF2-16h; (F) TEM and corresponding elemental mapping images of C, O, and F in CDCs-NH4HF2-16h. (G) AFM topography of CDCs-NH4HF2-16h. (H) Height profiles from the white line section in the AFM image. (I) FTIR spectra of CDCs-NH4HF2-6h and CDCs-NH4HF2-16h. Insets (A, B) are particle size distributions obtained from TEM.
S6. The survey XPS spectra (A, C, E, and G) and the narrow scan spectra of C 1 s (B, D, E, and H) of the CDCs-NH4HF2-6h, CDCs-NH4HF2-10h, CDCs-NH4HF2-16h, and CDCs-NH4HF2-20h, respectively.
S7. The survey XPS spectra of Ti 2p (A, C, E, and G) and O 1s (B, D, F, and H) of the CDCs-NH4HF2-6h, CDCs-NH4HF2-10h, CDCs-NH4HF2-16h, and CDCs-NH4HF2-20h, respectively.
Figure 4. (A) Schematic illustration of CDCs-NH4HF2-16h catalyzing the oxidation of TMB in the presence of H2O2. (B) Time-dependent absorbance changes at 652 nm of TMB in different reaction systems in 50 mM NaAc (pH = 5) at room temperature. The inset in (B) shows the corresponding photographs: (a) a mixture of TMB and H2O2 in the absence of CDCs, (b) a mixture of TMB and CDCs in the absence of H2O2, (c) a mixture of CDCs and H2O2 in the absence of TMB, and (d) a mixture of TMB, H2O2, and CDCs. The (C) pH dependence and (D) temperature dependence of the peroxidase-like activity of nanosheets and HRP in 50 mmol/L NaAc. The H2O2 and TMB concentration were 50 mmol/L and 1 mg/mL, respectively.
Figure 5. (A) Schematic illustration of the SOD-like activity of CDCs-NH4HF2-16h. (B) Scavenging efficiency of superoxide radicals in different conditions: (a) blank control without ultraviolet radiation, (b) absence, and (c) presence of CDCs-NH4HF2-16h after ultraviolet radiation. Inset shows corresponding photographs. (C) Scavenging efficiency of superoxide radicals with different concentrations of CDCs-NH4HF2-16h. (D) Photographs of the scavenging efficiency of superoxide radicals (a) before and (b) after ultraviolet radiation. The photographs show different volumes of CDCs ranging from 0 to 450 μL (50 μL increments), from left to right.
S9. The fluorescence spectra of EuTc solutions in the presence of different volumes of (A) H2O2 and (B) CDCs-NH4HF2-16h in MOPS buffers, respectively. (C) The fluorescence spectra at different times of reaction with 20 μL CDCs-NH4HF2-16h added. (D) The fluorescence intensity changes with the addition of different volumes of CDCs-NH4HF2-16h of 10, 15, 20, 40, 60, 80, 100, 150 μL. (E) The O2 emission catalyzed by CDCs-NH4HF2-16h at different volumes range from 1 mL–8 mL (1 mL as a unit) in solution of 10 mL 50 mmol/L NaAc (pH = 5).
S10. Time-dependent absorbance changes of TMB•+, generated upon the oxidation of TMB with variable concentrations of TMB (A, C, E, and G) and H2O2 (B, D, F, and H) of CDCs-NH4HF2-6h, CDCs-NH4HF2-12h, CDCs-NH4HF2-16h, and CDCs-NH4HF2-20h, respectively.
S11. Steady-state kinetic assay and catalytic mechanism of CDCs-NH4HF2-6h, CDCs-NH4HF2-12h, CDCs-NH4HF2-16h and CDCs-NH4HF2-20h. The double reciprocal plots of activity of CDCs-NH4HF2-6h, CDCs-NH4HF2-12h, CDCs-NH4HF2-16h and CDCs-NH4HF2-20h with the concentration of one substrate (H2O2 or TMB) fixed and the other varied. The error bars represent the standard deviation for three measurements.
S12. The UV absorption spectra of different electrolysis time from 6–24 h (2 h as a unit) after adding TMB (1 mmol/L) and H2O2 (50 mmol/L) for 30 min.
S13. The photograph of nanosheets with different electrolysis time from 6–24 h (2 h as a unit) after adding TMB (1 mmol/L) and H2O2 (50 mmol/L) for 30 min.
Figure 6. (A) UV-vis spectra of CDCs-NH4HF2-16h+TMB+ChOx with different concentrations of cholesterol (Inset: images of colored products for different concentrations of cholesterol). (B) Calibration curve of cholesterol detection (Inset: linear calibration plot of cholesterol detection).
S8. UV-vis adsorption spectra of different reaction systems in a 50 mmol/L NaAc (pH = 5) at room temperature. (a) Photography of the mixture of TMB and H2O2 in the absence of CDCs. (b) Photography of the mixture of TMB and CDCs in the absence of H2O2. (c) Photography of the mixture of CDCs and H2O2 in the absence of TMB. (d) Photography of the mixture of TMB, H2O2 and CDCs. The H2O2 and TMB concentration were 50 mmol/L, 1 mg/mL, respectively.
S14. UV-vis spectra of CDCs-NH4HF2-16h+TMB in the absence (the black line) and presence of 3 μmol/L cholesterol (the red line).
S1. XPS peak fitting results for CDCs-NH4HF2-6h, CDCs-NaHF2-6h, and CDCs-NH4F-6h
CDCs-NH4HF2-6h CDCs-NaHF2-6h CDCs-NH4F-6h Region BE [eV] BE [eV] BE [eV] Assigned to Ti 2p 466 466 TiO2 464.9 464.9 465 C-Ti-Fx 462.9 462.9 462.3 Ti3+ 460.3 460.3 460.3 TiO2 459.3 459.3 458.6 C-Ti-Fx 456.8 Ti3+ O 1s 532.6 533.3 532.8 H2O 531.8 532.5 532 C-Ti-(OH)x 531 531.8 531.3 C-Ti-Ox 530 531.1 530.5 TiO2  下载: 导出CSV
S2. XPS peak fitting results for CDCs-NH4HF2-6h, CDCs-NH4HF2-10h, CDCs-NH4HF2-16h, and CDCs-NH4HF2-20h
CDCs-NH4HF2-6h CDCs-NH4HF2-10h CDCs-NH4HF2-16h CDCs-NH4HF2-20h Region BE [eV] BE [eV] BE [eV] BE [eV] Assigned to C 1s 281.75 282 Ti-C 284.40 284.55 284.41 284.30 C-C 284.85 285 285 284.99 C-O Ti 2p 466 466 465.79 465.80 TiO2 464.90 465 C-Ti-Fx 462.90 Ti3+ 460.25 460.30 460.15 460.03 TiO2 459.15 459.40 C-Ti-Fx O 1s 532.60 532.80 532.13 532.10 H2O 531.78 532.10 C-Ti-(OH)x 531 531.60 C-Ti-Ox 530.03 530.90 530.50 531 TiO2
下载: 导出CSV
S3. Comparison of the apparent Michaelis-Menten constant (Km) and maximum reaction rate (Vmax) between of CDCs and HRP
Sample Substrate Substrate fixed (mmol/L) Vmax (mM·s − 1) Km (mmol/L) CDCs-NH4HF2-6h TMB H2O2 (50) 1.80×10⁻⁵ 0.35 CDCs-NH4HF2-6h H2O2 TMB (1) 2.30×10⁻⁵ 0.52 CDCs-NH4HF2-10h TMB H2O2 (50) 8.50×10⁻⁵ 1.98 CDCs-NH4HF2-10h H2O2 TMB (1) 6.00×10⁻⁵ 0.86 CDCs-NH4HF2-16h TMB H2O2 (50) 6.80×10⁻⁴ 14.52 CDCs-NH4HF2-16h H2O2 TMB (1) 1.35×10⁻⁴ 1.90 CDCs-NH4HF2-20h TMB H2O2 (50) 4.00×10⁻⁵ 1.96 CDCs-NH4HF2-20h H2O2 TMB (1) 4.60×10⁻⁵ 1.20
下载: 导出CSV
-
[1] Mishra RK, Goud KY, Li ZH, et al. Continuous opioid monitoring along with nerve agents on a wearable microneedle sensor array. J Am Chem Soc, 2020; 142, 5991−5. doi: 10.1021/jacs.0c01883 [2] Huffman MA, Fryszkowska A, Alvizo O, et al. Design of an in vitro biocatalytic cascade for the manufacture of islatravir. Science, 2019; 366, 1255−9. doi: 10.1126/science.aay8484 [3] Jiang DW, Ni DL, Rosenkrans ZT, et al. Nanozyme: new horizons for responsive biomedical applications. Chem Soc Rev, 2019; 48, 3683−704. doi: 10.1039/C8CS00718G [4] Huang L, Niu YS, Li RG, et al. VOx quantum dots with multienzyme-mimic activities and the application in constructing a three-dimensional (3D) coordinate system for accurate discrimination of the hydrogen peroxide over a broad concentration range. Anal Chem, 2019; 91, 5753−61. doi: 10.1021/acs.analchem.8b05923 [5] Wu JJX, Wang XY, Wang Q, et al. Nanomaterials with enzyme-like characteristics (nanozymes): next-generation artificial enzymes (II). Chem Soc Rev, 2019; 48, 1004−76. doi: 10.1039/C8CS00457A [6] Zhang P, Sun DR, Cho A, et al. Modified carbon nitride nanozyme as bifunctional glucose oxidase-peroxidase for metal-free bioinspired cascade photocatalysis. Nat Commun, 2019; 10, 940. doi: 10.1038/s41467-019-08731-y [7] Liang MM, Yan XY. Nanozymes: From new concepts, mechanisms, and standards to applications. Accounts Chem Res, 2019; 52, 2190−200. doi: 10.1021/acs.accounts.9b00140 [8] Sun HJ, Zhou Y, Ren JS, et al. Carbon nanozymes: Enzymatic properties, catalytic mechanism, and applications. Angew Chem Int Ed, 2018; 57, 9224−37. doi: 10.1002/anie.201712469 [9] Sun HJ, Zhao AD, Gao N, et al. Deciphering a nanocarbon-based artificial peroxidase: Chemical identification of the catalytically active and substrate-binding sites on graphene quantum dots. Angew Chem Int Ed, 2015; 54, 7176−80. doi: 10.1002/anie.201500626 [10] Ding H, Hu B, Zhang B, et al. Carbon-based nanozymes for biomedical applications. Nano Res, 2021; 14, 570−83. doi: 10.1007/s12274-020-3053-9 [11] Ariyanto T, Zhang GR, Riyahi F, et al. Controlled synthesis of core-shell carbide-derived carbons through in situ generated chlorine. Carbon, 2017; 115, 422−9. doi: 10.1016/j.carbon.2017.01.032 [12] Wu J, Zhang XX, Li Z, et al. Toward high-performance capacitive potassium-ion storage: A superior anode material from silicon carbide-derived carbon with a well-developed pore structure. Adv Funct Mater, 2020; 30, 2004348. doi: 10.1002/adfm.202004348 [13] Lukatskaya MR, Halim J, Dyatkin B, et al. Room-temperature carbide-derived carbon synthesis by electrochemical etching of MAX phases. Angew Chem Int Ed, 2014; 53, 4877−80. doi: 10.1002/anie.201402513 [14] Zhao M, Sedran M, Ling Z, et al. Synthesis of carbon/sulfur nanolaminates by electrochemical extraction of titanium from Ti2SC. Angew Chem Int Ed, 2015; 54, 4810−4. doi: 10.1002/anie.201500110 [15] Fang YF, Yang XC, Chen T, et al. Two-dimensional titanium carbide (MXene)-based solid-state electrochemiluminescent sensor for label-free single-nucleotide mismatch discrimination in human urine. Sensor Actuat B Chem, 2018; 263, 400−7. doi: 10.1016/j.snb.2018.02.102 [16] Huang HS, Jiang X, Li NJ, et al. Noble-metal-free ultrathin MXene coupled with In2S3 nanoflakes for ultrafast photocatalytic reduction of hexavalent chromium. Appl Catal B:Environ, 2021; 284, 119754. doi: 10.1016/j.apcatb.2020.119754 [17] Li YB, Li M, Lu J, et al. Single-atom-thick active layers realized in nanolaminated Ti3(AlxCu1-x)C2 and its artificial enzyme behavior. ACS Nano, 2019; 13, 9198−205. doi: 10.1021/acsnano.9b03530 [18] Fashandi H, Dahlqvist M, Lu J, et al. Synthesis of Ti3AuC2, Ti3Au2C2 and Ti3IrC2 by noble metal substitution reaction in Ti3SiC2 for high-temperature-stable Ohmic contacts to SiC. Nat Mater, 2017; 16, 814−8. doi: 10.1038/nmat4896 [19] Chai JD, Head-Gordon M. Long-range corrected hybrid density functionals with damped atom-atom dispersion corrections. Phys Chem Chem Phys, 2008; 10, 6615−20. doi: 10.1039/b810189b [20] Weigend F, Ahlrichs R. Balanced basis sets of split valence, triple zeta valence and quadruple zeta valence quality for H to Rn: Design and assessment of accuracy. Phys Chem Chem Phys, 2005; 7, 3297−305. doi: 10.1039/b508541a [21] Lu T, Chen FW. Multiwfn: A multifunctional wavefunction analyzer. J Comput Chem, 2012; 33, 580−92. doi: 10.1002/jcc.22885 [22] Bader RFW, Henneker WH, Cade PE. Molecular charge distributions and chemical binding. J Chern Phys, 1967; 47, 3341−63. [23] Frisch MJ, Trucks GW, Schlegel HB, et al. Gaussian 16 (Revision B. 01). Wallingford, CT: Gaussian, Inc. , 2016. [24] Feng AH, Yu Y, Wang Y, et al. Two-dimensional MXene Ti3C2 produced by exfoliation of Ti3AlC2. Mater Des, 2017; 114, 161−6. doi: 10.1016/j.matdes.2016.10.053 [25] Fang YF, Liu ZC, Han JR, et al. High-performance electrocatalytic conversion of N2 to NH3 using oxygen-vacancy-rich TiO2 in situ grown on Ti3C2Tx MXene. Adv Energy Mater, 2019; 9, 1803406. doi: 10.1002/aenm.201803406 [26] Zhao Z, Yuan ZK, Fang ZS, et al. In situ activating strategy to significantly boost oxygen electrocatalysis of commercial carbon cloth for flexible and rechargeable Zn-Air batteries. Adv Sci, 2018; 5, 1800760. doi: 10.1002/advs.201800760 [27] Pan L, Wang YX, Hu H, et al. 3D self-assembly synthesis of hierarchical porous carbon from petroleum asphalt for supercapacitors. Carbon, 2018; 134, 345−53. doi: 10.1016/j.carbon.2018.04.008 [28] Xue Q, Zhang HJ, Zhu MS, et al. Photoluminescent Ti3C2 MXene quantum dots for multicolor cellular imaging. Adv Mater, 2017; 29, 1604847. doi: 10.1002/adma.201604847 [29] Ghassemi H, Harlow W, Mashtalir O, et al. In situ environmental transmission electron microscopy study of oxidation of two-dimensional Ti3C2 and formation of carbon-supported TiO2. J Mater Chem A, 2014; 2, 14339−43. doi: 10.1039/C4TA02583K [30] Hu MH, Korschelt K, Daniel P, et al. Fibrous nanozyme dressings with catalase-like activity for H2O2 reduction to promote wound healing. ACS Appl Mater Interfaces, 2017; 9, 38024−31. doi: 10.1021/acsami.7b12212 -
 21119Supplementary Materials.pdf

-

 点击查看大图
计量
- 文章访问数: 1202
- HTML全文浏览量: 444
- PDF下载量: 58
- 被引次数: 0


 Quick Links