

 下载:
下载:

-
Tuberculosis (TB), caused by Mycobacterium tuberculosis (MTB), is a chronic respiratory infection that remains the second leading cause of infectious disease-related mortality worldwide[1]. Despite significant advances in global TB control efforts, TB continues to present a substantial public health challenge[2,3]. Approximately one-quarter of the global population is estimated to be infected with MTB[1]. In 2022, there were 10.6 million new TB cases worldwide, with an incidence rate of 133 per 100,000 people, and 1.3 million TB-related deaths[1]. Given the ongoing burden of TB, identifying the factors that influence its occurrence and progression is essential for effectively advancing the World Health Organization’s “End TB Strategy”[4].
Increasing evidence suggests that environmental factors—including air pollution, meteorological conditions, and green space—play significant roles in the development and progression of TB[5–10]. Air pollution can exacerbate TB by impairing immune function and increasing oxidative stress and inflammation in the patient[11–13]. Meteorological factors may affect TB through mechanisms that influence the survival of MTB, or by altering human behavior and susceptibility[5]. Additionally, green space may mitigate TB transmission by enhancing air quality, encouraging physical activity, and improving the immune response[14,15].
Numerous studies have investigated the association between long-term (monthly and annual) and short-term (daily and weekly) exposure to meteorological factors and air pollution in patients with TB. However, findings remain inconsistent[5,6,8–10,16]. A meta-analysis demonstrated a significant positive correlation between rainfall and TB risk, whereas it showed no significant associations with temperature, humidity, air pressure, and sunshine duration[5]. Conversely, a study in Northwest China reported that temperature, rainfall, wind speed, and relative humidity significantly increased TB incidence[7]. A recent meta-analysis suggests that long-term exposure (> 7 weeks) to particulate matter ≤ 10 μm (PM10), sulfur dioxide (SO2), and nitrogen dioxide (NO2) is associated with a higher incidence of TB[9]. Another meta-analysis confirmed a positive association between TB incidence and exposure to particulate matter ≤ 2.5 μm (PM2.5), PM10, and SO2[16]. Thus, the association between air pollutants, meteorological factors, and TB incidence remains unclear.
Research on the relationship between green space and TB incidence is limited. One study found that increased exposure to green space reduced mortality among patients with MDR-TB in Zhejiang Province, China[17]. Additionally, an exosome-wide association study combined with machine learning revealed that higher proportions of forests, shrublands, and grasslands were associated with lower TB prevalence[7]. Considering the potential lagged effects of greenspace exposure on TB incidence, a time-series analysis may be an appropriate method to study this impact. However, to date, no such studies have been conducted.
Notably, there may be interactions among environmental factors[18-20]. The inconsistent conclusions regarding the association between environmental factors and TB incidence may be partly due to a failure to consider these interactions. Previous studies have explored the combined effects of environmental factors on mortality, cardiovascular diseases, hand-foot-and-mouth disease, and other illnesses[21-24]. However, the combined effects of air pollutants, meteorological factors, and greenspace interactions on TB incidence are not well established. Meteorological factors are crucial determinants of air pollutant concentrations[25]; for example, the wind speed can alter pollutant levels[25]. These factors may also exacerbate the impact of pollutants on TB incidence by affecting the patient; for example, temperature fluctuations may induce physiological stress, thereby modifying the body’s responses to toxins[26]. Additionally, growing evidence suggests that green space can reduce air pollution and regulate temperature[27-29]. This implies that potential interactions among air pollutants, meteorological factors, and green space exposure influence TB incidence. Further research is required to comprehensively understand the combined effects of environmental exposure and TB incidence.
This study, therefore, aimed to apply a time-series analysis to quantify and evaluate the independent and interactive effects of air pollutants, meteorological factors, and greenspace exposure on TB cases in Shanghai. We employed a method involving the multiplication of a cross-basis matrix with stratified terms to analyze the interactions across multiple classification levels, thereby capturing critical information regarding nonlinear and lagged effects. These results could provide robust scientific evidence to guide strategies for air pollution control, greenspace development, and TB prevention.
-
Shanghai, located between the latitudes of 30.40°–31.53° N and longitudes of 120.52°–122.12° E, covers an area of 6340.5 km². By the end of 2022, the city—which can be divided into 16 districts—had a permanent resident population of 24.76 million, with a density of 3,905 people per km² and a gross domestic product of 4.47 trillion Yuan[30]. Shanghai is situated in the Yangtze River Delta alluvial plain and has an average elevation of 4 m. The region experiences a subtropical monsoon climate with short springs and autumns, long winters and summers, abundant sunshine, and significant rainfall. In 2022, the air quality excellence rate was 87.1%[30]. This percentage represents the proportion of days classified as having “excellent” or “good” air quality, according to the Technical Regulation on Ambient Air Quality Index (on trial) (HJ 633-2012)[31].
-
In 2005, the Shanghai Center for Disease Control and Prevention established a TB surveillance system. We extracted data on patients with TB from this system between 2013 and 2018, including sociodemographic details (age, sex, race, occupation, household register, and current address), epidemiological information (patient source, severe case, and TB history), and laboratory results (sputum smear, sputum culture, and molecular test results). Active TB can develop shortly after initial exposure, or following a period of latent infection[32]. Our study included all newly diagnosed patients with TB in Shanghai, encompassing both primary and reactivated cases, and excluding patients whose current residence addresses were outside Shanghai. The diagnoses adhered to the national diagnostic criteria for TB[33], with cases defined as bacteriologically confirmed (positive sputum smear, sputum culture, or molecular test) or clinically diagnosed (initiated TB treatment without bacteriological confirmation). The clinical visit time, defined as the first visit following symptom onset, was used in this study instead of the symptom onset date because the latter is often based on patient recall and may be inaccurate. Accordingly, many studies examining the impact of environmental factors on TB risk have relied on the clinical visit time[34,35].
Residential addresses were geocoded using the Gaode Map Application Programming Interface (Gaode, AutoNavi Software Co., Ltd., Beijing, China), and addresses unsuitable for batch geocoding were manually corrected and geocoded. Geocoded TB case data were subsequently mapped onto a vector map of Shanghai, using ArcMap 10.7 (Esri, Redlands, California, United States). The spatial density distributions of the reported TB cases from 2013 to 2018 were analyzed using kernel density estimation (KDE). Additionally, we performed a classical multiplicative decomposition of the time series for weekly TB cases, from 2013 to 2018, to assess periodic and seasonal variations[36].
-
Daily air pollutant data were obtained from the China High Air Pollutants dataset[37–48] for the study period in Shanghai, provided by the National Tibetan Plateau Data Center (http://data.tpdc.ac.cn). Weekly averages for PM2.5, PM10, NO2, SO2, ozone (O3), and carbon monoxide (CO) were calculated. Spatial resolutions were as follows: PM2.5, PM10, and O3 at 1 km; NO2, SO2, and CO at 10 km. These pollutants were predicted with high accuracy based on a moderate-resolution imaging spectroradiometer multi-angle aerosol optical depth product, meteorological data, land-use information, and emission sources[37–48].
Daily meteorological data with a spatial resolution of 10 km were sourced from the China Meteorological Forcing Dataset[49–51], also provided by the National Tibetan Plateau Data Center (http://data.tpdc.ac.cn). Weekly averages were calculated for the temperature, air pressure, relative humidity, solar radiation, rainfall, and wind speed. The heat index, which integrates temperature and humidity to reflect the perceived human comfort[52], was calculated using the following Formula 1:
$$ \begin{array}{c}{h}{e}{a}{t}\;{i}{n}{d}{e}{x}=\left\{\begin{array}{c}{1.8}{{T}}_{{max}}-{0.55}\left({1.8}{{T}}_{{max}}-{26}\right) \times \left({1}-{0.6}\right)+{32}\left({relative \;humidity}{}\leqslant {60\%}\right)\\ {1.8}{{T}}_{{max}}-{0.55}\left({1.8}{{T}}_{{max}}-{26}\right) \times \left({1}-{relative\; humidity}\right)+{32}\left({relative \;humidity}{}{ > }{}{60\%}\right)\end{array}\right.\end{array} $$ (1) Tmax is the maximum daily temperature in degrees Celsius.
To assess greenspace exposure, daily normalized difference vegetation index (NDVI) data with a spatial resolution of 0.05° (approximately 5.5 km) were obtained from the public platform Figshare (https://figshare.com/)[53]. NDVI, a crucial indicator of vegetation density, is based on the principle that chlorophyll absorbs visible light for photosynthesis and reflects near-infrared light. The NDVI was calculated as the ratio of the difference between near-infrared and red visible light reflectance to their sum, ranging from −1 to 1, with higher values indicating denser vegetation[54].
To estimate the environmental exposure of each participant residing in Shanghai, weekly averages of environmental data (air pollutants, meteorological factors, and NDVI) for all grids within the administrative boundaries of Shanghai were calculated.
-
The research framework is illustrated in Supplementary Figure S1. Initially, the distributions of TB cases, air pollutants, meteorological factors, and NDVI were characterized using frequency distributions, means, percentiles, and time-series plots. Subsequently, we investigated the associations between air pollutants, meteorological factors, NDVI, and the number of new weekly TB cases using quasi-Poisson regression, combined with a distributed-lag nonlinear model (DLNM). Third, subgroup analyses by age, sex, and household register were conducted to explore differential effects. Subsequently, the interaction terms among the environmental variables were included in the model to evaluate their combined influence on TB cases. Finally, a sensitivity analysis was performed to assess the robustness of the results.
-
Recognizing the latency and nonlinear exposure–response relationships of ambient air pollutants and meteorological factors on TB cases, as demonstrated in numerous epidemiological studies[55-58], we utilized a quasi-Poisson regression combined with DLNM to evaluate these associations and their lag effects. To mitigate multicollinearity, Spearman’s correlation coefficient was used to examine relationships among environmental factors, excluding factors with a correlation coefficient ∣r∣ ≥ 0.7 from the model[59]. Single-factor regression models were then developed for each environmental factor. The model is specified as follows Formula 2:
$$ \begin{aligned} {log}\left[{E}\left({{Y}}_{{t}}\right)\right]= & {b+}{\sum }_{{p=0}}^{{n}}{{β}}_{{p}}{{X}}_{{t}-{p}}+\sum {ns}\left({{Z}}_{{i}}{,}{{df}}_{{1}}\right)+\\ & {ns}\left({time,}{{df}}_{{2}}\right)+\beta {Holiday} \end{aligned} $$ (2) where, E(Yt) represents the expected number of new TB cases in week t, b is the intercept term, and X is the weekly average of a specific environmental factor. βp represents the effect estimate of the cross-basis matrix for environmental factors, with a natural cubic spline(ns) as the basis function in both the exposure–response and exposure-lag dimensions, each with 3 degrees of freedom (df)[60,61]. The maximum lag time, n, was determined based on the Quasi-Akaike Information Criterion (QAIC)[35]. The natural cubic spline function ns. () was used to adjust for the confounding effects of other environmental factors Zi. Long-term trends and seasonality were controlled for using ns (time, df2) with 6 degrees of freedom[57,62,63]. The holiday refers to the number of public holidays in a week, with the regression coefficient β representing its effect. To identify vulnerable subpopulations, stratified analyses were performed according to sex (male and female), age (15–65 years and > 65 years), and household register (migrant or resident). Owing to the low proportion of individuals in the 0–14 year age group (0.41%), this group was excluded from the subgroup analysis. TB risk was expressed as the lag-specific and cumulative-lag TB relative risk (RR) with 95% confidence intervals (CI) for an interquartile range (IQR) increase in environmental variables, referenced to their median levels.
-
To examine the interactive effects of air pollutants, meteorological factors, and greenspace exposure on TB cases, we performed interaction analyses. Meteorological variables and NDVI were categorized into three quartiles: low (< 25%), median (25%–75%), and high (> 75%). This model incorporated interaction terms between the cross-basis matrix of air pollutant variables and the strata of meteorological variables or NDVI, to evaluate the effects of air pollutant variables at different levels of meteorological variables or NDVI[21]. Similarly, air pollutant variables and NDVI were divided into quartiles to assess the effects of meteorological variables on different levels of air pollutants or NDVI. For instance, to evaluate how varying levels of temperature influence the relationship between PM2.5 and TB cases, the model is specified as follows Formula 3:
$$ \begin{aligned} {log}\left[{E}\left({{Y}}_{{t}}\right)\right]= & {b+cb}\left({{PM2.5}}_{{t}}\right){+cb}\left({{PM2.5}}_{{t}}\right) \times \\ &{{temperature}}_{{t}}+\sum {ns}\left({{Z}}_{{i}}{,}{{df}}_{{1}}\right)+\\ &{ns}\left({time,}{{df}}_{{2}}\right) +\beta {Holiday} \end{aligned} $$ (3) -
These analyses aimed to assess the robustness of the model. They involved adjusting the maximum lag time, varying the degrees of freedom for confounding environmental variables between 2 and 4, and incorporating additional air pollutants or meteorological factors to construct multi-pollutant and multi-meteorological models.
The threshold of significance was set at P < 0.05. All statistical analyses were primarily conducted using the “dlnm”, “spline”, and “mgcv” packages in R, version 4.4.1 (R Foundation for Statistical Computing, Vienna, Austria).
-
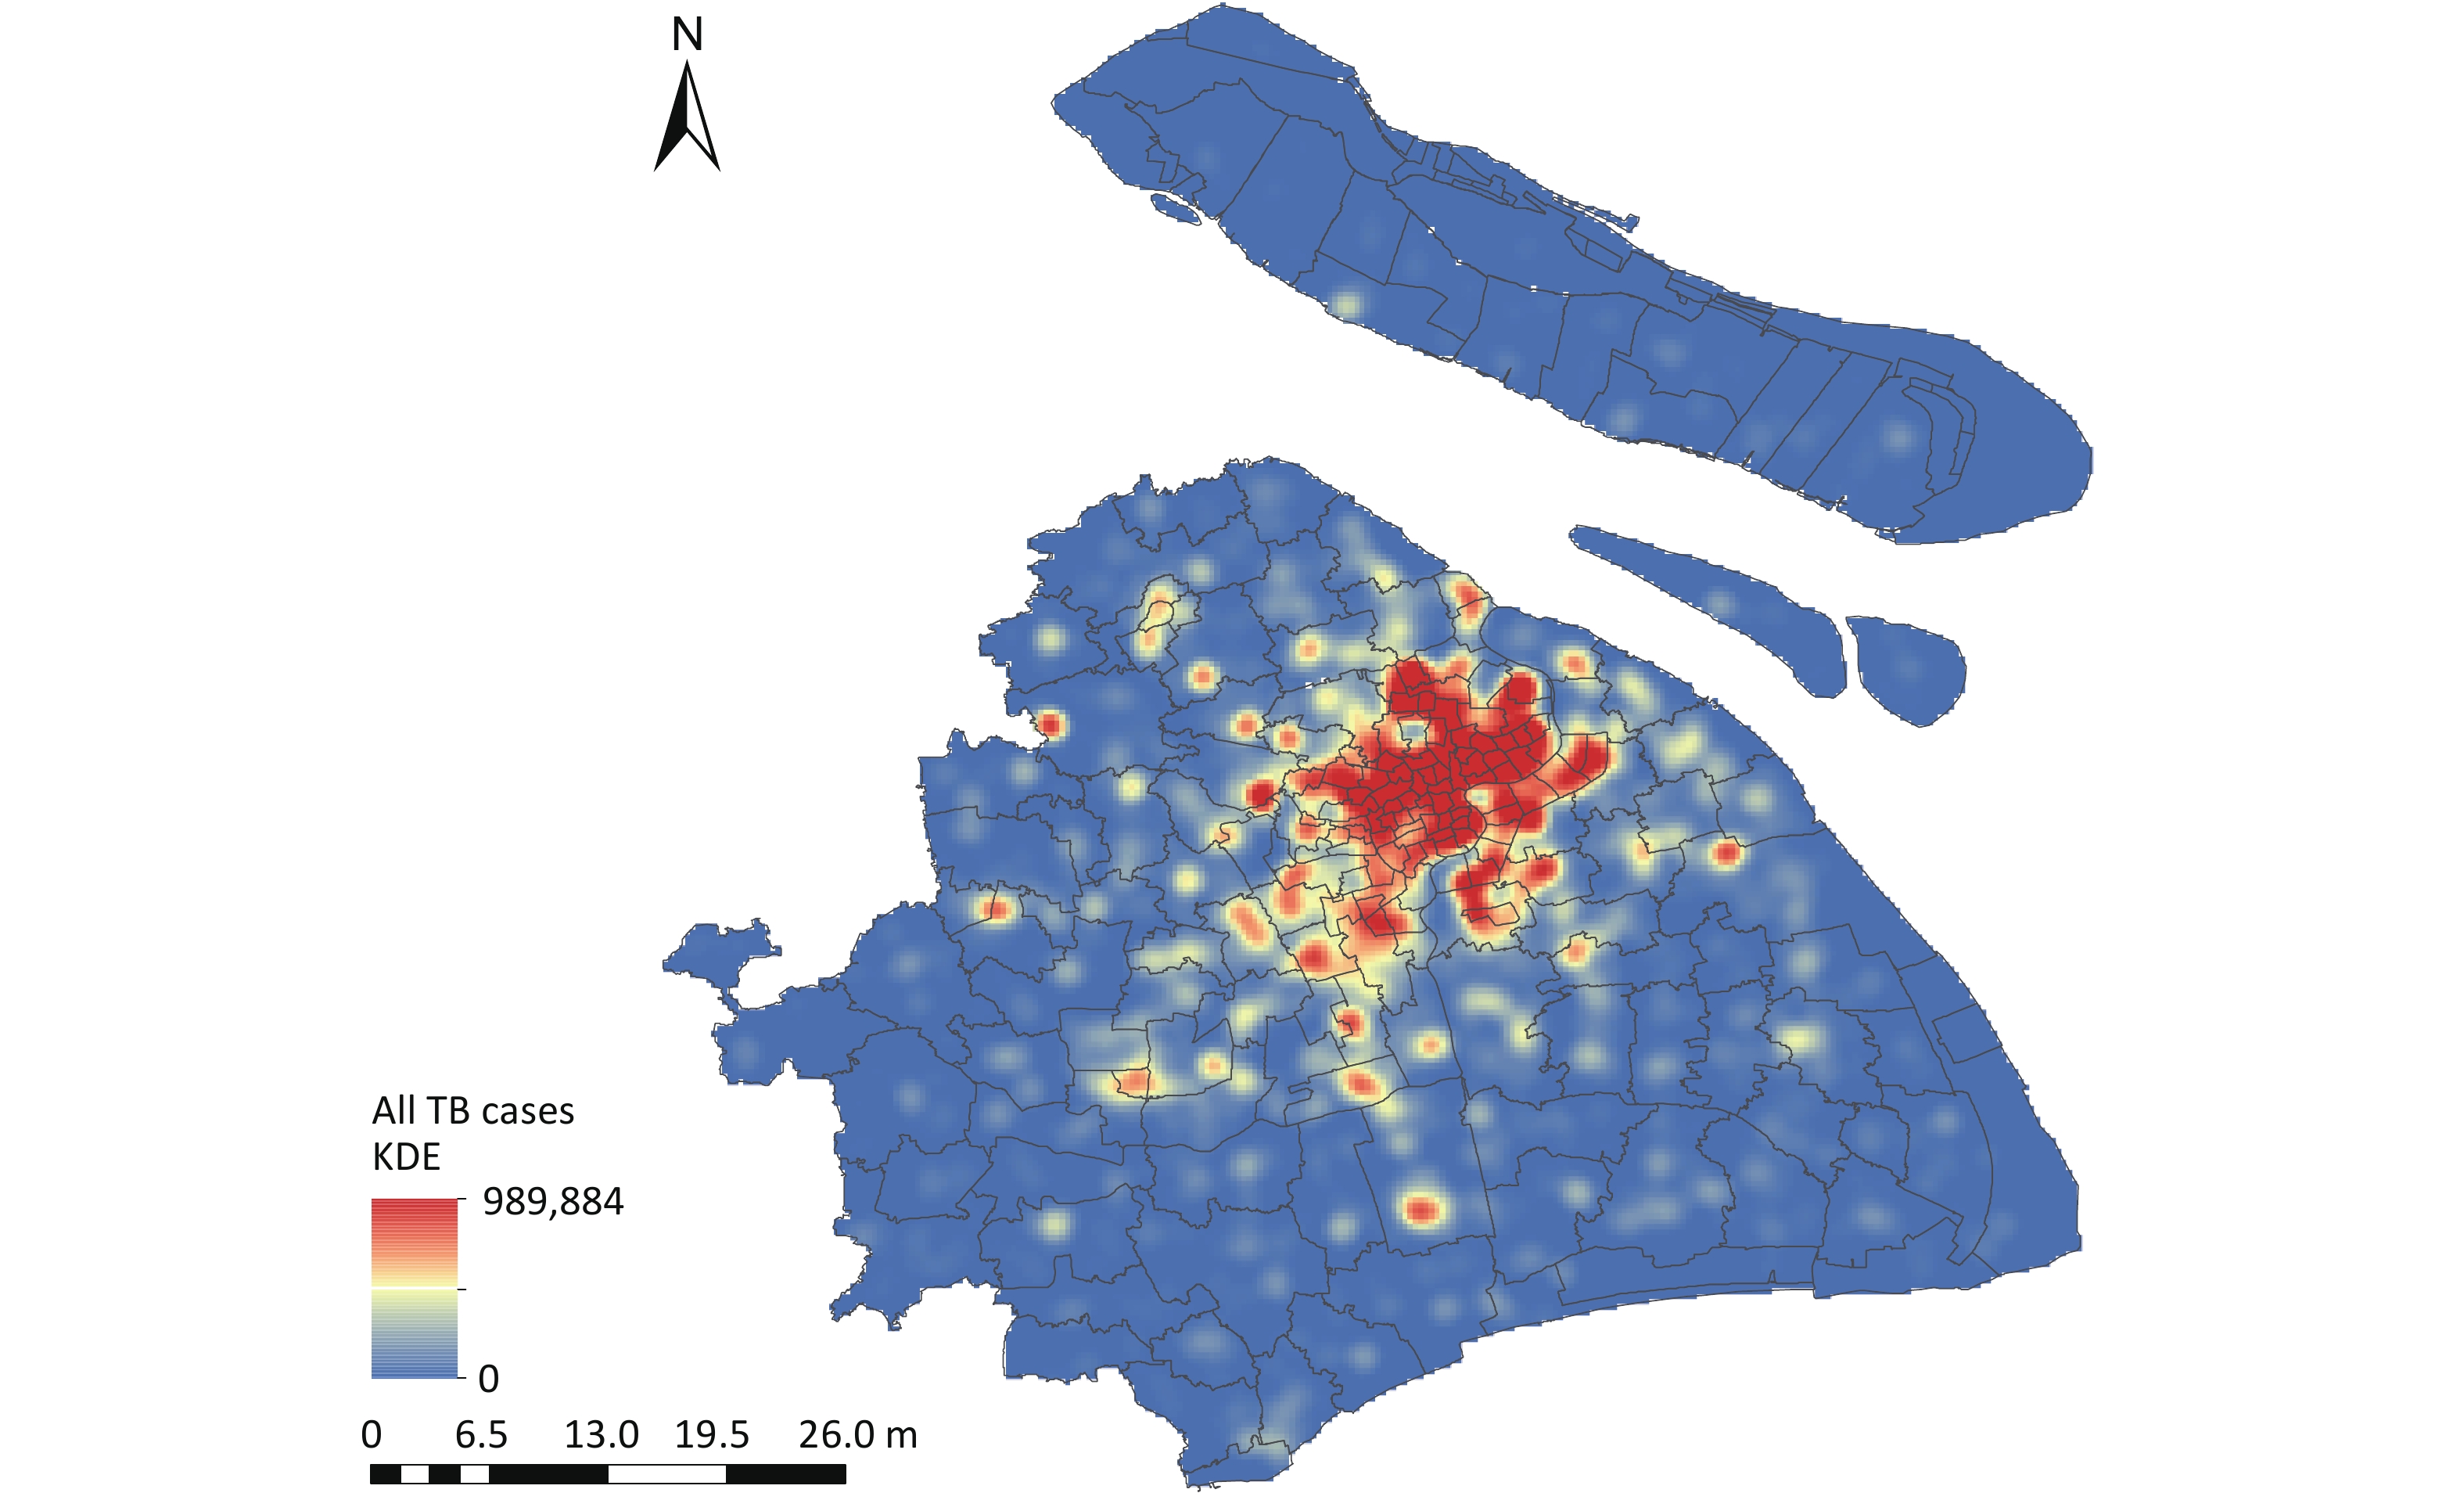
Overall, 39,579 TB cases were reported in Shanghai between 2013 and 2018 (Table 1). The spatial KDE of TB cases (Figure 1) revealed that the highest estimated density values were concentrated in the central districts of Shanghai, including Huangpu, Xuhui, and Jing'an. Among the reported cases, 68.60% were male, 82.48% were aged 15–65 years, and the bacteriological positivity rate was 47.26%. As shown in Table 2, the average weekly number of new active TB cases was 126.60. Supplementary Figure S2 illustrates a declining trend in weekly TB cases, accompanied by clear seasonal and cyclical patterns. During the study period, the weekly air pollutant levels, meteorological factors, and NDVI in Shanghai showed cyclical changes (Supplementary Figure S3). Table 2 also reveals that the mean concentrations of PM2.5 and PM10 exceeded the national air quality class II standards (GB3095–2012), with values above 35 μg/m3 and 70 μg/m3, respectively.
Table 1. Characteristics of new TB cases in Shanghai, 2013–2018 (N = 39,579)
Characteristics N (%) Age, median years (IQR) 42 (27, 60) Age group (years) 0–14 161 (0.41) 15–65 32,643 (82.48) > 65 6,775 (17.12) Sex Male 27,150 (68.60) Female 12,429 (31.40) Race Han nationality 39,320 (99.35) Ethnic minority 256 (0.65) Unclear 3 (0.01) Occupation Labor worker 5,757 (14.55) Farmer 1,622 (4.10) Commercial service 1,799 (4.55) Medical staff 230 (0.58) Teacher and student 1,943 (4.91) Office worker 1,613 (4.08) Retired 9,399 (23.75) Unemployed 5,304 (13.40) Unclear 3,524 (8.90) Other 8,388 (21.19) Household register Migrant patients 17,022 (43.01) Resident patients 22,301 (56.35) Unclear 256 (0.65) Severe case No 32,248 (81.48) Yes 7,331 (18.52) TB history New case 36,073 (91.14) Retreated case 3,506 (8.86) Patient source Active screening 1,210 (3.06) Passive screening 38,369 (96.94) Pathogen result Positive 18,704 (47.26) Negative 19,468 (49.19) Unknown 1,407 (3.55) Note. IQR, interquartile range; TB, tuberculosis; N, number. 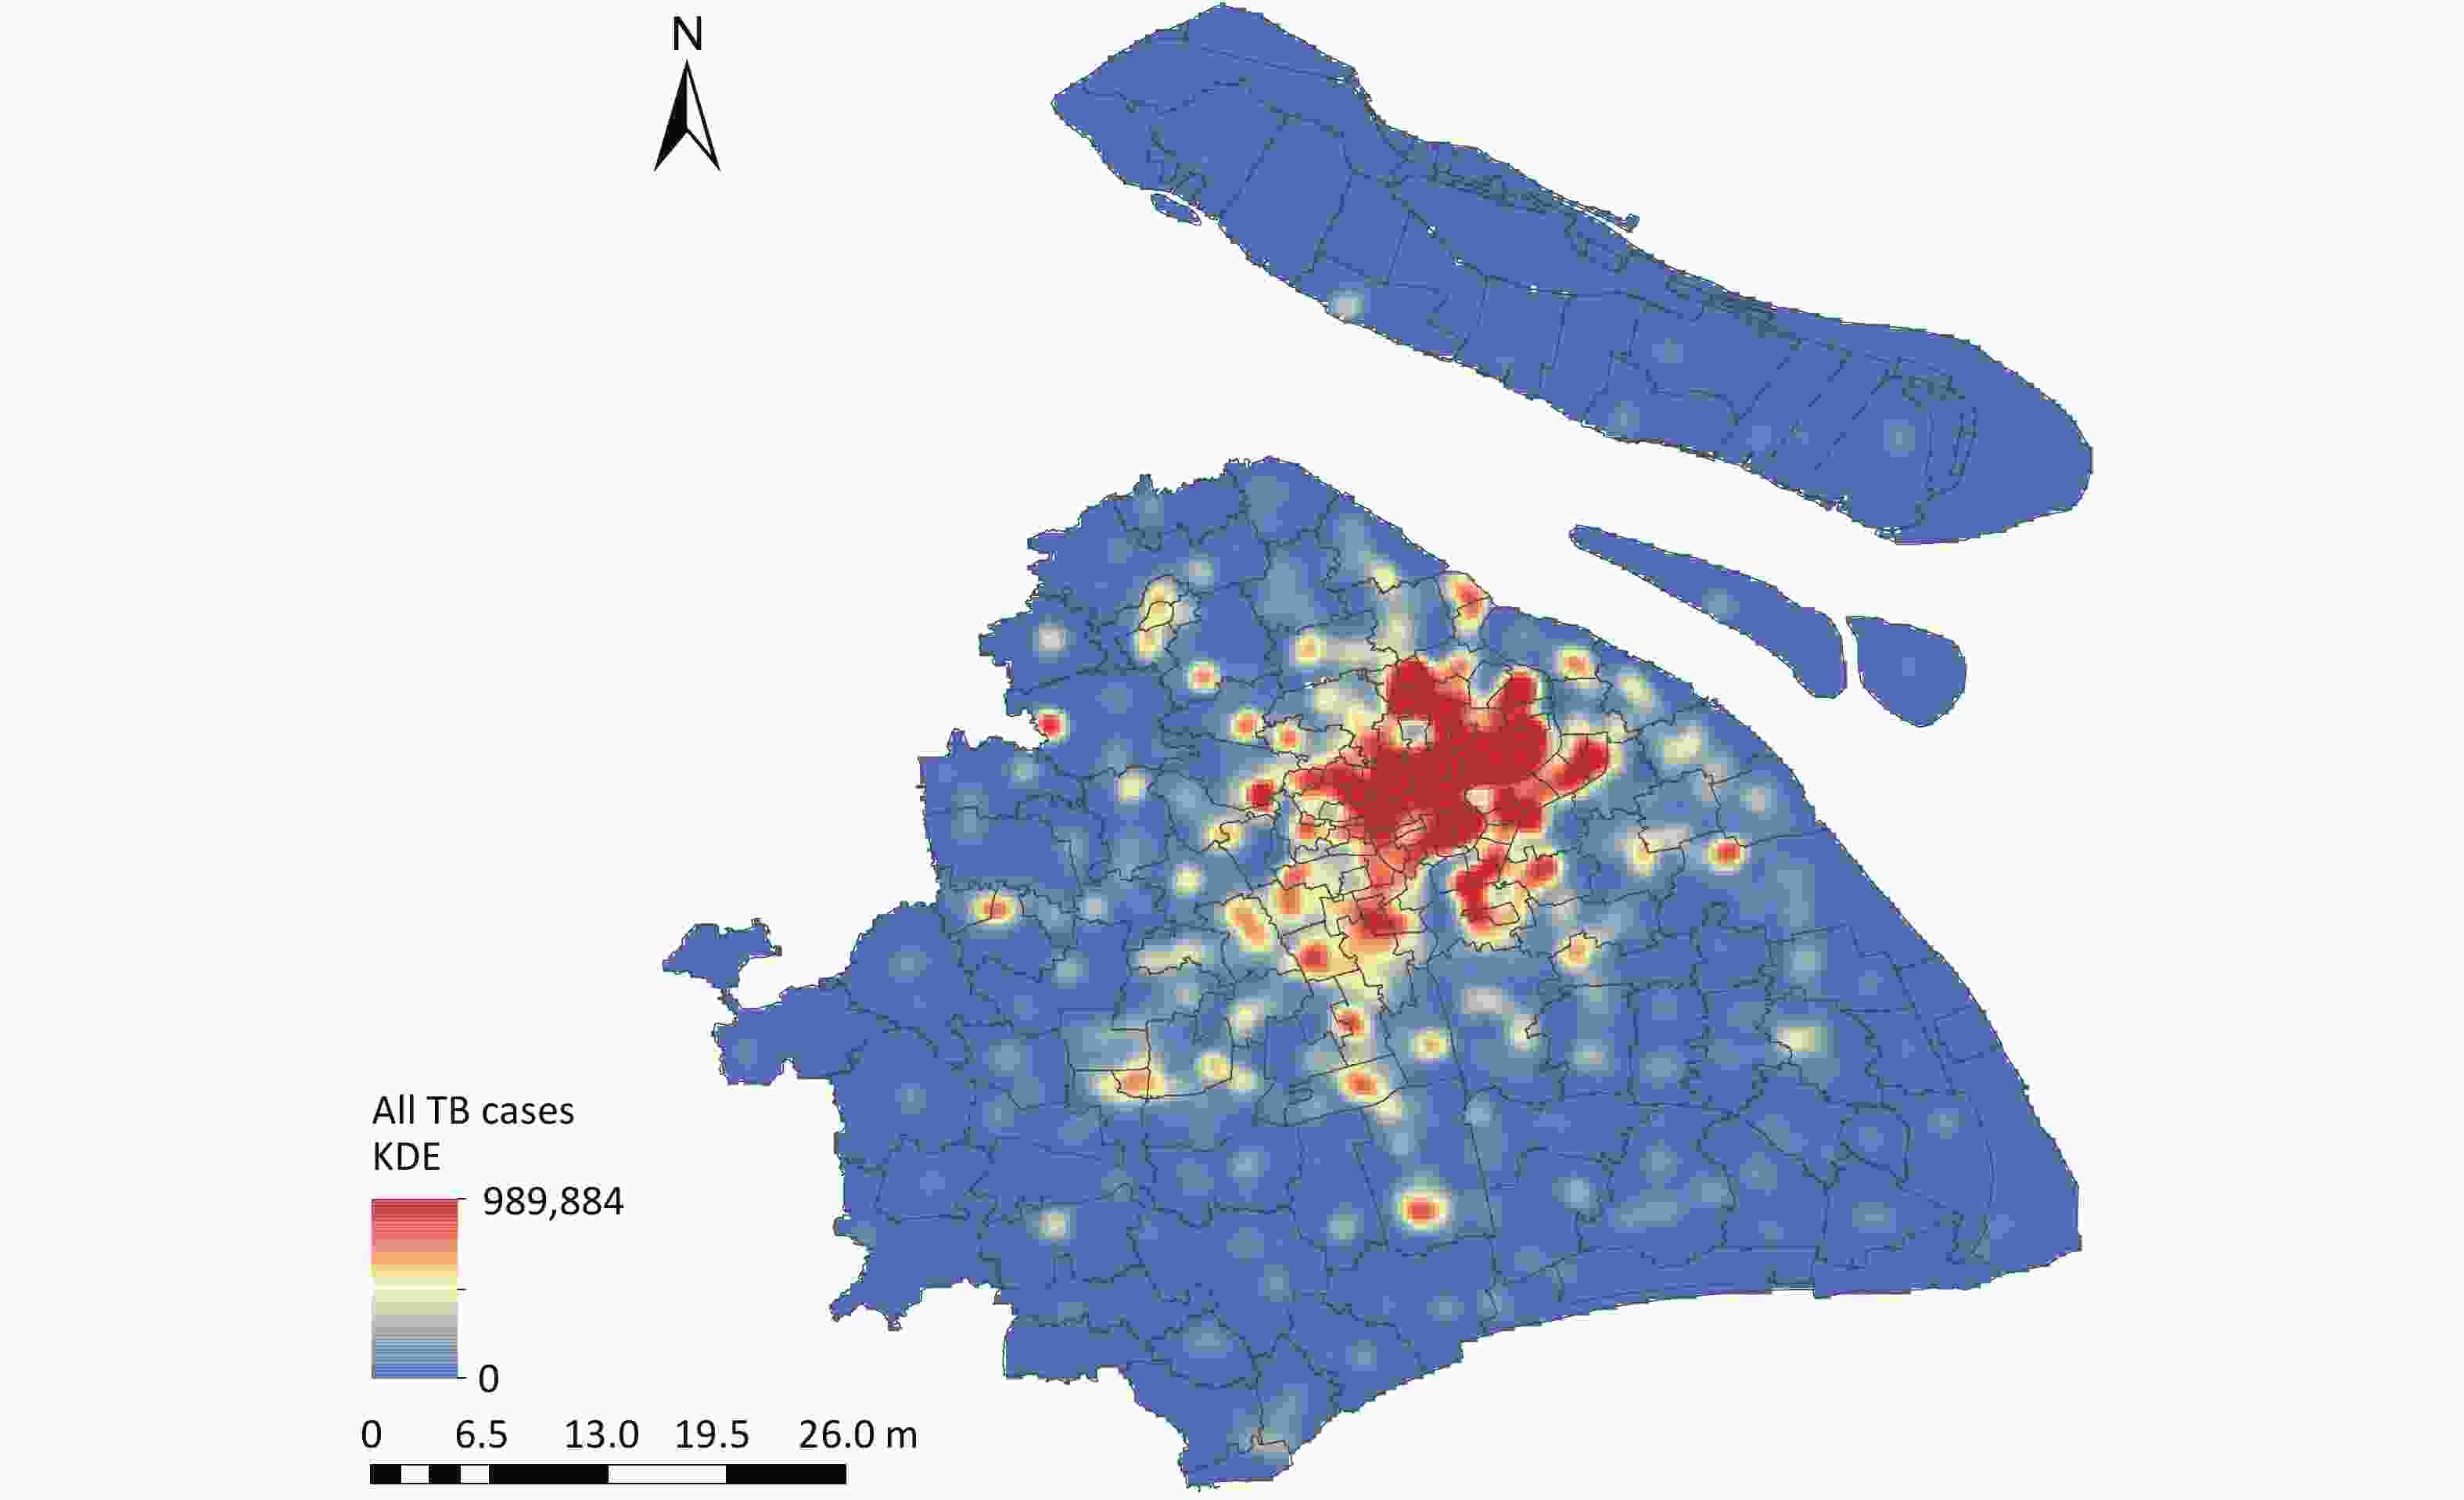
Figure 1. Spatial KDE of Tuberculosis Cases in Shanghai, 2013–2018. TB, tuberculosis; KDE, kernel density estimation. Map Approval No. GS(2024)0650.
Table 2. Distribution characteristics of weekly TB cases, air pollutants, meteorological factors, and NDVI in Shanghai during 2013–2018
Characteristic Mean ± SD Min P25 Median P75 Max TB cases 126.60 ± 24.00 21.00 116.00 129.00 143.00 176.00 Air pollutant PM10 (μg/m3) 74.48 ± 29.10 28.12 53.61 69.57 87.27 249.04 PM2.5 (μg/m3) 46.88 ± 21.35 11.68 33.08 43.44 56.40 188.60 SO2 (μg/m3) 18.88 ± 8.69 6.98 12.94 16.67 21.92 57.20 NO2 (μg/m3) 39.89 ± 12.97 13.91 30.98 38.05 46.94 86.58 CO (mg/m3) 0.85 ± 0.32 0.44 0.70 0.81 0.94 5.22 O3 (μg/m3) 102.13 ± 31.39 44.61 77.14 101.11 123.60 210.89 Meteorological factor Temperature (°C) 17.40 ± 8.64 −0.84 9.93 18.17 24.33 34.74 Air pressure (kPa) 101.63 ± 0.84 100.12 100.85 101.64 102.33 103.40 Wind speed (m/s) 2.94 ± 0.60 1.74 2.51 2.85 3.29 5.10 Relative humidity (%) 75.15 ± 9.00 48.29 68.99 76.14 81.50 93.84 Heat index 67.90 ± 13.48 38.39 56.60 69.89 78.38 92.93 Solar radiation (MJ/m2) 87.85 ± 34.79 13.43 61.53 84.35 114.16 177.70 Rainfall (mm) 26.69 ± 30.27 0.00 4.72 17.27 38.00 212.12 NDVI 0.40 ± 0.09 0.20 0.32 0.39 0.48 0.56 Note. NDVI, normalized difference vegetation index; CO, carbon monoxide; O3, ozone; SO2, sulfur dioxide; NO2, nitrogen dioxide; PM2.5, particulate matter < 2.5 μm in aerodynamic diameter; PM10, particulate matter < 10 μm in aerodynamic diameter; TB, tuberculosis; SD, standard deviation; P25, 25th percentile; P75, 75th percentile The results of the Spearman's correlation analysis between the environmental factors are provided in Supplementary Table S1. The weekly mean temperature, heat index, and NDVI were significantly and positively correlated, whereas air pressure was negatively correlated with the temperature, heat index, and NDVI. In addition, the weekly average CO concentration was positively correlated with NO2, SO2, PM2.5, and PM10. To mitigate the risk of multicollinearity in the analysis, variables with a correlation coefficient ∣r∣ ≥ 0.7 were excluded from the models.
-
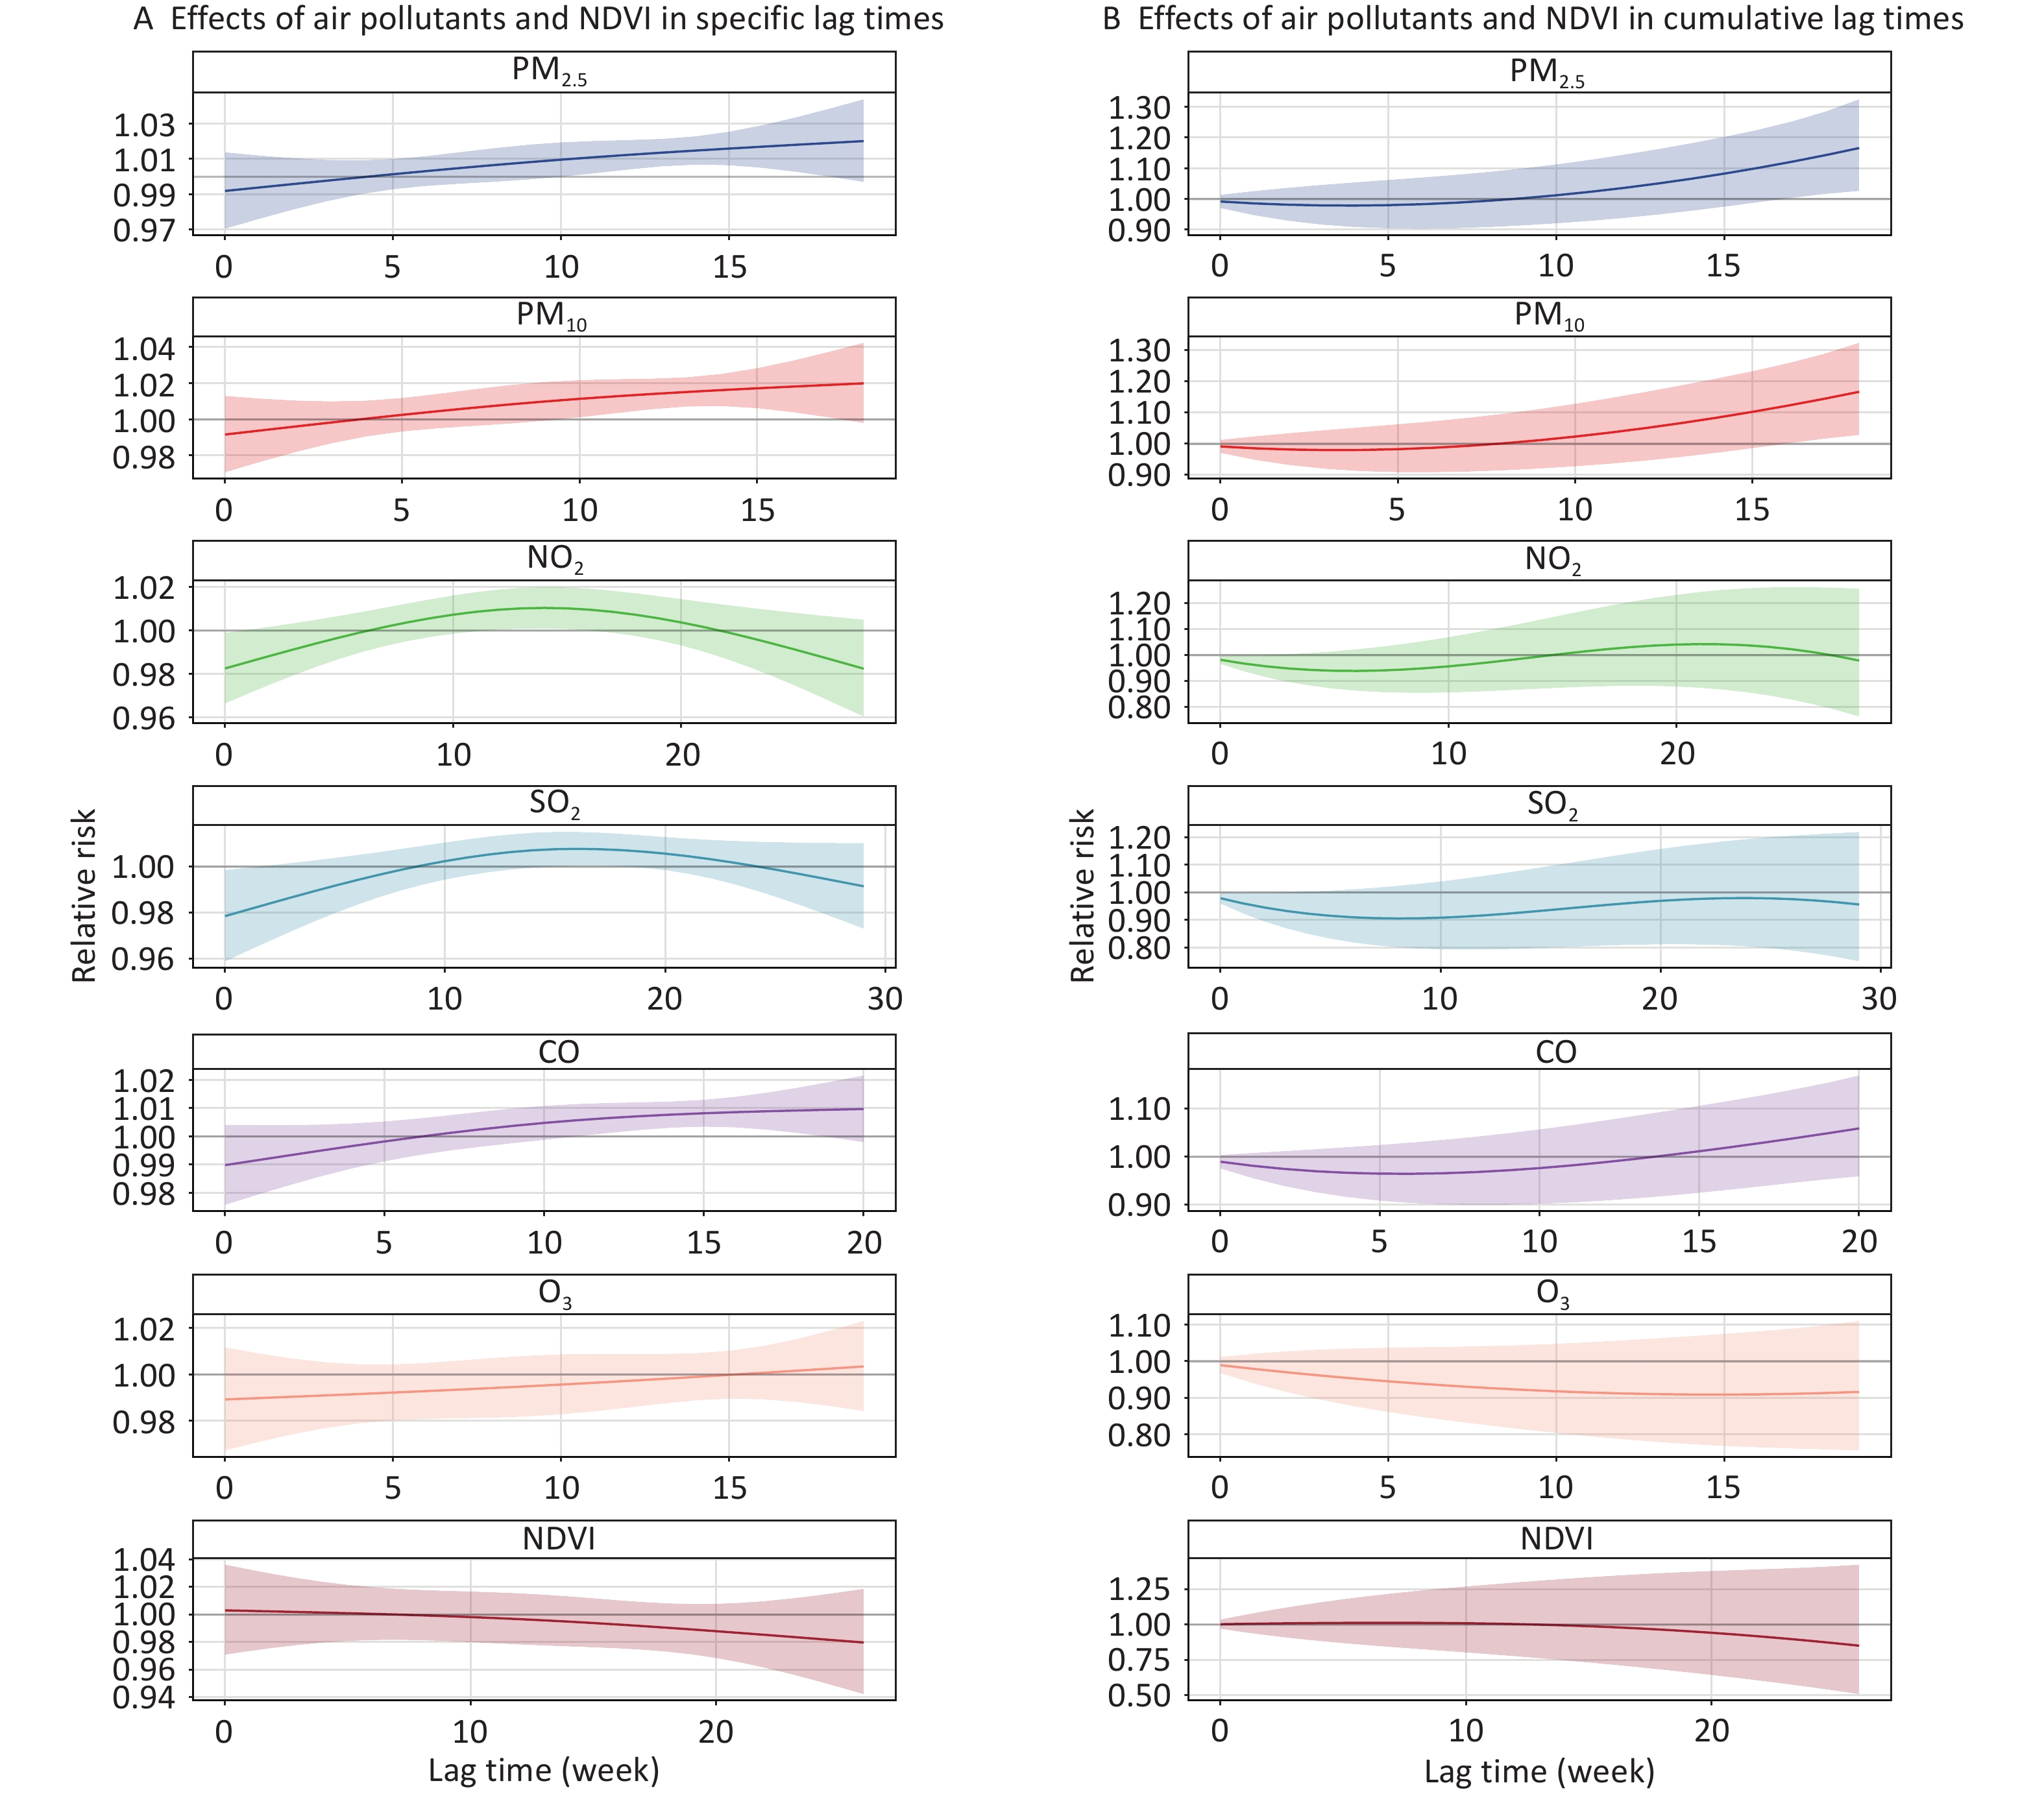
Figure 2 illustrates the lag effects of air pollutants and NDVI on the risk of TB with an increase in IQR, with reference to the median in the single-factor models. PM2.5 and PM10 were positively correlated with TB risk, whereas NO2 and SO2 were negatively correlated. The cumulative risk of TB was associated with PM2.5 exposure from lag 0–17 weeks (RR = 1.122, 95% CI: 1.004–1.253) to lag 0–19 weeks (RR = 1.166, 95% CI: 1.026–1.325). PM10 exposure increased the cumulative risk of TB from lag 0–16 weeks (RR = 1.123, 95% CI: 1.001–1.259) to lag 0–18 weeks (RR = 1.167, 95% CI: 1.028–1.324). For NO2, the negative association was statistically significant from lag 0 week (RR = 0.983, 95% CI: 0.966–0.999) to lag 0–1 week (RR = 0.968, 95% CI: 0.938–0.999). SO2 exposure from lag 0 week (RR = 0.979, 95% CI: 0.959–0.999) to lag 0–2 weeks (RR = 0.945, 95% CI: 0.894–0.999) was associated with decreased cumulative risk of TB. Additionally, the cumulative-lag risks of CO, O3, and NDVI on TB cases were not statistically significant (Supplementary Tables S2–S4).
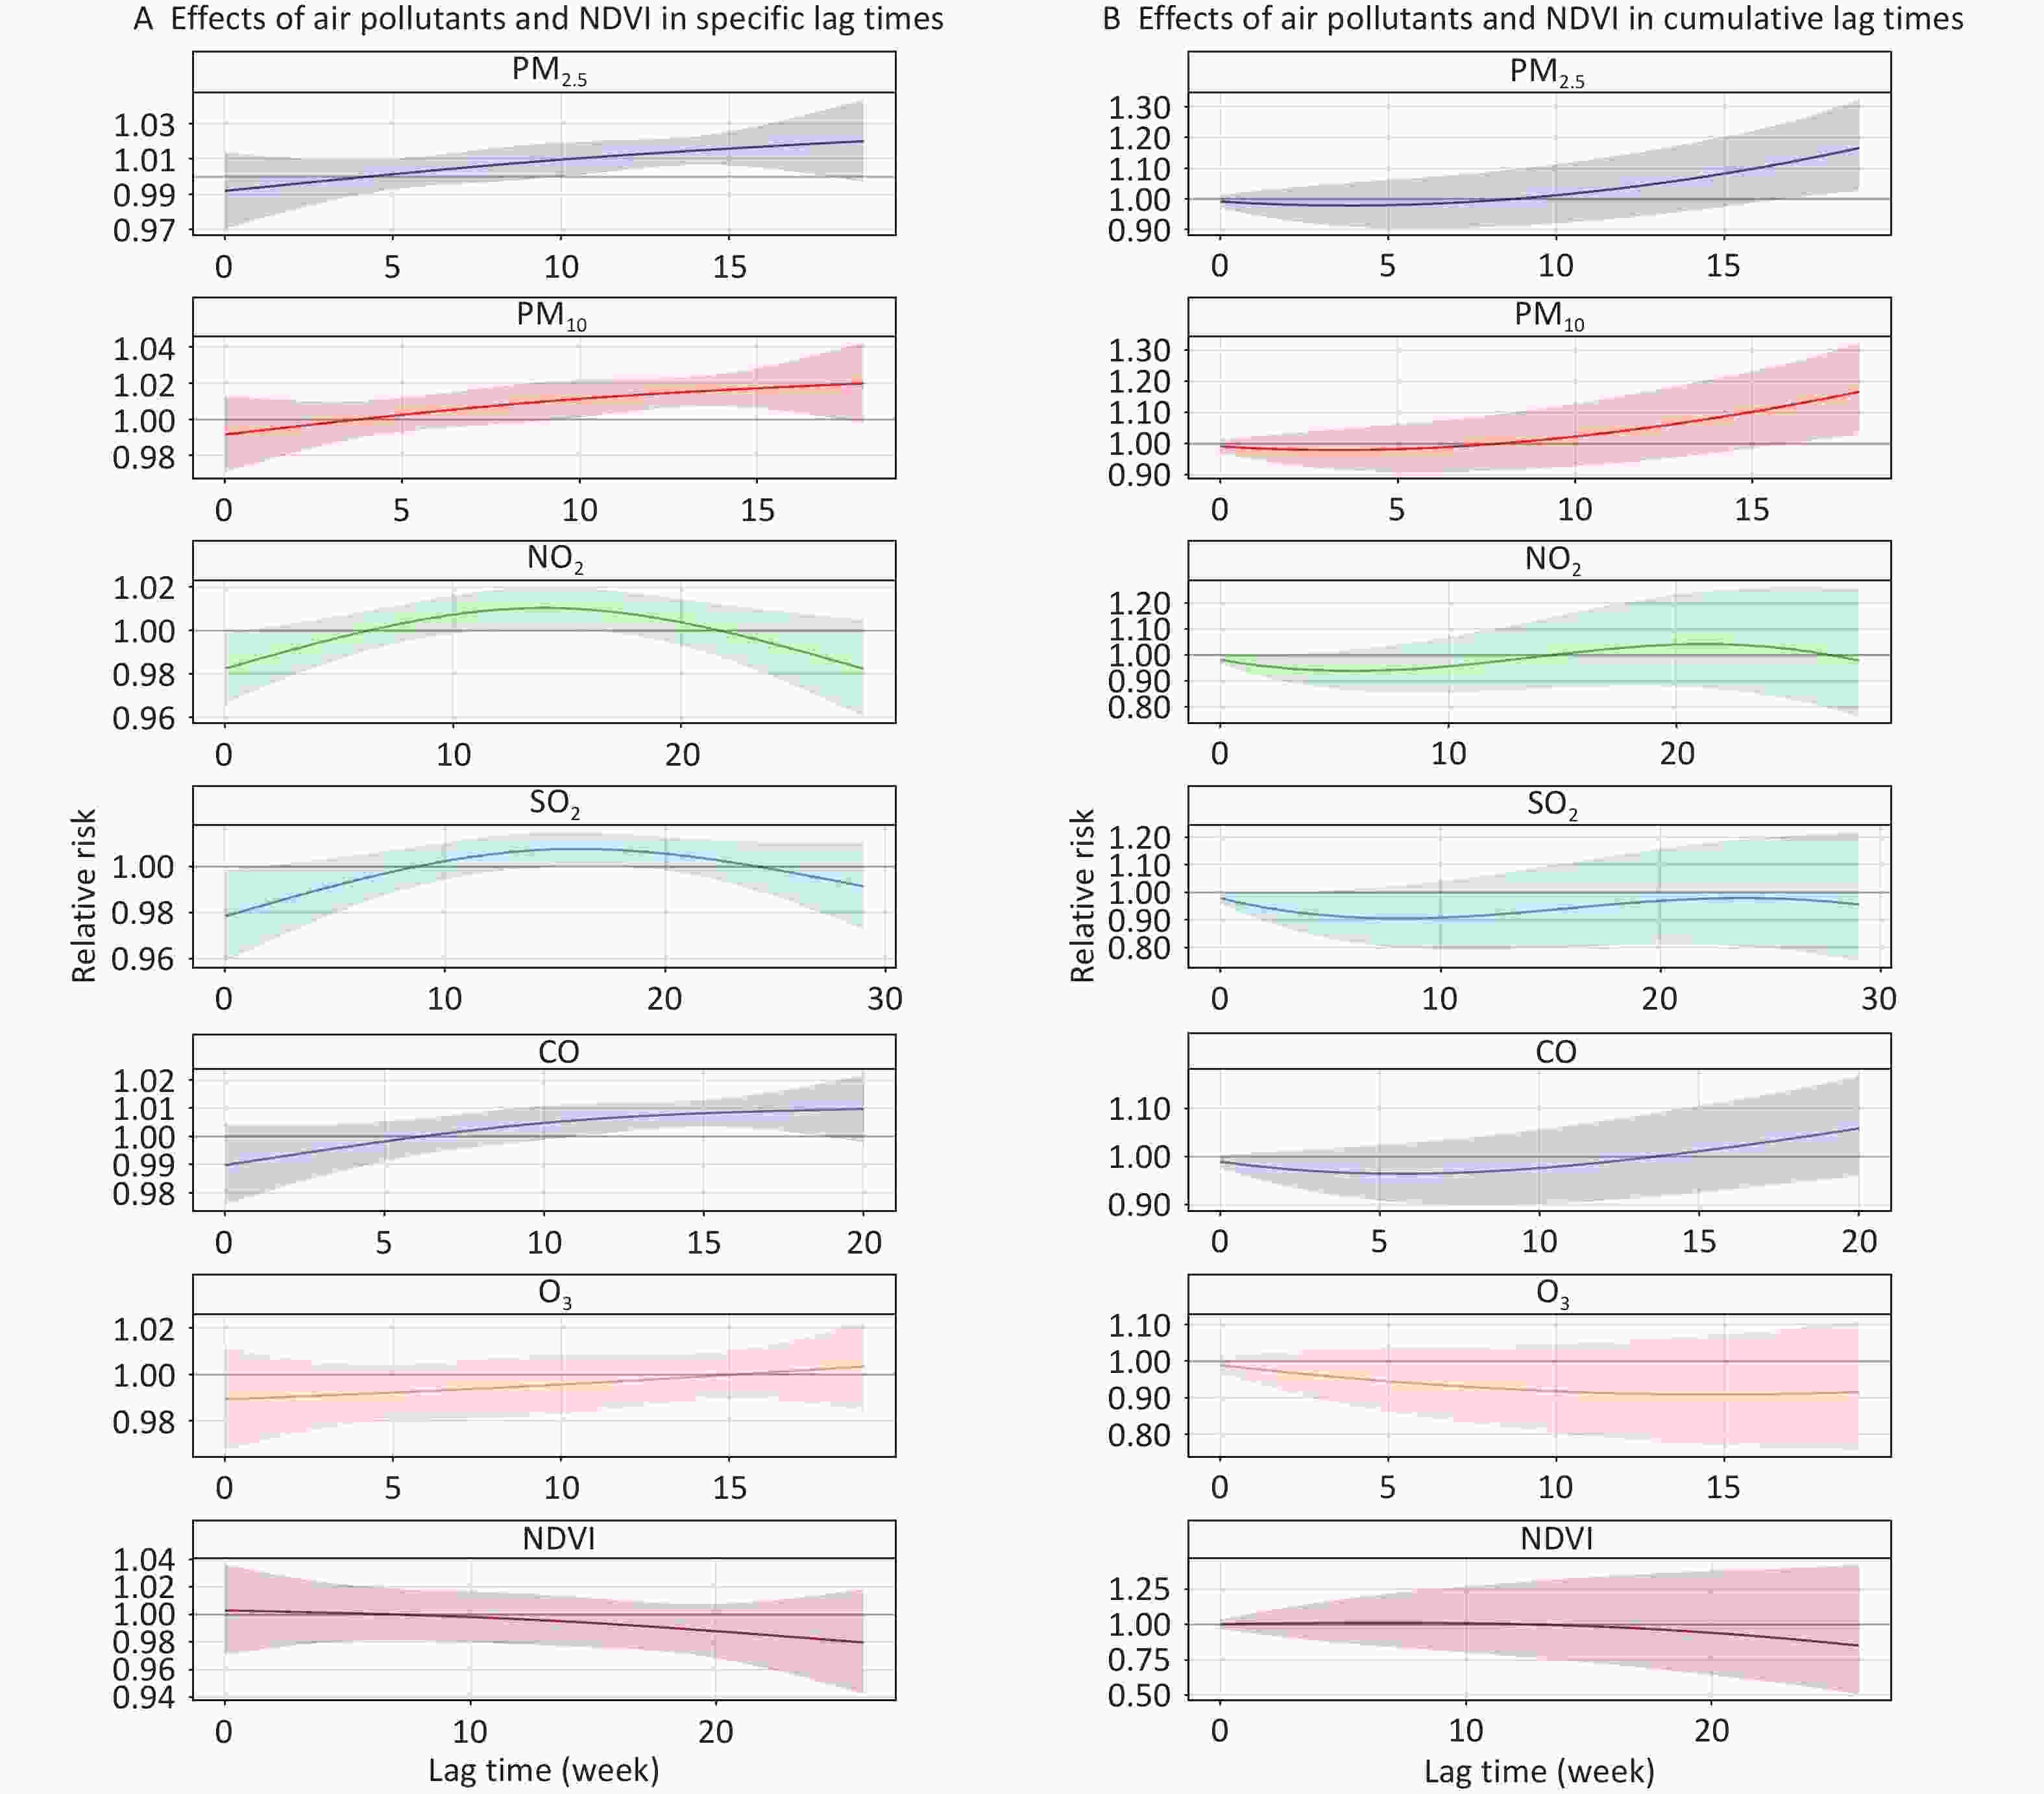
Figure 2. Effects of air pollutants and NDVI on risk of TB in specific and cumulative lag times in single-factor models. The solid line represents the central estimates and the envelopes represent 95% confidence intervals. CO, carbon monoxide; O3, ozone; SO2, sulfur dioxide; NO2, nitrogen dioxide; PM2.5, particulate matter ≤ 2.5 μm in aerodynamic diameter; PM10, particulate matter ≤ 10 μm in aerodynamic diameter; NDVI, normalized difference vegetation index; TB, tuberculosis.
-
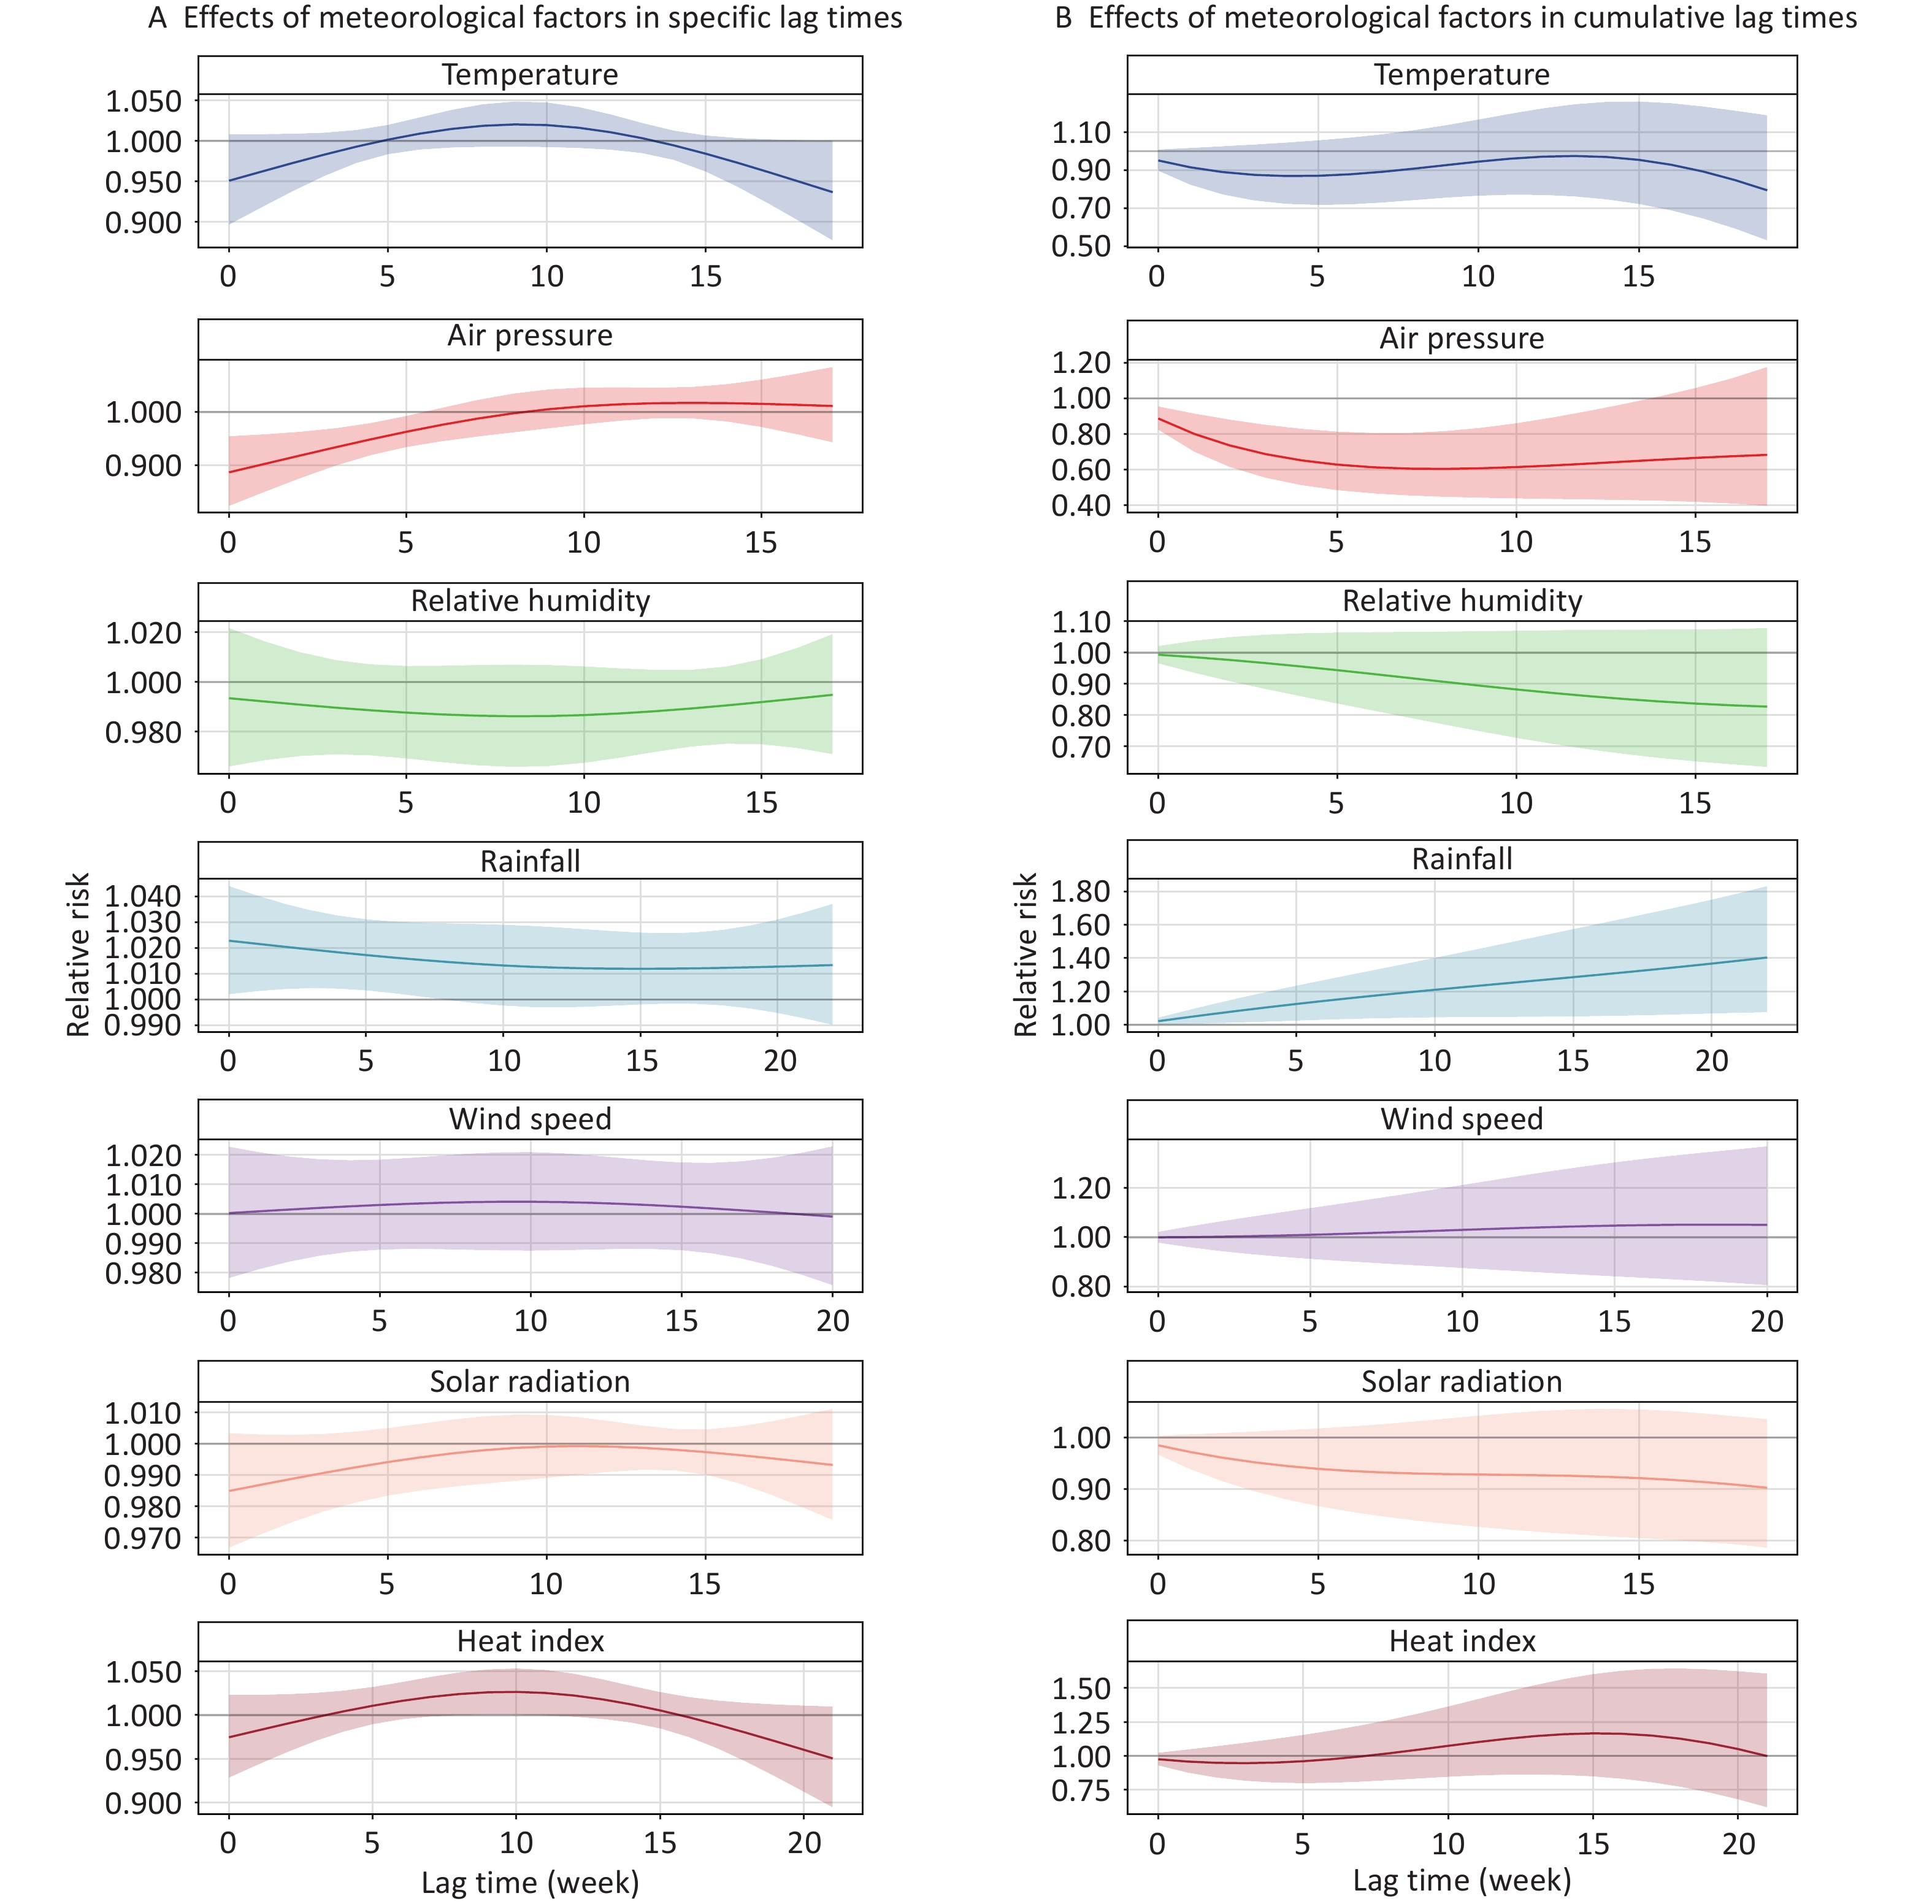
Figure 3 shows the lag effects of meteorological factors on the risk of TB cases with an increase in IQR, with reference to the median in the single-factor models. Rainfall was positively associated with TB risk, whereas air pressure was negatively associated with it. The cumulative risk of TB was linked to rainfall exposure from lag 0 week (RR = 1.023, 95% CI: 1.002–1.044) to lag 0–22 weeks (RR = 1.404, 95% CI: 1.076–1.833). For air pressure, a significant negative association was observed between lag 0 week (RR = 0.887, 95% CI: 0.824–0.955) and 0–13 weeks (RR = 0.645, 95% CI: 0.429–0.969). There were no significant associations between temperature, relative humidity, wind speed, heat index, solar radiation, and TB cases in cumulative lag times (Supplementary Tables S5–S6).
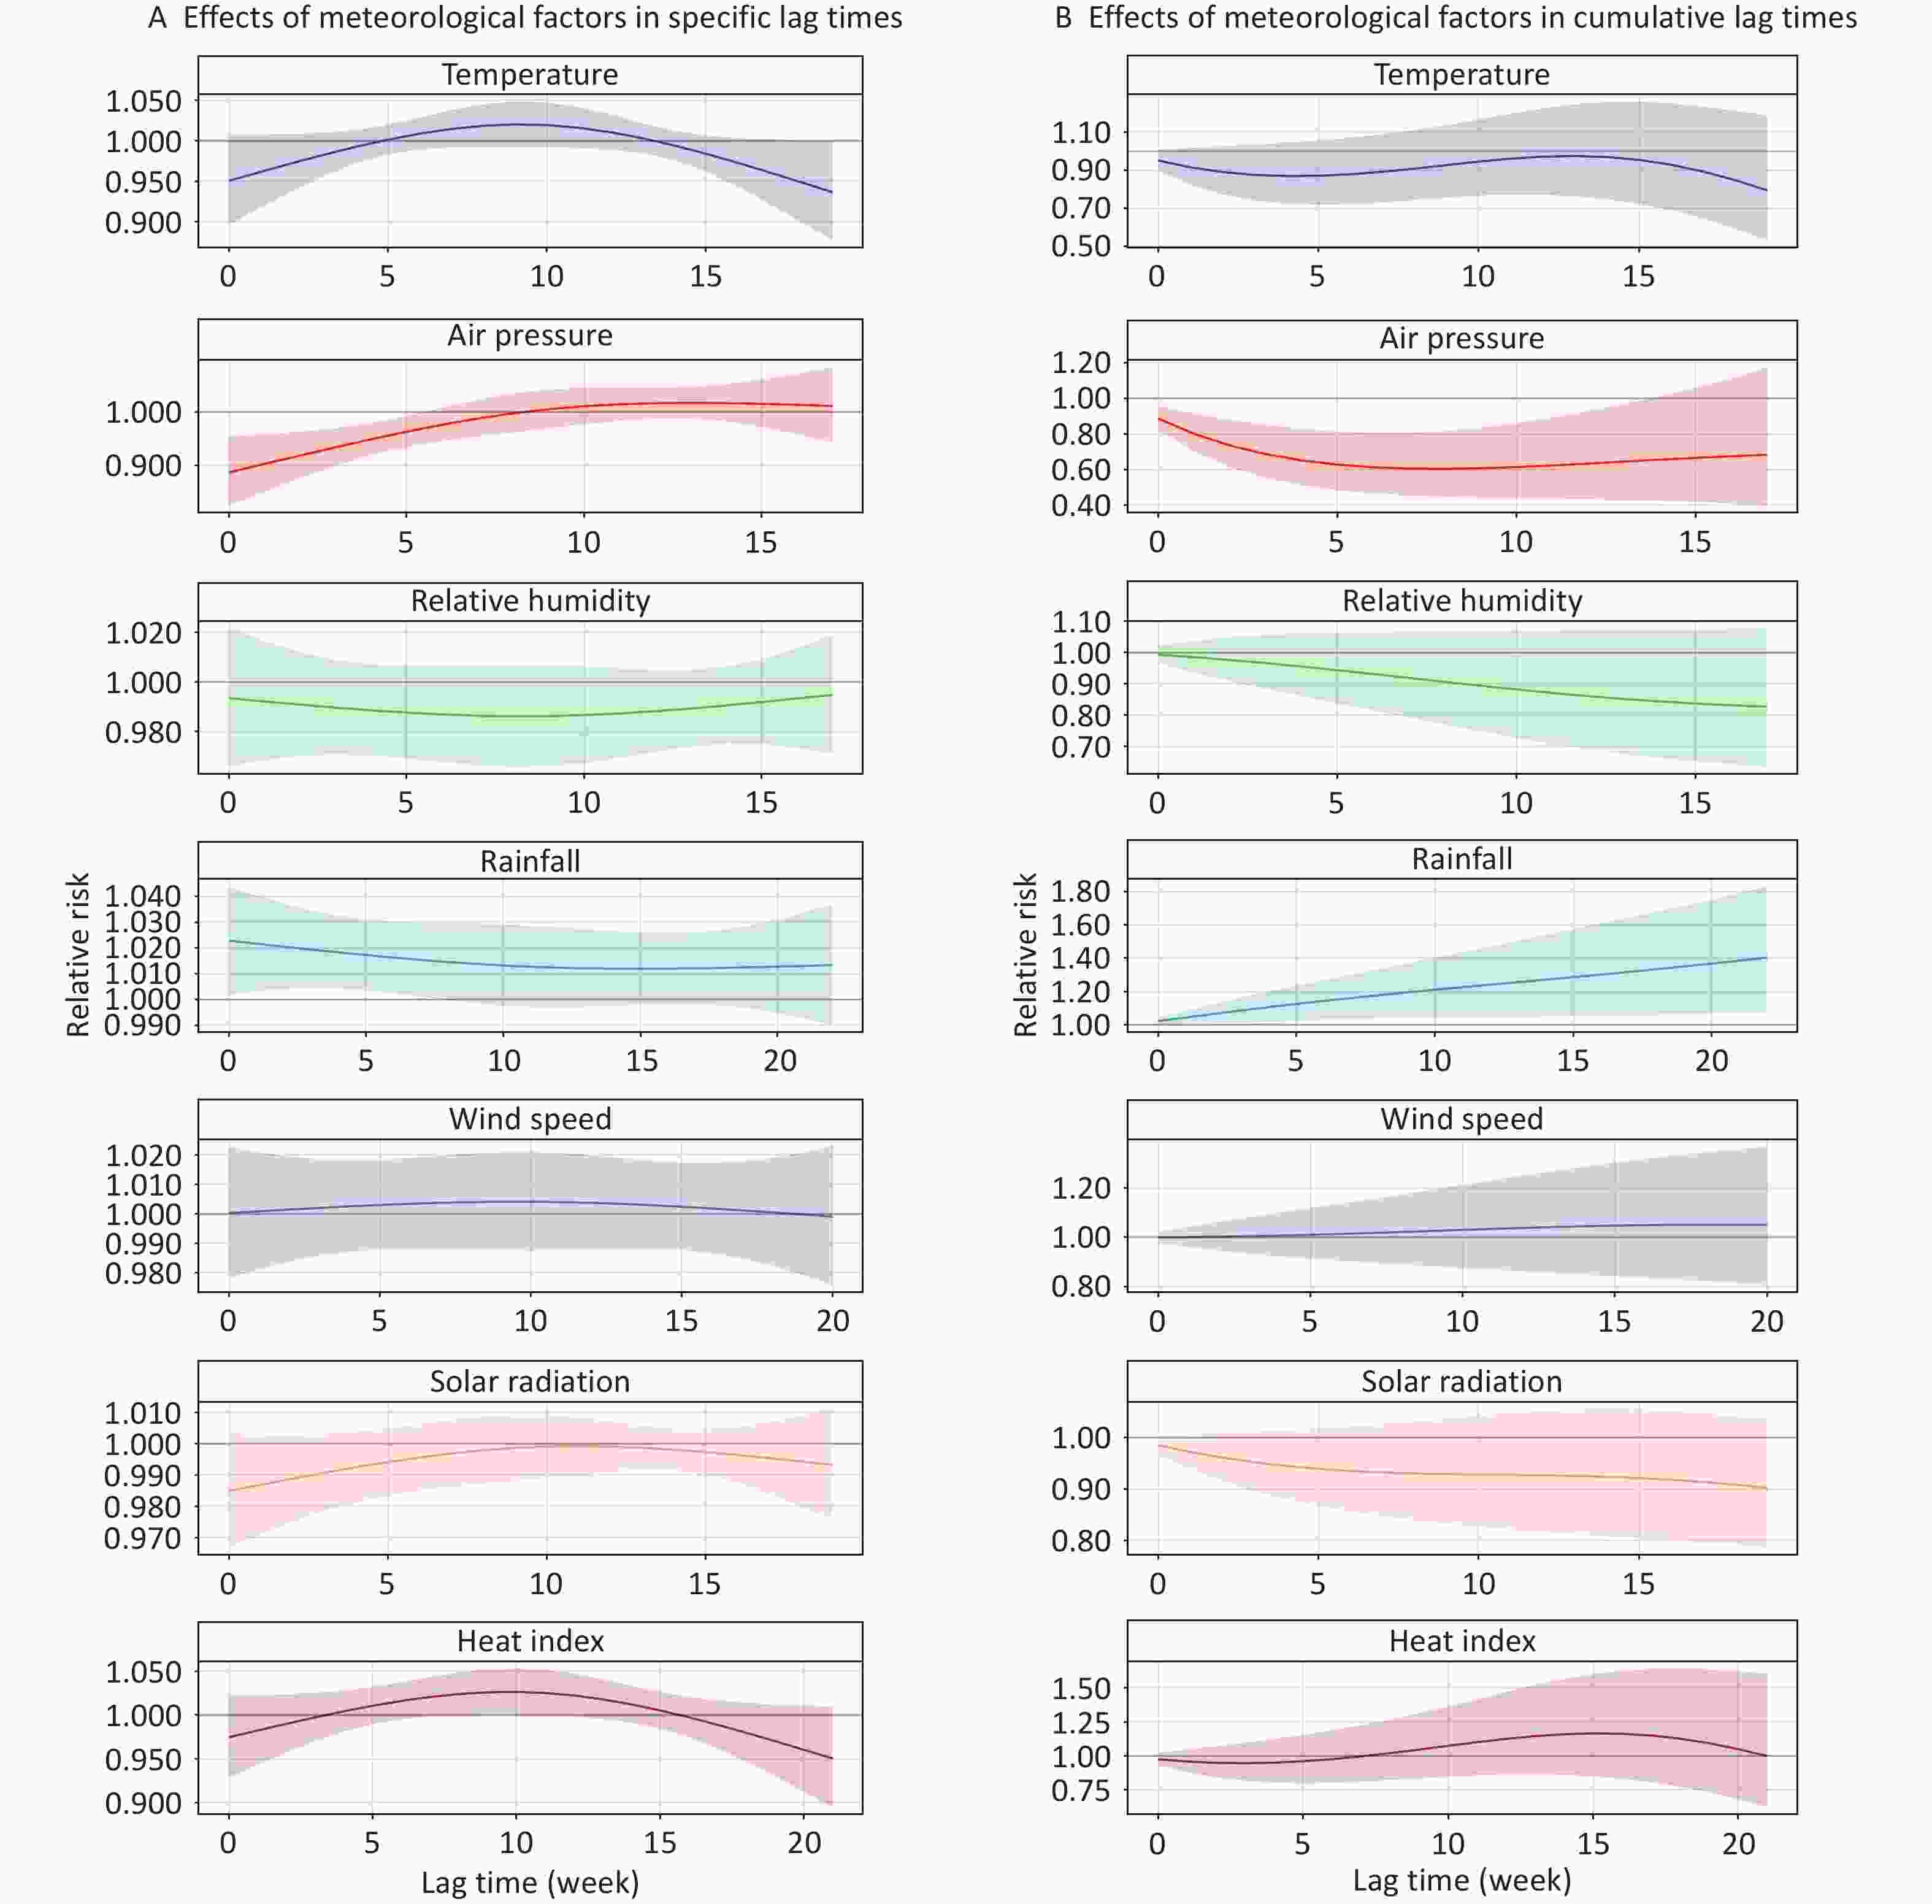
Figure 3. Effects of meteorological factors on the risk of TB in specific and cumulative lag times in single-factor models. The solid line represents the central estimates and the envelopes represent 95% confidence intervals. TB, tuberculosis.
-
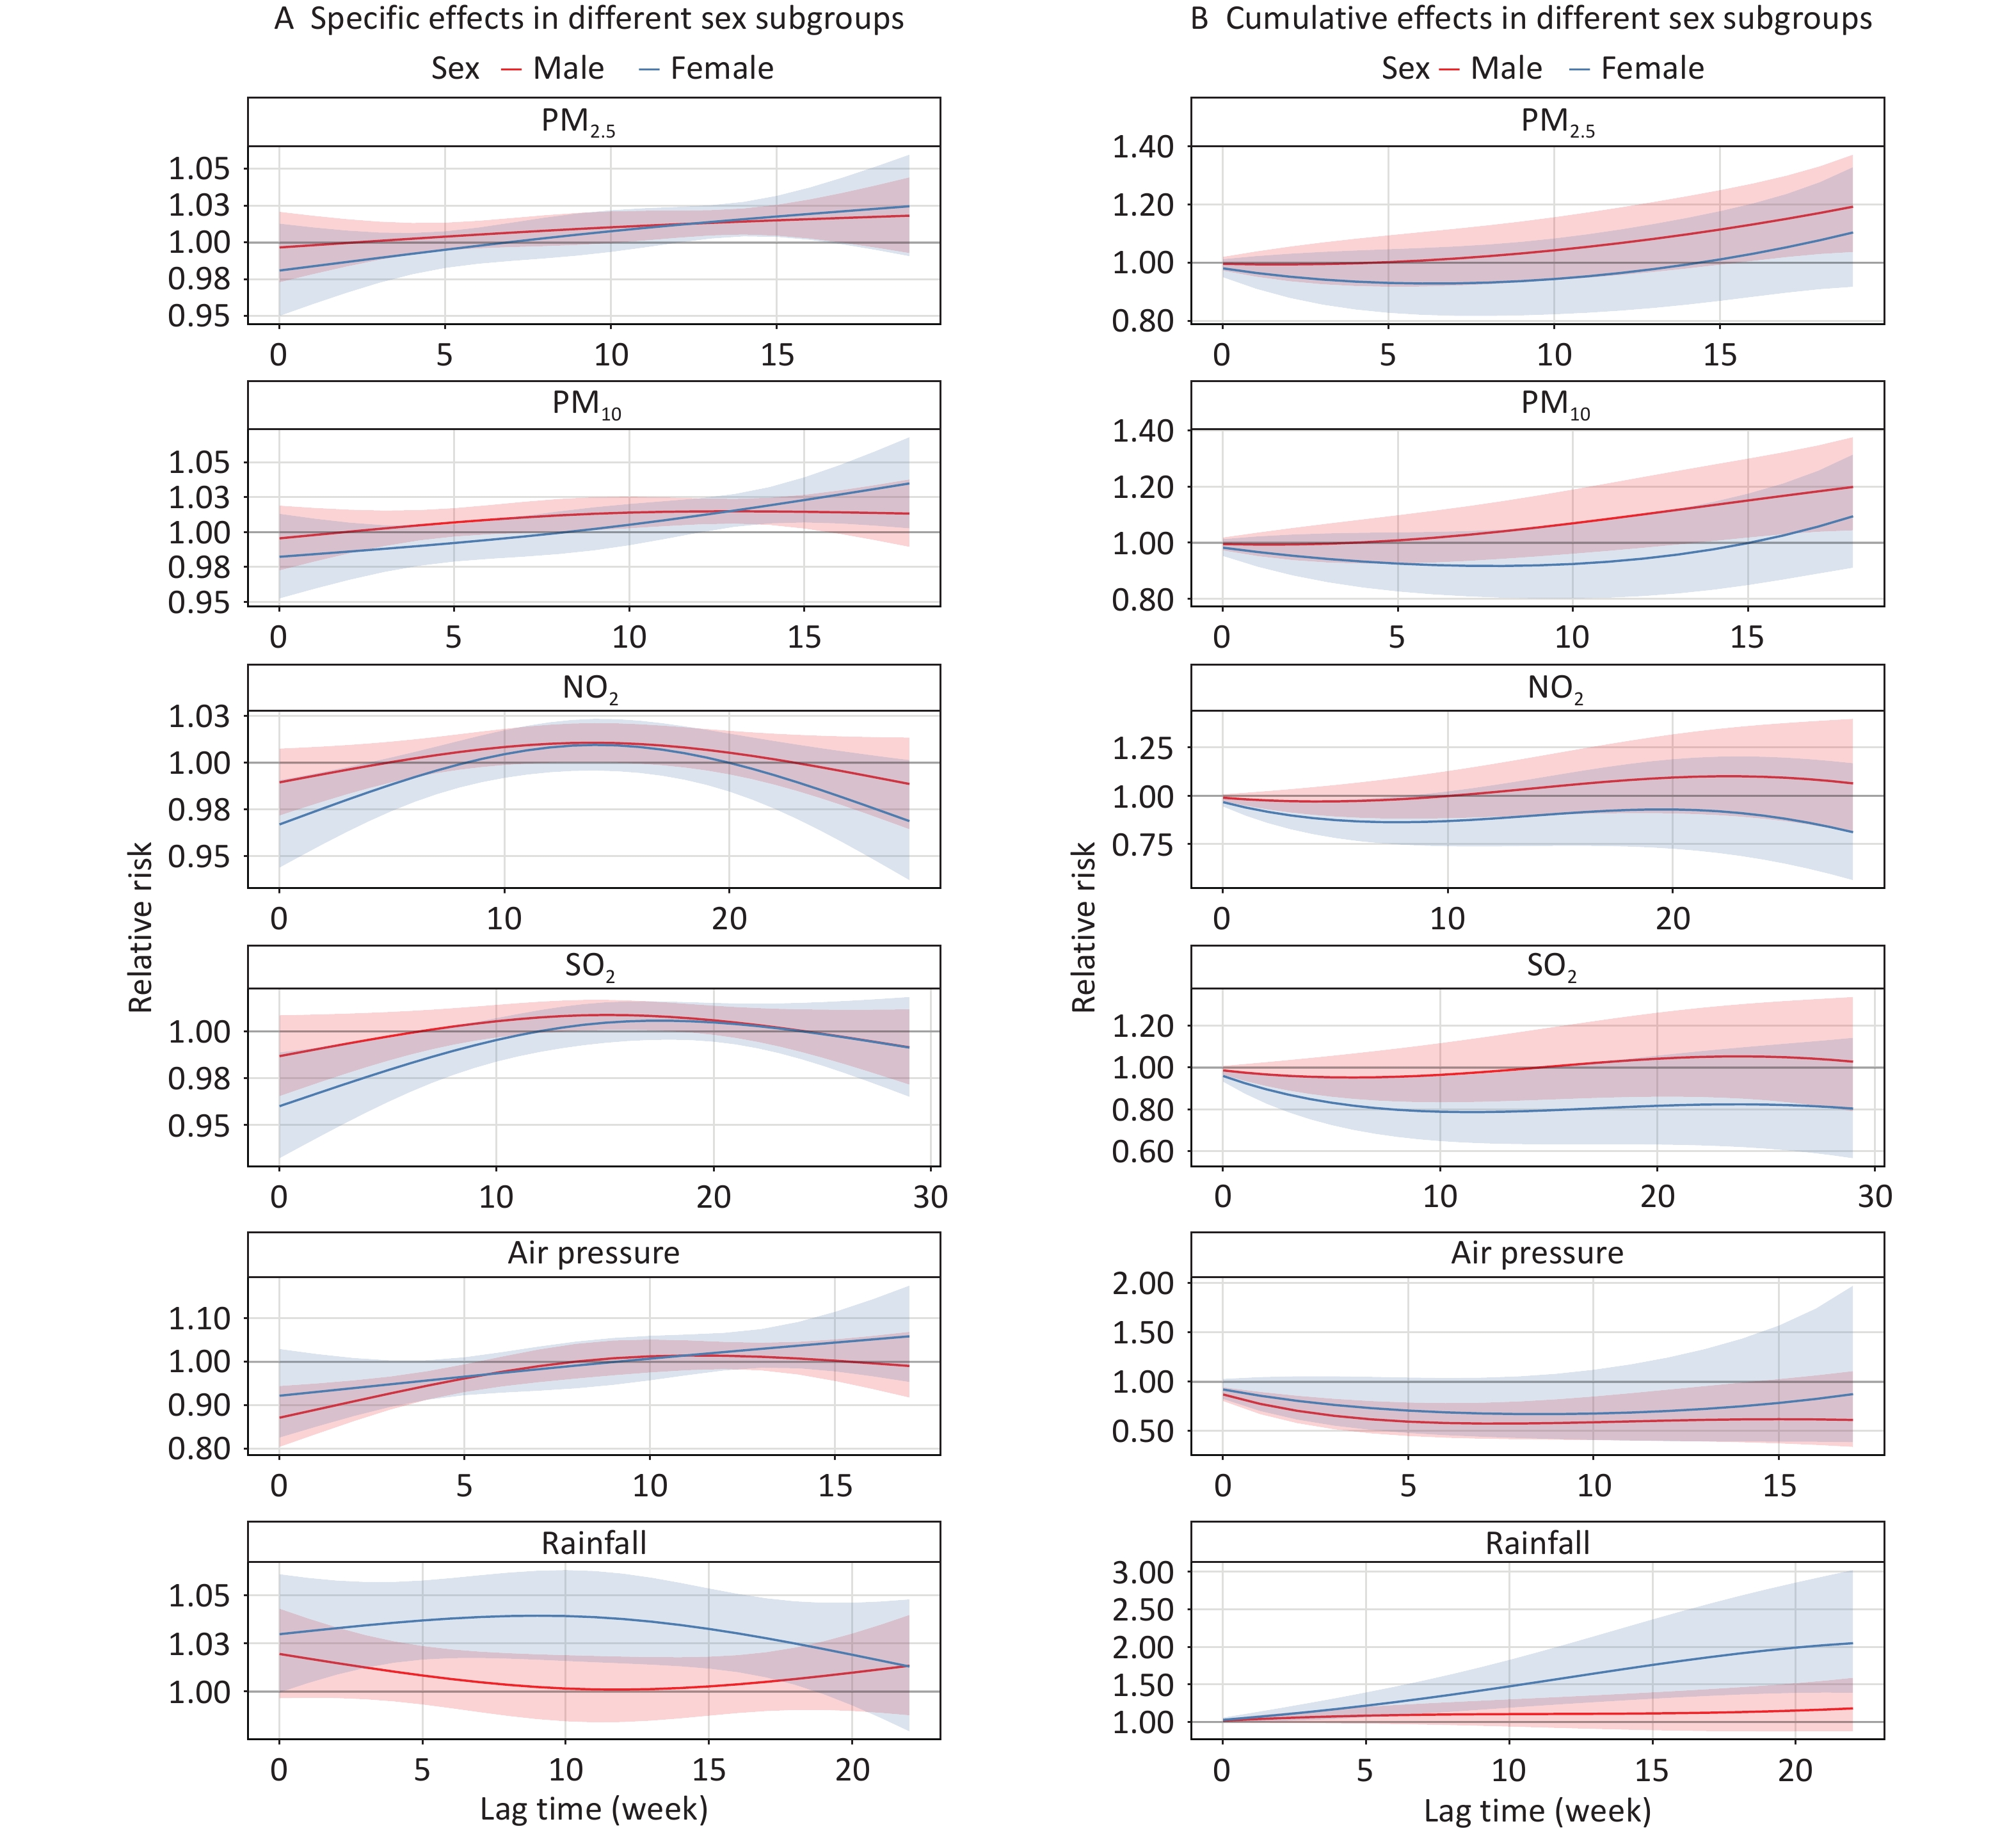
Figure 4 shows the lag effects of PM2.5, PM10, NO2, SO2, air pressure, and rainfall on the risk of TB at specific and cumulative lag times in different sex subgroups. In the single-factor model, TB associations with PM2.5, PM10, and air pressure exposure were significant only in the male group. The highest cumulative RRs of TB appeared at a lag of 0–19 weeks (RR = 1.193, 95% CI: 1.037–1.373) for PM2.5 and at a lag of 0–18 weeks (RR = 1.199, 95% CI: 1.044–1.376) for PM10. The lowest cumulative RR for air pressure was observed at a lag of 0–7 weeks (RR = 0.576, 95% CI: 0.422–0.788). Conversely, we only observed statistically significant relationships between NO2, SO2, rainfall exposure and TB in women. In women, the cumulative RRs peaked at a lag of 0–8 weeks (RR = 0.864, 95% CI: 0.747–0.998) for NO2; 0–11 weeks (RR = 0.787, 95% CI: 0.641–0.966) for SO2; and 0–22 weeks (RR = 2.050, 95% CI: 1.390–3.024) for rainfall (Supplementary Tables S2–S6).
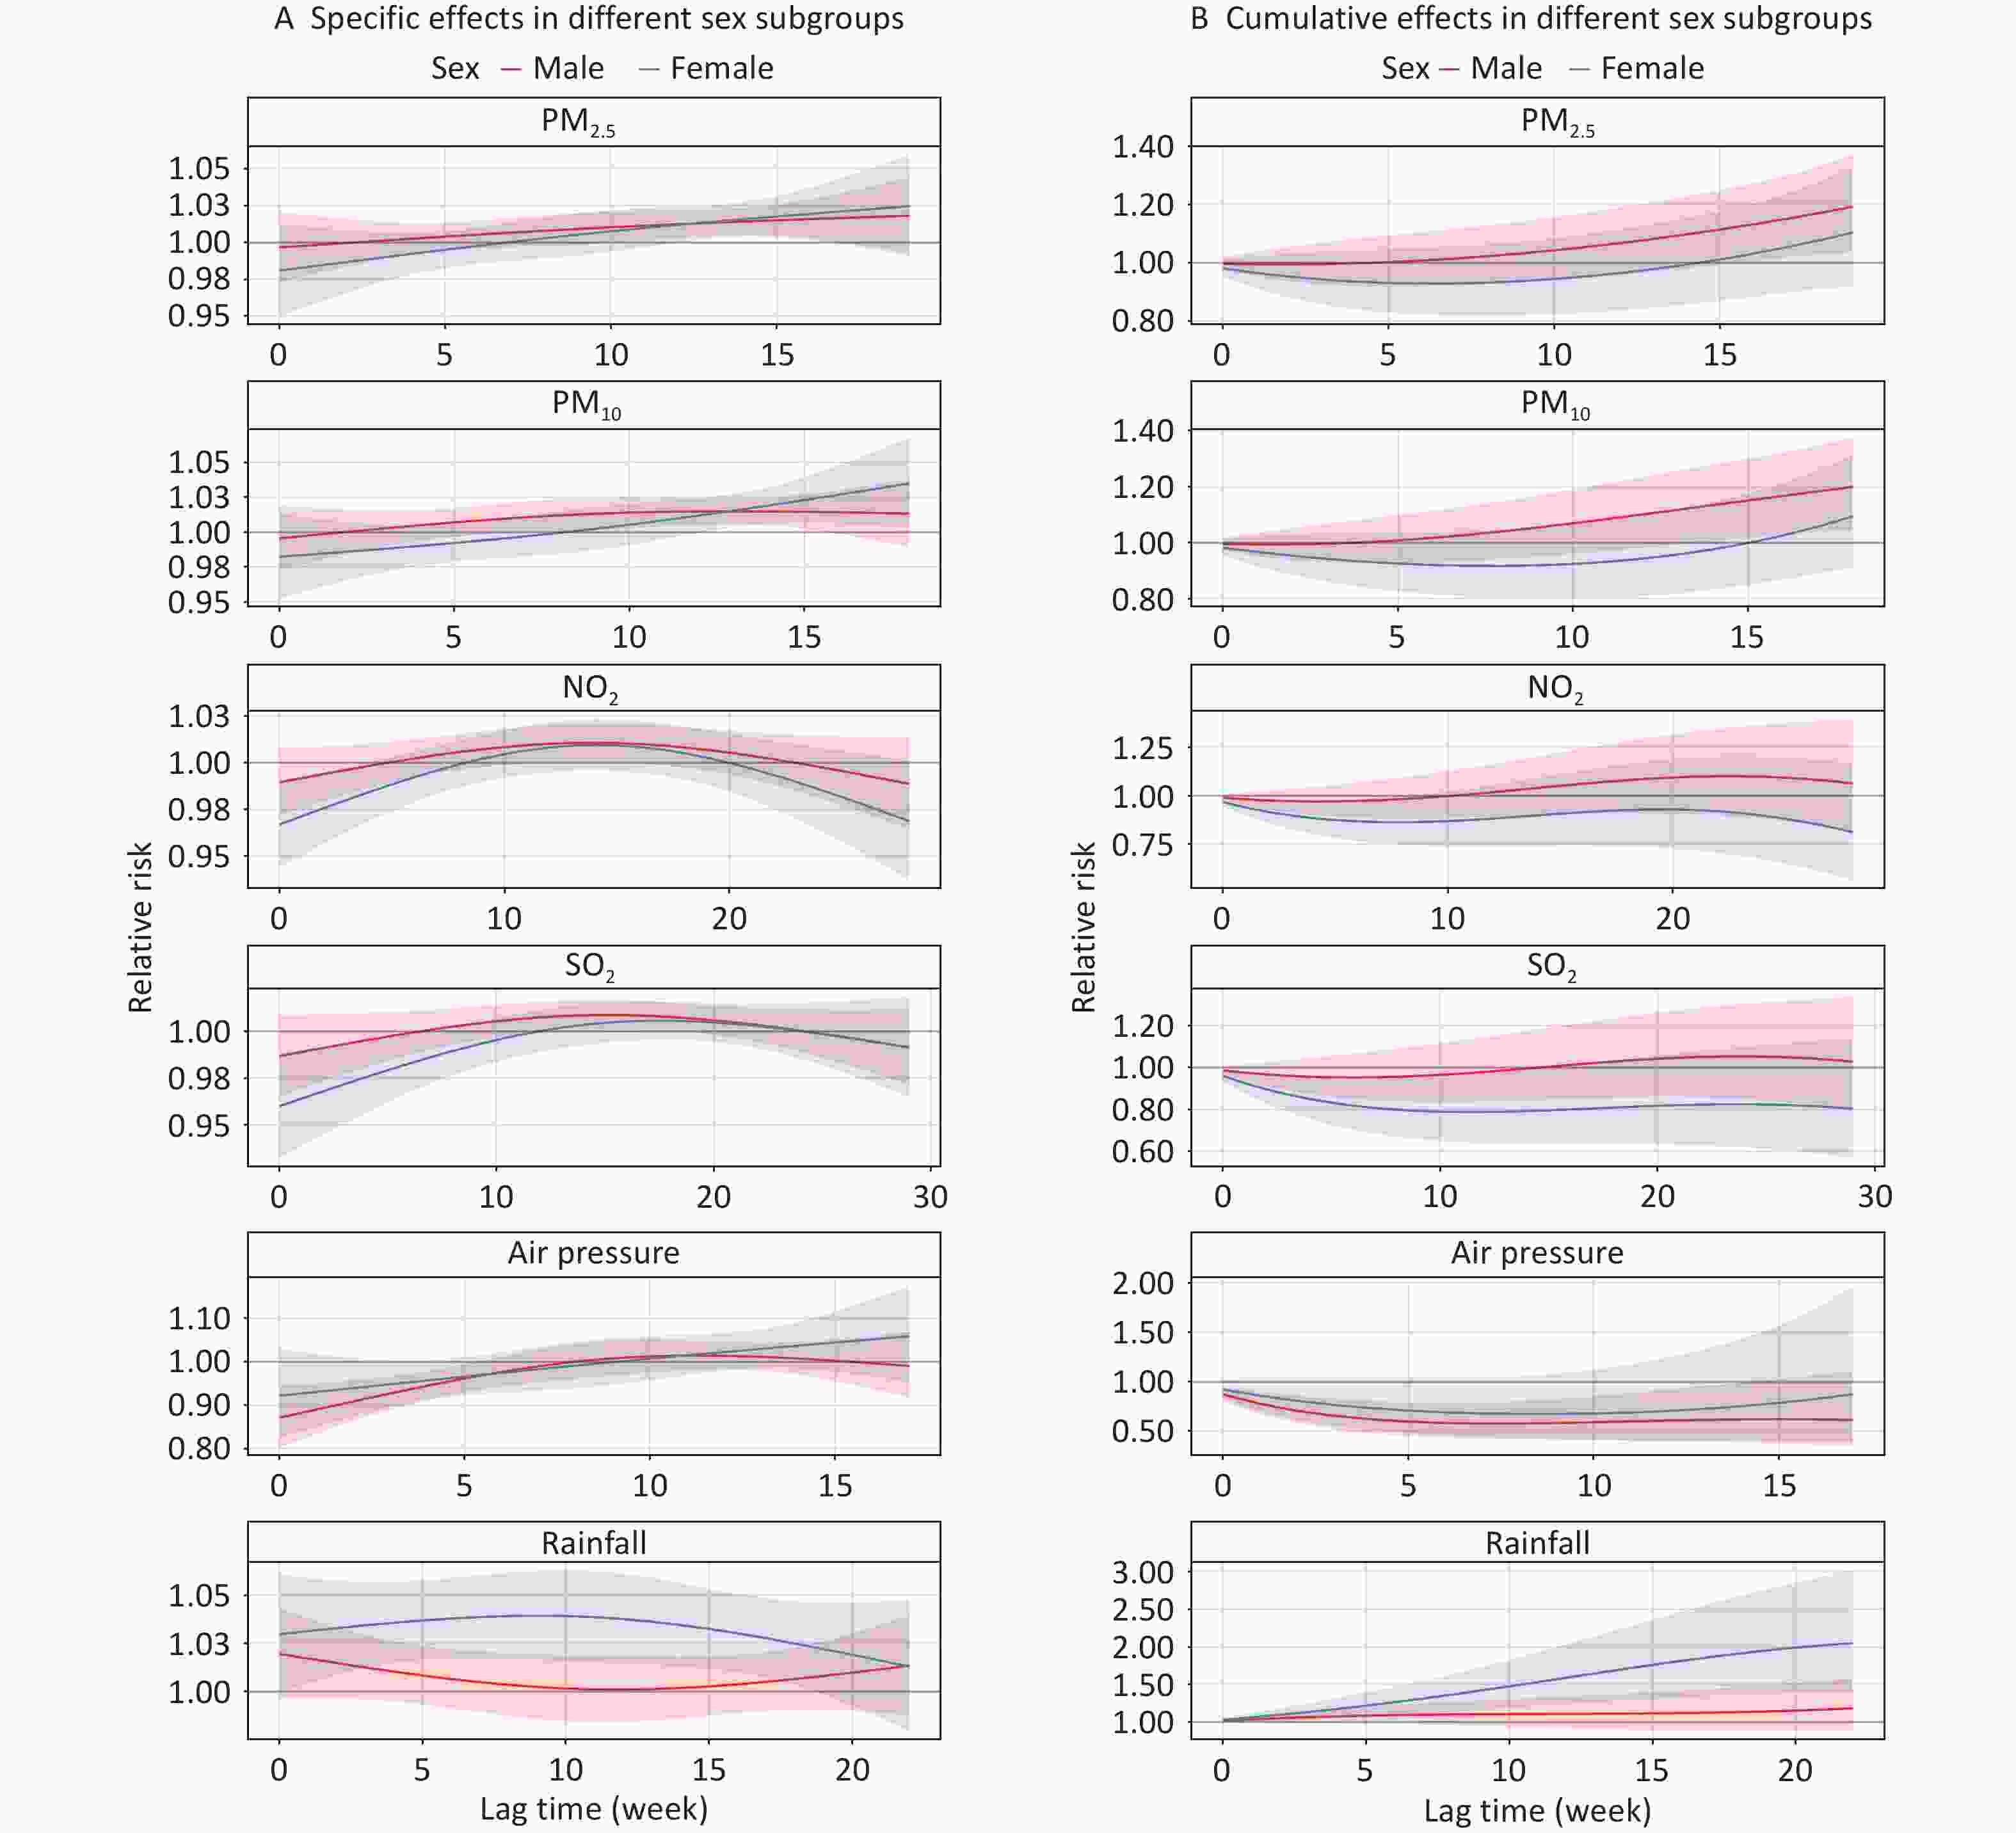
Figure 4. Effects of air pollutants and meteorological factors on risk of TB in different sex subgroups in single-factor models. The solid line represents the central estimates and the envelopes represent 95% confidence intervals. SO2, sulfur dioxide; NO2, nitrogen dioxide; PM2.5, particulate matter ≤ 2.5 μm in aerodynamic diameter; PM10, particulate matter ≤ 10 μm in aerodynamic diameter; NDVI, normalized difference vegetation index; TB, tuberculosis.
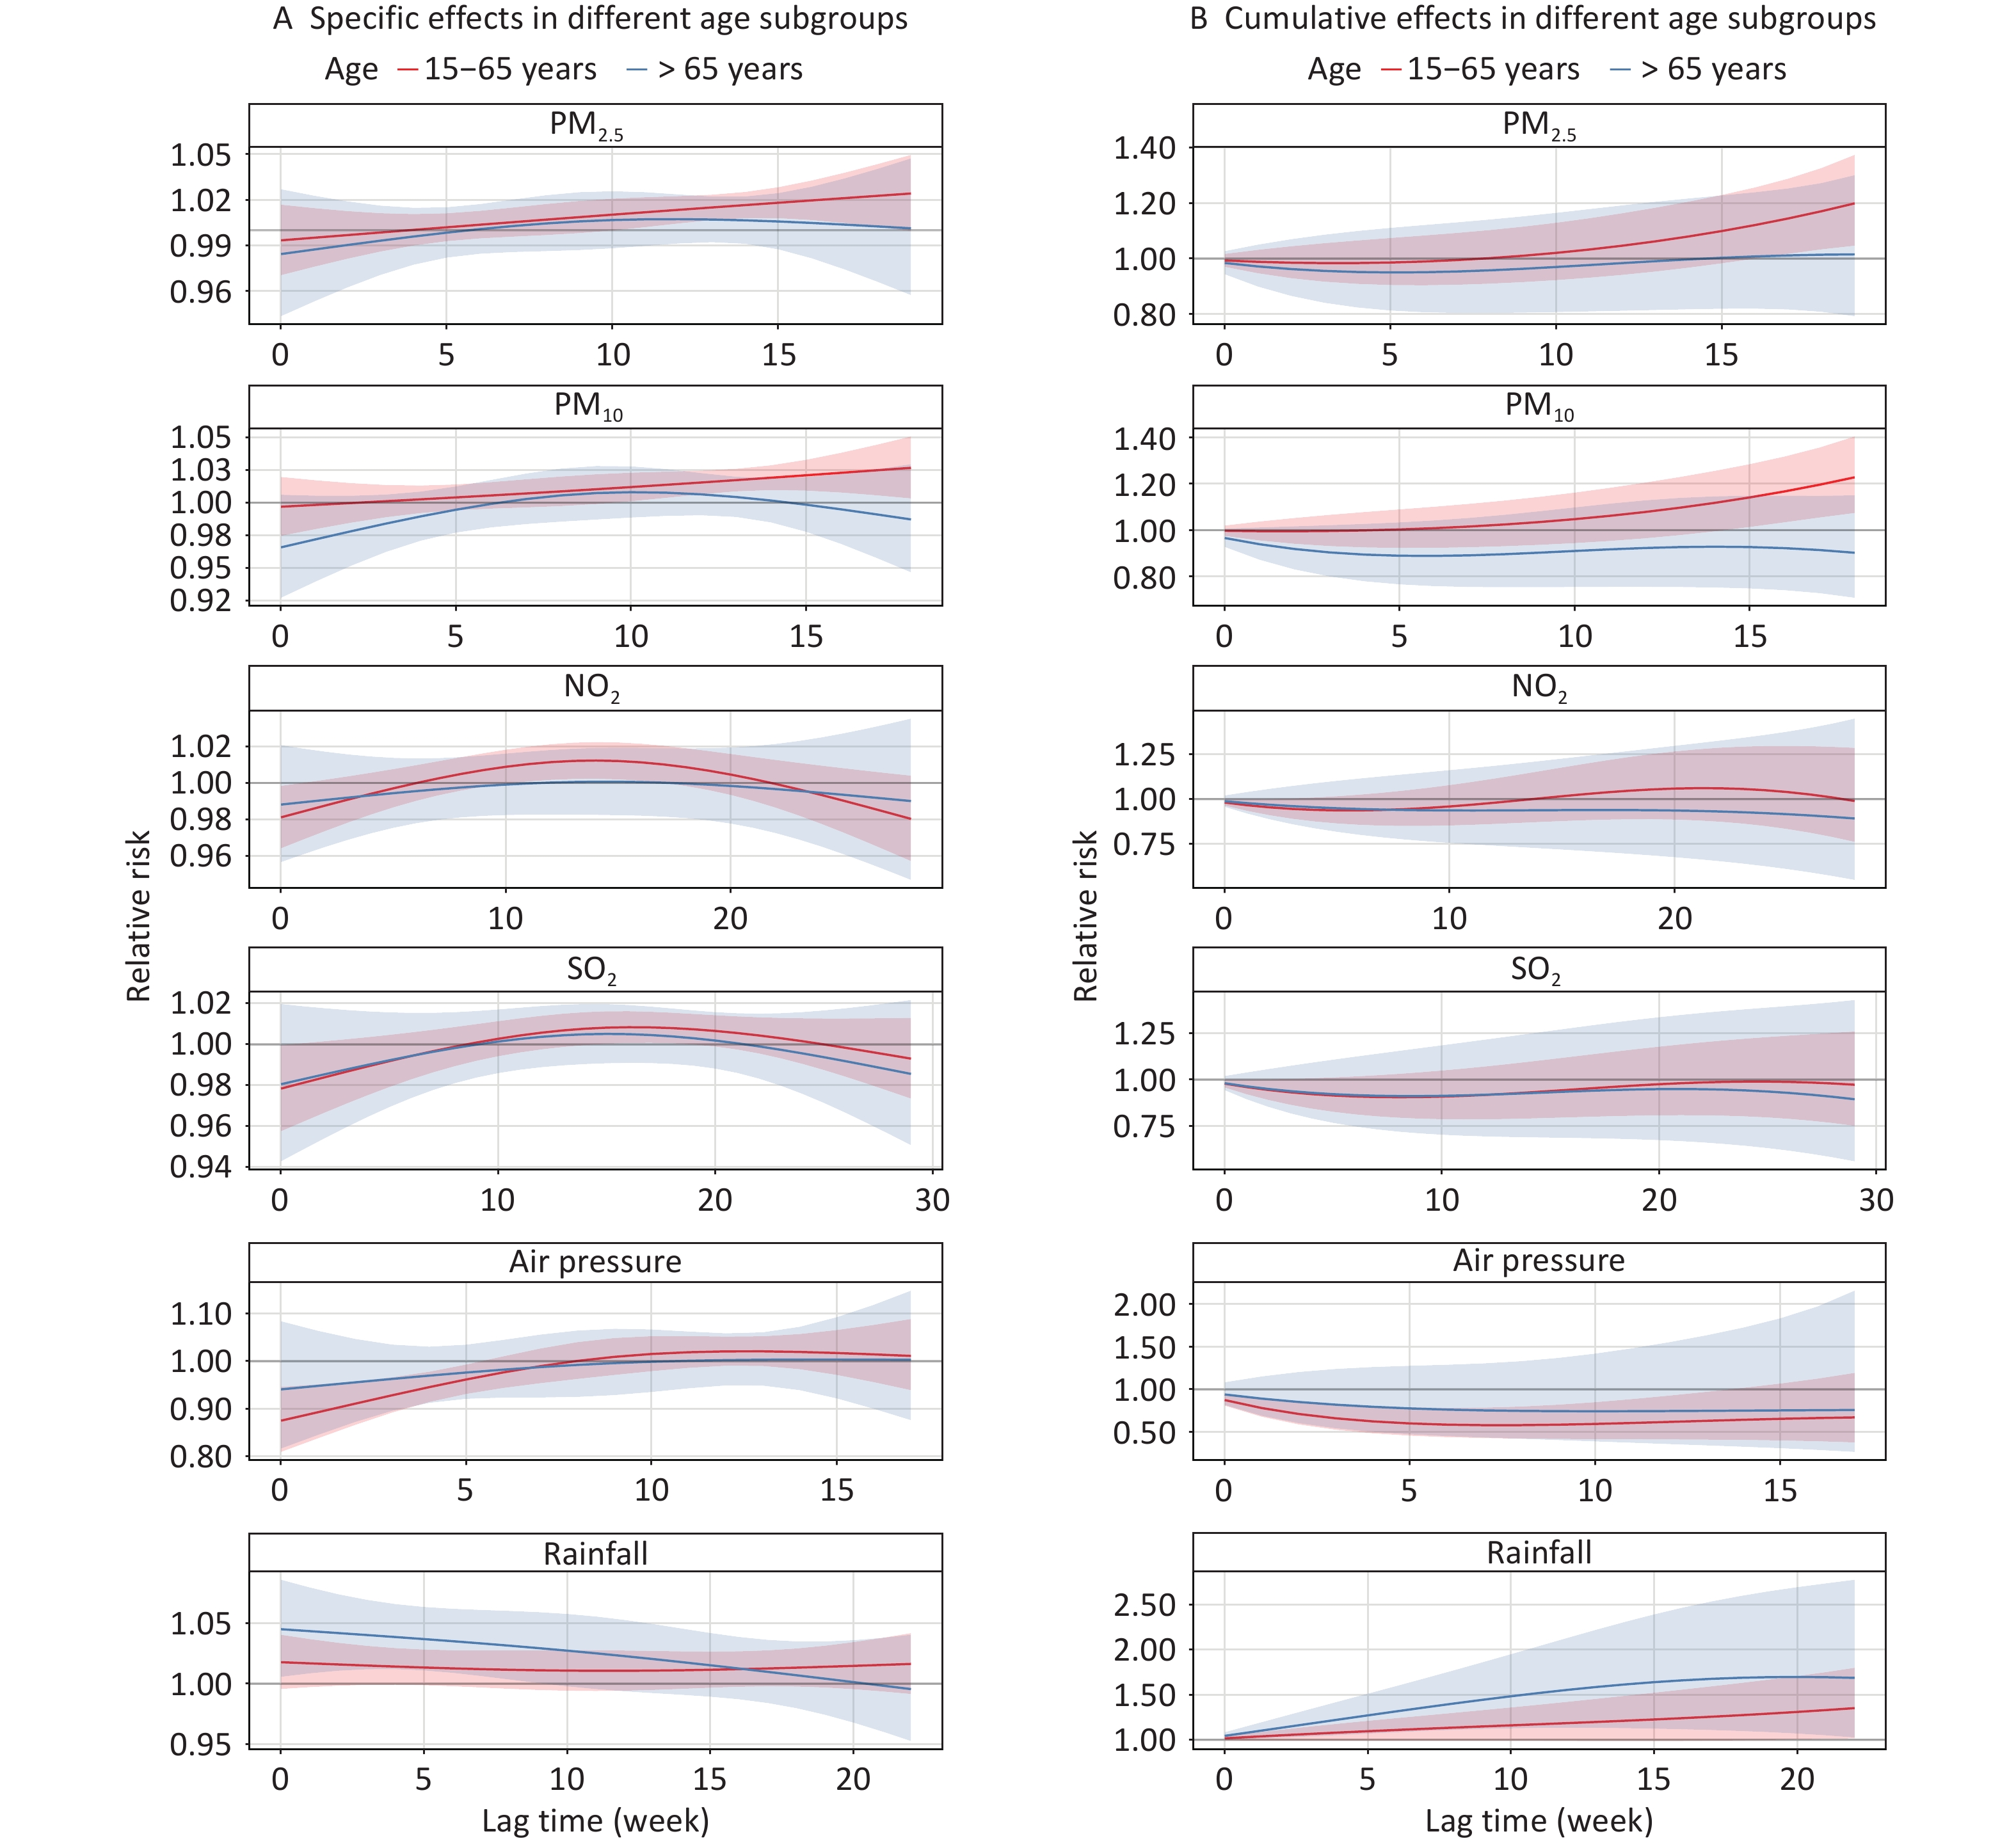
A stratified analysis according to age is shown in Figure 5. When stratified by age, the relationships between PM2.5, PM10, NO2, and air pressure exposure and the risk of TB remained statistically significant only in the 15–65 years age group. In this group, the cumulative RRs peaked at a lag of 0–19 weeks (RR = 1.199, 95% CI: 1.046–1.373) for PM2.5, a lag of 0–18 weeks (RR = 1.228, 95% CI: 1.074–1.405) for PM10, a lag of 0–1 weeks (RR = 0.966, 95% CI: 0.934–0.998) for NO2, and a lag of 0–7 weeks (RR = 0.580, 95% CI: 0.428–0.786) for air pressure. In contrast, in the aged > 65 years group, a significant increase in cumulative TB risk was observed only with higher rainfall exposure, reaching a peak at a lag of 0–20 weeks (RR = 1.699, 95% CI: 1.071–2.697). No statistically significant association with SO2 exposure was observed in either age group (Supplementary Tables S2–S6).
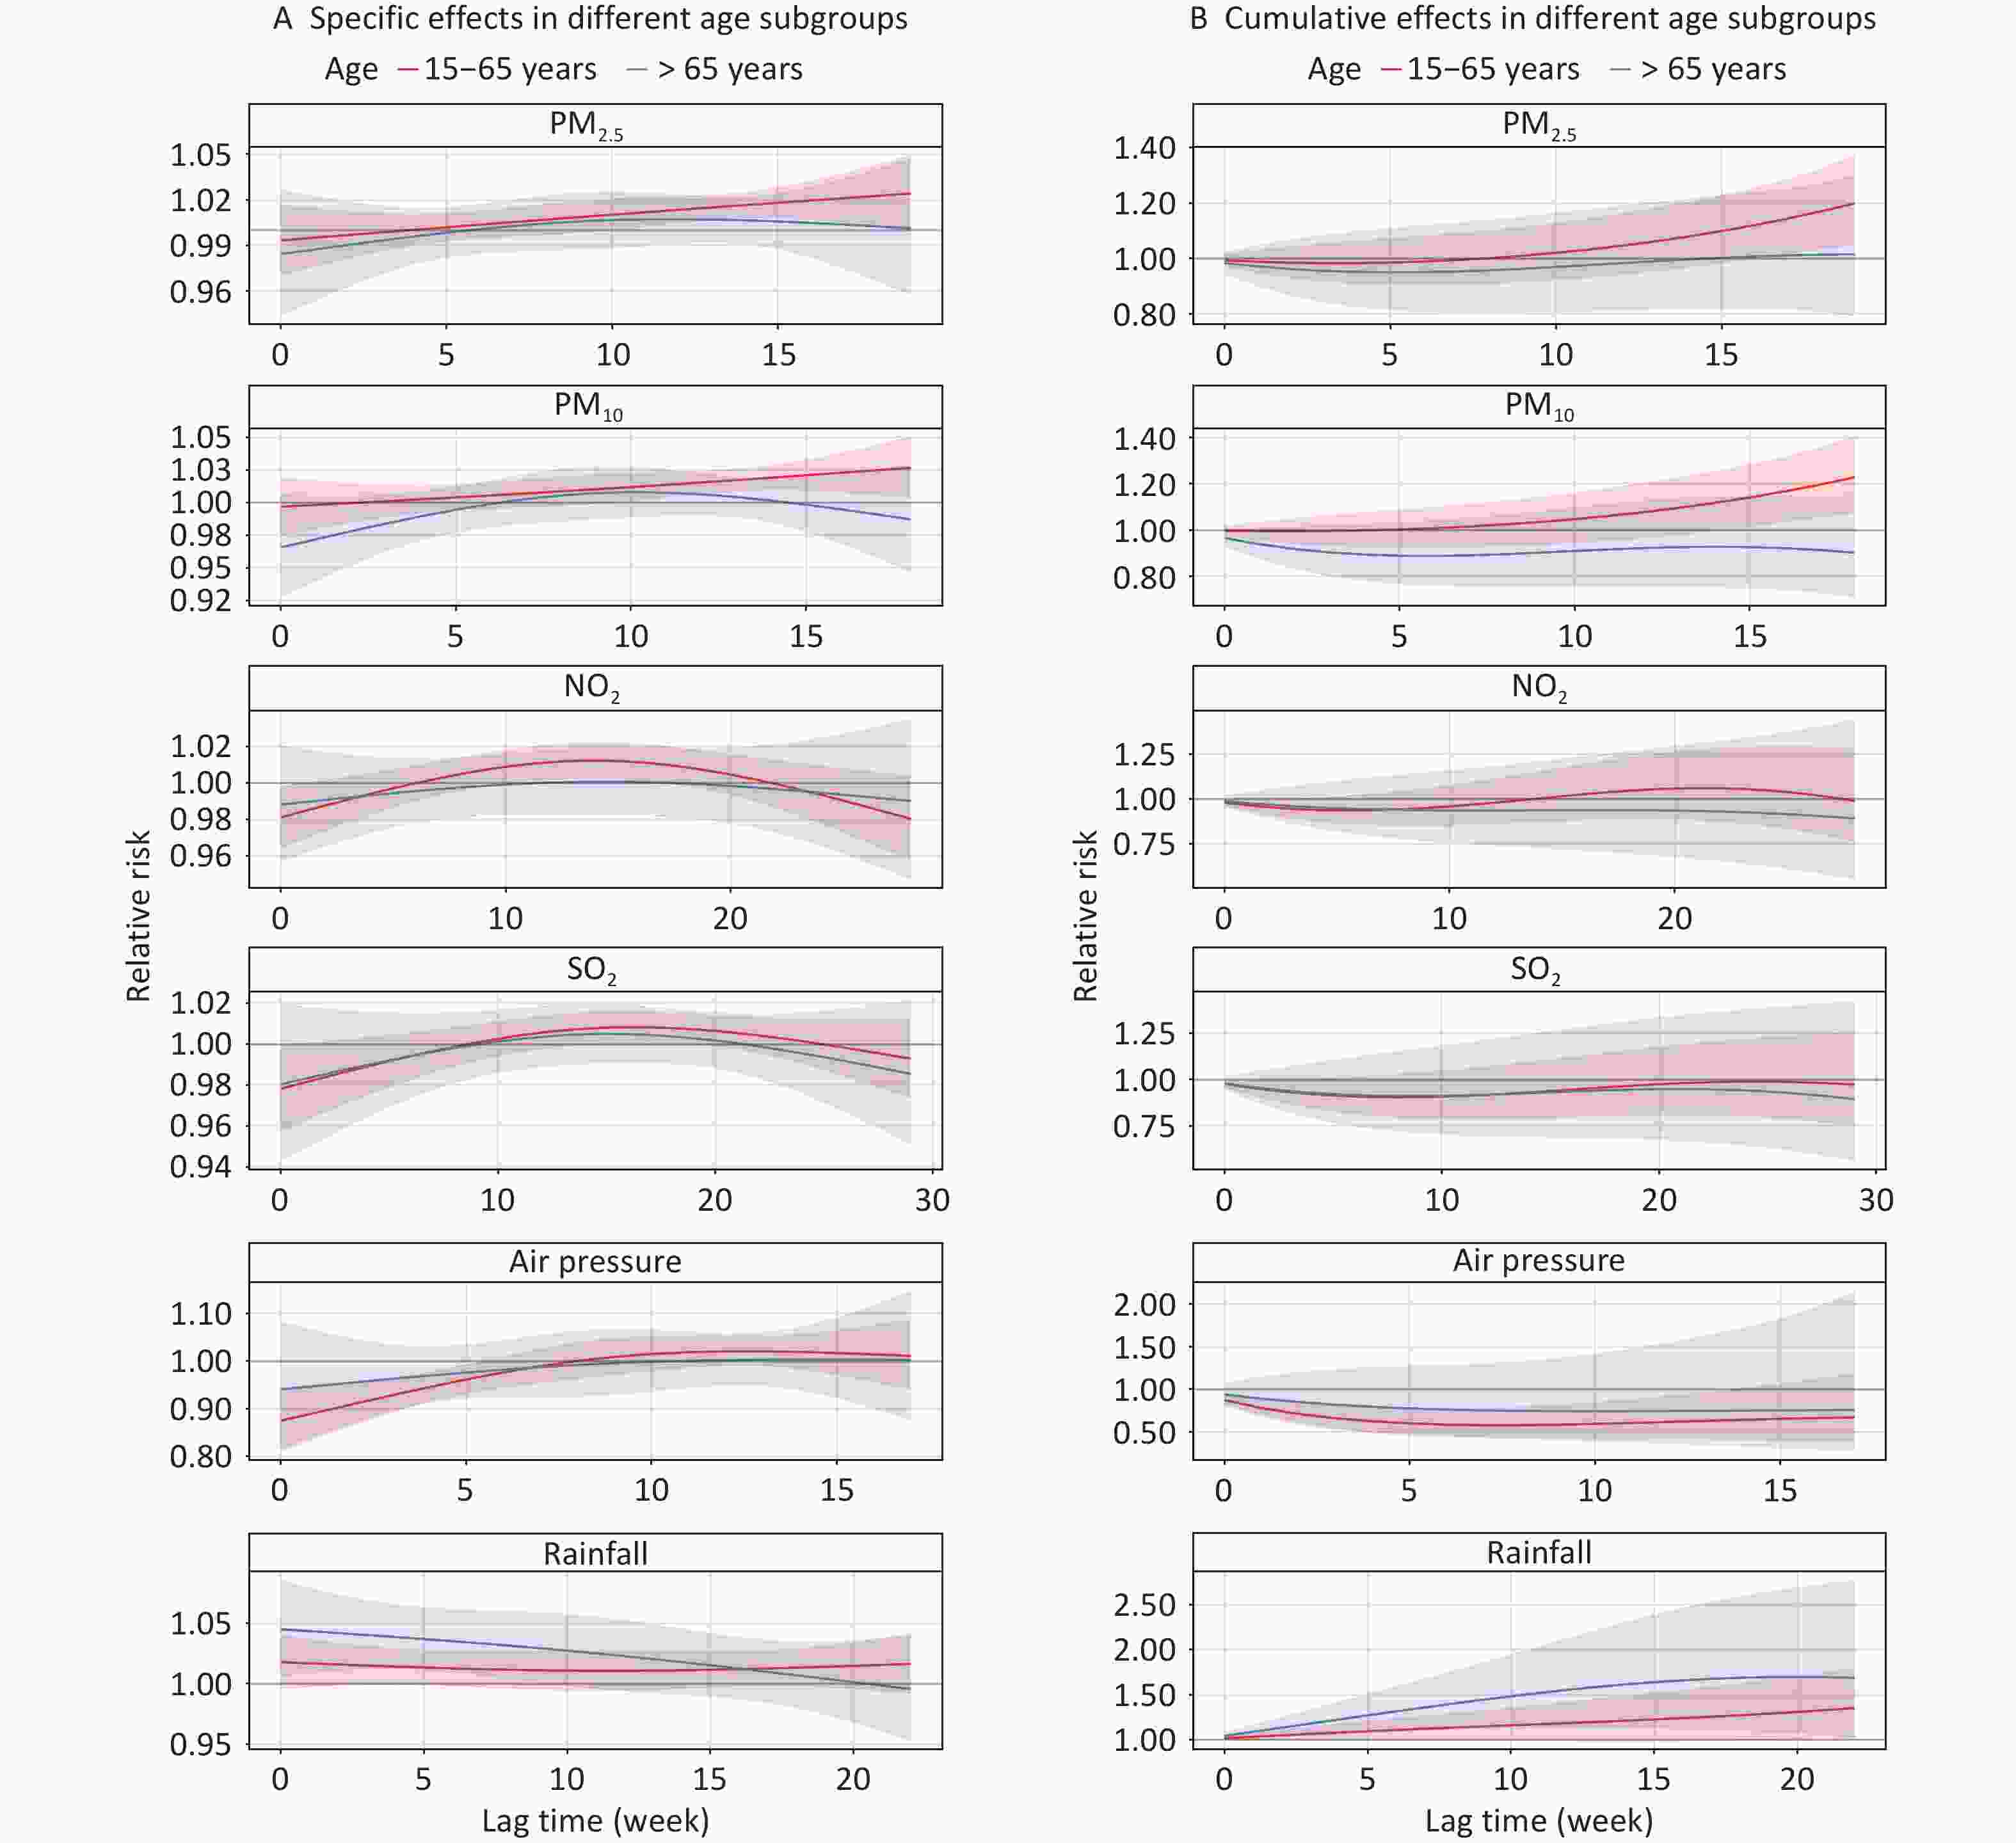
Figure 5. Effects of air pollutants and meteorological factors on risk of TB in different age subgroups in single-factor models. The solid line represents the central estimates and the envelopes represent 95% confidence intervals. SO2, sulfur dioxide; NO2, nitrogen dioxide; PM2.5, particulate matter ≤ 2.5 μm in aerodynamic diameter; PM10, particulate matter ≤ 10 μm in aerodynamic diameter; NDVI, normalized difference vegetation index; TB, tuberculosis.
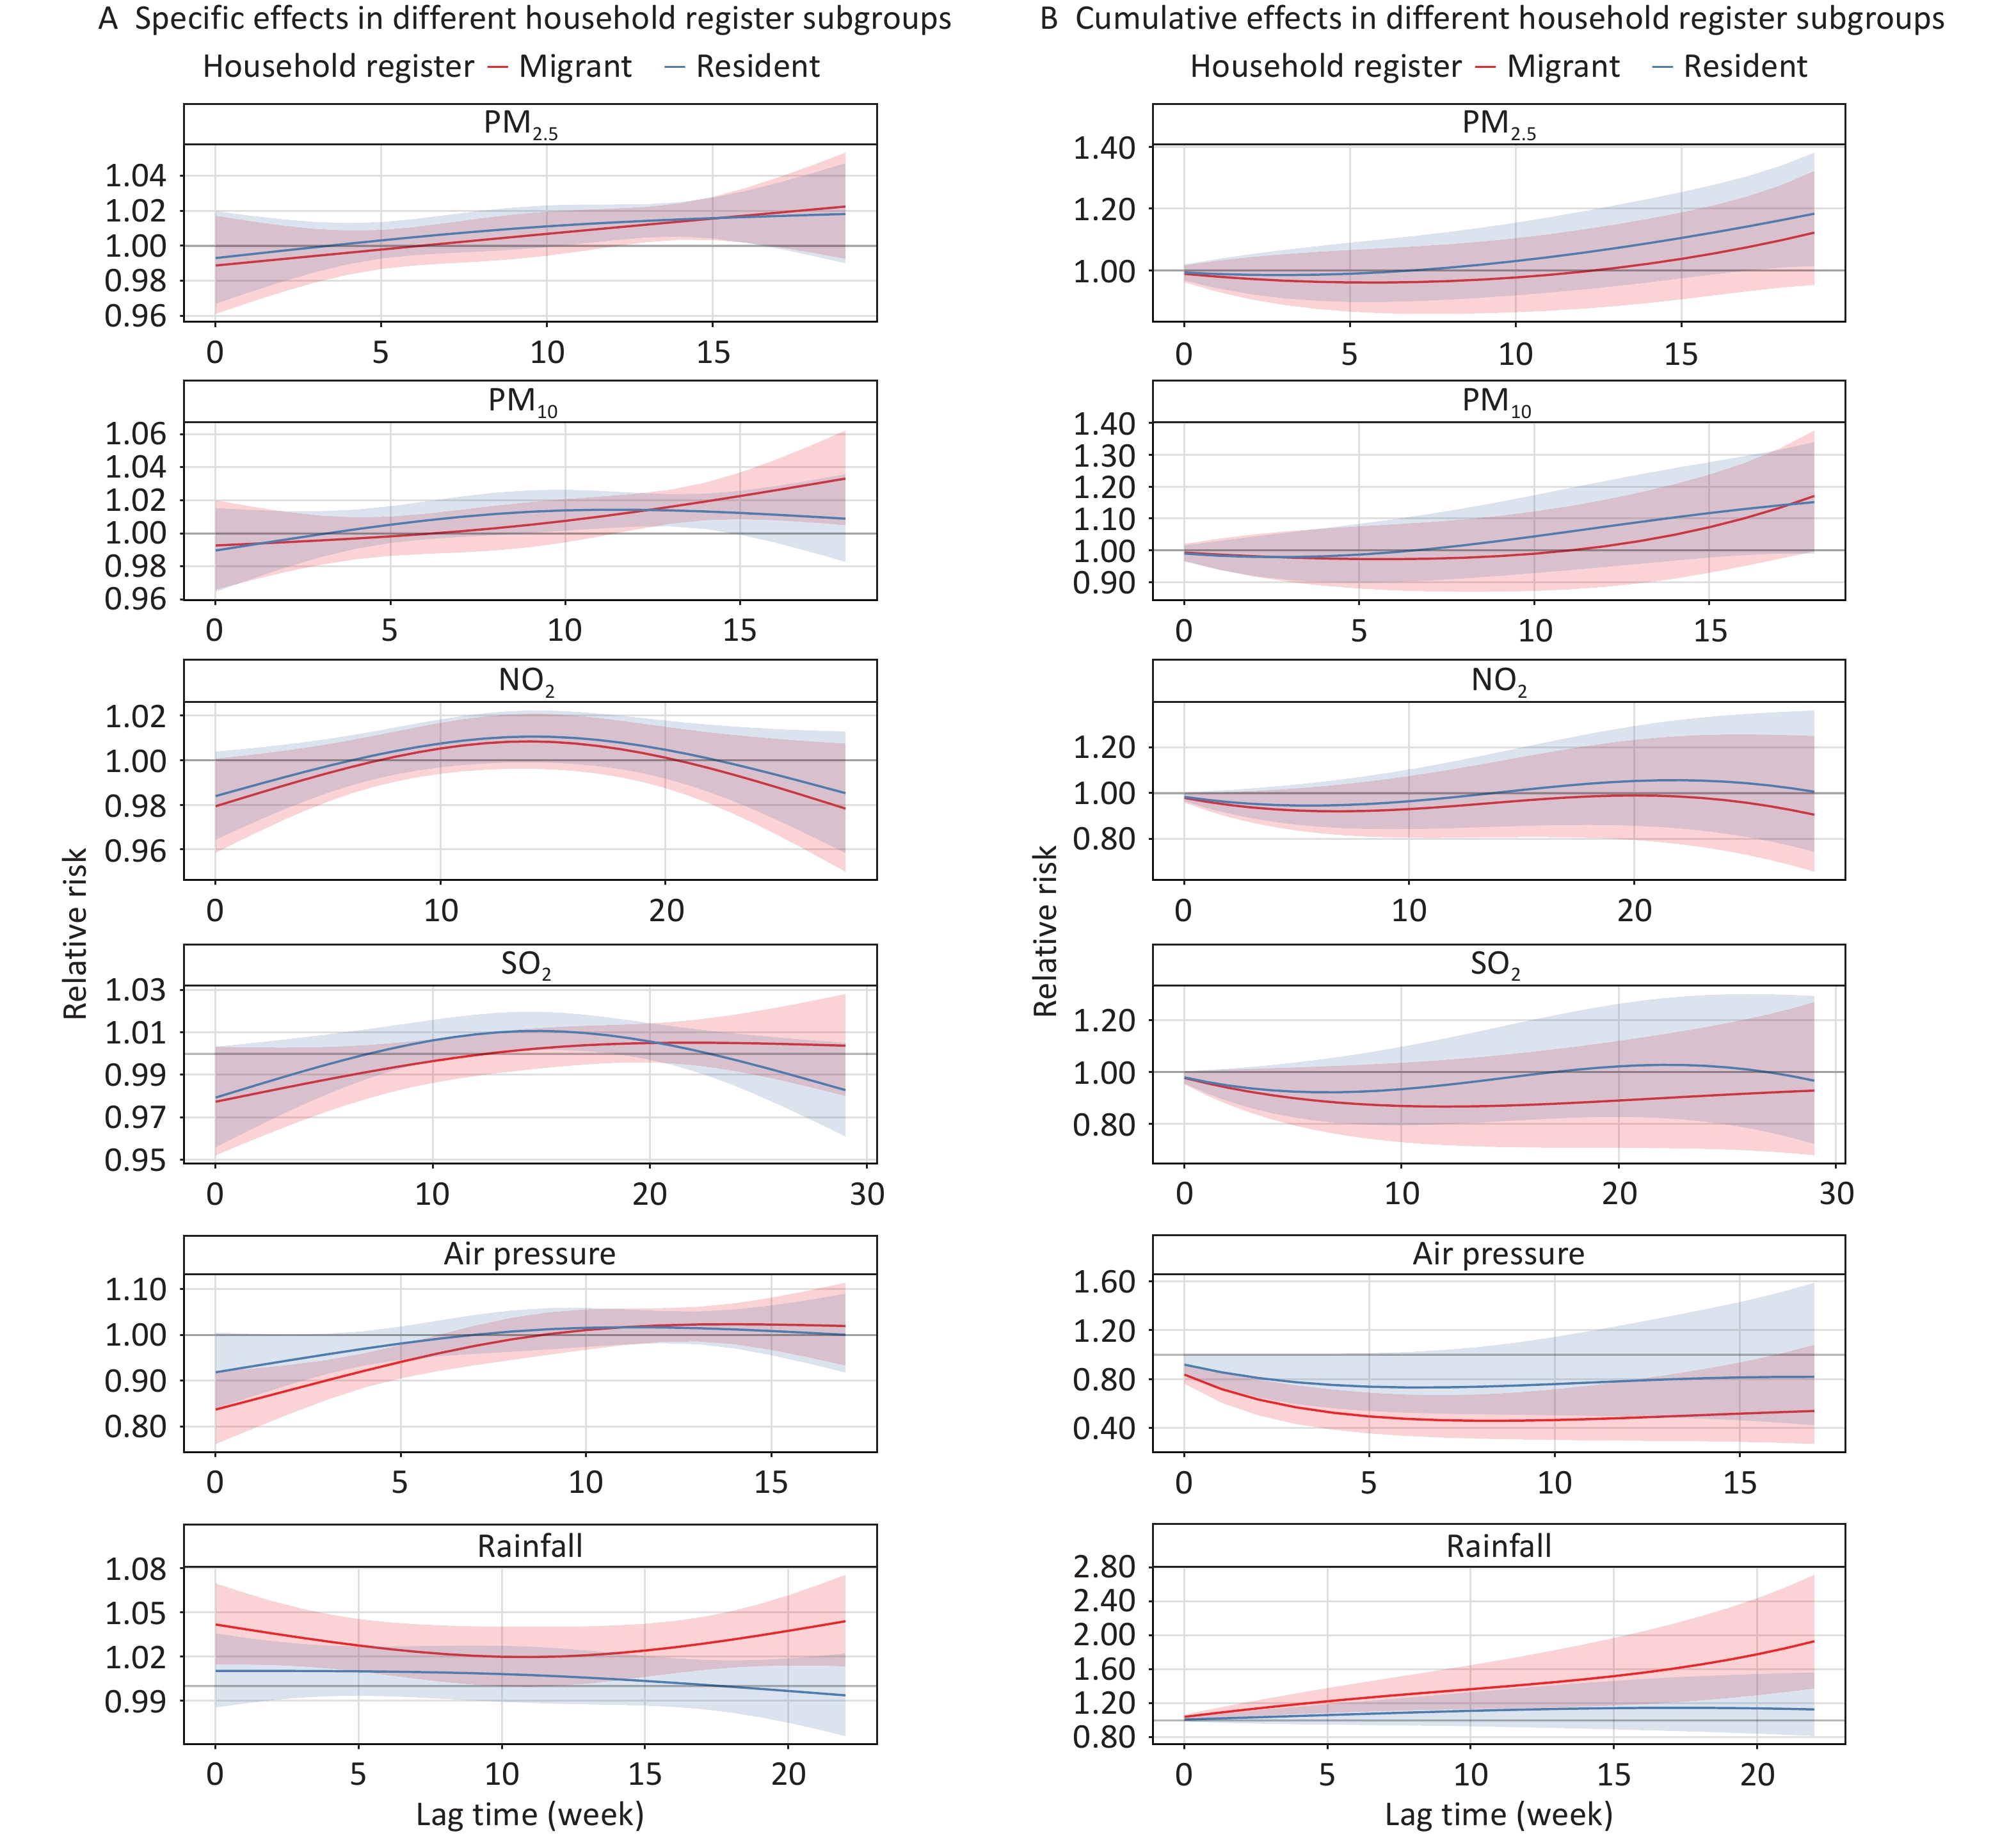
Figure 6 shows the lag effects of environmental factors on TB risk, stratified by household registration status. Air pressure and rainfall were significantly associated with TB risk only among the migrant population, with a peak effect occurring at a lag of 0–8 weeks (RR = 0.459; 95% CI: 0.312–0.676) for air pressure and 0–22 weeks (RR = 1.931, 95% CI: 1.374–2.713) for rainfall. PM2.5 exposure, however, was only significantly associated with TB risk in resident patients, with the highest RR observed at 0–19 weeks (RR = 1.184, 95% CI: 1.014–1.382). No significant associations were observed between PM10, NO2, or SO2 in either group. (Supplementary Tables S2–6).
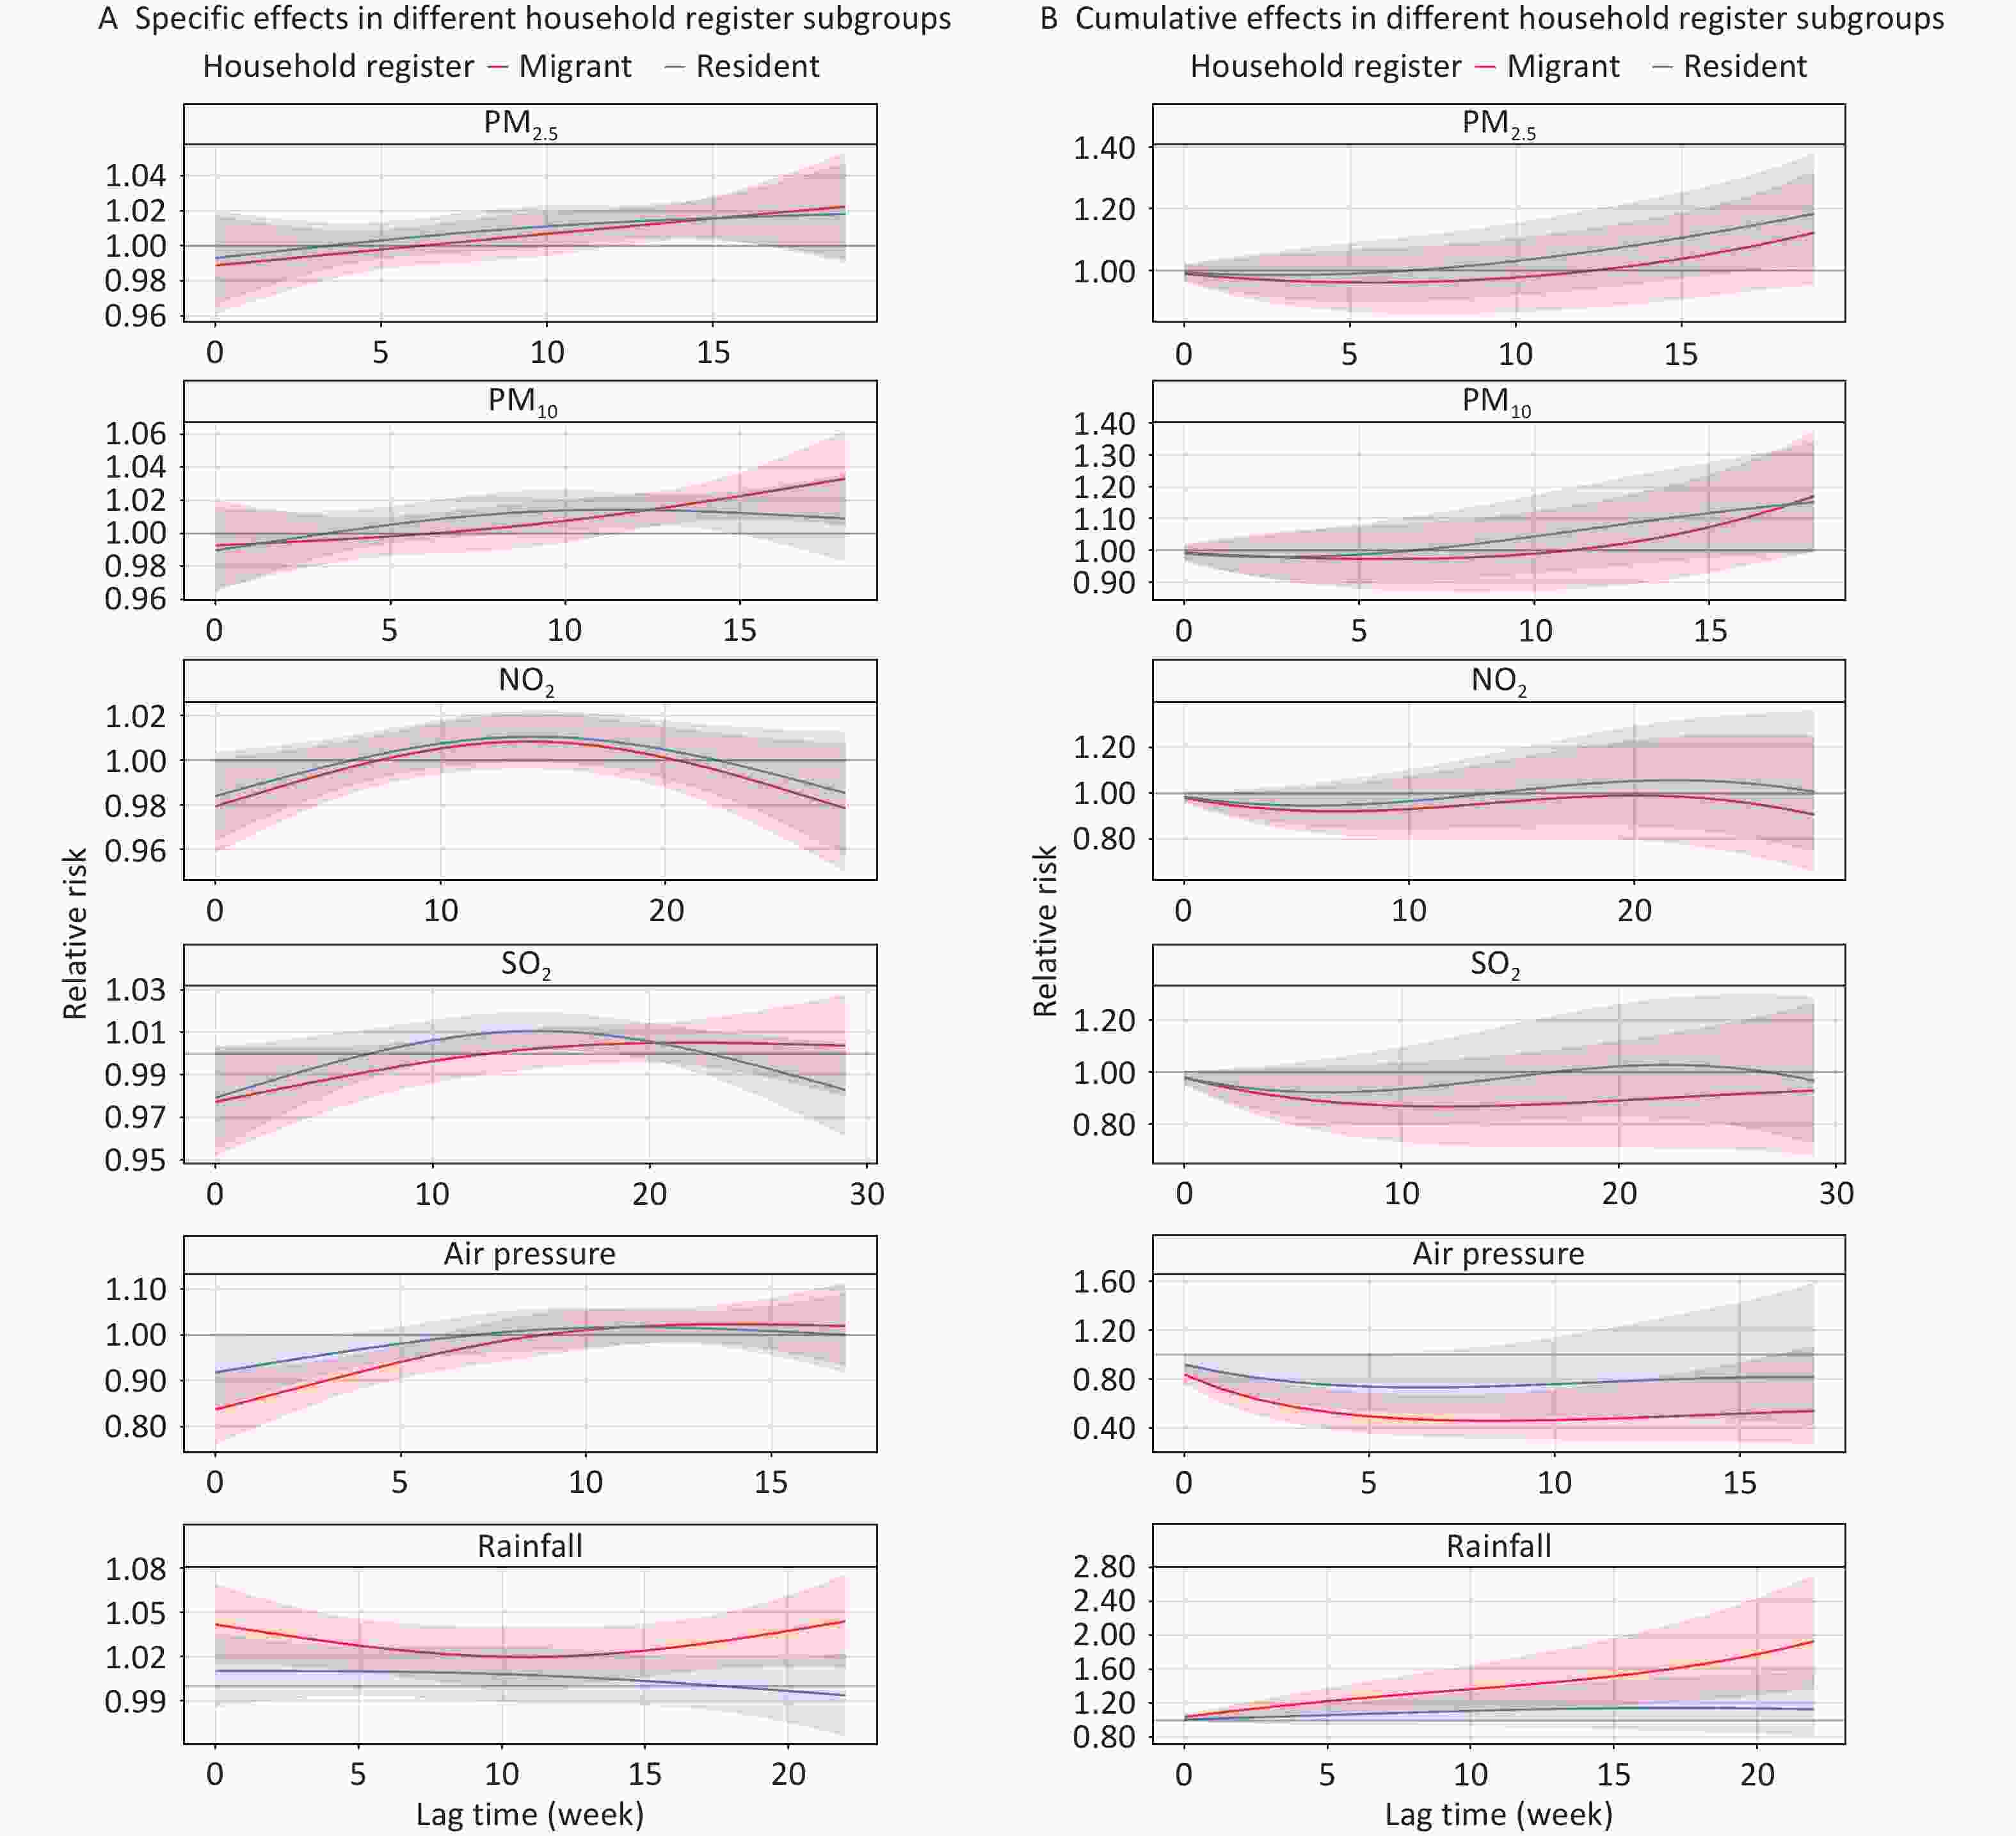
Figure 6. Effects of air pollutants and meteorological factors on risk of TB in different household register subgroups in single-factor models. The solid line represents the central estimates and the envelopes represent 95% confidence intervals. SO2, sulfur dioxide; NO2, nitrogen dioxide; PM2.5, particulate matter ≤ 2.5 μm in aerodynamic diameter; PM10, particulate matter ≤ 10 μm in aerodynamic diameter; NDVI, normalized difference vegetation index; TB, tuberculosis.
-
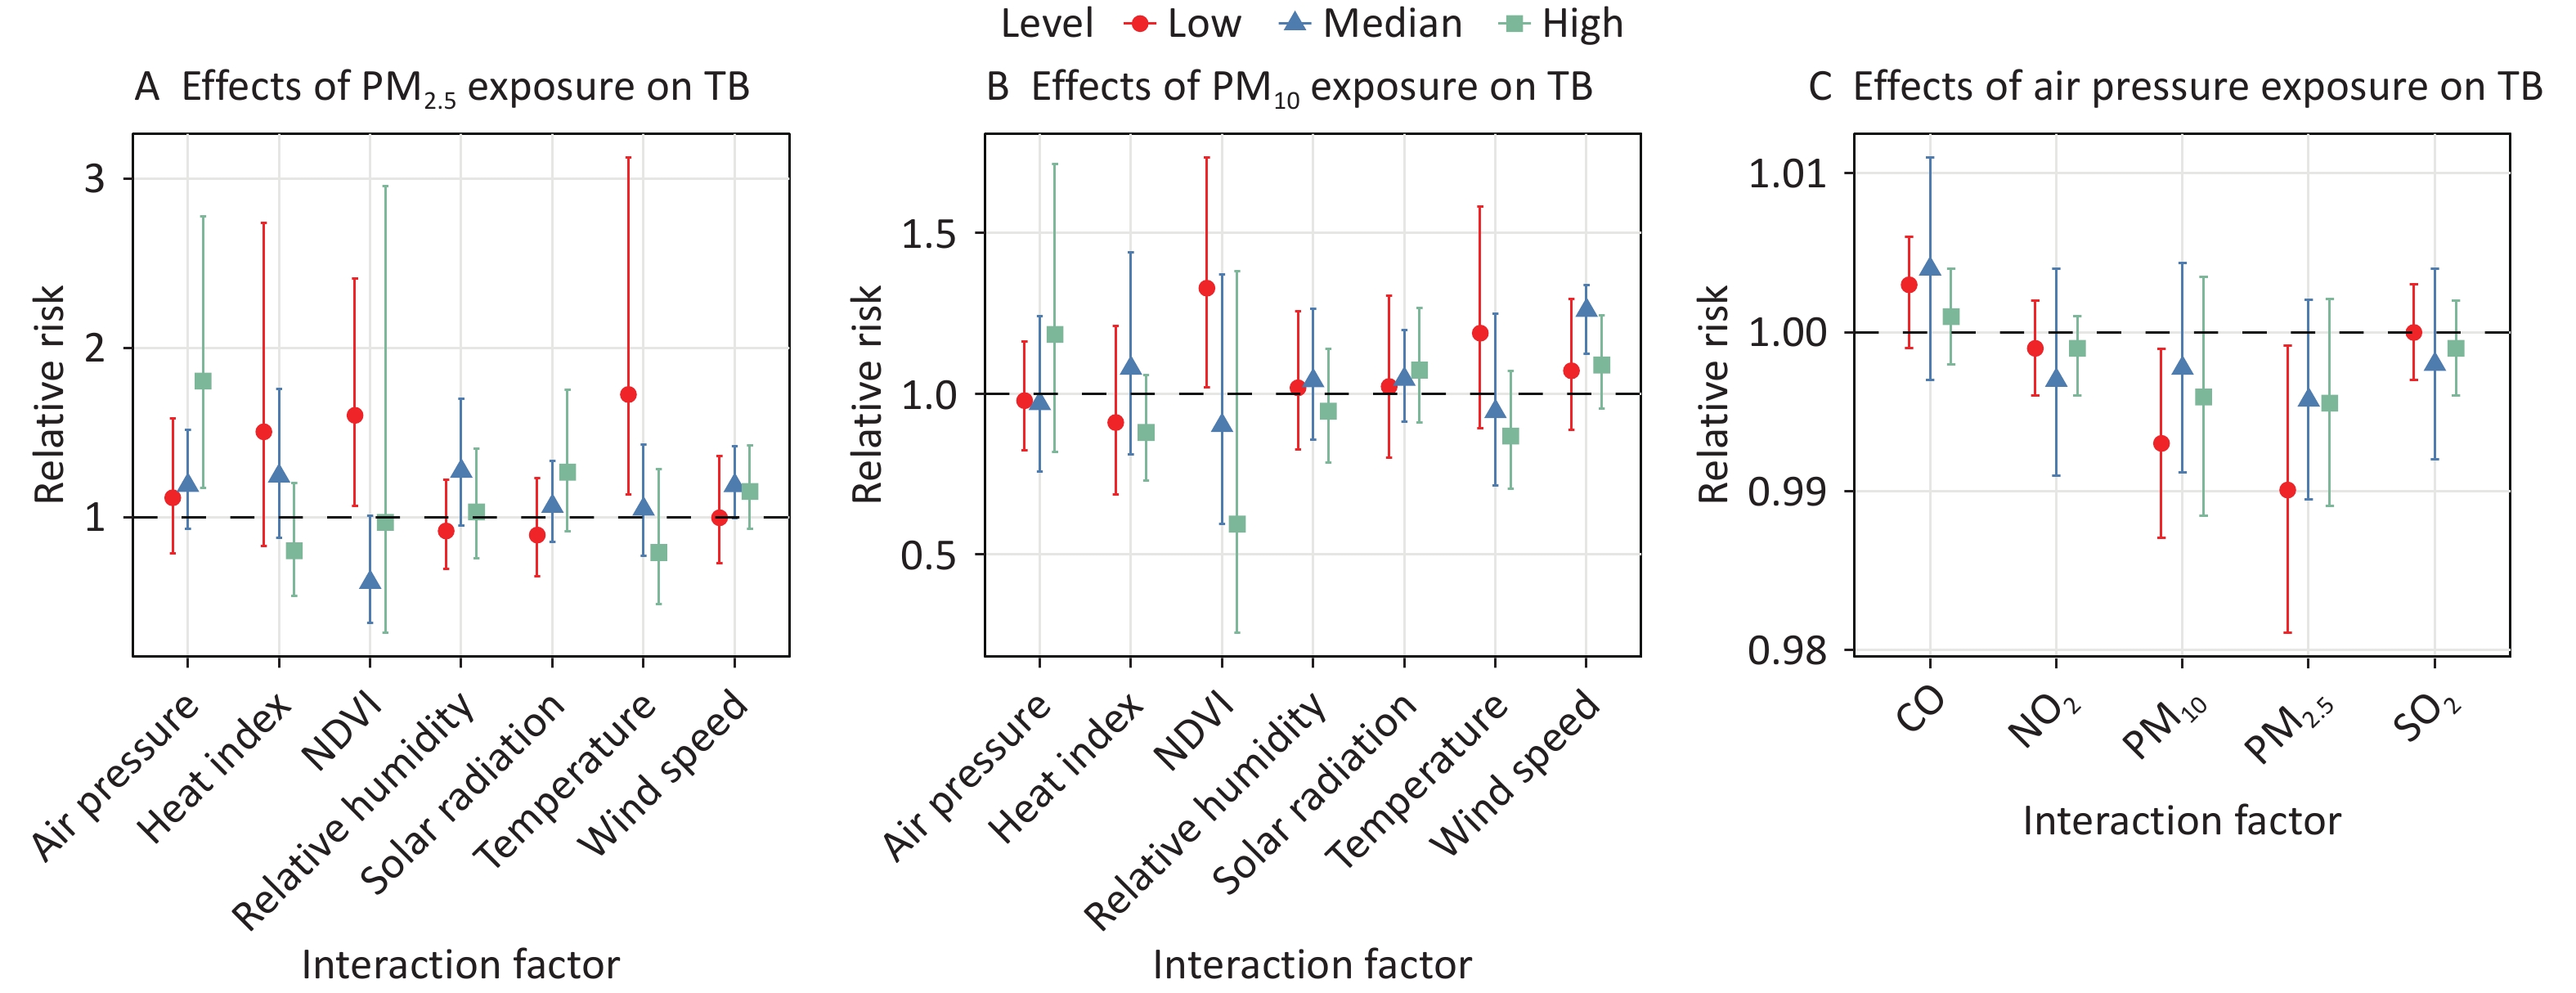
Figure 7 and Supplementary Table S7 illustrate the interactive effects of air pollutants, meteorological variables, and NDVI on the TB risk. Significant increases in cumulative TB risk for PM2.5 exposure were observed at low temperatures (RR = 1.728, 95% CI: 1.138–3.125) and high air pressure levels (RR = 1.807, 95% CI: 1.175–2.779). Notably, both PM2.5 (RR = 1.605, 95% CI: 1.069–2.411) and PM10 (RR = 1.329, 95% CI: 1.019–1.735) exposure posed significant TB risks at low NDVI levels, whereas no significant associations were observed at medium or high NDVI levels. Additionally, the association between PM10 exposure and TB cases was significant within the median centiles of wind speed strata (RR = 1.260, 95% CI: 1.124–1.338).
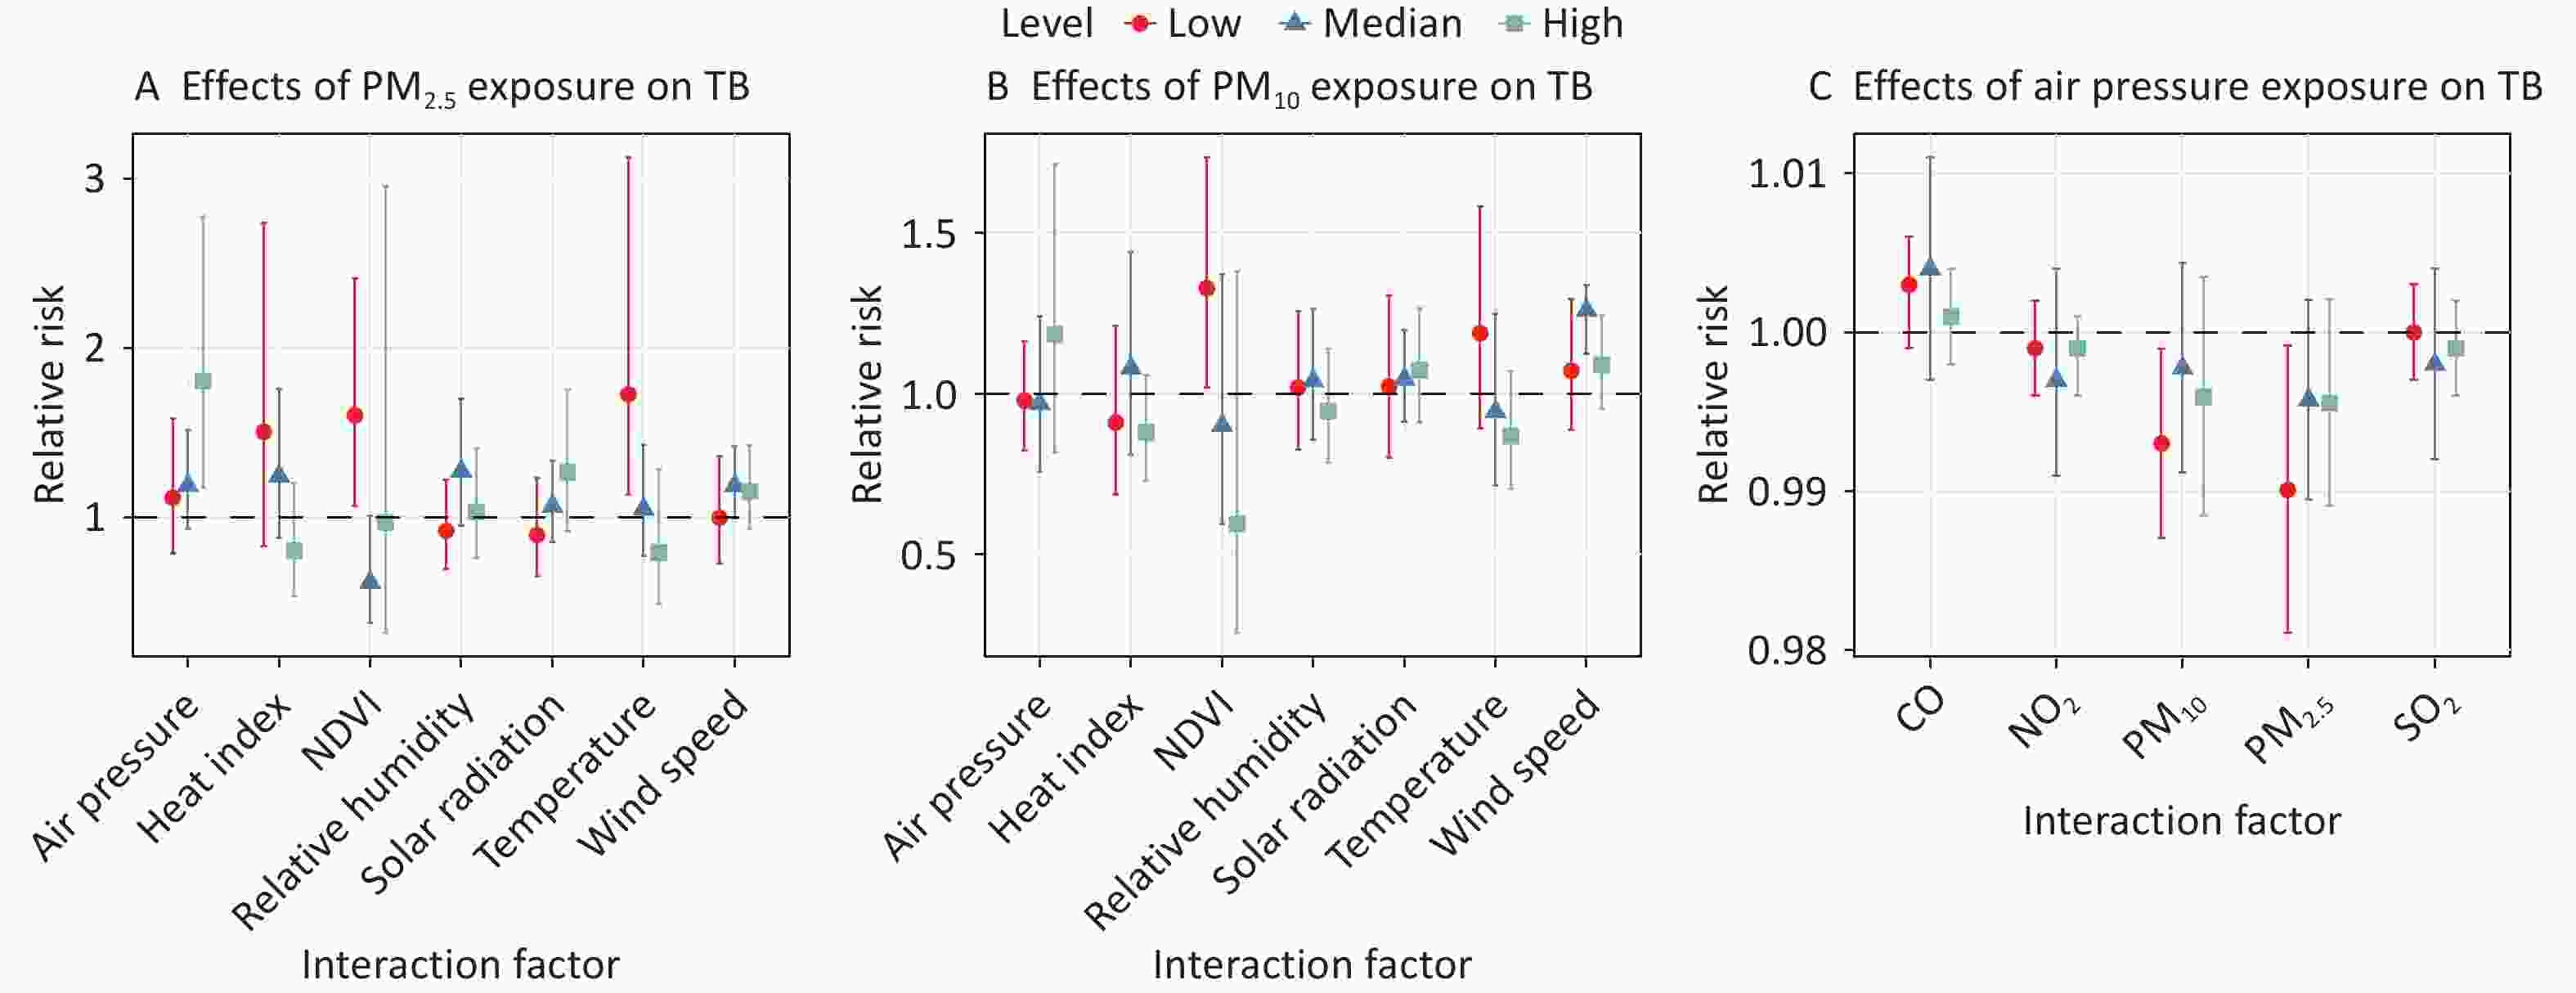
Figure 7. Interaction analysis between air pollutants, meteorological factors, and NDVI on risk of TB. (A) The cumulative-lag RR of 10 ug/m3 increase in PM2.5 for TB cases stratified by meteorological factors and NDVI levels. (B) The cumulative-lag RR of 10 μg/m3 increase in PM10 for TB cases stratified by meteorological factors and NDVI levels. (C) The cumulative-lag RR of 10 Pa increase in air pressure for TB cases stratified by air pollutants. The points indicate central estimates, while the vertical lines indicate 95% CI. NDVI, normalized difference vegetation index; CO, carbon monoxide; O3, ozone; SO2, sulfur dioxide; NO2, nitrogen dioxide; PM2.5, particulate matter ≤ 2.5 μm in aerodynamic diameter; PM10, particulate matter ≤ 10 μm in aerodynamic diameter; TB, tuberculosis; RR, relative risk; CI, confidence interval.
-
The sensitivity analysis confirmed the robustness of the findings. The results remained consistent when employing different maximum lag times and degrees of freedom for confounding environmental variables, as well as when making additional adjustments to construct multi-pollutant and multi-meteorological factor models (Supplementary Figures S4–S9).
-
In this study, we evaluated the independent effects of meteorological factors, air pollutants, and green space exposure on TB incidence, especially PM2.5 and PM10. We also characterized the interaction effects by analyzing varied exposure-response relationships across different categories, enriching our understanding of the co-exposure effects on TB cases. Our results indicated that PM2.5, PM10, and rainfall were positively associated with TB cases, whereas NO2, SO2, and air pressure were negatively associated. No significant association was found between green space and TB. Furthermore, low temperatures enhanced the association between PM2.5 and TB cases. These findings highlight the need for coordinated strategies to mitigate the impact of environmental factors on TB cases.
This study found positive correlations between PM2.5 and PM10 exposure and TB incidence. Similar associations have been reported in ecological studies from the Carolinas in the USA[64], as well as time-series studies in the Chinese cities of Lianyungang[10] and Fuyang[65], which all indicated that elevated concentrations of PM2.5 and PM10 are linked to higher TB incidence rates. However, other studies, including cohort studies from Taiwan[66] and Seoul[67], found no significant association between short- or long-term exposure to PM2.5, PM10 and active TB risk. These discrepancies may be partially due to variations in pollution levels. For example, in studies reporting no association, the median PM10 concentrations were 47.34 μg/m3 in Taiwan[66] and 62.80 μg/m3 in Seoul[67], both lower than the 85.43 μg/m3 in Lianyungang[10]. Similarly, Taiwan’s median PM2.5 concentration was 27.79 μg/m3[66], compared to 48.56 μg/m3 in Lianyungang[10]. In addition to pollution levels, other factors, such as meteorological conditions, industrialization, and the presence of toxic substances adsorbed onto PM2.5 or PM10 might contribute to differences in exposure-response effects[35]. Subgroup analyses further revealed that the association between PM2.5 and PM10 exposure and the risk of pulmonary TB was significant only among males; this could be attributed to higher rates of smoking and alcohol consumption, which suppress cell-mediated immunity and tumor necrosis factor-α (TNF-α) production, thus increasing vulnerability to TB[68,69].
Several biological mechanisms have been proposed to explain the association between TB cases and particulate matter exposure. Air pollutants can independently exacerbate airway epithelial damage, leading to oxidative stress or other toxic effects[70,71]. These harmful effects are particularly pronounced for smaller particles, such as PM2.5, which can penetrate deep into the alveolar region and impair alveolar macrophage activity[72]. Elevated PM2.5 levels increase iron availability, which facilitates MTB proliferation[73–75]. Furthermore, exposure to PM2.5 has been shown to enhance MTB colony-forming units in alveolar cells and disrupt immune responses, including the production of key inflammatory cytokines such as interferon-γ and TNF-α[76-78]. These factors create a favorable environment for MTB invasion.
Our study found no significant association between O3 exposure and TB cases, consistent with findings from Seoul, South Korea[67]. In contrast, a USA case-control study[79] reported a negative association, whereas a time-series analysis in Urumqi, China[80], found a positive correlation. These studies relied on O3 exposure estimates from fixed monitoring stations, which may not accurately reflect individual exposure levels, due to the chemical interactions between O3 and NO in the environment[81]. Therefore, the findings should be interpreted with caution.
Our study identified a negative correlation between SO2 exposure and TB cases, consistent with findings from time-series studies in Ningbo[82], Wuhan[83], and Hefei[84]. A case-crossover study in Madrid also reported a significant association between elevated SO2 concentrations and a reduced likelihood of PTB hospitalization (OR = 0.92, 95% CI: 0.86–0.99, P = 0.029)[77]. The antimicrobial properties of SO2 might explain this association. SO2 can penetrate microbial cell membranes and disrupt enzyme and protein activity, thereby effectively inhibiting microbial growth[85]. An experimental study demonstrated that inhalation of 14 mg/m³ of SO₂ increases levels of the pro-inflammatory cytokines TNF-α and interleukin-6 in murine lung tissue[86]. These cytokines play a crucial role in host’s defense against MTB by regulating granuloma formation[87].
Additionally, we observed a negative association between NO2 exposure and TB cases, which aligns with an experimental study demonstrating that NO₂ exhibits antimycobacterial activity[88]. In contrast, a meta-analysis by Xiang et al.[9] indicated that NO2 exposure (per 1 ppb increase; RR = 1.010) was associated with an increased risk of TB. These discrepancies may be due to variations in demographic factors, population susceptibility, geographic and climatic differences, methods of exposure quantification, and modeling choices[6]. Further research with larger sample sizes and more sensitive methodologies is essential to accurately assess the relationship between air pollutants and TB.
In our study, rainfall was positively correlated with TB, consistent with the findings of a previous geographically weighted regression analysis[89]. Rainfall reduces outdoor activity and exposure to sunlight, thereby decreasing ultraviolet (UV) radiation, which inhibits inflammation, enhances antimicrobial activity, and regulates vitamin D production[90]. Reduced UV exposure may weaken immune function and increase TB risk[90]. A subgroup analysis revealed that rainfall exposure was significantly associated with TB risk only in migrant populations. Living, working, and social interactions often occur in densely populated environments and may facilitate TB transmission[91]. Additionally, migrants may face greater barriers to accessing healthcare and social security, which further contributes to their heightened vulnerability to TB[92].
Our findings also indicated that higher air pressure was associated with a decreased risk of TB, which is consistent with the results of a generalized linear mixed model by Guo et al.[93] at the national level, in China. However, another study conducted in Lanzhou using a generalized additive model found a positive association between air pressure and TB incidence, with a lag of 4–6 days[94]. This discrepancy may be explained by differences in regional environmental factors such as temperature, humidity, and specific temporal lags. We hypothesized that high air pressure may influence atmospheric stability, potentially reducing the dispersion of air pollutants and pathogens; this, in turn, reduces the chances of human exposure to and infection with MTB. However, the mechanisms underlying this relationship remain unclear, and may involve complex interactions with other environmental factors. Further studies are required to elucidate these mechanisms.
Regrettably, we found no significant correlation for cumulative lagged risk, potentially because longer lag periods are needed to fully capture the cumulative impact of NDVI on TB risk. Furthermore, the absence of data on the quality or type of green spaces, as well as their distribution and accessibility in different parts of Shanghai, limited our ability to assess their potential influence on the results[95,96]. A nationwide modeling study in China reported that NDVI could mitigate the impact of air pollutants on TB incidence[97]. Exposure to green space may reduce ambient respirable particulate matter through the deposition effect of vegetation leaves[98] and alter the diffusion trajectory and speed of these particulates[99], thereby influencing MTB transmission and decreasing TB incidence. Additionally, greenery can change the chemical composition of particles by removing polycyclic aromatic hydrocarbons and heavy metals, thereby altering the relationship between particulate matter and TB incidence[100]. Currently, there is a lack of research on the independent effects of green space on TB incidence of TB. Further studies are required to provide data-driven recommendations for the utilization of green space to enhance TB prevention and control in China.
The interaction analysis revealed interesting interactive effects of environmental factors on TB cases, providing comprehensive insights into the complex interplay between air pollution, weather conditions, green space, and TB cases in Shanghai. Specifically, low temperatures combined with high PM2.5 concentrations may jointly promote TB risk. Similarly, Huang et al.[63] reported a downward trend in the PM2.5-TB association with increasing temperature levels, while another study found that high PM2.5 concentrations reinforce the association between temperature and TB hospitalizations, particularly in cold environments[101]. This interaction may be explained by the cold-induced nasal mucosal responses and epithelial desquamation, which trigger inflammation and accelerate latent TB activation[60,102]. Low temperatures are often associated with reduced UV radiation exposure, leading to vitamin D deficiency. This deficiency impairs immune function and increases vulnerability to the adverse effects of air pollution, further heightening susceptibility to TB in individuals with latent infections[103,104]. Furthermore, experimental studies have demonstrated that at low temperatures, both metabolism and minute ventilation are elevated, which increase particulate matter uptake[105]. These factors, combined with the ability of PM2.5 to carry MTB and penetrate deeply into the lungs, may synergistically promote TB reactivation or new infections. Additionally, moderate wind speeds may enhance the spread of both particulate matter and MTB, intensifying the impact of PM10 on TB[62].
This study has several key public health implications. First, to reduce TB incidence and improve overall health, stringent air quality standards targeting PM2.5 and PM10 are crucial, especially in high-pollution areas, along with allocating medical resources to these regions. Second, during periods of elevated PM2.5 and PM10 concentrations, particularly under haze conditions, enhancing TB screening among symptomatic individuals and high-risk populations (e.g., those with HIV or diabetes) within specific lag periods could help mitigate the impact of air pollution on TB. Additionally, during cold seasons, measures such as wearing masks in crowded areas should be implemented to mitigate the combined effects of low temperatures and high PM2.5 levels on TB risk. Finally, public education campaigns can raise awareness of the health impacts of air pollution and weather, encouraging preventive actions such as reducing outdoor activities during high pollution and cold weather.
This study had several limitations. First, ecological studies are inherently constrained in establishing causality, offering only correlational evidence, rather than confirming a direct relationship between environmental factors and TB cases. Additionally, we used NDVI as the sole indicator of greenness, without considering the quality, type (e.g., parks vs. tree-lined streets), or accessibility of green spaces, which may vary across Shanghai and influence health outcomes[95,96]. Future studies should incorporate these factors to better understand the relationship between green space and TB incidence. Furthermore, owing to data limitations, individual-level factors such as socioeconomic status, smoking, and healthcare-seeking behaviors could not be accounted for, restricting our ability to assess their modifying effects. Finally, relying on municipal-level environmental exposure data as a proxy for individual exposure may result in misclassifications that could affect the accuracy of the results. Future research should focus on cohort studies based on individual-level data and incorporate more precise exposure and covariate information to provide more reliable findings and strengthen the conclusions of this study.
-
Our study elucidated the independent and interactive effects of air pollutants, meteorological variables, and greenspace exposure on TB incidence in Shanghai, China. Specifically, PM2.5, PM10, and rainfall were positively associated with TB, whereas NO2, SO2, and air pressure were negatively correlated. Additionally, low temperatures enhanced the association between PM2.5 and TB cases. No significant association was observed between greenspace exposure and TB cases. Future research utilizing larger-scale TB case studies and advanced epidemiological methods, such as prospective cohort or case-control studies, is essential to elucidate the impact of environmental exposure on TB cases. These findings contribute to a deeper understanding of the TB risk factors and provide valuable evidence for public health policymakers to guide TB prevention, control, and air quality improvement.
doi: 10.3967/bes2025.041
Independent and Interactive Effects of Air Pollutants, Meteorological Factors, and Green Space on Tuberculosis Incidence in Shanghai
-
Abstract:
Objective To assess the independent and combined effects of air pollutants, meteorological factors, and greenspace exposure on new tuberculosis (TB) cases. Methods TB case data from Shanghai (2013–2018) were obtained from the Shanghai Center for Disease Control and Prevention. Environmental data on air pollutants, meteorological variables, and greenspace exposure were obtained from the National Tibetan Plateau Data Center. We employed a distributed-lag nonlinear model to assess the effects of these environmental factors on TB cases. Results Increased TB risk was linked to PM2.5, PM10, and rainfall, whereas NO2, SO2, and air pressure were associated with a reduced risk. Specifically, the strongest cumulative effects occurred at various lags: PM2.5 (RR = 1.166, 95% CI: 1.026–1.325) at 0–19 weeks; PM10 (RR = 1.167, 95% CI: 1.028–1.324) at 0–18 weeks; NO2 (RR = 0.968, 95% CI: 0.938–0.999) at 0–1 weeks; SO2 (RR = 0.945, 95% CI: 0.894–0.999) at 0–2 weeks; air pressure (RR = 0.604, 95% CI: 0.447–0.816) at 0–8 weeks; and rainfall (RR = 1.404, 95% CI: 1.076–1.833) at 0–22 weeks. Green space exposure did not significantly impact TB cases. Additionally, low temperatures amplified the effect of PM2.5 on TB. Conclusion Exposure to PM2.5, PM10, and rainfall increased the risk of TB, highlighting the need to address air pollutants for the prevention of TB in Shanghai. -
Key words:
- Tuberculosis /
- Air pollutant /
- Meteorological factor /
- Green space /
- Interaction /
- PM2.5
All authors declare that they have no competing interests.
The study and the use of data were reviewed and approved by the Ethical Review Committee of the School of Public Health (Shenzhen), Sun Yat-sen University (2022014).
注释:1) Authors’ Contributions: 2) Competing Interests: 3) Ethics: -
Figure 1. Spatial KDE of Tuberculosis Cases in Shanghai, 2013–2018. TB, tuberculosis; KDE, kernel density estimation. Map Approval No. GS(2024)0650.
Figure 2. Effects of air pollutants and NDVI on risk of TB in specific and cumulative lag times in single-factor models. The solid line represents the central estimates and the envelopes represent 95% confidence intervals. CO, carbon monoxide; O3, ozone; SO2, sulfur dioxide; NO2, nitrogen dioxide; PM2.5, particulate matter ≤ 2.5 μm in aerodynamic diameter; PM10, particulate matter ≤ 10 μm in aerodynamic diameter; NDVI, normalized difference vegetation index; TB, tuberculosis.
Figure 3. Effects of meteorological factors on the risk of TB in specific and cumulative lag times in single-factor models. The solid line represents the central estimates and the envelopes represent 95% confidence intervals. TB, tuberculosis.
Figure 4. Effects of air pollutants and meteorological factors on risk of TB in different sex subgroups in single-factor models. The solid line represents the central estimates and the envelopes represent 95% confidence intervals. SO2, sulfur dioxide; NO2, nitrogen dioxide; PM2.5, particulate matter ≤ 2.5 μm in aerodynamic diameter; PM10, particulate matter ≤ 10 μm in aerodynamic diameter; NDVI, normalized difference vegetation index; TB, tuberculosis.
Figure 5. Effects of air pollutants and meteorological factors on risk of TB in different age subgroups in single-factor models. The solid line represents the central estimates and the envelopes represent 95% confidence intervals. SO2, sulfur dioxide; NO2, nitrogen dioxide; PM2.5, particulate matter ≤ 2.5 μm in aerodynamic diameter; PM10, particulate matter ≤ 10 μm in aerodynamic diameter; NDVI, normalized difference vegetation index; TB, tuberculosis.
Figure 6. Effects of air pollutants and meteorological factors on risk of TB in different household register subgroups in single-factor models. The solid line represents the central estimates and the envelopes represent 95% confidence intervals. SO2, sulfur dioxide; NO2, nitrogen dioxide; PM2.5, particulate matter ≤ 2.5 μm in aerodynamic diameter; PM10, particulate matter ≤ 10 μm in aerodynamic diameter; NDVI, normalized difference vegetation index; TB, tuberculosis.
Figure 7. Interaction analysis between air pollutants, meteorological factors, and NDVI on risk of TB. (A) The cumulative-lag RR of 10 ug/m3 increase in PM2.5 for TB cases stratified by meteorological factors and NDVI levels. (B) The cumulative-lag RR of 10 μg/m3 increase in PM10 for TB cases stratified by meteorological factors and NDVI levels. (C) The cumulative-lag RR of 10 Pa increase in air pressure for TB cases stratified by air pollutants. The points indicate central estimates, while the vertical lines indicate 95% CI. NDVI, normalized difference vegetation index; CO, carbon monoxide; O3, ozone; SO2, sulfur dioxide; NO2, nitrogen dioxide; PM2.5, particulate matter ≤ 2.5 μm in aerodynamic diameter; PM10, particulate matter ≤ 10 μm in aerodynamic diameter; TB, tuberculosis; RR, relative risk; CI, confidence interval.
Table 1. Characteristics of new TB cases in Shanghai, 2013–2018 (N = 39,579)
Characteristics N (%) Age, median years (IQR) 42 (27, 60) Age group (years) 0–14 161 (0.41) 15–65 32,643 (82.48) > 65 6,775 (17.12) Sex Male 27,150 (68.60) Female 12,429 (31.40) Race Han nationality 39,320 (99.35) Ethnic minority 256 (0.65) Unclear 3 (0.01) Occupation Labor worker 5,757 (14.55) Farmer 1,622 (4.10) Commercial service 1,799 (4.55) Medical staff 230 (0.58) Teacher and student 1,943 (4.91) Office worker 1,613 (4.08) Retired 9,399 (23.75) Unemployed 5,304 (13.40) Unclear 3,524 (8.90) Other 8,388 (21.19) Household register Migrant patients 17,022 (43.01) Resident patients 22,301 (56.35) Unclear 256 (0.65) Severe case No 32,248 (81.48) Yes 7,331 (18.52) TB history New case 36,073 (91.14) Retreated case 3,506 (8.86) Patient source Active screening 1,210 (3.06) Passive screening 38,369 (96.94) Pathogen result Positive 18,704 (47.26) Negative 19,468 (49.19) Unknown 1,407 (3.55) Note. IQR, interquartile range; TB, tuberculosis; N, number.  下载: 导出CSV
Table 2. Distribution characteristics of weekly TB cases, air pollutants, meteorological factors, and NDVI in Shanghai during 2013–2018
Characteristic Mean ± SD Min P25 Median P75 Max TB cases 126.60 ± 24.00 21.00 116.00 129.00 143.00 176.00 Air pollutant PM10 (μg/m3) 74.48 ± 29.10 28.12 53.61 69.57 87.27 249.04 PM2.5 (μg/m3) 46.88 ± 21.35 11.68 33.08 43.44 56.40 188.60 SO2 (μg/m3) 18.88 ± 8.69 6.98 12.94 16.67 21.92 57.20 NO2 (μg/m3) 39.89 ± 12.97 13.91 30.98 38.05 46.94 86.58 CO (mg/m3) 0.85 ± 0.32 0.44 0.70 0.81 0.94 5.22 O3 (μg/m3) 102.13 ± 31.39 44.61 77.14 101.11 123.60 210.89 Meteorological factor Temperature (°C) 17.40 ± 8.64 −0.84 9.93 18.17 24.33 34.74 Air pressure (kPa) 101.63 ± 0.84 100.12 100.85 101.64 102.33 103.40 Wind speed (m/s) 2.94 ± 0.60 1.74 2.51 2.85 3.29 5.10 Relative humidity (%) 75.15 ± 9.00 48.29 68.99 76.14 81.50 93.84 Heat index 67.90 ± 13.48 38.39 56.60 69.89 78.38 92.93 Solar radiation (MJ/m2) 87.85 ± 34.79 13.43 61.53 84.35 114.16 177.70 Rainfall (mm) 26.69 ± 30.27 0.00 4.72 17.27 38.00 212.12 NDVI 0.40 ± 0.09 0.20 0.32 0.39 0.48 0.56 Note. NDVI, normalized difference vegetation index; CO, carbon monoxide; O3, ozone; SO2, sulfur dioxide; NO2, nitrogen dioxide; PM2.5, particulate matter < 2.5 μm in aerodynamic diameter; PM10, particulate matter < 10 μm in aerodynamic diameter; TB, tuberculosis; SD, standard deviation; P25, 25th percentile; P75, 75th percentile
下载: 导出CSV
-
[1] WHO. Global tuberculosis report 2023. Geneva: WHO. https://www.who.int/publications/i/item/9789240083851. [2024-08-22]. [2] Kyu HH, Maddison ER, Henry NJ, et al. Global, regional, and national burden of tuberculosis, 1990-2016: results from the Global Burden of Diseases, Injuries, and Risk Factors 2016 Study. Lancet Infect Dis, 2018; 18, 1329−49. doi: 10.1016/S1473-3099(18)30625-X [3] Sun QF, Li SS, Gao MQ, et al. Therapeutic strategies for tuberculosis: progress and lessons learned. Biomed Environ Sci, 2024; 37, 1310−23. [4] Uplekar M, Weil D, Lonnroth K, et al. WHO's new end TB strategy. Lancet, 2015; 385, 1799−801. doi: 10.1016/S0140-6736(15)60570-0 [5] Qin TY, Hao Y, Wu Y, et al. Association between averaged meteorological factors and tuberculosis risk: a systematic review and meta-analysis. Environ Res, 2022; 212, 113279. doi: 10.1016/j.envres.2022.113279 [6] Popovic I, Magalhaes RJS, Ge EJ, et al. A systematic literature review and critical appraisal of epidemiological studies on outdoor air pollution and tuberculosis outcomes. Environ Res, 2019; 170, 33−45. doi: 10.1016/j.envres.2018.12.011 [7] Li JX, Luan QY, Li BB, et al. Outdoor environmental exposome and the burden of tuberculosis: findings from nearly two million adults in northwestern China. J Hazard Mater, 2023; 459, 132222. doi: 10.1016/j.jhazmat.2023.132222 [8] Xu M, Li Y, Liu B, et al. Temperature and humidity associated with increases in tuberculosis notifications: a time-series study in Hong Kong. Epidemiol Infect, 2021; 149, e8. doi: 10.1017/S0950268820003040 [9] Xiang K, Xu ZW, Hu YQ, et al. Association between ambient air pollution and tuberculosis risk: a systematic review and meta-analysis. Chemosphere, 2021; 277, 130342. doi: 10.1016/j.chemosphere.2021.130342 [10] Li ZQ, Mao XH, Liu Q, et al. Long-term effect of exposure to ambient air pollution on the risk of active tuberculosis. Int J Infect Dis, 2019; 87, 177−84. doi: 10.1016/j.ijid.2019.07.027 [11] Liu FQ, Zhang ZX, Chen HY, et al. Associations of ambient air pollutants with regional pulmonary tuberculosis incidence in the central Chinese province of Hubei: a Bayesian spatial-temporal analysis. Environ Health, 2020; 19, 51. doi: 10.1186/s12940-020-00604-y [12] Sinharay R, Gong JC, Barratt B, et al. Respiratory and cardiovascular responses to walking down a traffic-polluted road compared with walking in a traffic-free area in participants aged 60 years and older with chronic lung or heart disease and age-matched healthy controls: a randomised, crossover study. Lancet, 2018; 391, 339−49. doi: 10.1016/S0140-6736(17)32643-0 [13] Hahad O, Lelieveld J, Birklein F, et al. Ambient air pollution increases the risk of cerebrovascular and neuropsychiatric disorders through induction of inflammation and oxidative stress. Int J Mol Sci, 2020; 21, 4306. doi: 10.3390/ijms21124306 [14] Lee PC, Wu CD, Tsai HJ, et al. Residential greenness and birth outcomes: evaluating the mediation and interaction effects of particulate air pollution. Ecotoxicol Environ Saf, 2021; 211, 111915. doi: 10.1016/j.ecoenv.2021.111915 [15] Nieuwenhuijsen MJ, Khreis H, Triguero-Mas M, et al. Fifty shades of green: pathway to healthy urban living. Epidemiology, 2017; 28, 63−71. doi: 10.1097/EDE.0000000000000549 [16] Dimala CA, Kadia BM. A systematic review and meta-analysis on the association between ambient air pollution and pulmonary tuberculosis. Sci Rep, 2022; 12, 11282. doi: 10.1038/s41598-022-15443-9 [17] Ge EJ, Gao JH, Ren ZP, et al. Greenness exposure and all-cause mortality during multi-drug resistant tuberculosis treatment: a population-based cohort study. Sci Total Environ, 2021; 771, 145422. doi: 10.1016/j.scitotenv.2021.145422 [18] Patel CJ, Ioannidis JPA. Studying the elusive environment in large scale. JAMA, 2014; 311, 2173−4. doi: 10.1001/jama.2014.4129 [19] Chen GH, Song GX, Jiang LL, et al. Interaction between ambient particles and ozone and its effect on daily mortality. Biomed Environ Sci, 2007; 20, 502−5. [20] Wang MZ, Zheng S, Wang SG, et al. The weather temperature and air pollution interaction and its effect on hospital admissions due to respiratory system diseases in western China. Biomed Environ Sci, 2013; 26, 403−7. [21] Zhan ZY, Fang HY, Xu XY, et al. Interactions of particulate matter with temperature, heat index and relative humidity on pediatric hand, foot, and mouth disease in a subtropical city. Environ Pollut, 2023; 336, 122385. doi: 10.1016/j.envpol.2023.122385 [22] Guo YN, Yang LS, Li HR, et al. County level study of the interaction effect of PM2.5 and climate sustainability on mortality in China. Front Public Health, 2023; 10, 1036272. doi: 10.3389/fpubh.2022.1036272 [23] Liu C, Chen RJ, Sera F, et al. Interactive effects of ambient fine particulate matter and ozone on daily mortality in 372 cities: two stage time series analysis. BMJ, 2023; 383, e075203. [24] Yang L, Chen H, Gao HY, et al. Prenatal and postnatal early life exposure to greenness and particulate matter of different size fractions in relation to childhood rhinitis - a multi-center study in China. Sci Total Environ, 2024; 938, 173402. doi: 10.1016/j.scitotenv.2024.173402 [25] Yuval, Levi Y, Broday DM. Revealing causality in the associations between meteorological variables and air pollutant concentrations. Environ Pollut, 2024; 345, 123526. doi: 10.1016/j.envpol.2024.123526 [26] Gordon CJ. Role of environmental stress in the physiological response to chemical toxicants. Environ Res, 2003; 92, 1−7. doi: 10.1016/S0013-9351(02)00008-7 [27] Wang Y, Wang M, Wu YM, et al. Exploring the effect of ecological land structure on PM2.5: a panel data study based on 277 prefecture-level cities in China. Environ Int, 2023; 174, 107889. doi: 10.1016/j.envint.2023.107889 [28] Schwaab J, Meier R, Mussetti G, et al. The role of urban trees in reducing land surface temperatures in European cities. Nat Commun, 2021; 12, 6763. doi: 10.1038/s41467-021-26768-w [29] Iungman T, Cirach M, Marando F, et al. Cooling cities through urban green infrastructure: a health impact assessment of European cities. Lancet, 2023; 401, 577−89. doi: 10.1016/S0140-6736(22)02585-5 [30] Shanghai Statistics Bureau. Shanghai statistical yearbook 2023. https://tjj.sh.gov.cn/tjnj/20240321/5a35a44acace471f87c75393133fa142.html. [2024-07-13]. (In Chinese) [31] Ministry of Ecology and Environment of the People's Republic of China. Technical regulation on ambient air quality index (on trial). https://www.mee.gov.cn/ywgz/fgbz/bz/bzwb/jcffbz/201203/t20120302_224166.shtml. [2024-12-29]. (In Chinese) [32] Furin J, Cox H, Pai M. Tuberculosis. Lancet, 2019; 393, 1642−56. doi: 10.1016/S0140-6736(19)30308-3 [33] National Health and Family Planning Commission of the People's Republic of China. Classification of tuberculosis, WS196-2017. Electronic Journal of Emerging Infectious Diseases, 2018. (In Chinese) [34] Xiong Y, Yang MX, Wang ZZ, et al. Association of daily exposure to air pollutants with the risk of tuberculosis in Xuhui district of Shanghai, China. Int J Environ Res Public Health, 2022; 19, 6085. doi: 10.3390/ijerph19106085 [35] Zhu S, Xia L, Wu JL, et al. Ambient air pollutants are associated with newly diagnosed tuberculosis: a time-series study in Chengdu, China. Sci Total Environ, 2018; 631-632, 47-55. [36] Zhang XY, Hou FS, Li XS, et al. Study of surveillance data for class B notifiable disease in China from 2005 to 2014. Int J Infect Dis, 2016; 48, 7−13. doi: 10.1016/j.ijid.2016.04.010 [37] Wei J, Li ZQ, Xue WH, et al. The ChinaHighPM10 dataset: generation, validation, and spatiotemporal variations from 2015 to 2019 across China. Environ Int, 2021; 146, 106290. doi: 10.1016/j.envint.2020.106290 [38] Wei J, Li ZQ, Li K, et al. Full-coverage mapping and spatiotemporal variations of ground-level ozone (O3) pollution from 2013 to 2020 across China. Remote Sens Environ, 2022; 270, 112775. doi: 10.1016/j.rse.2021.112775 [39] Wei J, Li ZQ, Lyapustin A, et al. Reconstructing 1-km-resolution high-quality PM2.5 data records from 2000 to 2018 in China: spatiotemporal variations and policy implications. Remote Sens Environ, 2021; 252, 112136. doi: 10.1016/j.rse.2020.112136 [40] Wei J, Li ZQ, Cribb M, et al. Improved 1 km resolution PM2.5 estimates across China using enhanced space-time extremely randomized trees. Atmos Chem Phys, 2020; 20, 3273−89. doi: 10.5194/acp-20-3273-2020 [41] Wei J, Liu S, Li ZQ, et al. Ground-level NO2 surveillance from space across China for high resolution using interpretable spatiotemporally weighted artificial intelligence. Environ Sci Technol, 2022; 56, 9988−98. doi: 10.1021/acs.est.2c03834 [42] Wei J, Li ZQ, Wang J, et al. Ground-level gaseous pollutants (NO2, SO2, and CO) in China: daily seamless mapping and spatiotemporal variations. Atmos Chem Phys, 2023; 23, 1511−32. doi: 10.5194/acp-23-1511-2023 [43] Wei J, Li ZQ. ChinaHighSO2: high-resolution and high-quality ground-level SO2 dataset for China (2013-2023). https://data.tpdc.ac.cn/zh-hans/data/7630b0a2-58d7-4093-bd48-bbe69ddec7fd. [2024-08-22]. (In Chinese) [44] Wei J, Li ZQ. ChinaHighPM2.5: high-resolution and high-quality ground-level PM2.5 dataset for China (2000-2023). https://data.tpdc.ac.cn/zh-hans/data/6168e75d-93ab-4e4a-b7ff-33152e49d0bf. [2024-08-22]. (In Chinese) [45] Wei J, Li ZQ. ChinaHighO3: high-resolution and high-quality ground-level MDA8 O3 dataset for China (2000-2023). https://data.tpdc.ac.cn/zh-hans/data/87753867-77c8-42f1-b2e6-da569679635f. [2024-08-22]. (In Chinese) [46] Wei J, Li ZQ. ChinaHighPM10: high-resolution and high-quality ground-level PM10 dataset for China (2000-2023). https://data.tpdc.ac.cn/zh-hans/data/30b46d2f-78ee-4f3e-88ad-690383d47df5. [2024-08-22]. (In Chinese) [47] Wei J, Li ZQ. ChinaHighNO2: high-resolution and high-quality ground-level NO2 dataset for China (2008-2023). https://data.tpdc.ac.cn/zh-hans/data/cdd719d1-e0c0-49be-9f20-6a0ba54c8b38. [2024-08-22]. (In Chinese) [48] Wei J, Li ZQ. ChinaHighCO: High-resolution and High-quality Ground-level CO dataset for China (2013-2023). https://data.tpdc.ac.cn/en/data/dab9def0-ff3b-4195-b5ad-34eafb192f05. [2024-08-22]. [49] Yang K, He J, Tang W, et al. China meteorological forcing dataset (1979-2018). https://dx. doi.org/10.11888/AtmosphericPhysics.tpe.249369.file. [2024-08-22]. [50] He J, Yang K, Tang WJ, et al. The first high-resolution meteorological forcing dataset for land process studies over China. Sci Data, 2020; 7, 25. doi: 10.1038/s41597-020-0369-y [51] Yang K, He J, Tang WJ, et al. On downward shortwave and longwave radiations over high altitude regions: observation and modeling in the Tibetan Plateau. Agr Forest Meteorol, 2010; 150, 38−46. doi: 10.1016/j.agrformet.2009.08.004 [52] Yin Q, Wang JF. A better indicator to measure the effects of meteorological factors on cardiovascular mortality: heat index. Environ Sci Pollut Res, 2018; 25, 22842−9. doi: 10.1007/s11356-018-2396-1 [53] Li HW, Cao Y, Xiao JF, et al. A daily gap-free normalized difference vegetation index dataset from 1981 to 2023 in China. Sci Data, 2024; 11, 527. doi: 10.1038/s41597-024-03364-3 [54] Heo S, Bell ML. The influence of green space on the short-term effects of particulate matter on hospitalization in the U. S. for 2000-2013. Environ Res, 2019; 174, 61−8. doi: 10.1016/j.envres.2019.04.019 [55] Gasparrini A. Distributed lag Linear and non-linear models in R: the package DLNM. J Stat Softw, 2011; 43, 1−20. [56] Gasparrini A. Modeling exposure-lag-response associations with distributed lag non-linear models. Stat Med, 2014; 33, 881−99. doi: 10.1002/sim.5963 [57] Sun SH, Chang QX, He JY, et al. The association between air pollutants, meteorological factors and tuberculosis cases in Beijing, China: a seven-year time series study. Environ Res, 2023; 216, 114581. doi: 10.1016/j.envres.2022.114581 [58] Li WX, Wang XD, Bi B, et al. Influence of temperature and humidity on the incidence of pulmonary tuberculosis in Hainan, China, 2004-2018. Biomed Environ Sci, 2024; 37, 1080−5. [59] Konopka K, Micek A, Ochenduszko S, et al. Combined neutrophil-to-lymphocyte and platelet-volume-to-platelet ratio (NLR and PVPR Score) represents a novel prognostic factor in advanced gastric cancer patients. J Clin Med, 2021; 10, 3902. doi: 10.3390/jcm10173902 [60] Huang K, Yang XJ, Hu CY, et al. Short-term effect of ambient temperature change on the risk of tuberculosis admissions: assessments of two exposure metrics. Environ Res, 2020; 189, 109900. doi: 10.1016/j.envres.2020.109900 [61] Chen F, Deng ZB, Deng Y, et al. Attributable risk of ambient PM10 on daily mortality and years of life lost in Chengdu, China. Sci Total Environ, 2017; 581-582, 426-33. [62] Li ZQ, Liu Q, Zhan MY, et al. Meteorological factors contribute to the risk of pulmonary tuberculosis: a multicenter study in eastern China. Sci Total Environ, 2021; 793, 148621. doi: 10.1016/j.scitotenv.2021.148621 [63] Wang J, Li W, Huang WZ, et al. The associations of ambient fine particles with tuberculosis incidence and the modification effects of ambient temperature: a nationwide time-series study in China. J Hazard Mater, 2023; 460, 132448. doi: 10.1016/j.jhazmat.2023.132448 [64] Smith GS, Schoenbach VJ, Richardson DB, et al. Particulate air pollution and susceptibility to the development of pulmonary tuberculosis disease in North Carolina: an ecological study. Int J Environ Health Res, 2014; 24, 103−12. doi: 10.1080/09603123.2013.800959 [65] Wang XQ, Li YQ, Hu CY, et al. Short-term effect of ambient air pollutant change on the risk of tuberculosis outpatient visits: a time-series study in Fuyang, China. Environ Sci Pollut Res, 2022; 29, 30656−72. doi: 10.1007/s11356-021-17323-7 [66] Lai TC, Chiang CY, Wu CF, et al. Ambient air pollution and risk of tuberculosis: a cohort study. Occup Environ Med, 2016; 73, 56−61. doi: 10.1136/oemed-2015-102995 [67] Hwang SS, Kang S, Lee JY, et al. Impact of outdoor air pollution on the incidence of tuberculosis in the Seoul metropolitan area, South Korea. Korean J Intern Med, 2014; 29, 183−90. doi: 10.3904/kjim.2014.29.2.183 [68] Przybylski G, Nowakowska-Arendt A, Pilaczyńska-Cemel M, et al. 10-years comparative clinico-epidemiological analysis of smoking and alcohol consumption in TB patients (Myc. Tuberculosis) and with mycobacteriosis (Myc. Kansas). Przegl Lek, 2014; 71, 576−80. [69] Yu LJ, Cheng JX, Cui XL, et al. Province-specific smoking-attributable cancer mortality in China 2013. Tob Induc Dis, 2020; 18, 49. [70] Chen XY, Liu JG, Zhou J, et al. Urban particulate matter (PM) suppresses airway antibacterial defence. Respir Res, 2018; 19, 5. doi: 10.1186/s12931-017-0700-0 [71] Riedl MA. The effect of air pollution on asthma and allergy. Curr Allergy Asthma Rep, 2008; 8, 139−46. doi: 10.1007/s11882-008-0024-8 [72] Ni L, Chuang CC, Zuo L. Fine particulate matter in acute exacerbation of COPD. Front Physiol, 2015; 6, 294. [73] Ghio AJ. Particle exposures and infections. Infection, 2014; 42, 459−67. doi: 10.1007/s15010-014-0592-6 [74] Gillespie P, Tajuba J, Lippmann M, et al. Particulate matter neurotoxicity in culture is size-dependent. NeuroToxicology, 2013; 36, 112−7. doi: 10.1016/j.neuro.2011.10.006 [75] Banerjee S, Farhana A, Ehtesham NZ, et al. Iron acquisition, assimilation and regulation in mycobacteria. Infect Genet Evol, 2011; 11, 825−38. doi: 10.1016/j.meegid.2011.02.016 [76] Rivas-Santiago CE, Sarkar S, Cantarella IV P, et al. Air pollution particulate matter alters antimycobacterial respiratory epithelium innate immunity. Infect Immun, 2015; 83, 2507−17. doi: 10.1128/IAI.03018-14 [77] Álvaro-Meca A, Diaz A, de Miguel Díez J, et al. Environmental factors related to pulmonary tuberculosis in HIV-infected patients in the combined antiretroviral therapy (cART) era. PLoS One, 2016; 11, e0165944. doi: 10.1371/journal.pone.0165944 [78] Torres M, Carranza C, Sarkar S, et al. Urban airborne particle exposure impairs human lung and blood Mycobacterium tuberculosis immunity. Thorax, 2019; 74, 675−83. doi: 10.1136/thoraxjnl-2018-212529 [79] Smith GS, van den Eeden SK, Garcia C, et al. Air pollution and pulmonary tuberculosis: a nested case–control study among members of a northern California health plan. Environ Health Perspect, 2016; 124, 761−8. doi: 10.1289/ehp.1408166 [80] Yang JD, Zhang MX, Chen YG, et al. A study on the relationship between air pollution and pulmonary tuberculosis based on the general additive model in Wulumuqi, China. Int J Infect Dis, 2020; 96, 42−7. doi: 10.1016/j.ijid.2020.03.032 [81] Clapp LJ, Jenkin ME. Analysis of the relationship between ambient levels of O3, NO2 and NO as a function of NOx in the UK. Atmos Environ, 2001; 35, 6391−405. doi: 10.1016/S1352-2310(01)00378-8 [82] Ge EJ, Fan M, Qiu H, et al. Ambient sulfur dioxide levels associated with reduced risk of initial outpatient visits for tuberculosis: a population based time series analysis. Environ Pollut, 2017; 228, 408−15. doi: 10.1016/j.envpol.2017.05.051 [83] Xu M, Liao JQ, Yin P, et al. Association of air pollution with the risk of initial outpatient visits for tuberculosis in Wuhan, China. Occup Environ Med, 2019; 76, 560−6. doi: 10.1136/oemed-2018-105532 [84] Huang K, Ding K, Yang XJ, et al. Association between short-term exposure to ambient air pollutants and the risk of tuberculosis outpatient visits: a time-series study in Hefei, China. Environ Res, 2020; 184, 109343. doi: 10.1016/j.envres.2020.109343 [85] Malwal SR, Sriram D, Yogeeswari P, et al. Design, synthesis, and evaluation of thiol-activated sources of sulfur dioxide (SO2) as antimycobacterial agents. J Med Chem, 2012; 55, 553−7. doi: 10.1021/jm201023g [86] Meng ZQ, Liu YX, Wu DM. Effect of sulfur dioxide inhalation on cytokine levels in lungs and serum of mice. Inhal Toxicol, 2005; 17, 303−7. doi: 10.1080/08958370590922625 [87] Sasindran SJ, Torrelles JB. Mycobacterium tuberculosis infection and inflammation: what is beneficial for the host and for the bacterium?. Front Microbiol, 2011; 2, 2. [88] Yu K, Mitchell C, Xing Y, et al. Toxicity of nitrogen oxides and related oxidants on mycobacteria: M. tuberculosis is resistant to peroxynitrite anion. Tuber Lung Dis, 1999; 79, 191−8. doi: 10.1054/tuld.1998.0203 [89] Zhang YJ, Liu MY, Wu SS, et al. Spatial distribution of tuberculosis and its association with meteorological factors in mainland China. BMC Infect Dis, 2019; 19, 379. doi: 10.1186/s12879-019-4008-1 [90] Abhimanyu, Coussens AK. The role of UV radiation and vitamin D in the seasonality and outcomes of infectious disease. Photochem Photobiol Sci, 2017; 16, 314−38. doi: 10.1039/c6pp00355a [91] Mathema B, Andrews JR, Cohen T, et al. Drivers of tuberculosis transmission. J Infect Dis, 2017; 216, S644−53. doi: 10.1093/infdis/jix354 [92] Huang YX, Huang JY, Su XT, et al. Analysis of the economic burden of diagnosis and treatment on patients with tuberculosis in Bao'an district of Shenzhen City, China. PLoS One, 2020; 15, e0237865. doi: 10.1371/journal.pone.0237865 [93] Guo C, Du Y, Shen SQ, et al. Spatiotemporal analysis of tuberculosis incidence and its associated factors in mainland China. Epidemiol Infect, 2017; 145, 2510−9. doi: 10.1017/S0950268817001133 [94] Niu ZC, Qi YJ, Zhao PQ, et al. Short-term effects of ambient air pollution and meteorological factors on tuberculosis in semi-arid area, northwest China: a case study in Lanzhou. Environ Sci Pollut Res, 2021; 28, 69190−9. doi: 10.1007/s11356-021-15445-6 [95] Chen H, Meng X, Yu YF, et al. Greenness and its composition and configuration in association with allergic rhinitis in preschool children. Environ Res, 2024; 251, 118627. doi: 10.1016/j.envres.2024.118627 [96] Cai WJ, Zhang C, Zhang SH, et al. The 2021 China report of the Lancet Countdown on health and climate change: seizing the window of opportunity. Lancet Public Health, 2021; 6, e932−47. doi: 10.1016/S2468-2667(21)00209-7 [97] Zhu S, Wu Y, Wang Q, et al. Long-term exposure to ambient air pollution and greenness in relation to pulmonary tuberculosis in China: a nationwide modelling study. Environ Res, 2022; 214, 114100. doi: 10.1016/j.envres.2022.114100 [98] Laurent O, Benmarhnia T, Milesi C, et al. Relationships between greenness and low birth weight: investigating the interaction and mediation effects of air pollution. Environ Res, 2019; 175, 124−32. doi: 10.1016/j.envres.2019.05.002 [99] Wu WJ, Du ZC, Wang Y, et al. The complex role of air pollution on the association between greenness and respiratory mortality: insight from a large cohort, 2009-2020. Sci Total Environ, 2023; 899, 165588. doi: 10.1016/j.scitotenv.2023.165588 [100] Markevych I, Schoierer J, Hartig T, et al. Exploring pathways linking greenspace to health: theoretical and methodological guidance. Environ Res, 2017; 158, 301−17. doi: 10.1016/j.envres.2017.06.028 [101] Huang K, Hu CY, Yang XY, et al. Contributions of ambient temperature and relative humidity to the risk of tuberculosis admissions: a multicity study in Central China. Sci Total Environ, 2022; 838, 156272. doi: 10.1016/j.scitotenv.2022.156272 [102] Graudenz GS, Landgraf RG, Jancar S, et al. The role of allergic rhinitis in nasal responses to sudden temperature changes. J Allergy Clin Immunol, 2006; 118, 1126−32. doi: 10.1016/j.jaci.2006.07.005 [103] Balcells ME, García P, Tiznado C, et al. Association of vitamin D deficiency, season of the year, and latent tuberculosis infection among household contacts. PLoS One, 2017; 12, e0175400. doi: 10.1371/journal.pone.0175400 [104] Margalit I, Block C, Mor Z. Seasonality of tuberculosis in Israel, 2001-2011. Int J Tuberc Lung Dis, 2016; 20, 1588−93. doi: 10.5588/ijtld.16.0306 [105] Watkinson WP, Campen MJ, Lyon JY, et al. Impact of the hypothermic response in inhalation toxicology studies. Ann N Y Acad Sci, 1997; 813, 849−63. doi: 10.1111/j.1749-6632.1997.tb51790.x -

 点击查看大图
计量
- 文章访问数: 1324
- HTML全文浏览量: 561
- PDF下载量: 86
- 被引次数: 0

 Quick Links