

 下载:
下载:


-
Tuberculosis (TB) remained the first leading cause of death from a single infectious agent worldwide in 2023, resulting in nearly twice as many deaths as those caused by the human immunodeficiency virus/acquired immune deficiency syndrome. An estimated 10.8 million TB cases were reported globally in 2023, with approximately 1.25 million associated deaths. In China, which ranks third in the global TB burden, there were approximately 741,000 new cases and 25,000 deaths in 2023[1]. TB poses a significant threat to human health worldwide.
Recently, significant progress has been made in the prevention and control of TB in China. The incidence of TB continues to decrease, with the reported rates decreasing from 67.05 per 100,000 in 2014 to 46.40 per 100,000 in 2021[2]. However, there is still a considerable gap between China's current TB burden and the global targets set by the World Health Organization. Geographical disparities in TB prevalence were significant. The burden in the western region, especially Northwest China, is far higher than that in the eastern, central, and northeastern regions[3]. Additionally, the frequent occurrence of adverse weather conditions, Coronavirus Disease 2019 (COVID-19) pandemic, and inadequacies in prevention and control zones[2] have presented notable challenges to TB management in recent years. Nevertheless, changes in these factors have posed new challenges for the prevention and control of TB in Northwest China.
Therefore, it is crucial to assess the localized burden of TB in specific regions of Northwest China to enhance control strategies. Shaanxi Province has always had a high TB burden in China[2]. Based on the number of reported TB cases in Shaanxi Province from 2011 to 2022, this study analyzed the incidence trends of TB, conducted a fine-grained spatiotemporal scanning analysis at the township and subdistrict scales, and evaluated the impact of meteorological and air pollution factors on the incidence of TB. This study aimed to provide a targeted reference for health departments for the prevention and control of TB.
The scope of this study was Shaanxi Province, located in western China, with 10 prefecture-level cities and 1313 townships and sub-districts. TB case data from 2011 to 2022 were obtained from a direct reporting platform for TB in the Shaanxi Province. Population data were obtained from the Shaanxi Statistical Yearbook. The meteorological factors considered in this study included average temperature (AVET), rainfall, relative humidity (RH), average wind velocity (AWV), cumulative sunshine hours (CSH), and air pollutants such as nitrogen dioxide (NO2), ozone (O3), particulate matter 10 (PM10), particulate matter 2.5 (PM2.5), carbon monoxide (CO), and sulfur dioxide (SO2). The data were obtained from the National Meteorological Science Center and the China Environmental Monitoring Center.
The average annual percentage change (AAPC) was calculated using Joinpoint software (version 4.9.1.0; Statistical Methodology and Applications Branch, Surveillance Research Program, National Cancer Institute, Bethesda, MD, USA) to analyze the temporal trend of TB incidence from 2011 to 2022. A positive AAPC estimation along with the lower boundary of its 95% confidence interval (CI) greater than zero indicated an upward trend; conversely, if the AAPC estimation and the upper boundary of its 95% CI were both below zero, a downward trend was observed. If neither of these conditions were met, the trend was considered stable[4].
To explore the spatiotemporal clusters of TB, Kulldorff’s space-time scan statistical analysis was performed using the SaTscan software (version 10.1.2; Harvard Medical School, USA). In this study, using monthly incidence, township, and sub-district levels, a retrospective spatial-temporal analysis was conducted, and the Poisson distribution was selected as the probability model[5]. The time scanning window was set to 20% of the total study period, with a unit of time of one month, and the spatial scanning window was set to 20%. Given that the reported TB cases may have been influenced by the COVID-19 pandemic, a three-year time window was employed for spatiotemporal scanning in Shaanxi Province.
Considering the impact of the COVID-19 pandemic on TB, Spearman’s correlation analyses were conducted both before and after excluding the years 2020 2022. To account for potential nonlinear and lagged effects between meteorological factors, air pollutants, and TB cases, a distributed lag nonlinear model (DLNM) was utilized and executed with R software (version 4.2.1; R Foundation for Statistical Computing, Vienna, Austria) to estimate the influence of daily meteorological factors and air pollutants on TB incidence risk. The formula used is as follows[6]:
$$ g({u_t}) = \alpha + \sum\limits_{j = 1}^J {{f_j}} ({X_{ij}};{\beta _j}) + \sum\limits_{k = 1}^K {{\gamma _k}} {u_{tk}} $$ where g(.) is the link function; μt represents the daily cumulative number of people with TB incidence; xj represents meteorological factors and air pollutants; fj represents various basis functions of the independent variable xi; uk represents other linear effects of confounding factors; and yk represents corresponding coefficients. We used the "natural cubic spline" method to construct a two-dimensional cross-basis function to fit the exposure-lag response relationship between meteorological variables, air pollutant variables, and TB cases. The lag days and degrees of freedom were selected based on the minimum Akaike Information Criterion and Bayesian Information Criterion.
The extreme Gradient Boosting model (XGBoost) combined with SHapley Additive exPlanations (SHAP) was employed using Spyder (version 5.3.3; Anaconda, Inc., USA) to evaluate the contribution of various variables to TB incidence. XGBoost is a powerful ensemble learning algorithm. It is based on gradient-boosted trees, and minimizes the loss function by continuously adding new decision trees. During the training process, the loss function was expanded using a second-order Taylor expansion to accurately fit the data. Regularization techniques are used to prevent overfitting, including penalties on the leaf node weights and tree complexity. SHAP is based on the Shapley value in cooperative game theory to explain the prediction results of machine-learning models. The calculation process is as follows: First, a baseline value is obtained, which is usually the average predicted value of all sample features. Then, for each sample, we consider all possible feature combinations, calculate the change in the predicted value when a certain feature is added or removed, and determine the Shapley value of this feature by averaging the changes[7].
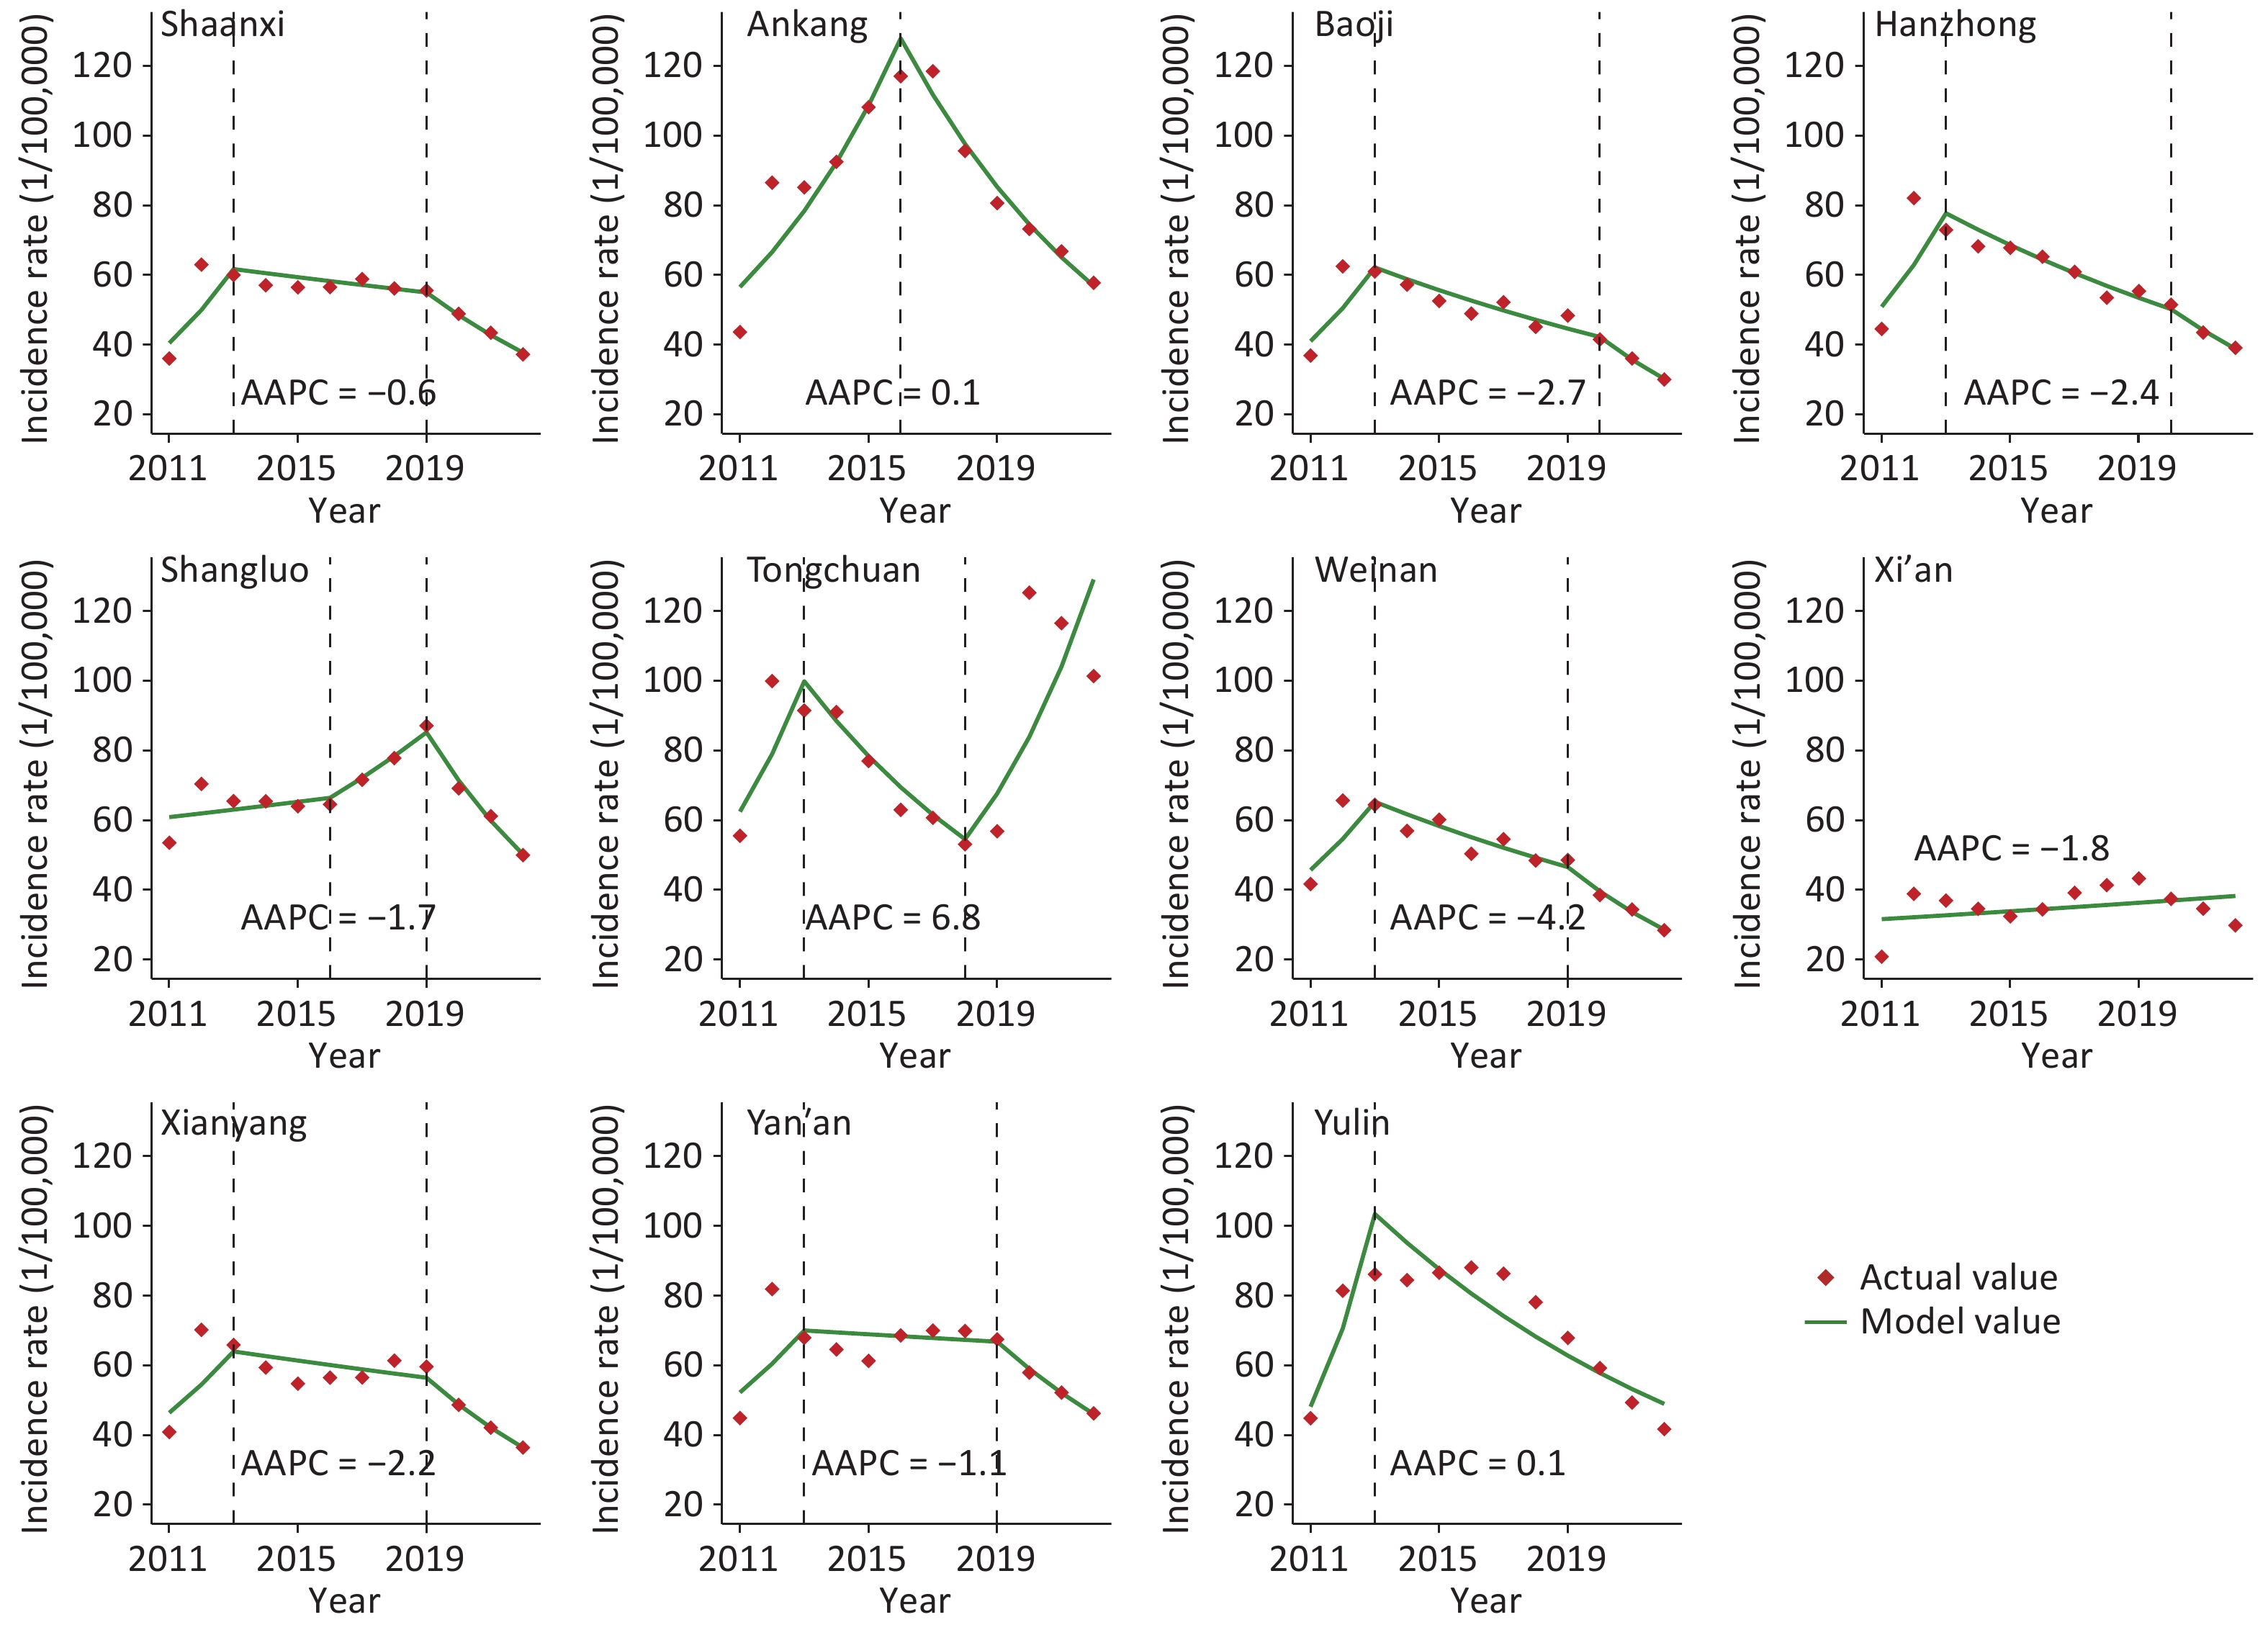
In 2022, the number of reported cases in Shaanxi Province was 14,734 (rate: 37.274 per 100,000). From 2011 to 2022, the TB incidence rate exhibited an overall downward trend (AAPC = –0.6%). Turning points occurred in 2013 and 2019. Recently, the incidence of TB has declined in most cities (Figure 1). In the past three decades, Chinese health authorities have implemented numerous policies aimed at alleviating the burden of TB, including the "National Tuberculosis Control Program 2011—2015" and the "13th Five-Year Plan for TB Control (2016—2020)." Consequently, TB incidence of TB in China has steadily declined, marked by significant advancements in prevention and treatment efforts[2]. The decrease in TB incidence of TB in Shaanxi Province was likely linked to the enforcement of various policies. Furthermore, the notable decrease observed in most cities after 2019 may be attributed to non-pharmaceutical interventions implemented during the COVID-19 pandemic[2]. However, an upward trend was observed in Tongchuan City (AAPC = 6.8%) and Xi'an City (AAPC = 1.8%) (Figure 1), necessitating increased attention from health authorities.
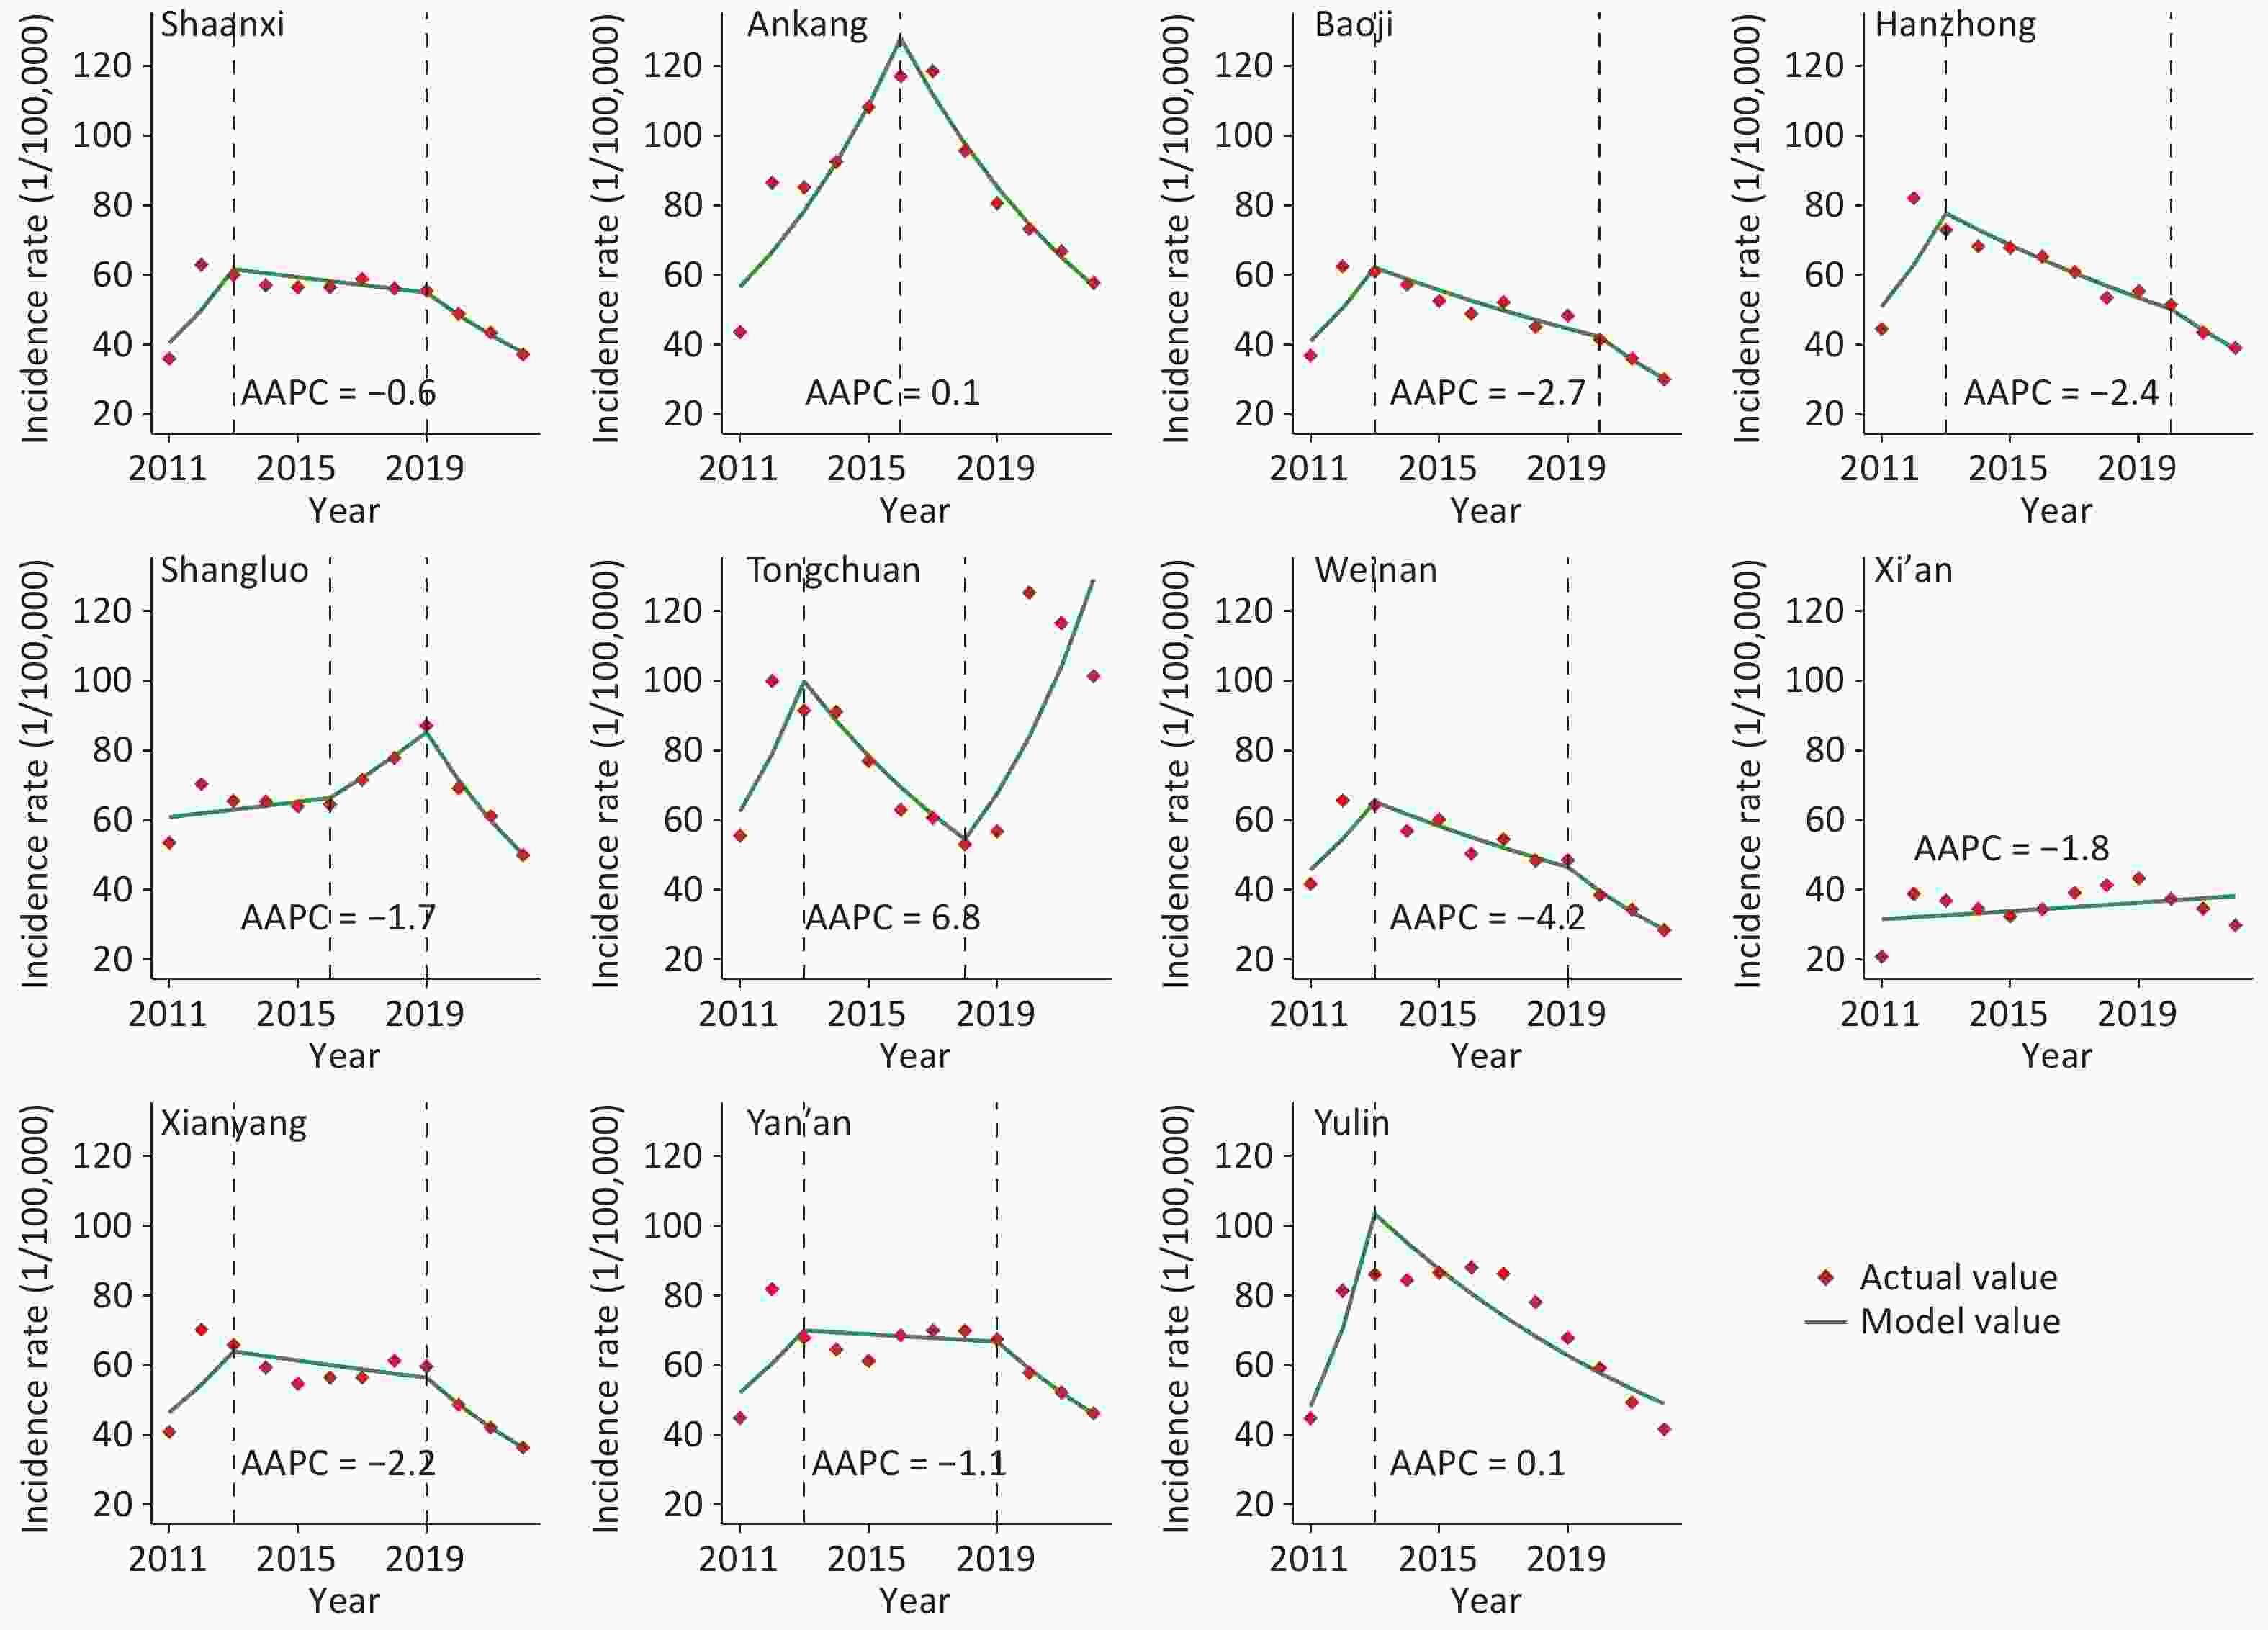
Figure 1. The incidence rates for tuberculosis in Shaanxi province, 2011–2022. AAPC: average annual percentage change.
TB cases in Shaanxi Province are primarily concentrated in northern Shaanxi (Yulin and Yan'an) (RR = 1.99, LLR = 463.23), as well as in southern Shaanxi (Ankang, Hanzhong, and Shangluo) (RR = 1.60, LLR = 237.01). These regions consist mainly of plateaus and hilly terrains inhabited by a substantial proportion of farmers and herders, who often have lower educational levels and weaker health awareness[8]. This situation can lead to the neglect of TB prevention and treatment. From 2014 to 2022, the most likely areas for TB clustering will emerge in southeastern Shaanxi, including Ankang, eastern Hanzhong, and southern Shangluo. Notably, from 2014 onwards, secondary clustering areas spread from southern Yulin to central Shaanxi, encompassing Tongchuan, northern Xianyang, and northern Baoji (Figure 2). A plausible reason for this is that the relatively developed economy and abundant medical resources in central Shaanxi prompted patients from northern and southern Shaanxi to seek cross-regional medical care, thus increasing the likelihood of the TB epidemic spreading to the central region[2]. Therefore, it is critical to focus on the equitable allocation of health resources in the future, broaden health assistance to plateau and mountainous regions, and enhance screening efforts for farmers and herders diagnosed with TB.
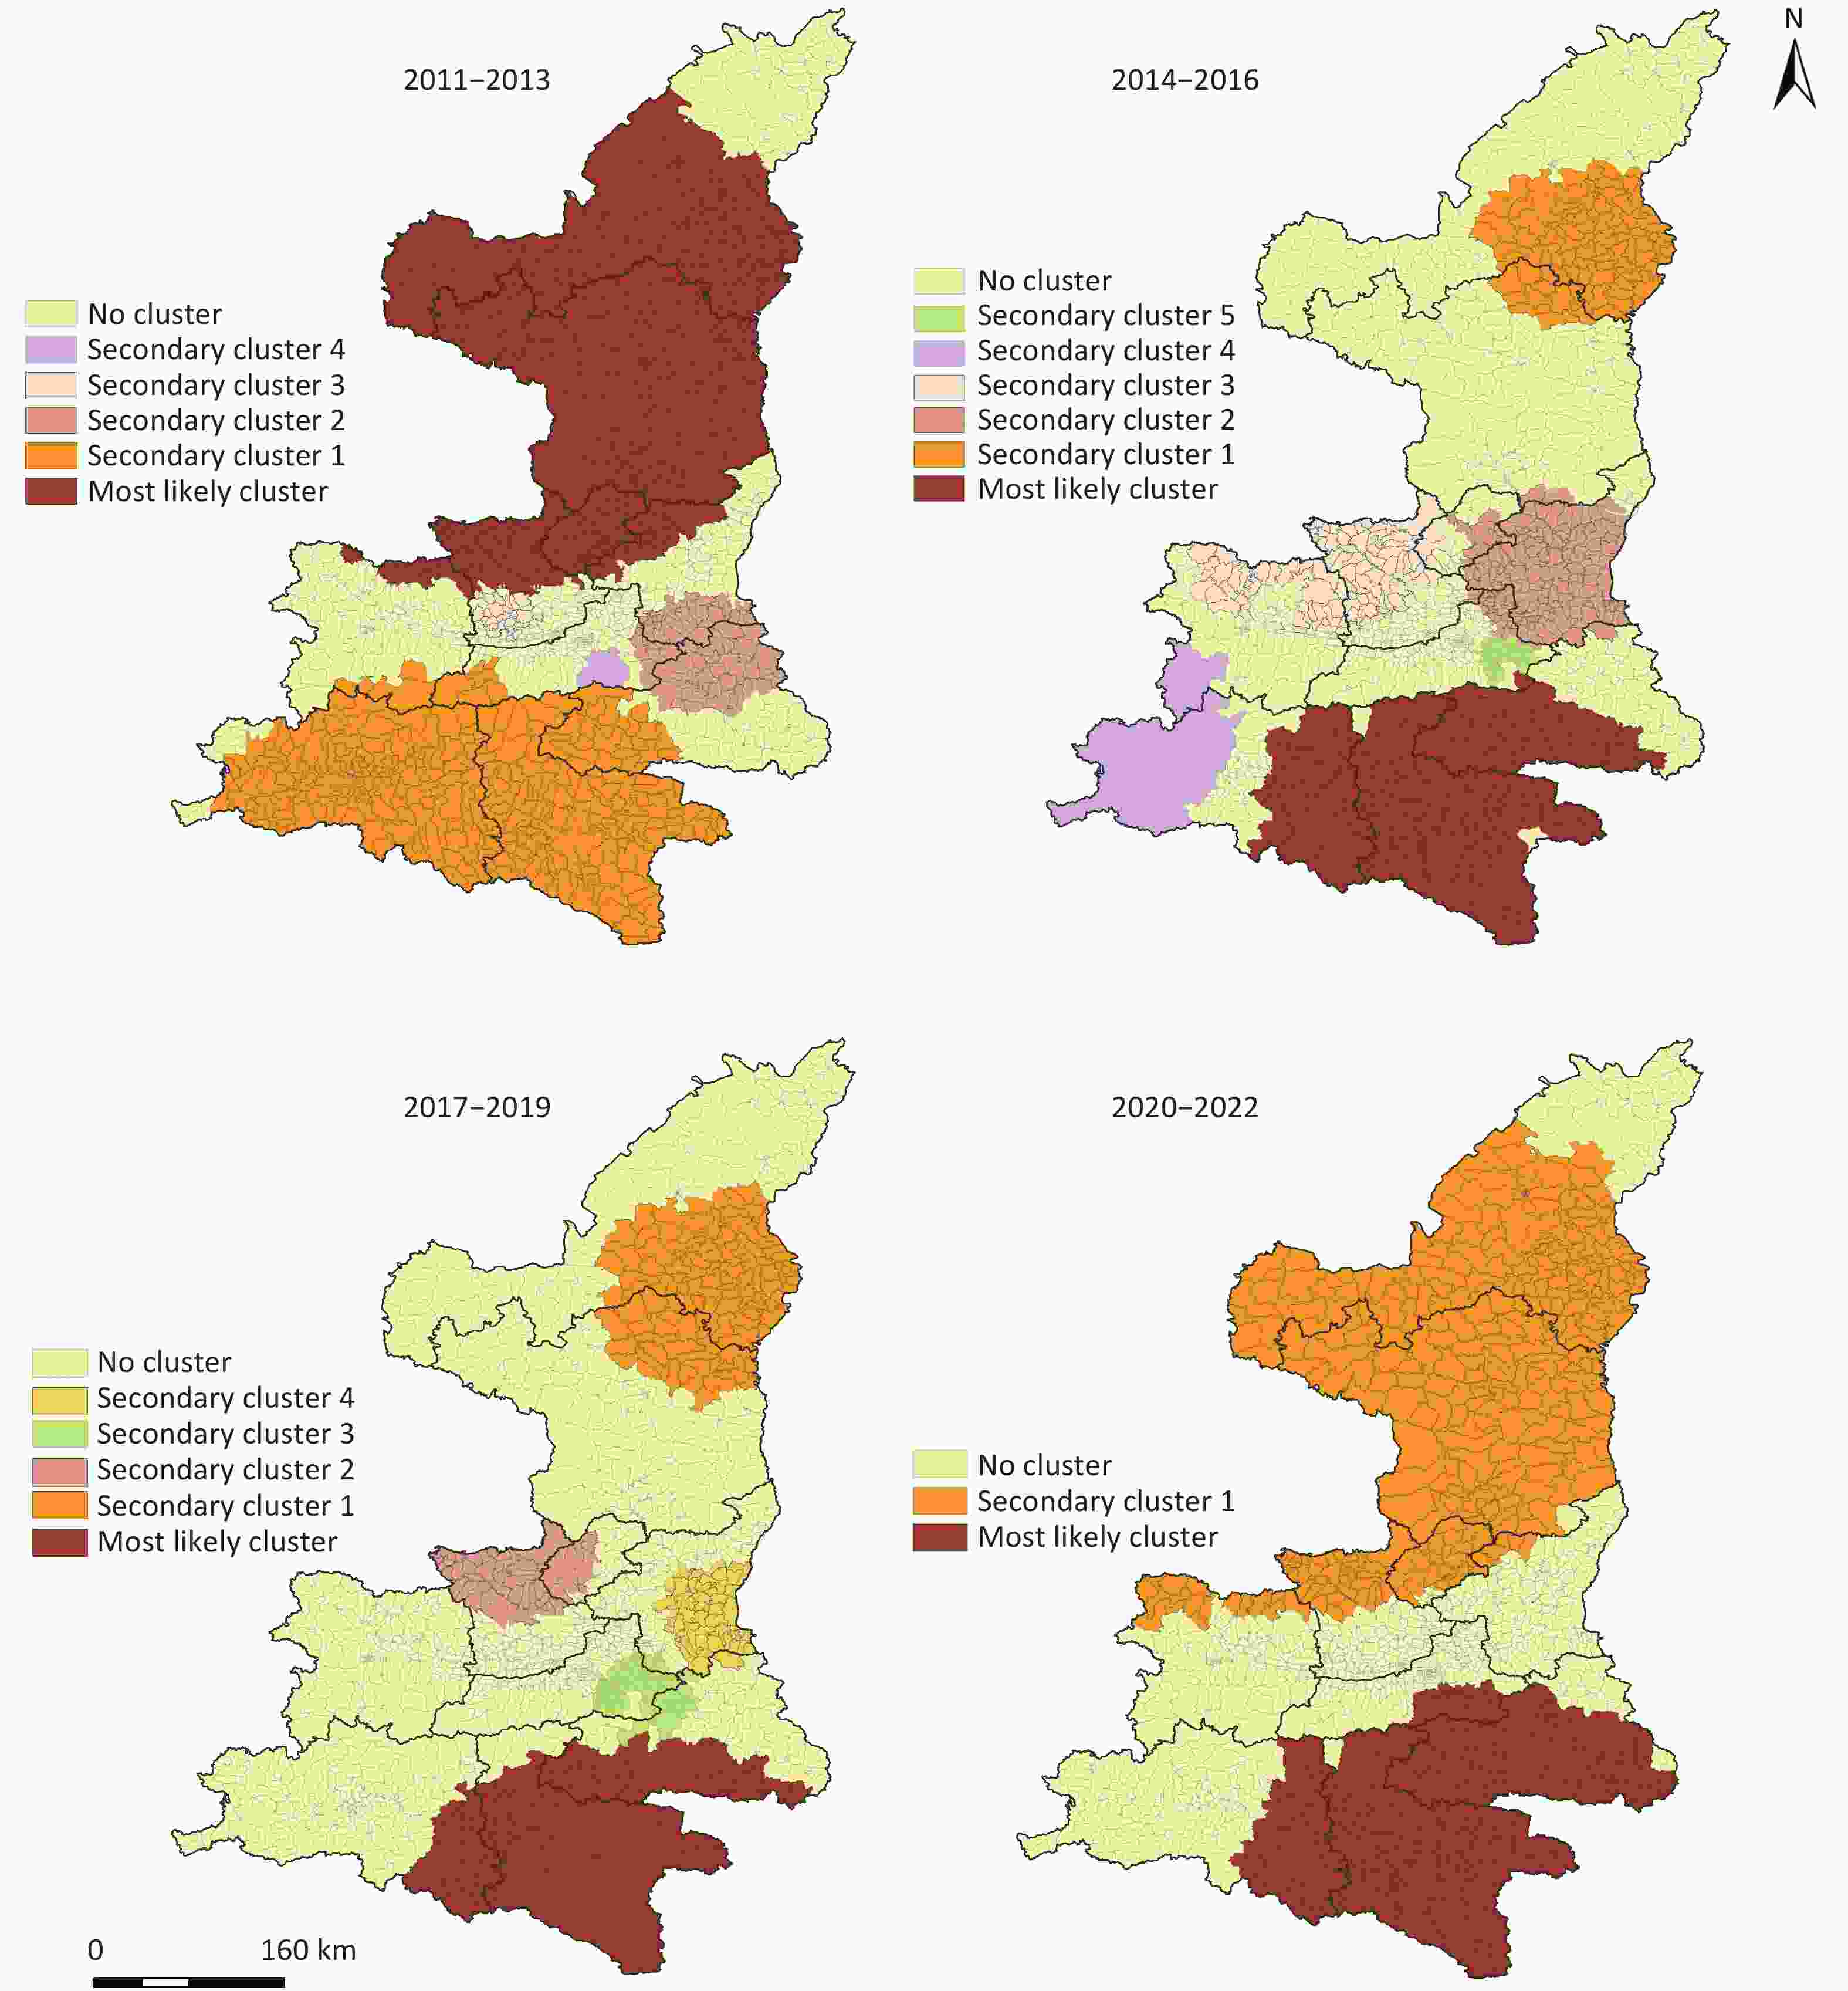
Figure 2. Spatio-temporal scanning results of tuberculosis incidence in Shaanxi Province, 2011–2022.
The Spearman analysis results showed that the correlation analysis results were consistent before and after excluding the data from 2020 to 2022 (Supplementary Table S1). After excluding the indicators with strong collinearity between variables, AVET, AWV, RH, CSH, PM10, NO2, CO, and O3 were included in the model for further analysis (Supplementary Table S2). The optimal lag days and df were selected (Supplementary Table S3).
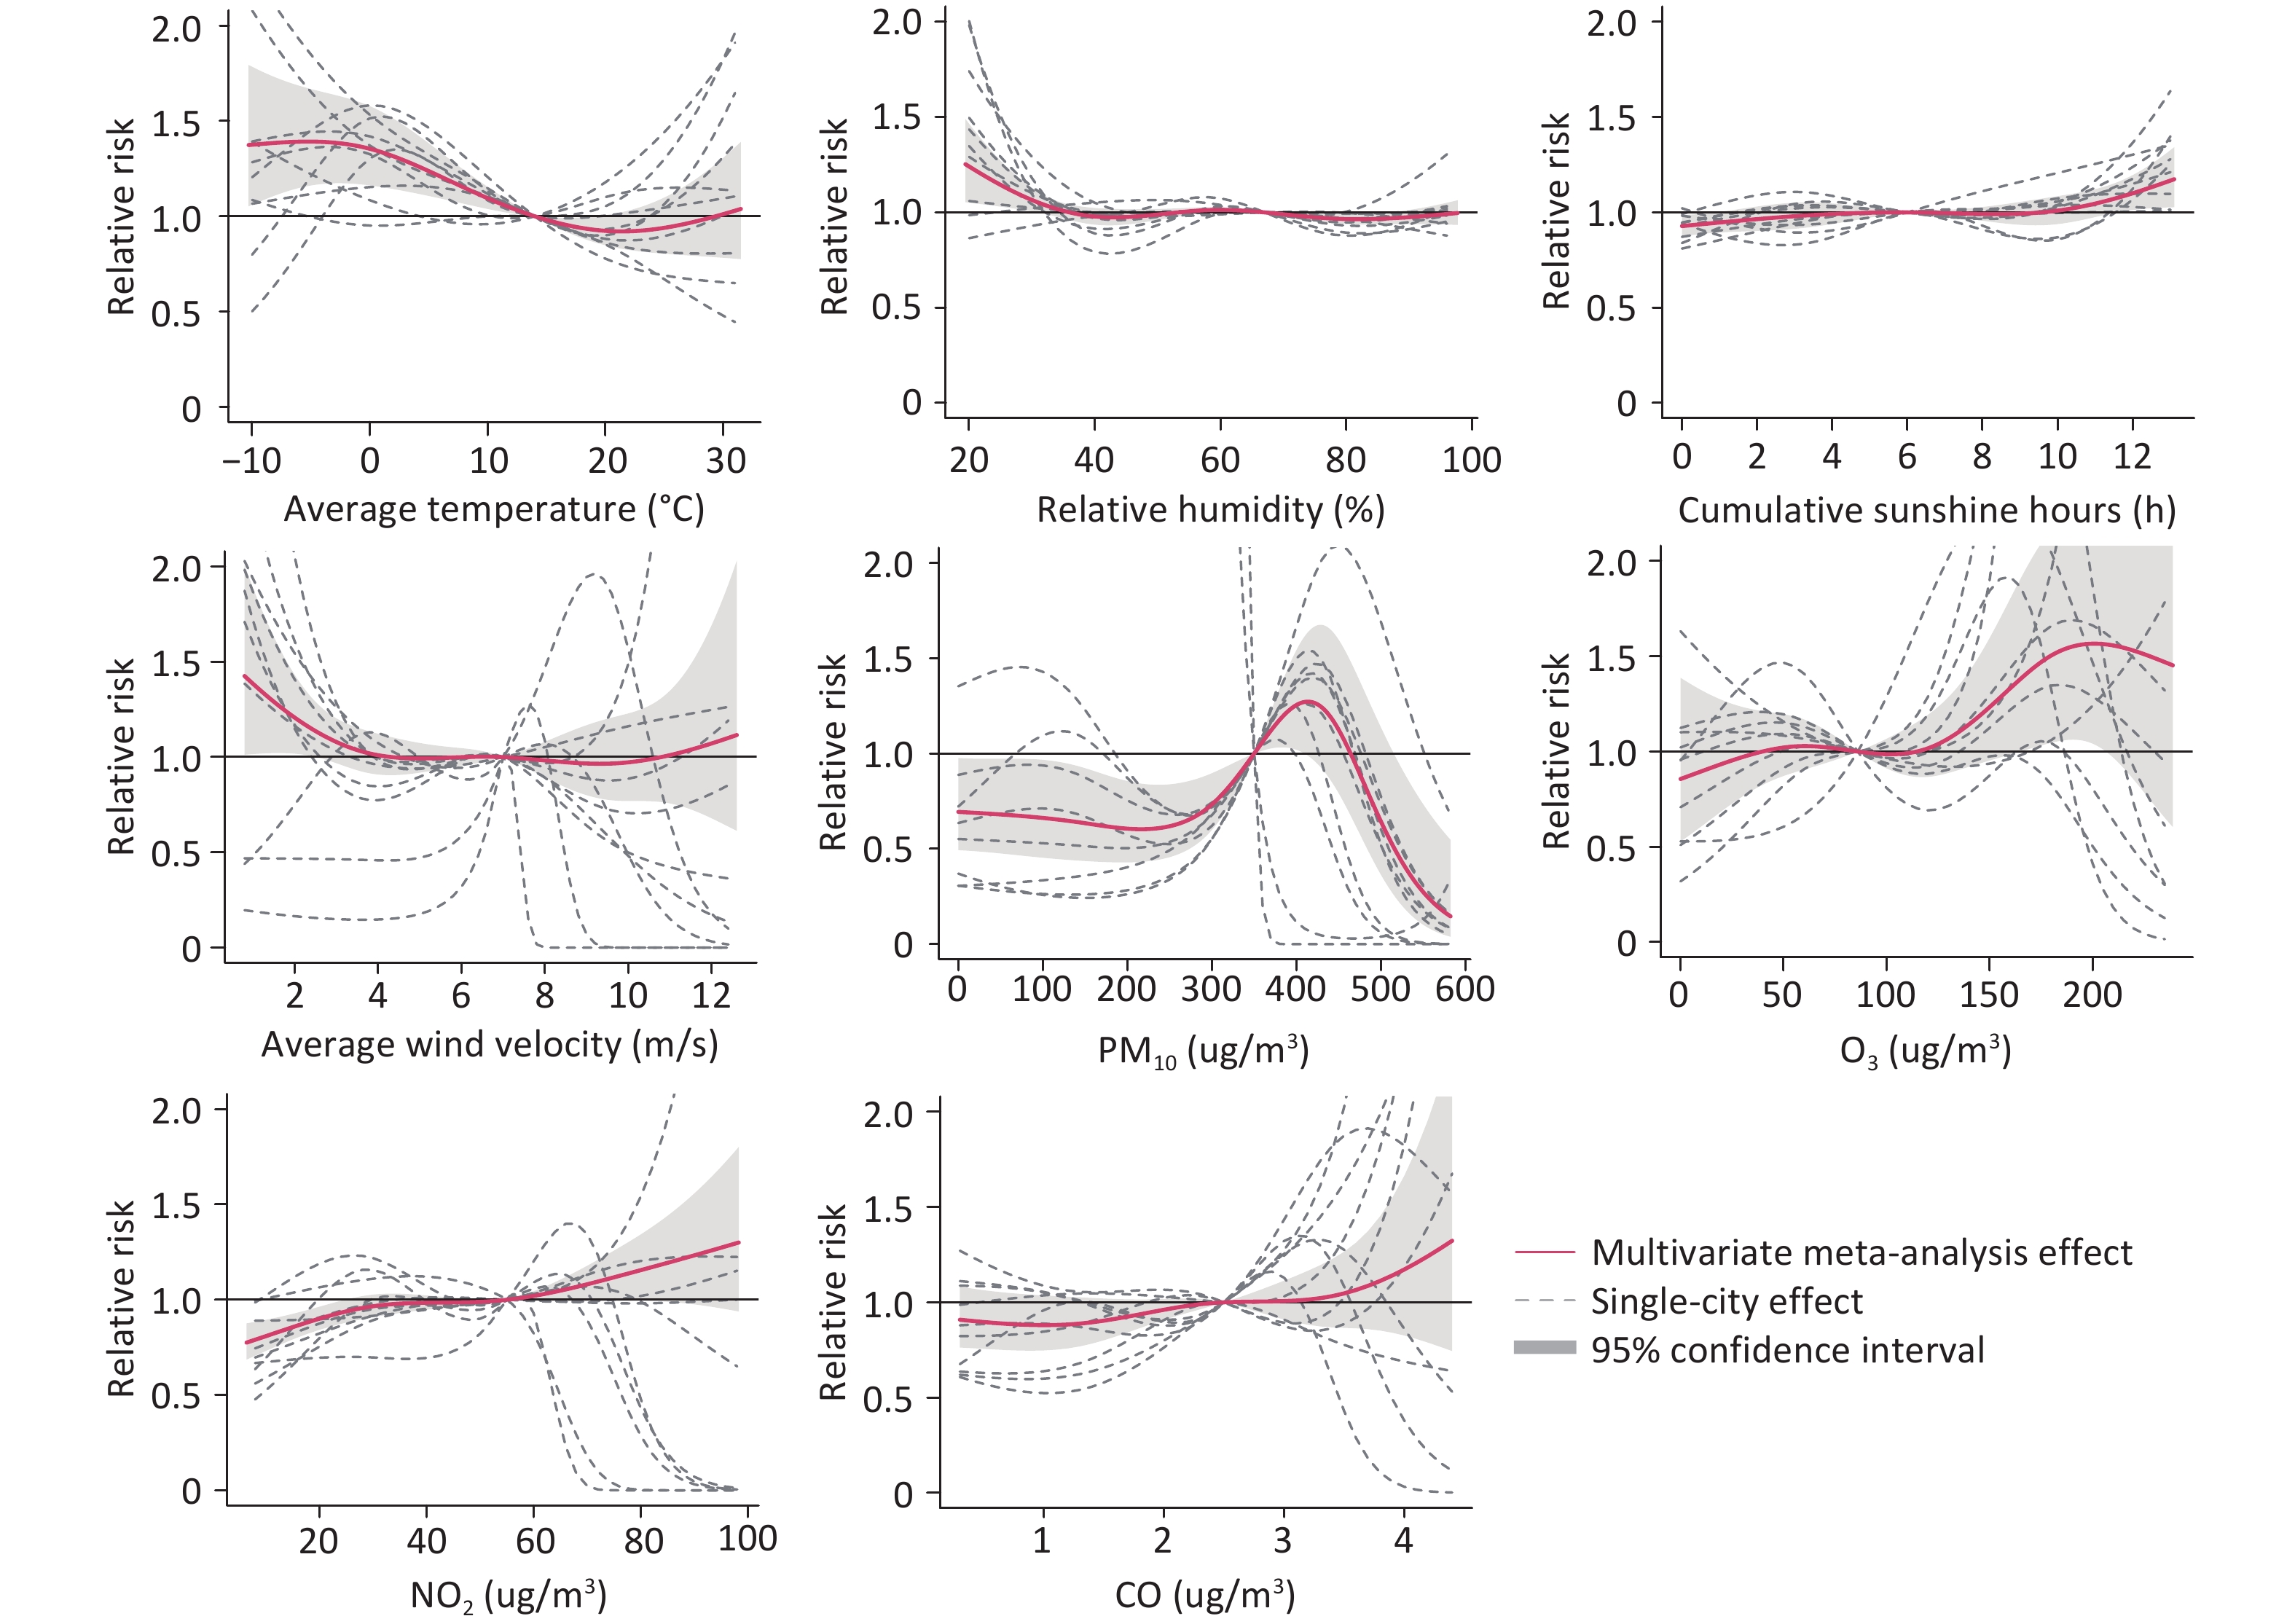
The incidence of TB in Shaanxi Province exhibited a downward trend as the temperature increased. The risk of TB onset is highest at an AVET of –5.4 °C (RR = 1.39; 95% CI: 1.16–1.67). Eighty percent of the area is located in high-altitude regions, where low temperatures prevail most of the year. These climatic conditions encourage indoor activities that facilitate the transmission of Mtb[2]. Low RH increased the risk of TB incidence, with the highest risk observed at an RH of 19.4% (RR = 1.25; 95% CI: 1.05–1.49). Long-term exposure to dry air may reduce the production of protective mucus in the respiratory tract, thereby decreasing the resistance to the growth of Mtb[2]. The highest TB onset risk occurs with 13.1 hours of sunshine duration (RR = 1.19; 95% CI: 1.06–1.34). The ultraviolet (UV) radiation is intense in plateau areas and prolonged exposure to such strong UV environments can impair human immune function, potentially leading to Mtb activation[9]. In addition, higher wind speeds were associated with a lower risk of TB incidence. Increased AWV facilitates the dispersion of air pollutants, and lower concentrations of atmospheric pollutants are associated with reduced adverse effects in high-risk TB populations[10]. Additionally, this study found that As the concentrations of NO2, CO, and O3 increased, the risk of TB also increased (Figure 3). Other studies have shown an association between exposure to ambient air pollution and increased in TB mortality[10]. Among all the factors, this study recommends that northern Shaanxi should focus on the impacts of dry environments, CO, and O3; central Shaanxi should prioritize temperature and NO2 effects; and southern Shaanxi should be vigilant about NO2 and CO levels (Supplementary Figure S1). Health authorities should collaborate with the meteorological departments to provide timely alerts regarding adverse weather conditions.
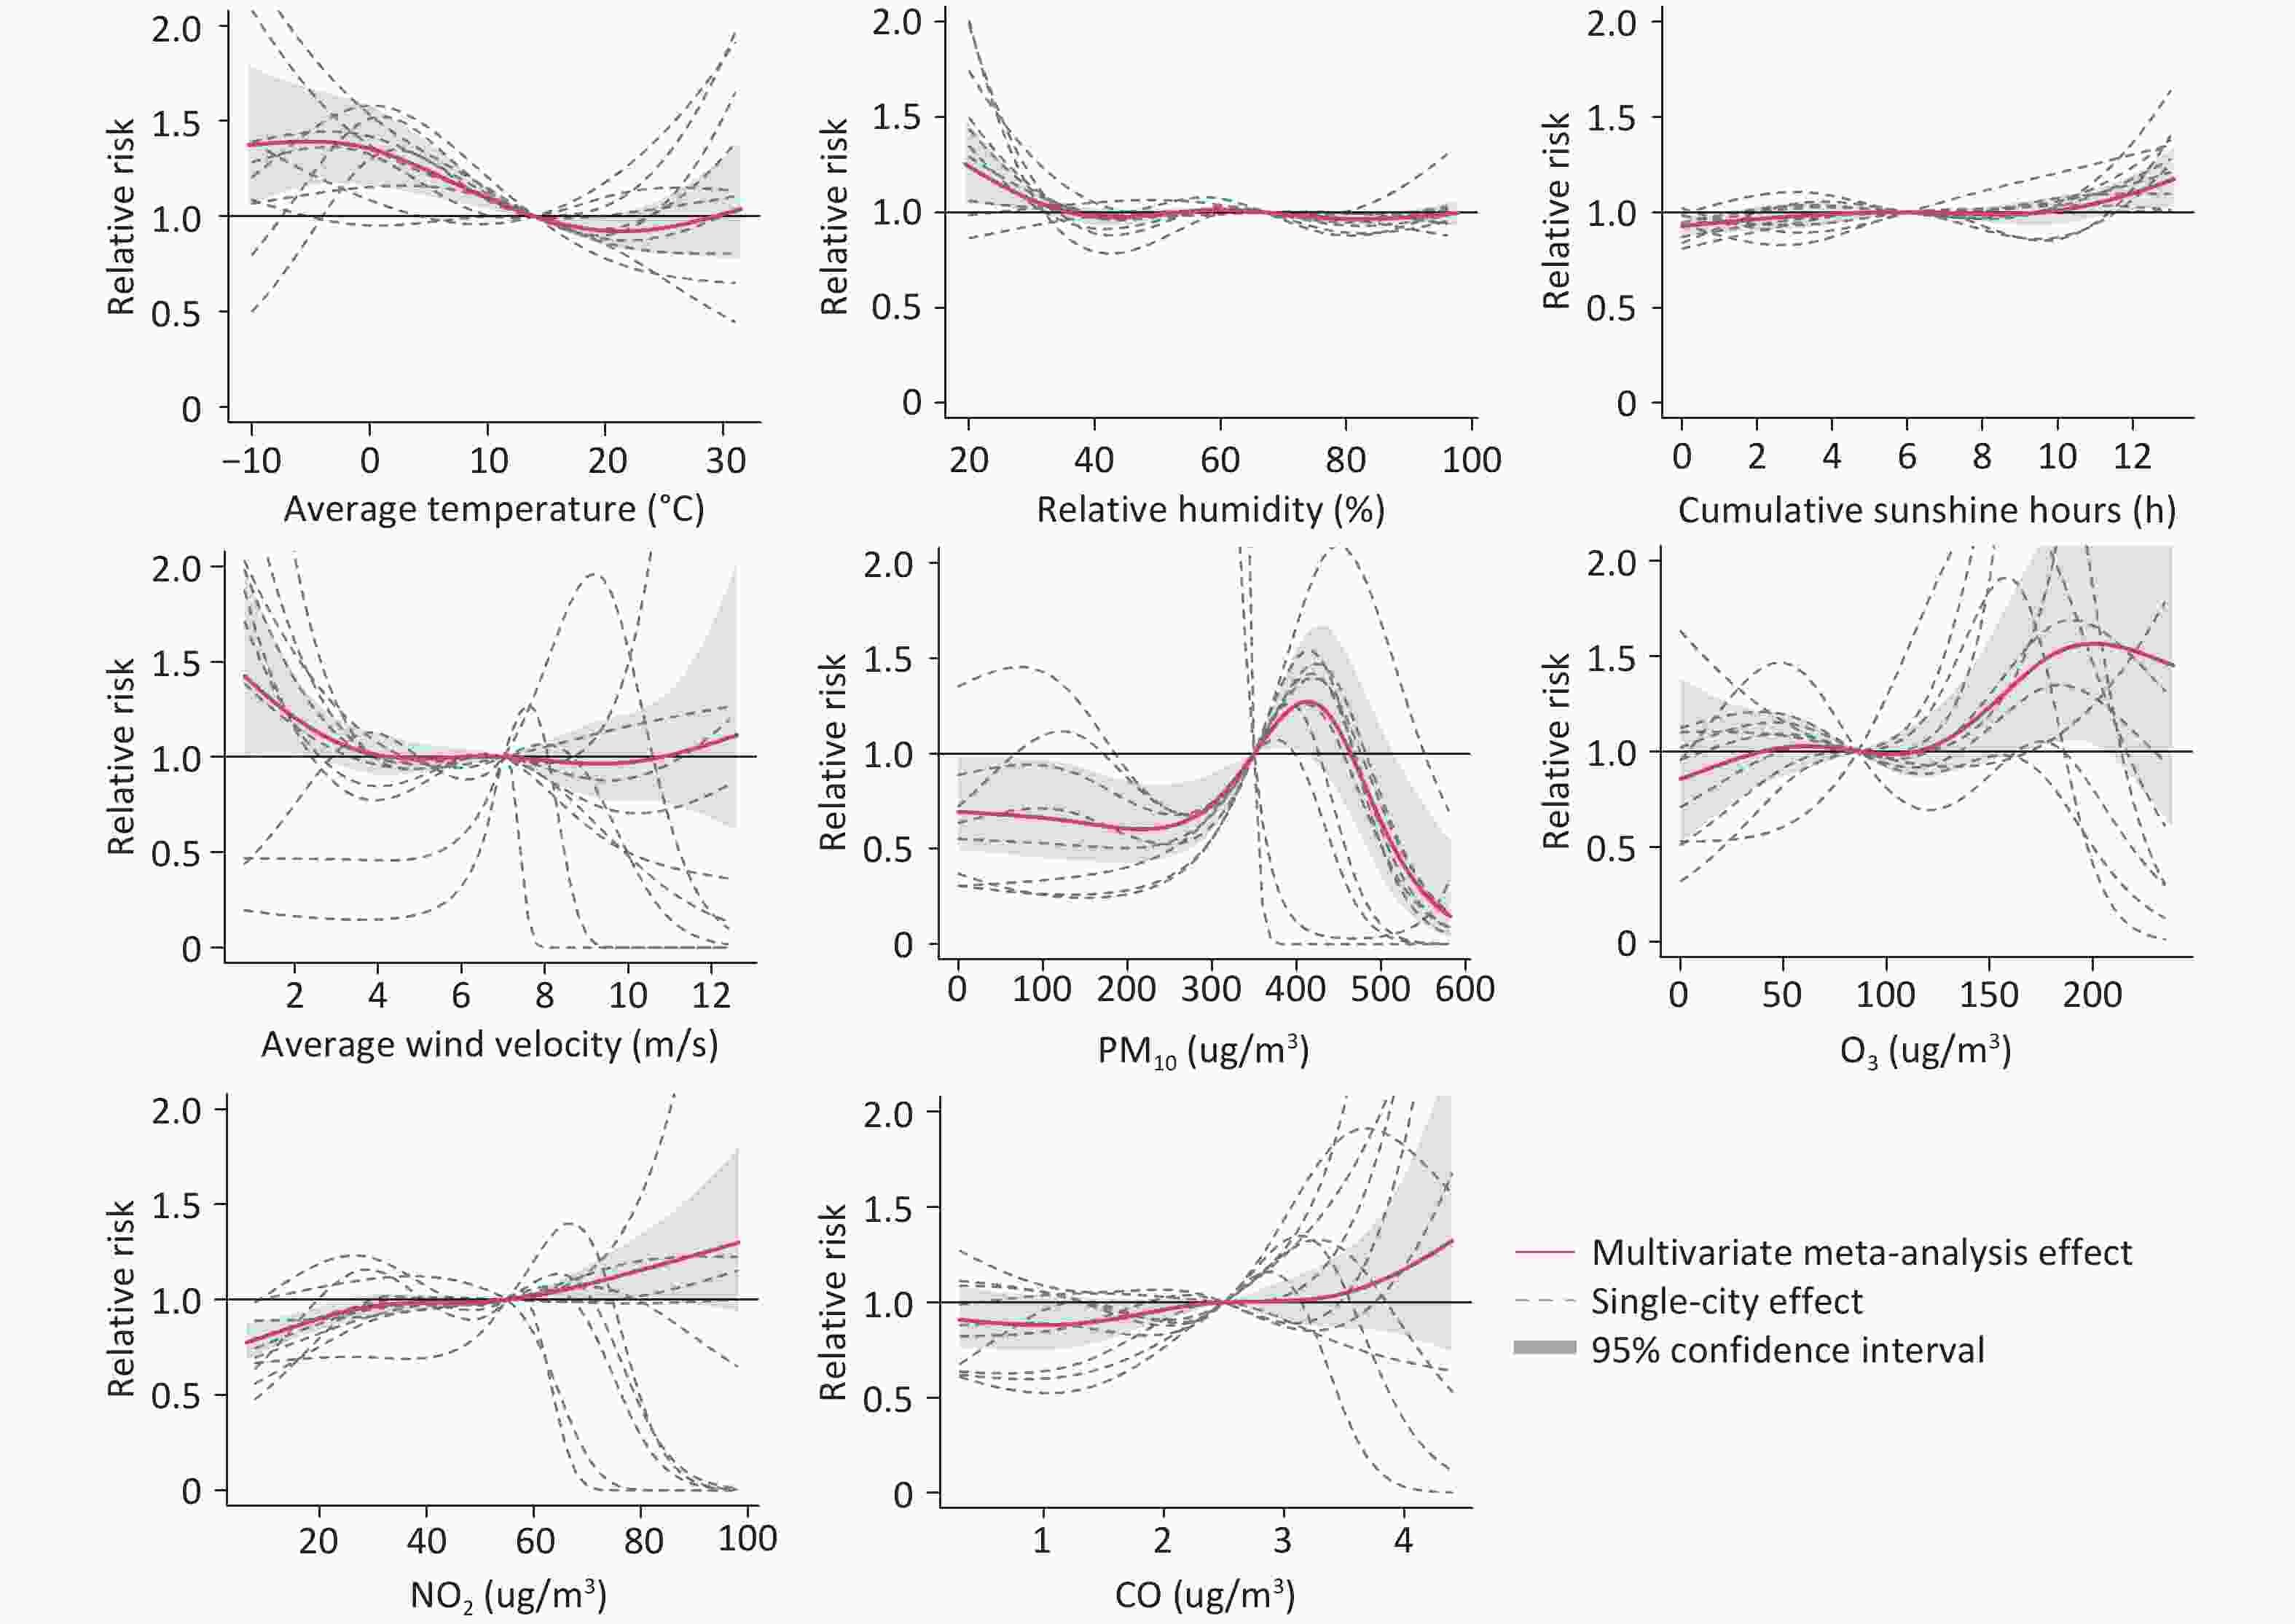
Figure 3. Exposure-response association between meteorological factors, air pollutants and tuberculosis incidence in Shaanxi Province. PM10 = particulate matter 10; O3 = ozone; NO2 = nitrogen dioxide; CO = carbon monoxide.
This study had some limitations. First, the case data collected during the study period were obtained passively, which may have led to underreporting of the actual number of cases. Second, the lack of comprehensive atmospheric pollutant data for China prior to 2014 restricted our ability to explore the correlation between atmospheric pollution levels and TB incidence from 2011 to 2014. Moreover, owing to the limitations of data accessibility, the collection of TB-related factors such as socioeconomic factors, social measures, and control strategies was not sufficiently comprehensive. Third, the ecological study design employed for analyzing the influencing factors means that conclusions are drawn solely based on observed associations without establishing causal relationships.
In Ankang, Shangluo, Hanzhong, and Yulin in Shaanxi Province should be continuously monitored. Meanwhile, the incidence rates of TB in Xi'an and Tongchuan have been increasing. In addition, potential risks of the spread of TB cases to Yan'an and Baoji should be vigilantly watched out for. Factors such as AVET, RH, NO2, and CO had a significant impact on the incidence of TB in Shaanxi Province. Health authorities should focus on areas with a high TB incidence and issue timely warning messages regarding extreme weather conditions.
doi: 10.3967/bes2025.083
Spatial-Temporal Dynamics of Tuberculosis and Its Association with Meteorological Factors and Air Pollution in Shaanxi Province, China
-
Conceptualization, formal analysis, and writing of the original draft: Hengliang Lv and Xihao Liu. Software and writing: Hui Chen and Xueli Zhang. Methodology: Feng Liu. Validation and visualization: Zitong Zheng. Investigation, funding acquisition, resources, and supervision: Hongwei Zhang, Yuanyong Xu, Wenyi Zhang.
&These authors contributed equally to this work.
注释:1) Author Contributions: -
Figure 1. The incidence rates for tuberculosis in Shaanxi province, 2011–2022. AAPC: average annual percentage change.
Figure 2. Spatio-temporal scanning results of tuberculosis incidence in Shaanxi Province, 2011–2022.
Map approval number: GS (2024)0650.
-
[1] World Health Organization. Global tuberculosis report 2024. https://www.who.int/teams/global-tuberculosis-programme/tb-reports/global-tuberculosis-report-2024. [2024-11-12]. [2] Deng LL, Zhao F, Li ZW, et al. Epidemiological characteristics of tuberculosis incidence and its macro-influence factors in Chinese mainland during 2014-2021. Infect Dis Poverty, 2024; 13, 34. doi: 10.1186/s40249-024-01203-6 [3] Liu MY, Li QH, Zhang YJ, et al. Spatial and temporal clustering analysis of tuberculosis in the mainland of China at the prefecture level, 2005-2015. Infect Dis Poverty, 2018; 7, 106. doi: 10.1186/s40249-018-0490-8 [4] Dong Z, Yao HY, Yu SC, et al. Changes in notified incidence of pulmonary tuberculosis in China, 2005-2020. Biomed Environ Sci, 2023; 36, 117−26. [5] Mao Q, Zeng CH, Zheng DC, et al. Analysis on spatial-temporal distribution characteristics of smear positive pulmonary tuberculosis in China, 2004-2015. Int J Infect Dis, 2019; 80, S36−44. doi: 10.1016/j.ijid.2019.02.038 [6] Gasparrini A. Distributed lag linear and non-linear models in R: the package dlnm. J Stat Softw, 2011; 43, 1−20. [7] Greener JG, Kandathil SM, Moffat L, et al. A guide to machine learning for biologists. Nat Rev Mol Cell Biol, 2022; 23, 40−55. doi: 10.1038/s41580-021-00407-0 [8] Wei XL, Hicks JP, Zhang ZT, et al. Effectiveness of a comprehensive package based on electronic medication monitors at improving treatment outcomes among tuberculosis patients in Tibet: a multicentre randomised controlled trial. Lancet, 2024; 403, 913−23. doi: 10.1016/S0140-6736(23)02270-5 [9] Martineau AR, Timms PM, Bothamley GH, et al. High-dose vitamin D3 during intensive-phase antimicrobial treatment of pulmonary tuberculosis: a double-blind randomised controlled trial. Lancet, 2011; 377, 242−50. doi: 10.1016/S0140-6736(10)61889-2 [10] Xiang K, Xu ZW, Hu YQ, et al. Association between ambient air pollution and tuberculosis risk: a systematic review and meta-analysis. Chemosphere, 2021; 277, 130342. doi: 10.1016/j.chemosphere.2021.130342 -

 点击查看大图
图(3)
计量
- 文章访问数: 20
- HTML全文浏览量: 7
- PDF下载量: 1
- 被引次数: 0

 Quick Links