

 下载:
下载:


-
Rare earth elements (REEs) are a group of metallic elements with similar structures and the same electron layer[1], including yttrium (Y), scandium (Sc), and 15 lanthanide elements, namely lanthanum (La), cerium (Ce), praseodymium (Pr), neodymium (Nd), promethium (Pm), samarium (Sm), europium (Eu), gadolinium (Gd), terbium (Tb), dysprosium (Dy), holmium (Ho), erbium (Er), thulium (Tm), ytterbium (Yb), and lutetium (Lu)[2,3]. The International Union of Pure and Applied Chemistry (IUPAC) classifies REEs into Light Rare Earth Elements (LREEs) and Heavy Rare Earth Elements (HREEs), including La, Ce, Pr, Nd, Pm, Sm, Eu, and Sc, Tb, Dy, Ho, Er, Tm, Yb, Lu, and Y[4,5].
REEs are widely used in many fields, including agriculture, medicine, electronics, military, energy industries, and other high-tech sectors[3]. This widespread use has increased the environmental exposure risks, which may have potential implications for human health[6]. Numerous studies have documented the widespread occurrence of REEs across various environmental media, including soil, dust, sediments, air, water[7-11], and food[12,13]. Human exposure to REEs can occur through water and food ingestion, inhalation, or dermal contact[2]. Concurrently, the accumulation of REEs has been detected in various biological specimens, including human hair[14], urine[14], nails[15], blood[16,17], semen[11], breast milk[18], placental tissue[19], and brain tissue[17].
Animal studies have revealed the toxic effects of rare earth elements (REEs) on gametes. The injection of a mixture of REE chlorides (La, Ce, Pr, and Nd) before ovulation in female Kunming mice resulted in a decrease in the number of mature oocytes and inhibited their activation[20]. Exposure of male Kunming mice to high doses of CeCl3 led to testicular cell dysfunction and increased[21] whereas the injection of CeO2 nanoparticles into male BALB/c mice significantly reduced sperm count and motility[22]. This indicates the reproductive toxicity of REEs to some extent.
Cohort studies have also reported an association between REEs and gamete development. A prospective cohort study on assisted reproductive technology demonstrated that elevated levels of La in female serum were associated with an increased risk of clinical pregnancy failure and negatively associated with the number of good-quality oocytes[23]. Human sperm exposed to CeCl3 in vitro showed increased oxidative damage[21], suggesting that REEs may be a risk factor for infertility. Furthermore, case-control cohort studies have indicated that elevated levels of La and Sm in female plasma may be associated with the risk of spontaneous preterm birth, whereas higher levels of Pr may be associated with the risk of premature rupture of membranes[24], indicating the potentially deleterious effects of REEs on human embryonic and fetal development.
Previous cohort studies on REEs predominantly concentrated on blood, urine, and hair samples from women[22,25−30]. However, the effect of REE exposure on male reproductive health remains unknown. Additionally, REEs exposure in the environment is heterogeneous; however, there have been no mixed analyses of the effects of REEs on pregnancy outcomes in assisted reproductive populations. In this study, we simultaneously detected REEs in serum and follicular fluid from females and semen from males in couples undergoing in vitro fertilization-embryo transfer (IVF-ET) or intracytoplasmic sperm injection (ICSI) to comprehensively investigate the effects of REE exposure on pregnancy outcomes.
-
This study recruited infertile couples who were undergoing their first in vitro fertilization (IVF) or ICSI cycle at the Center of Reproductive Medicine, Peking University Third Hospital, Beijing, China, from April to July 2023.
The inclusion criteria were as follows: 1) 20–38 years old, male under 60 years of age, and 2) meeting the diagnostic criteria for infertility (regular intercourse without conception for at least 12 months)[28]. Exclusion criteria were as follows: 1) couples who had poorly controlled diabetes mellitus and hypertension, serious cardiovascular disease, history of malignant tumors, undergone preimplantation genetic testing (PGT); 2) females who had undergone adenomyosis, uterine malformations, endometritis, hydrosalpinx, ovarian or uterine surgery, hyperprolactinemia, congenital adrenal cortical hyperplasia, Cushing’s syndrome, and hormone therapy within the past 3 months; 3) males who had severe asthenozoospermia, azoospermia, and undergone microscopic epididymal sperm aspiration (MESA) or testicular sperm extraction (TESE).
When a couple was enrolled, they completed a baseline questionnaire that included demographics and lifestyle characteristics, eating habits, nutritional intake, alcohol consumption, smoking status, second-hand smoke exposure, and current living and working environments. All participants were informed of the details of the study. Informed consent was obtained to allow us to collect clinical data from medical records and to donate their samples. This study was approved by the Ethics Committee of Peking University Third Hospital (M2022722).
-
All women enrolled in the study received individualized controlled ovarian hyperstimulation (COH) treatment following standardized protocols determined by physicians in the outpatient clinic according to their baseline infertility evaluations. 1) In the GnRH-antagonist (GnRH-ant) protocol, gonadotropin (Gonal-F, Pouliquen, or HMG) was administered on the second day of menstruation, and GnRH-ant (Diphereline, Cetrotide, or Ganirelix) was administered for pituitary suppression starting on cycle day 6 or 7, according to follicular growth (when at least one follicle reached a diameter of 12 mm). 2) In the long or super-long GnRH agonist (GnRH-a) protocol, GnRH-a (Triptorelin or Leuprorelin) was administered in the mid-luteal phase or during the menstrual period of the previous menstrual cycle. After 14 or 28 days, gonadotropin (Gn) treatment was initiated following GnRH agonist downregulation. 3) In the short GnRH-a protocol, GnRH-a (triptorelin) was used for pituitary suppression starting on cycle day 2 or 3, and gonadotropin was administered simultaneously.
-
For all female participants, when at least 2 follicles reached 18 mm in diameter, a dosage of 10,000 IU of human chorionic gonadotropin (hCG, Livzon, China, LOT: HCG10000Iu) or 250 µg of recombinant human choriogonadotropin (r-hCG; Eiser, LOT: AZ250 µg) was administered to trigger oocyte maturation. Subsequently, oocyte retrieval was performed 36 hours after hCG injection under the guidance of transvaginal ultrasound via a 17–18 g oocyte needle. Follicular fluid samples were collected during oocyte retrieval. Only the first dish of follicular fluid without blood contamination was collected. Subsequently, the follicular fluid samples were centrifuged at 4,000 rpm for 10 min and the supernatants were stored in cryogenic vials (Biosharp, China, LOT: BS-20-ST) at −80 °C immediately.
-
Blood samples from females were collected on the second or fourth day of the menstrual period using procoagulant tubes (Sekisui Medical Technology, China). After centrifuging at 3,500 rpm for 10 min, the serum was frozen and stored in a microtube (Axygen, China, LOT: MCT-200-C) at −80 °C until analysis. For male semen collection, a fresh ejaculated semen sample was collected on the day of oocyte retrieval, 2–7 days after abstaining from sexual intercourse. Then the sample was centrifuged at 400 ×g for 10 min, and the supernatants were immediately stored in cryogenic vials (Biosharp, China, LOT: BS-20-ST) at −80 °C. The choice between IVF or ICSI was based on the results of the semen analysis conducted on this day.
-
The following data were obtained from the medical records of female participants: age, height, body weight, body mass index (BMI), infertility type, infertility diagnosis, duration of infertility, and basal serum sex hormone levels. Treatment outcomes of IVF/ICSI were evaluated using a series of indicators. The information included the number of retrieved oocytes, mature oocytes (oocytes that entered metaphase II, MII), normal fertilized oocytes (presented with two pronuclei, 2PN), good-quality embryos (embryos with 6–10 spherical cells and < 20% fragmentation), maturation rate (calculated as the ratio of MII oocytes to retrieved oocytes), and fertilization rate (calculated as the ratio of 2PN oocytes to MII oocytes). Biochemical pregnancy (positive hCG > 25 IU 14 days after embryo transfer) and clinical pregnancy (presence of at least one gestational sac with fetal heartbeat detected on transvaginal ultrasound 30 days after embryo or blastocyst transfer) outcomes were followed up.
-
The samples were analyzed for REE (La, Ce, Pr, Nd, Sm, Eu, Gd, Tb, Dy, Ho, Er, Tm, Yb, and Lu) using an inductively coupled plasma-mass spectrometer (ICP-MS, ELAN DRC II; PerkinElmer, USA). To examine serum, follicular fluid, and semen samples, 0.1 mL of each sample was diluted in 2 mL volumetric flasks, then supplemented with 1.8 mL of 1% nitric acid (HNO3) (UPS, 68%; Suzhou Crystal Clear Chemical Co., Ltd., LOT: 210426227) and 0.1 mL of rhenium (4 ng/mL) (GSB 04-1745-2004, LOT: 228017) were added as internal standard. The mixed solution was shaken well before the measurement. The ICP-MS was operated under the following conditions: gas flow rate of 0.98 L/min, auxiliary gas flow rate of 1.85 L/min, plasma gas flow rate of 17.5 L/min, radio frequency power of 1,150 W, dwell time ranging from 50 to 100 ms, sample uptake rate of 1.1 mL/min, resolution ratio of 0.7 to 0.9 amu. ClinChek® serum controls for trace elements (order no. 8881) were employed as quality control (QC) samples in the study. Sample analyses were conducted at the Central Laboratory of Biological Elements at the Peking University Health Science Center in China.
-
Spearman’s correlation coefficients were calculated to evaluate the correlations among the REEs. The Mann–Whitney U test was used to compare the REE concentrations across the three types of samples. Bayesian Kernel Machine Regression (BKMR) and Weighted Quantile Sum (WQS) regression models were used to examine the associations between REEs as a mixture and the risks of IVF outcomes. The confounding factor was identified based on prior knowledge, including factors associated with IVF outcomes and REE concentrations in previous research[20,29,30]. Maternal age, BMI, fertilization mode, infertility type, and smoking status were selected as covariates in the adjusted logistic regression, BKMR, and WQS models.
-
Weighted generalized linear regression models were used to investigate the association between individual LREE concentrations and IVF outcomes[25]. Demographic and behavioral variables, including age, BMI, fertilization mode, infertility type, and smoking status, were incorporated as covariates in the adjusted models. Generalized linear regression models with categorical variables were also used to account for the potential nonlinear correlations between serum REEs and outcomes. Statistical results are presented as estimated odds ratios (ORs) and 95% confidence intervals (CIs).
-
BKMR models were employed to examine mixture effects and potential interactions between REEs and IVF outcomes[26]. Before establishing the model, the concentrations of all elements were log-transformed. Each BKMR model underwent 50,000 iterations for model fitting using the default priors. The BKMR model treated REEs as “exposure”, adjusting for covariates similar to logistic models. The probit link function h() was used to examine the association between continuous REE exposure and binary outcomes. This model allowed the identification of the independent effects of individual REEs in addition to the overall combined mixture effect. The association plot provides a visual representation of the individual REEs exposure-response functions. Interactions between REEs were assessed by estimating the changes in outcomes associated with changes in individual REE concentrations. A specific point estimate was calculated for the difference in the outcome levels for the change in individual REE concentrations between the 25th and 75th percentiles. Posterior Inclusion Probability (PIP) was derived to indicate the relative importance of each REE. A higher PIP for a given REE indicates a greater contribution of that element to the effect of mixed exposure on IVF outcomes. The BKMR model was executed using the “bkmr_0.2.2” package in R version 3.5.0.
-
The cumulative impact of REE mixture components on IVF outcomes was estimated using WQS regression. A threshold of ≥ (100%/n) for weights was used to determine the greatest contributors to the overall mixture effect. The established model aimed to estimate the exposure effect of the mixture on IVF outcomes. This study analyzed the association between the mixture exposure (WQS index) of REEs and IVF outcomes and calculated the weight of REEs for the WQS index. A two-sided P-value of < 0.05 was considered significant, and 95% CIs were calculated. The WQS model was performed using R 3.5.0 with the “gWQS_3.0.5” package.
-
A total of 141 couples were enrolled in this study, with 93 undergoing IVF cycles and 48 undergoing intracytoplasmic sperm injection (ICSI) cycles. The demographic characteristics of the study population are presented in Table 1. The baseline hormone levels and semen quality were within normal ranges for these parameters. Following assisted reproductive treatment, the average number of 2PN was 7.8 ± 5.2, the average number of good-quality embryos was 5.6 ± 4.3, and the average fertilization rate was 61.2% ± 22.0%. Ultimately, 74 women (59%) tested positive for hCG, and 57 (47%) presented with clinical pregnancy.
Table 1. The basic demographic and biological characteristics of the couples
Characteristics Females Males Age (years), mean ± SD 32.0 ± 3.1 33.3 ± 4.0 < 35, n (%) 15 (11.0) 98 (69.5) ≥ 35, n (%) 126 (89.0) 43 (30.5) BMI (kg/m2), mean ± SD 23.2 ± 3.7 26.1 ± 5.0 ≤ 25, n (%) 104 (73.8) 62 (46.6) > 25, n (%) 37 (26.2) 71 (53.4) Smoking status, n (%) Smoker 0 52 (37.4) Non-smoker 139 (100.0) 87 (63.6) Infertility type, n (%) Primary infertility 32 (22.7) − Secondary infertility 109 (77.3) − AMH (ng/m), mean ± SD 4.3 ± 3.1 − Basal hormone level, mean ± SD FSH (mIU/mL) 6.3 ± 2.1 − PRL (ng/mL) 14.9 ± 11.1 − LH (mIU/mL) 3.4 ± 2.1 − E2 (pmol/L) 111.9 ± 116.8 − T (nmol/L) 0.8 ± 0.3 − P (ng/mL) 2.8 ± 19.9 − Sperm concentration (× 106/mL), mean ± SD − 47.5 ± 3.5 Progressive motility (%), mean ± SD − 34.0 ± 18.9 Sperm viability (%), mean ± SD − 28.5 ± 17.4 Note. Data was described as n (%) or mean ± SD. SD, standard deviation; BMI, body mass index; IVF, in vitro fertilization; ICSI, intracytoplasmic sperm injection; 2PN, two pronuclei. -
The concentrations of 14 REEs were examined in the serum and follicular fluid of females and in the semen of males. The REEs with detection rates exceeding 80% included La, Ce, Pr, Nd, and Sm. All were classified as light rare earth elements (LREEs) and further analyzed[27].
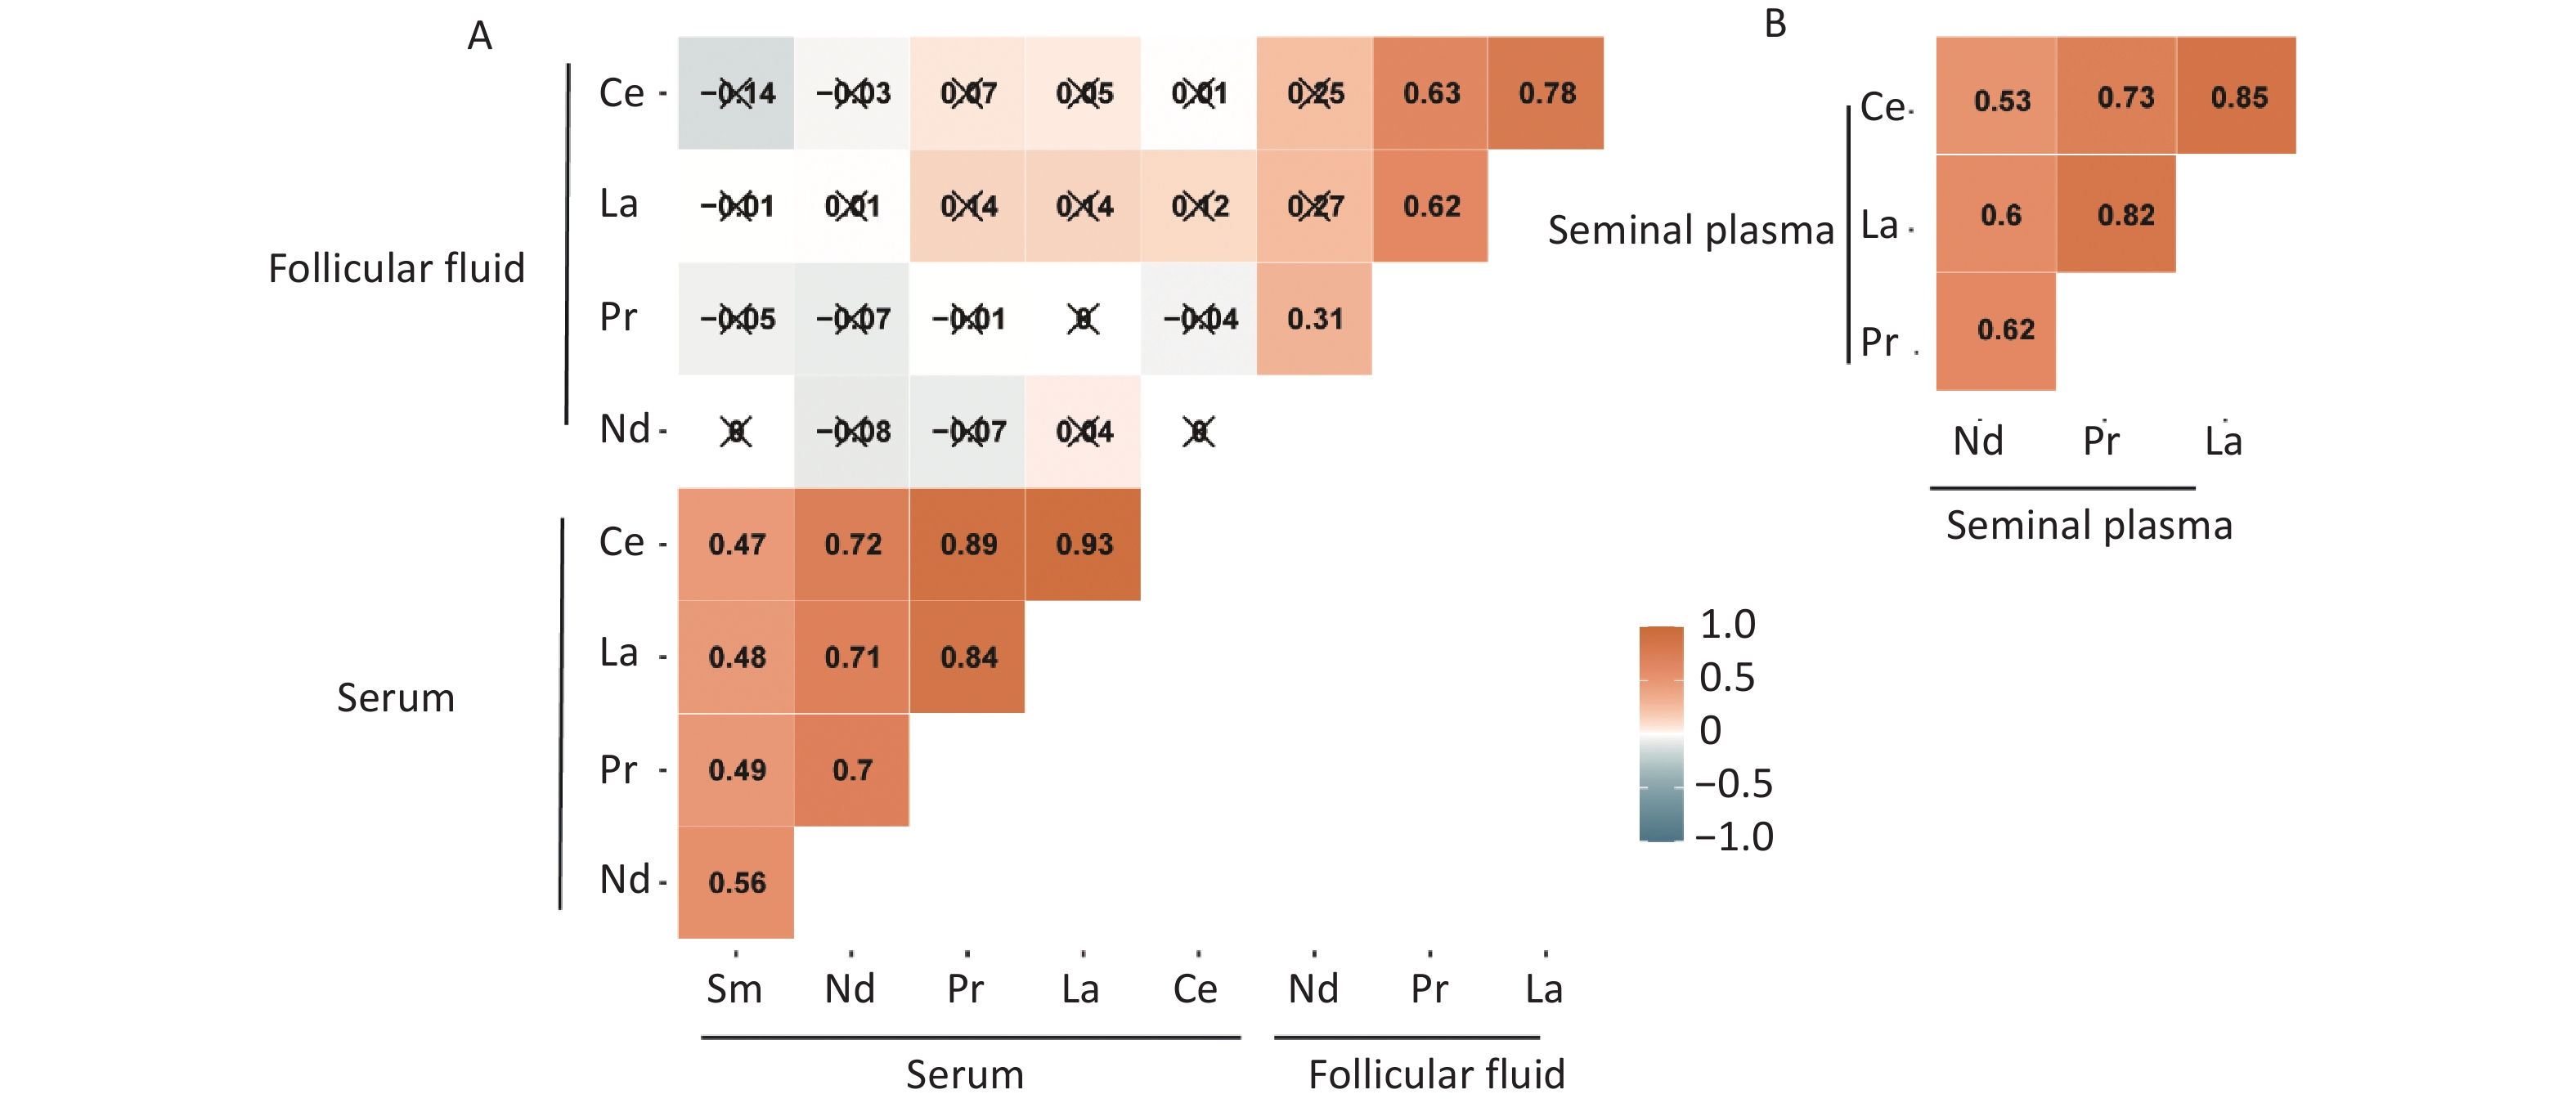
La, Ce, Pr, and Nd were detected in all three samples; however, the concentrations of these elements varied in different samples (Table 2). The concentration of REEs in female serum was significantly higher than that in the follicular fluid (P < 0.001), suggesting a potential barrier for REEs when entering the follicular fluid from the blood. The concentration in male semen was higher than that in female follicular fluid (P < 0.001) and comparable to that in female serum (P = 0.034). Sm was only detected in the female serum (Table 3). The Spearman correlation coefficients for all elements are shown in Supplementary Figure S1 (available in www.besjournal.com). The five LREEs (La, Ce, Pr, Nd, and Sm) were positively correlated with each other in serum, and a similar correlation was observed among the four elements (La, Ce, Pr, and Nd) in follicular fluid and semen. La and Ce were positively correlated in all three sample types, with correlations ranging from 0.78 to 0.93. However, there was no correlation between REEs in the serum and follicular fluid of the same female.
Table 2. The results of IVF and ICSI
Couple/cycle-specific characteristics Couples Fertilization mode, n (%) IVF 93 (66.0) ICSI 48 (34.0) No. of oocytes retrieved, mean ± SD 13.0 ± 7.7 No. of 2PN, mean ± SD 7.8 ± 5.2 No. of good-quality embryos, mean ± SD 5.6 ± 4.3 Fertilization rate (%), mean ± SD 61.2 ± 22.0 IVF outcomes, n (%) HCG test Positive 74 (59.2) Negative 51 (40.8) Clinical pregnancy Yes 57 (47.2) No 64 (52.8) Note. Data was described as n (%) or mean ± SD. SD, standard deviation; IIVF, in vitro fertilization; ICSI, intracytoplasmic sperm injection; 2PN, two pronuclei. Table 3. REE concentrations of the IVF-embryo transfer couples
Elements Sample Median (IQR) Mean ± SD LOD Detection ratio (%) Ce (ng/mL) Serum 0.097 (0.061, 0.167) 0.149 ± 0.163 0.0004 100.0 Follicular fluid 0.034 (0.020, 0.05) 0.046 ± 0.044 0.0004 100.0 Seminal plasma 0.246 (0.168, 0.374) 0.289 ± 0.206 0.0004 100.0 La (ng/mL) Serum 0.080 (0.048, 0.124) 0.107 ± 0.097 0.0006 100.0 Follicular fluid 0.016 (0.009, 0.027) 0.022 ± 0.021 0.0006 99.3 Seminal plasma 0.089 (0.054, 0.128) 0.101 ± 0.084 0.0006 97.2 Nd (ng/mL) Serum 0.144 (0.097, 0.199) 0.172 ± 0.119 0.0003 100.0 Follicular fluid 0.069 (0.054, 0.101) 0.076 ± 0.034 0.0003 100.0 Seminal plasma 0.118 (0.080, 0.171) 0.130 ± 0.076 0.0003 100.0 Pr (ng/mL) Serum 0.026 (0.017, 0.040) 0.033 ± 0.026 0.0001 100.0 Follicular fluid 0.009 (0.007, 0.012) 0.010 ± 0.006 0.0001 100.0 Seminal plasma 0.023 (0.013, 0.036) 0.027 ± 0.020 0.0001 100.0 Sm (ng/mL) Serum 0.050 (0.031, 0.06) 0.053 ± 0.030 0.0004 99.3 Note. Data was described as Median (IQR), n (%), or mean ± SD. SD, standard deviation; IQR, interquartile range; LOD, limit of detection. REE, rare earth elements; IVF, in vitro fertilization. -
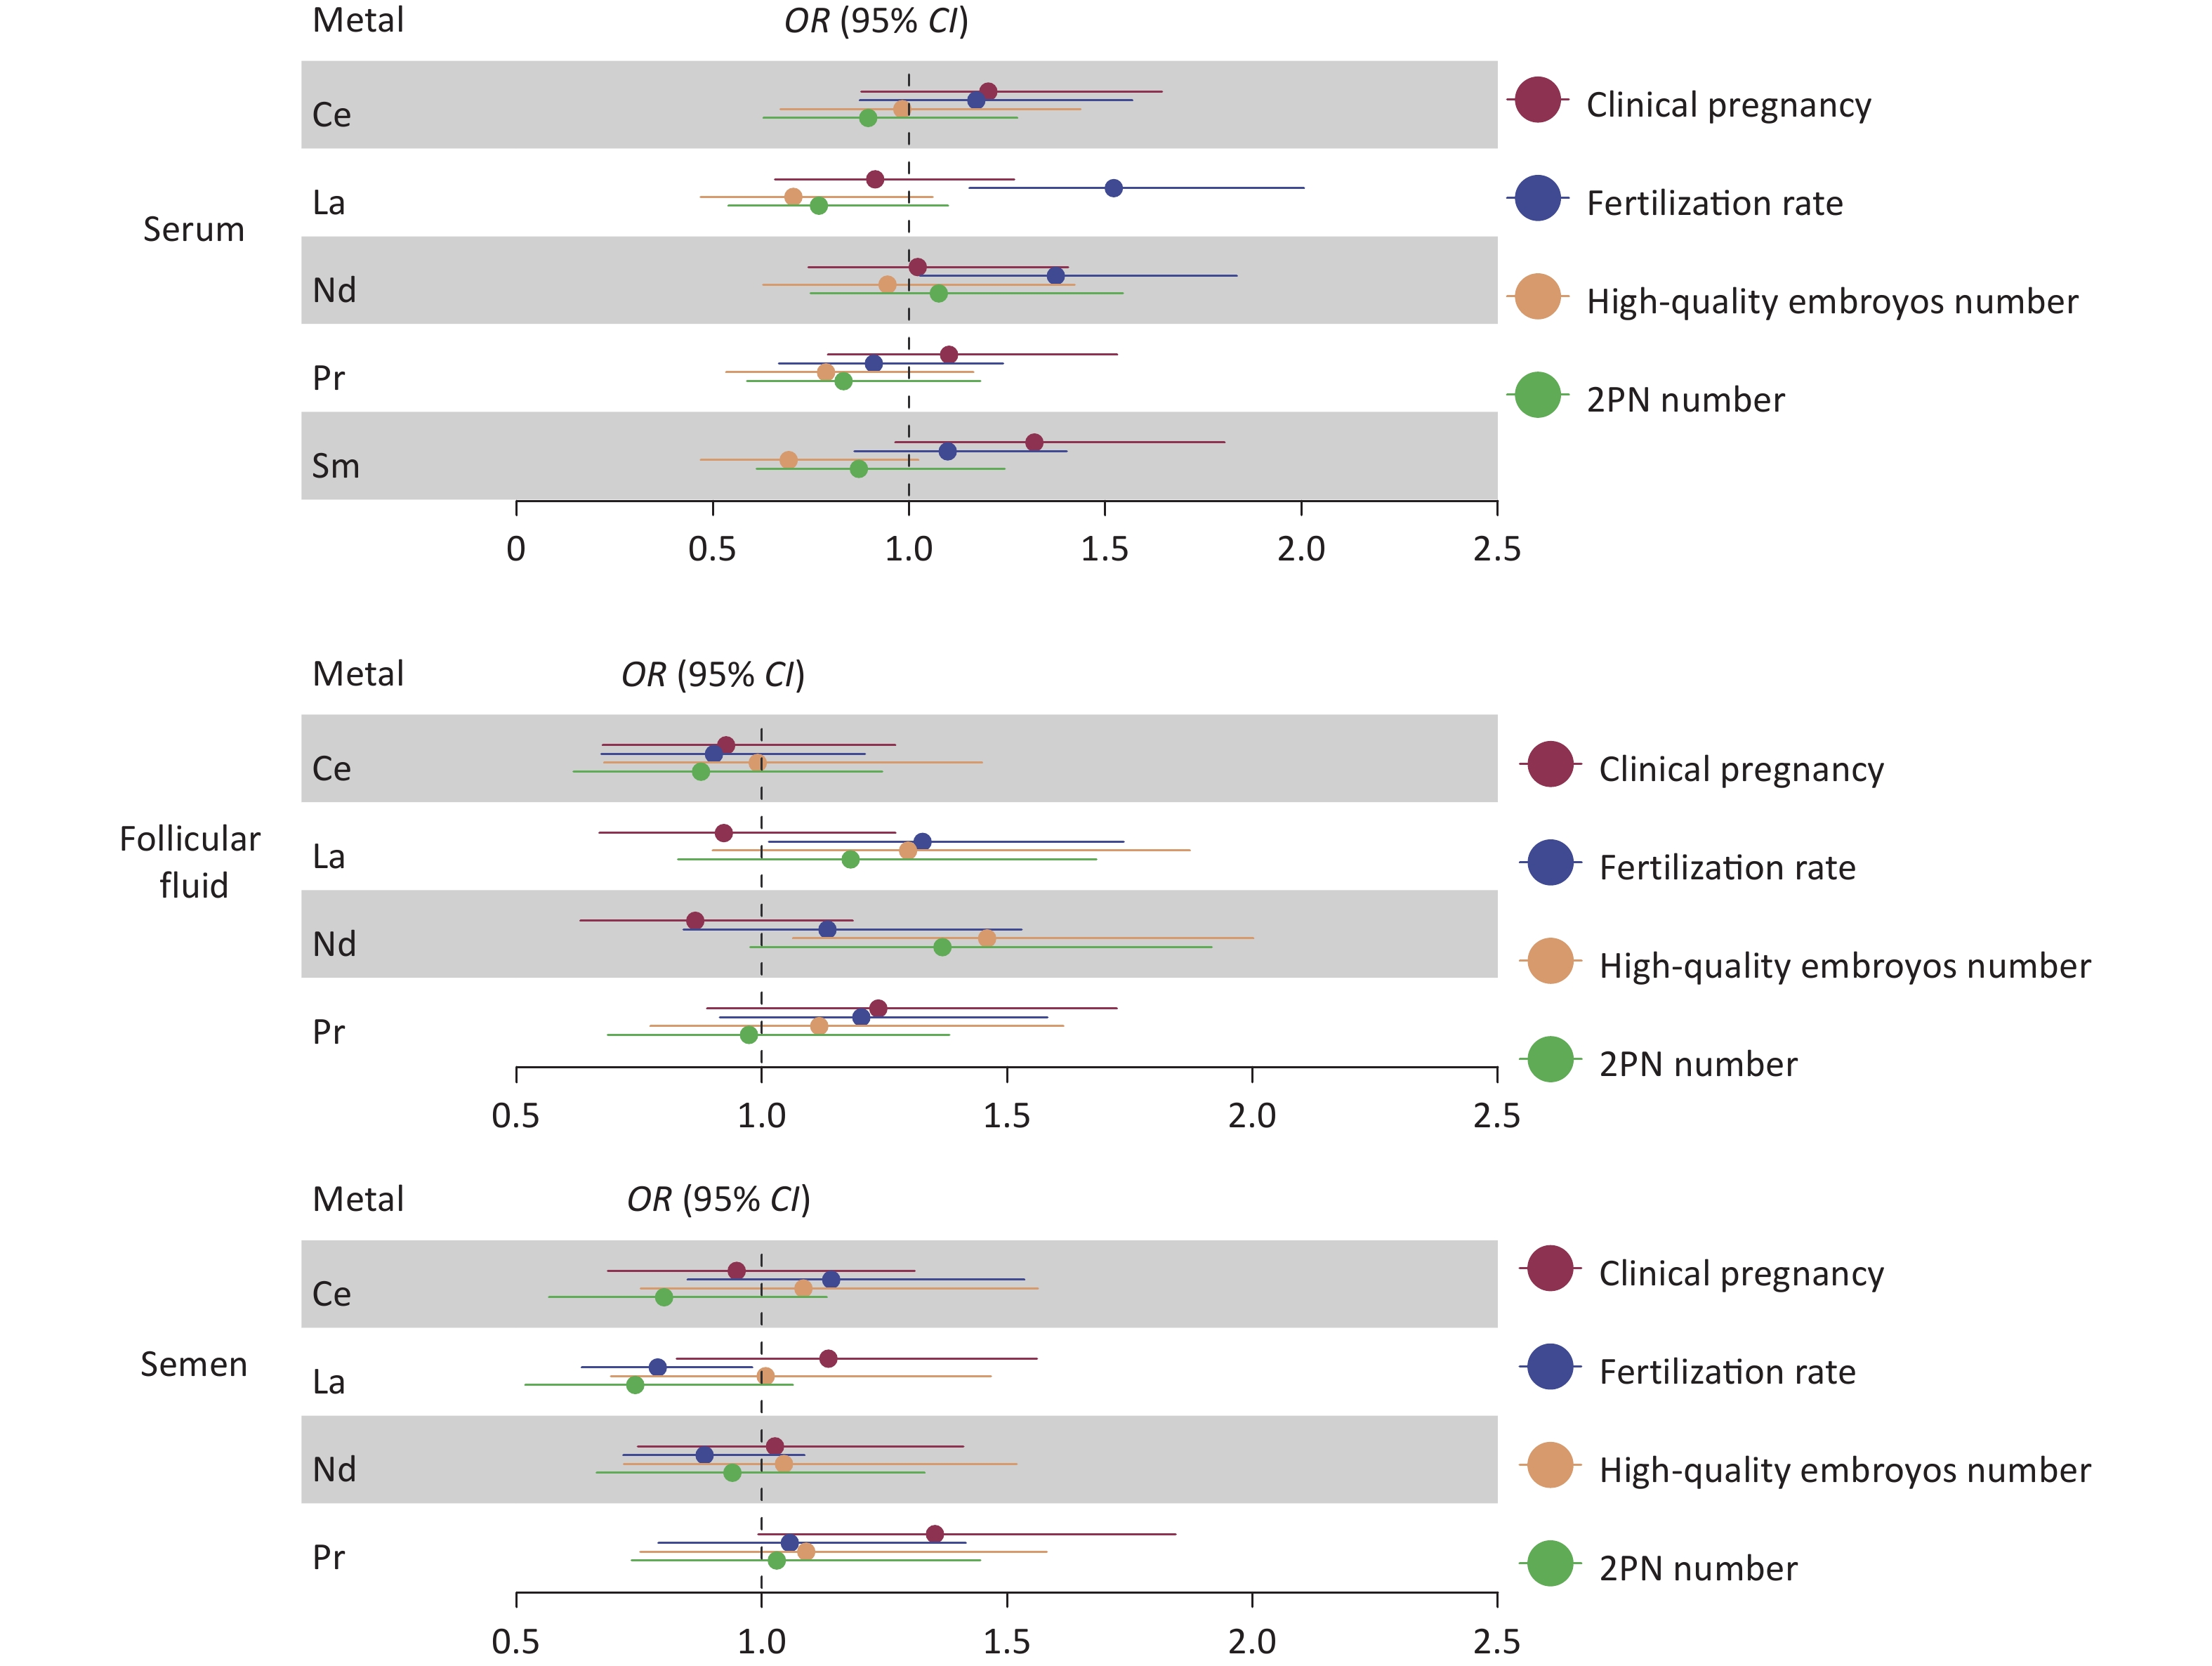
For females, REE levels in the serum and follicular fluid exhibited no significant correlation with fertilization rate, number of two pronuclei (2PN), number of good-quality embryos, or clinical pregnancy outcomes. Similarly, REE levels in male semen exhibited no significant correlation with the number of 2PN embryos, the number of good-quality embryos, or clinical pregnancy outcomes (Figure 1 and Supplementary Table S1, available in www.besjournal.com). However, an elevated level of La in male semen (median 0.089 ng/mL, OR: 0.79, 95% CI: 0.63–0.98, P = 0.03) was associated with a lower fertilization rate (Figure 1). Further stratified analysis of ICSI and IVF reveals that the association of La with fertilization rate can be corrected after the artificial selection of sperm through ICSI (OR: 1.17, 95% CI: 0.88–1.55, P = 0.27).
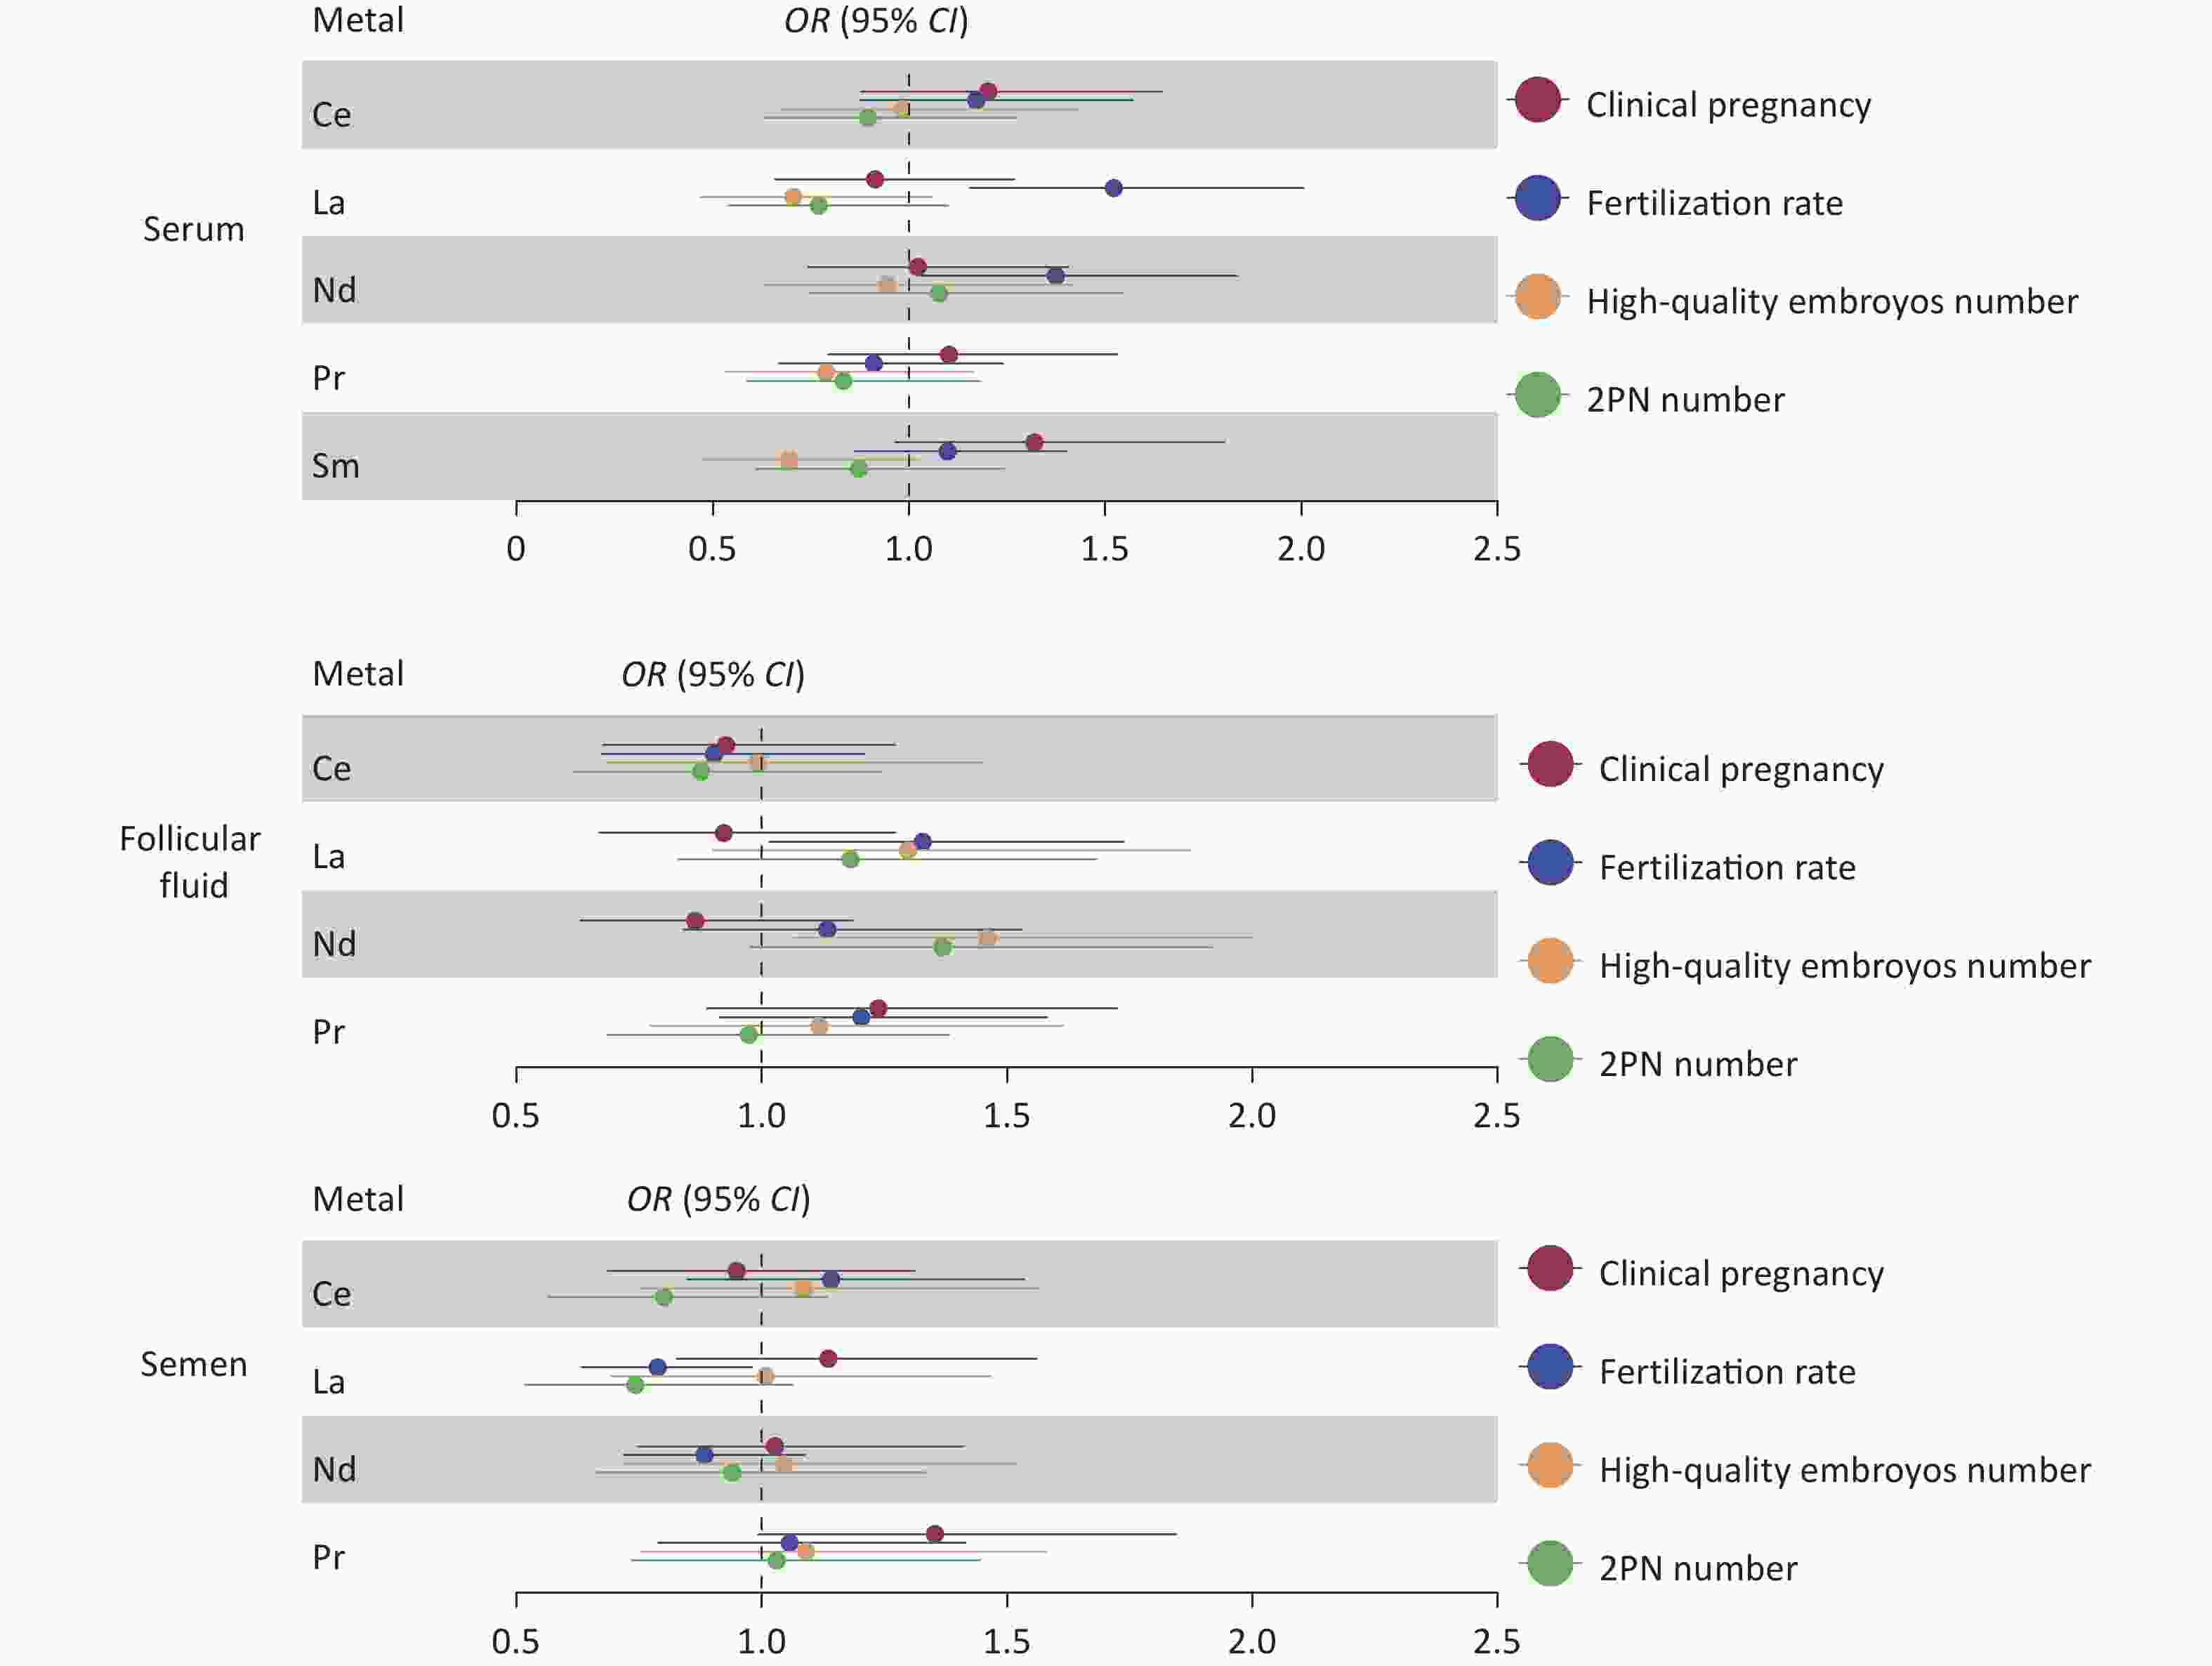
Figure 1. Relative risk of LREE concentrations associated with reproductive characteristics in IVF-ET couples. Results of the associations of REE with the number of 2PN, the number of good-quality embryos, fertilization rate, and clinical pregnancy (adjusted by age, BMI, fertilization mode, infertility type, and smoking status). Blue represents a statistically significant negative association; red represents a statistically significant positive association. LREE, light rare earth elements; IVF-ET, in vitro fertilization-embryo transfer; 2PN, two pronuclei.
-
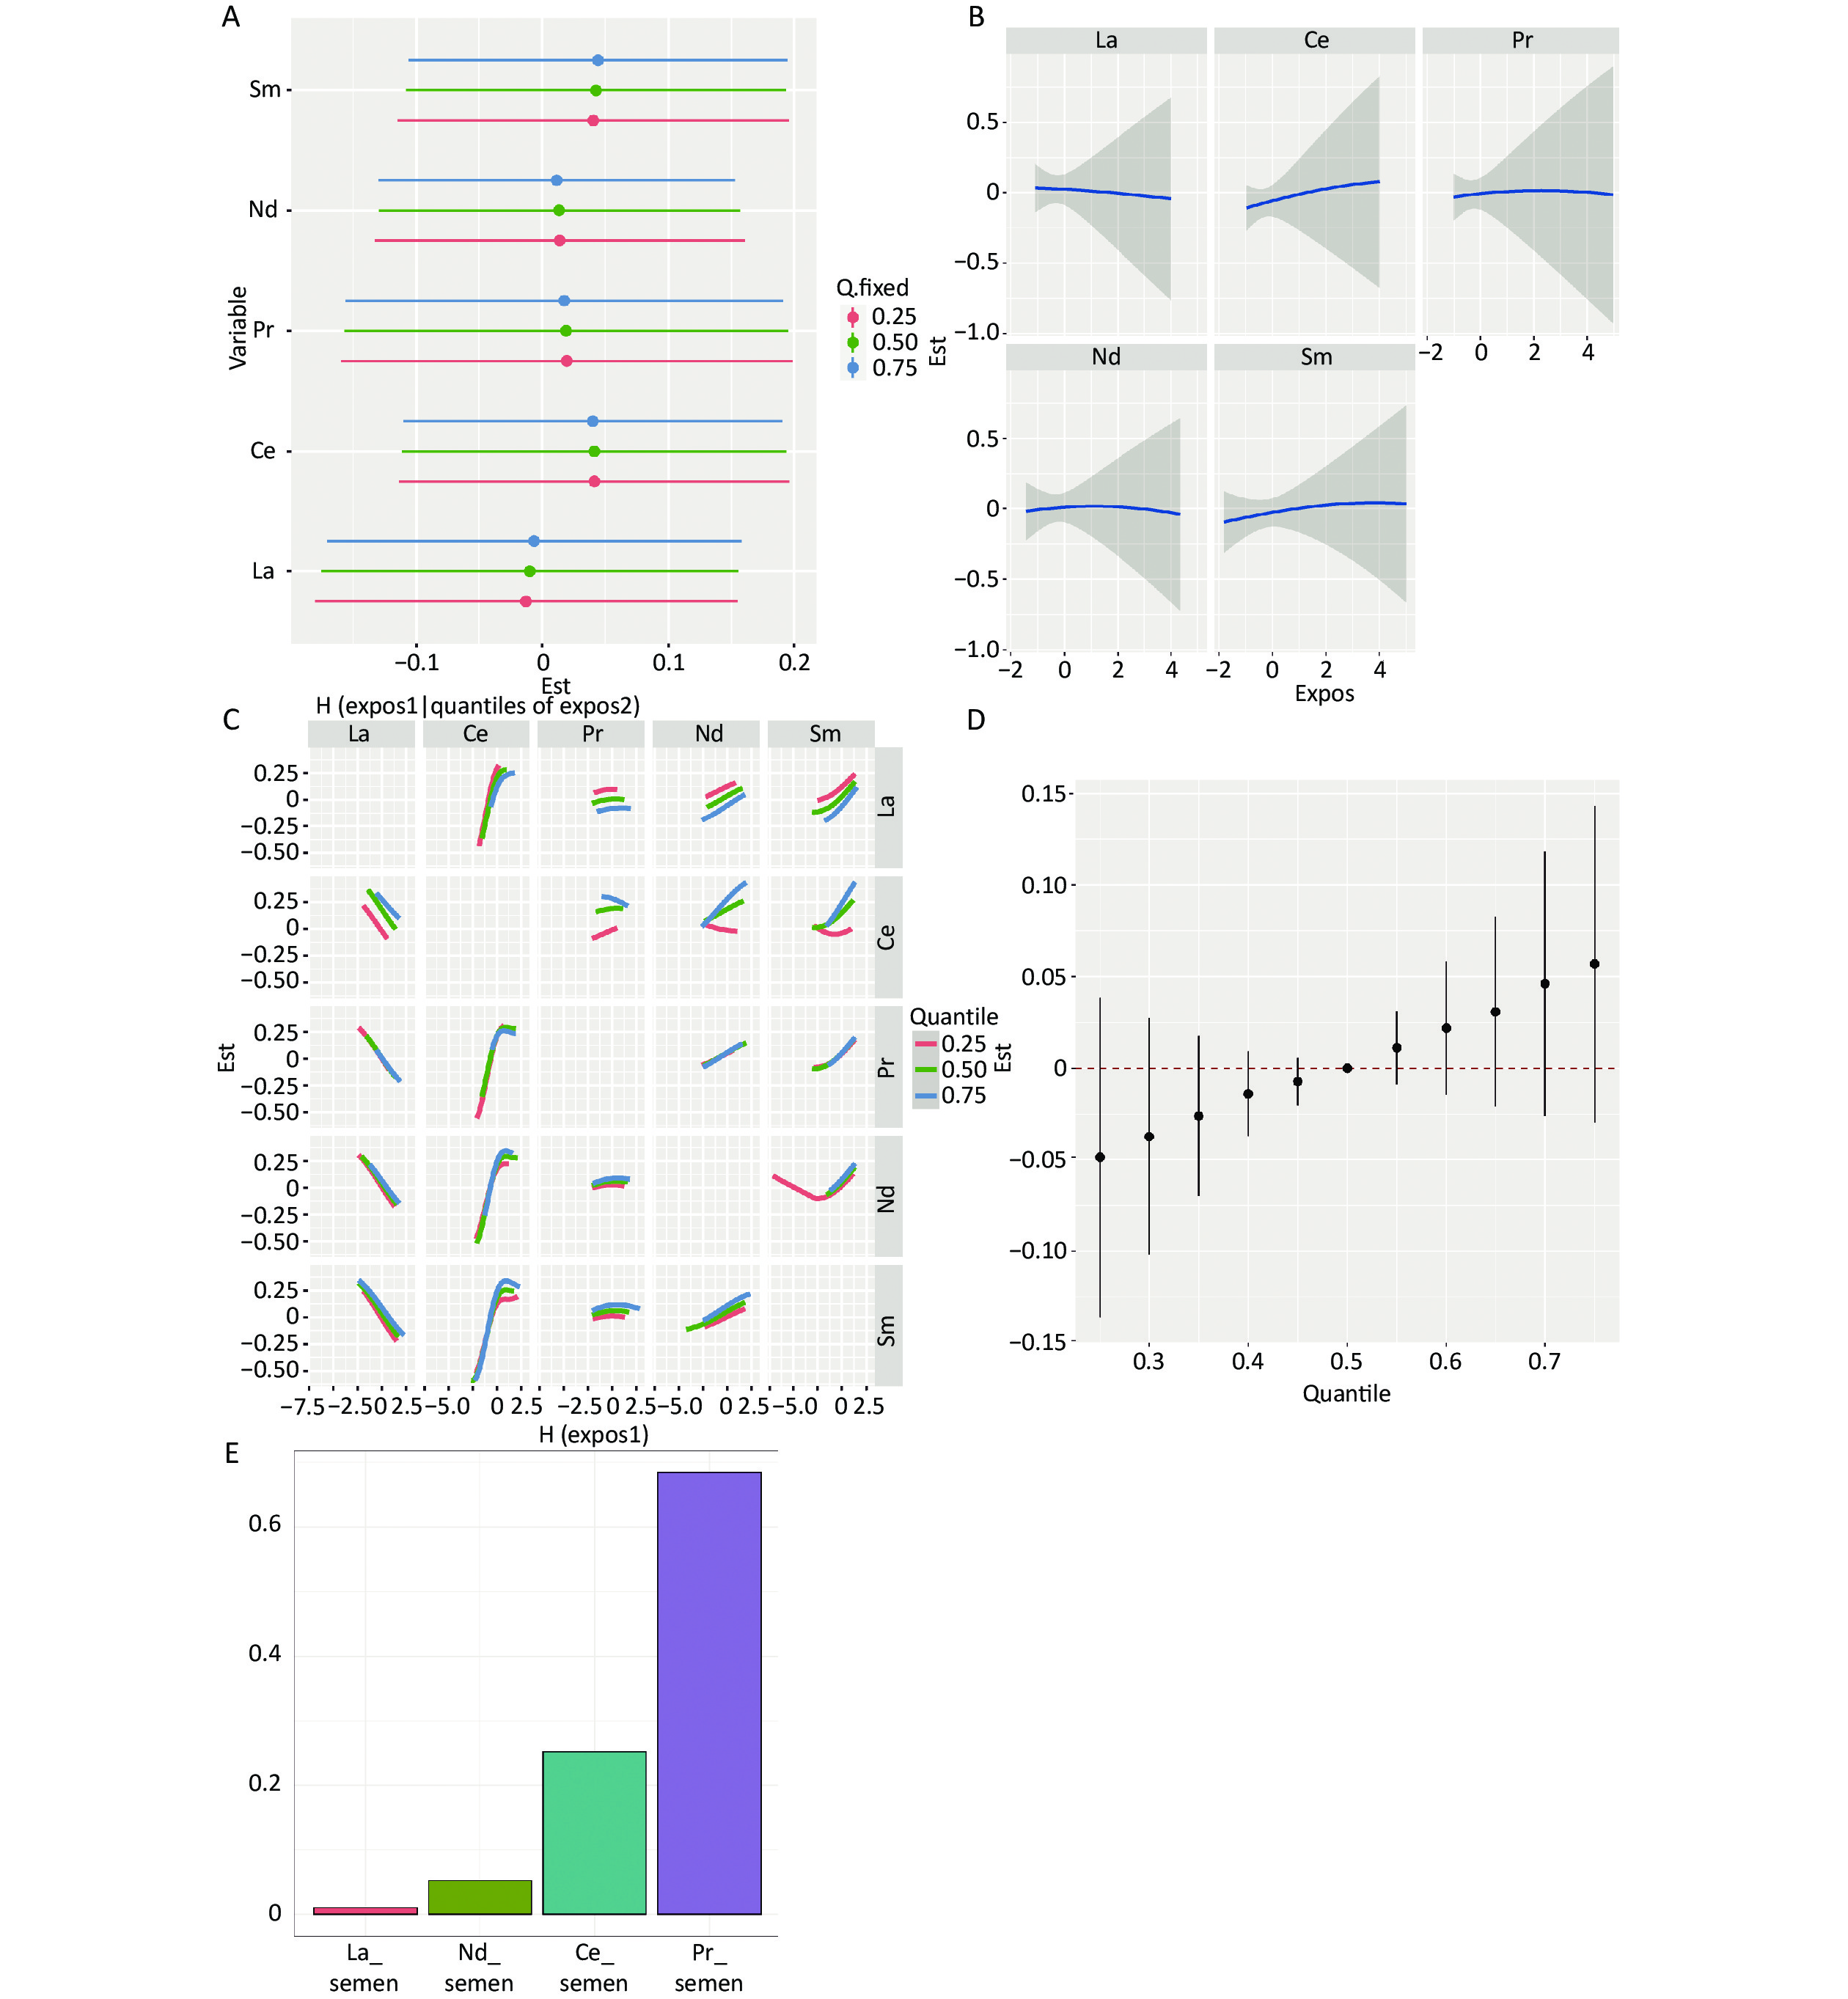
When the other three elements were set at the 25th, 50th, and 75th percentile concentrations of seminal plasma, Pr was positively associated, and Nd was negatively associated with clinical pregnancy (Figure 2A). The dose-response curves for REEs tended to be linear based on the univariate exposure-response curves of individual elements with pregnancy outcomes (Figure 2B). In the bivariate exposure-response function, interactions were found between Nd and La, Ce, and Pr (Figure 2C). Mixed REE exposure to REEs shows not associated with clinical pregnancy outcomes (Figure 2D). The PIP is highest for seminal plasma La at 0.53 (Supplementary Table S2, available in www.besjournal.com). WQS model analysis results indicate no association between mixed exposure and clinical pregnancy (OR: 1.03; 95% CI: 0.91–1.15; P = 0.62). La contributed the most to the mixed index with a weight of 64% (Figure 2E).
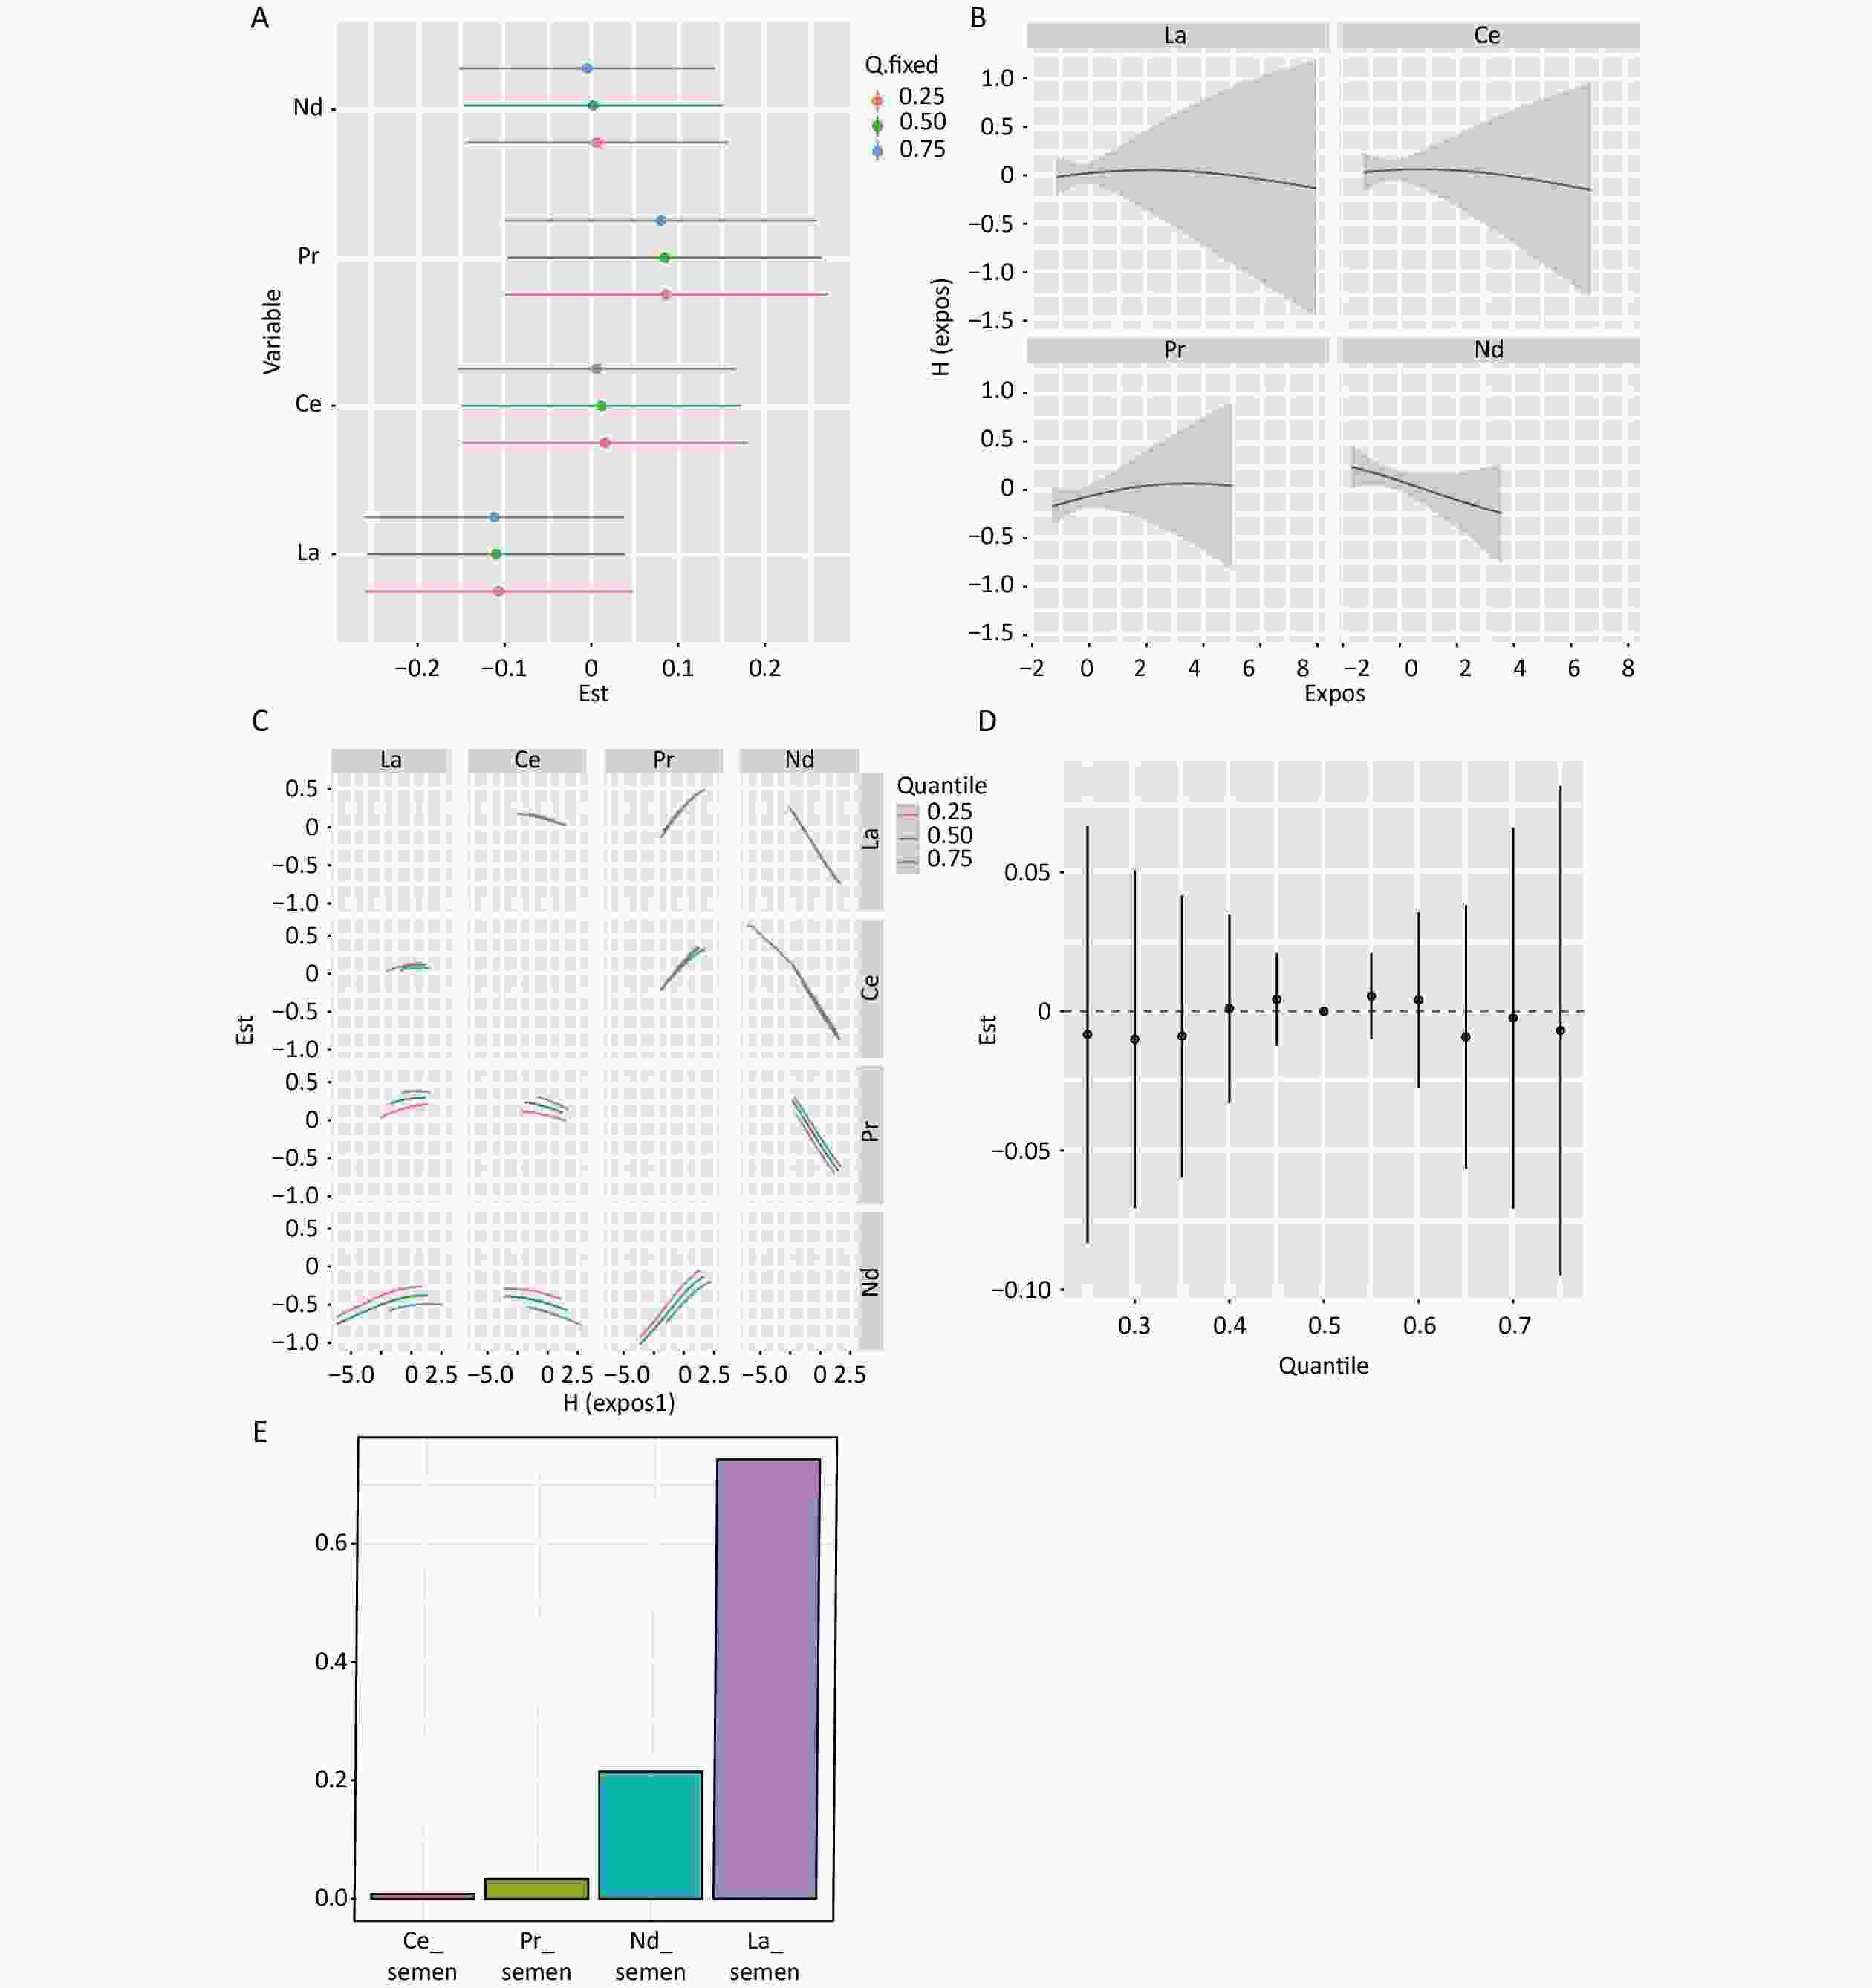
Figure 2. Mixture exposure analysis of WQS model regression models and BKMR Models for clinical pregnancy in semen. (A) Single REEs association. The plot compares the changes in clinical pregnancy [h(expo)] when the LREE is at its 75th and 25th percentiles, while the other elements are fixed at their 25th, 50th, and 75th percentiles. (B) Univariate exposure-response analysis for the associations between each REE and clinical pregnancy. Univariate exposure-response functions and 95% confidence intervals are calculated for the associations between each REE and clinical pregnancy, with other elements fixed at their median concentrations. (C) Bivariate exposure-response functions for a type of REE were fixed at either the 25th, 50th, or 75th percentile, while the remaining REEs were fixed at the median. (D) Association between mixed REE exposure and clinical pregnancies. The plot compares the estimated risk change [h(expo)] when all REEs are at their specific quantiles to those at their 50th percentile. (E) The weights of REEs in clinical pregnancy based on WQS regression analysis. Models were adjusted for age, BMI, fertilization mode, infertility type, and smoking status. LREE, light rare earth elements.
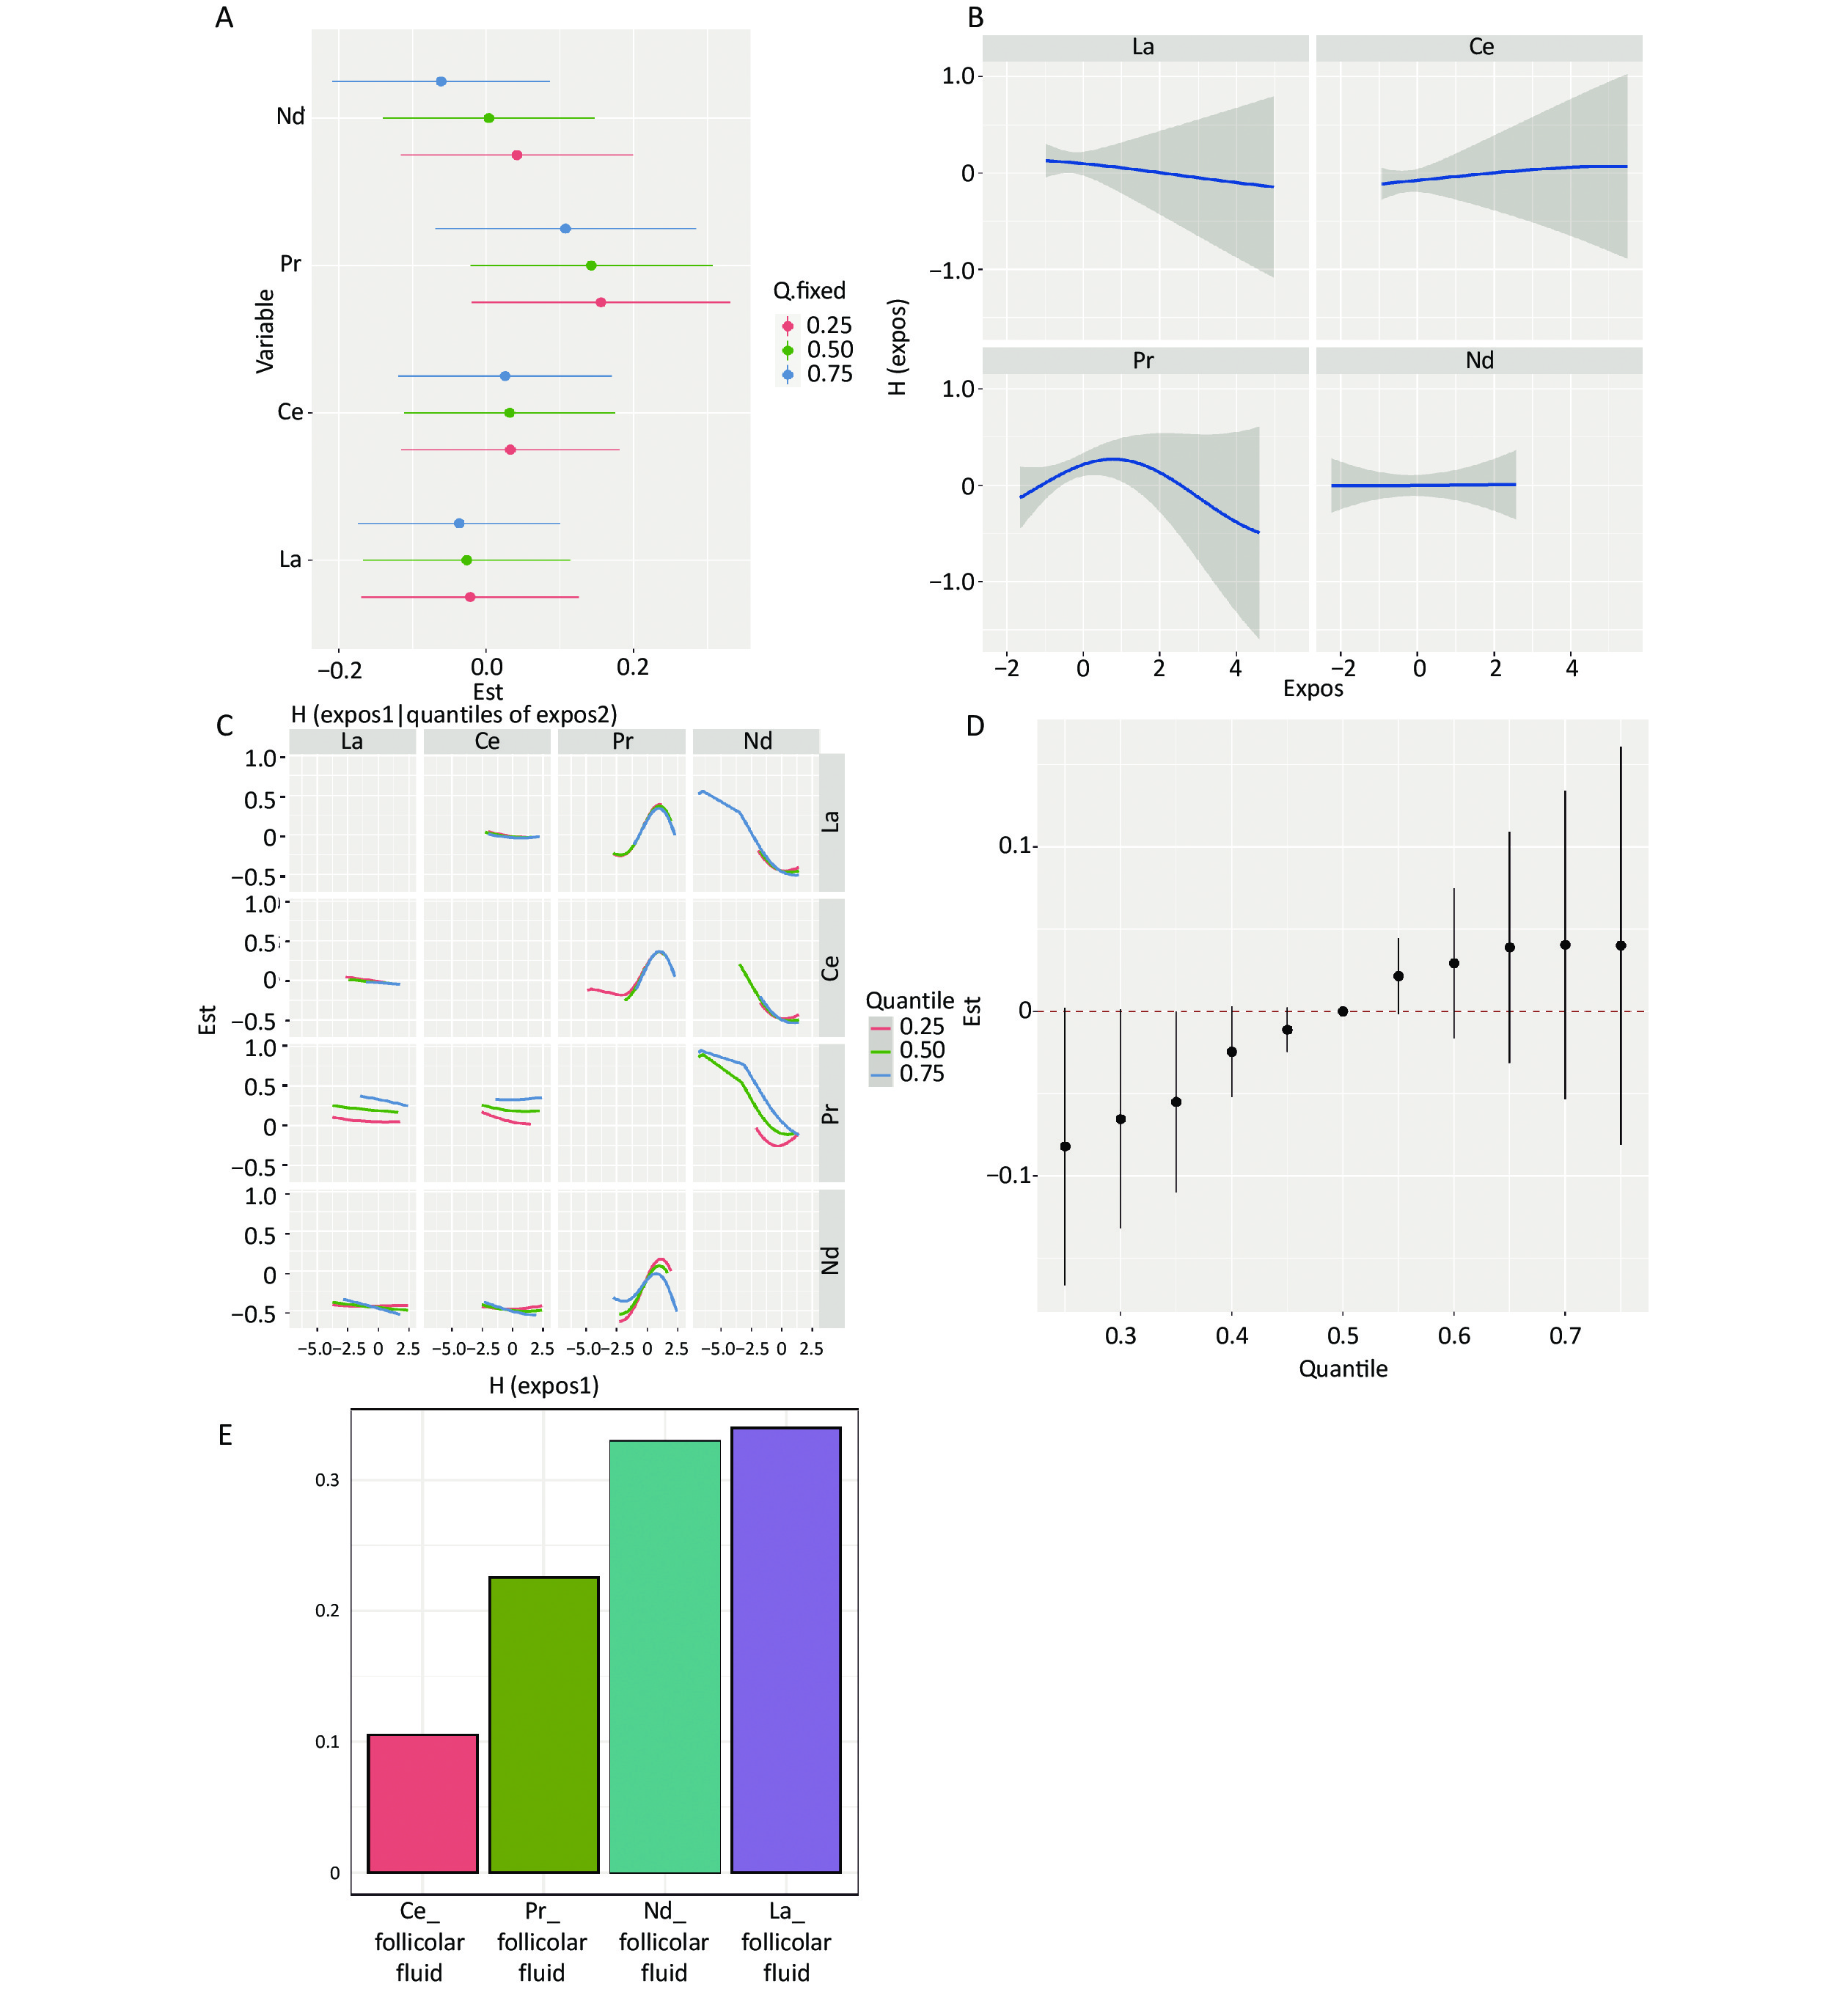
When the remaining elements were set at the 25th, 50th, and 75th percentile concentrations, Sm and Ce in serum, as well as Pr in follicular fluid, were positively correlated with clinical pregnancy (Supplementary Figure S2A and Supplementary Figure S3A, available in www.besjournal.com); however, according to the individual element's univariate exposure-response curves with pregnancy, only Pr in follicular fluid showed a nonlinear relationship (Supplementary Figure S3B). In the bivariate exposure-response function of serum REEs, interactions were found between Ce and Sm (Supplementary Figure S2C). Regarding the follicular fluid, interactions were found between Nd and La, Ce, and Pr (Supplementary Figure S3C). Ultimately, in both the serum and follicular fluid, BKMR mixed exposure to REEs showed a positive association with clinical pregnancy outcomes (Supplementary Figure S2D, Supplementary Figure S3D). The results of the WQS model analysis also suggest a positive association between mixed exposure and clinical pregnancy (Supplementary Figure S2E, Supplementary Figure S3E).
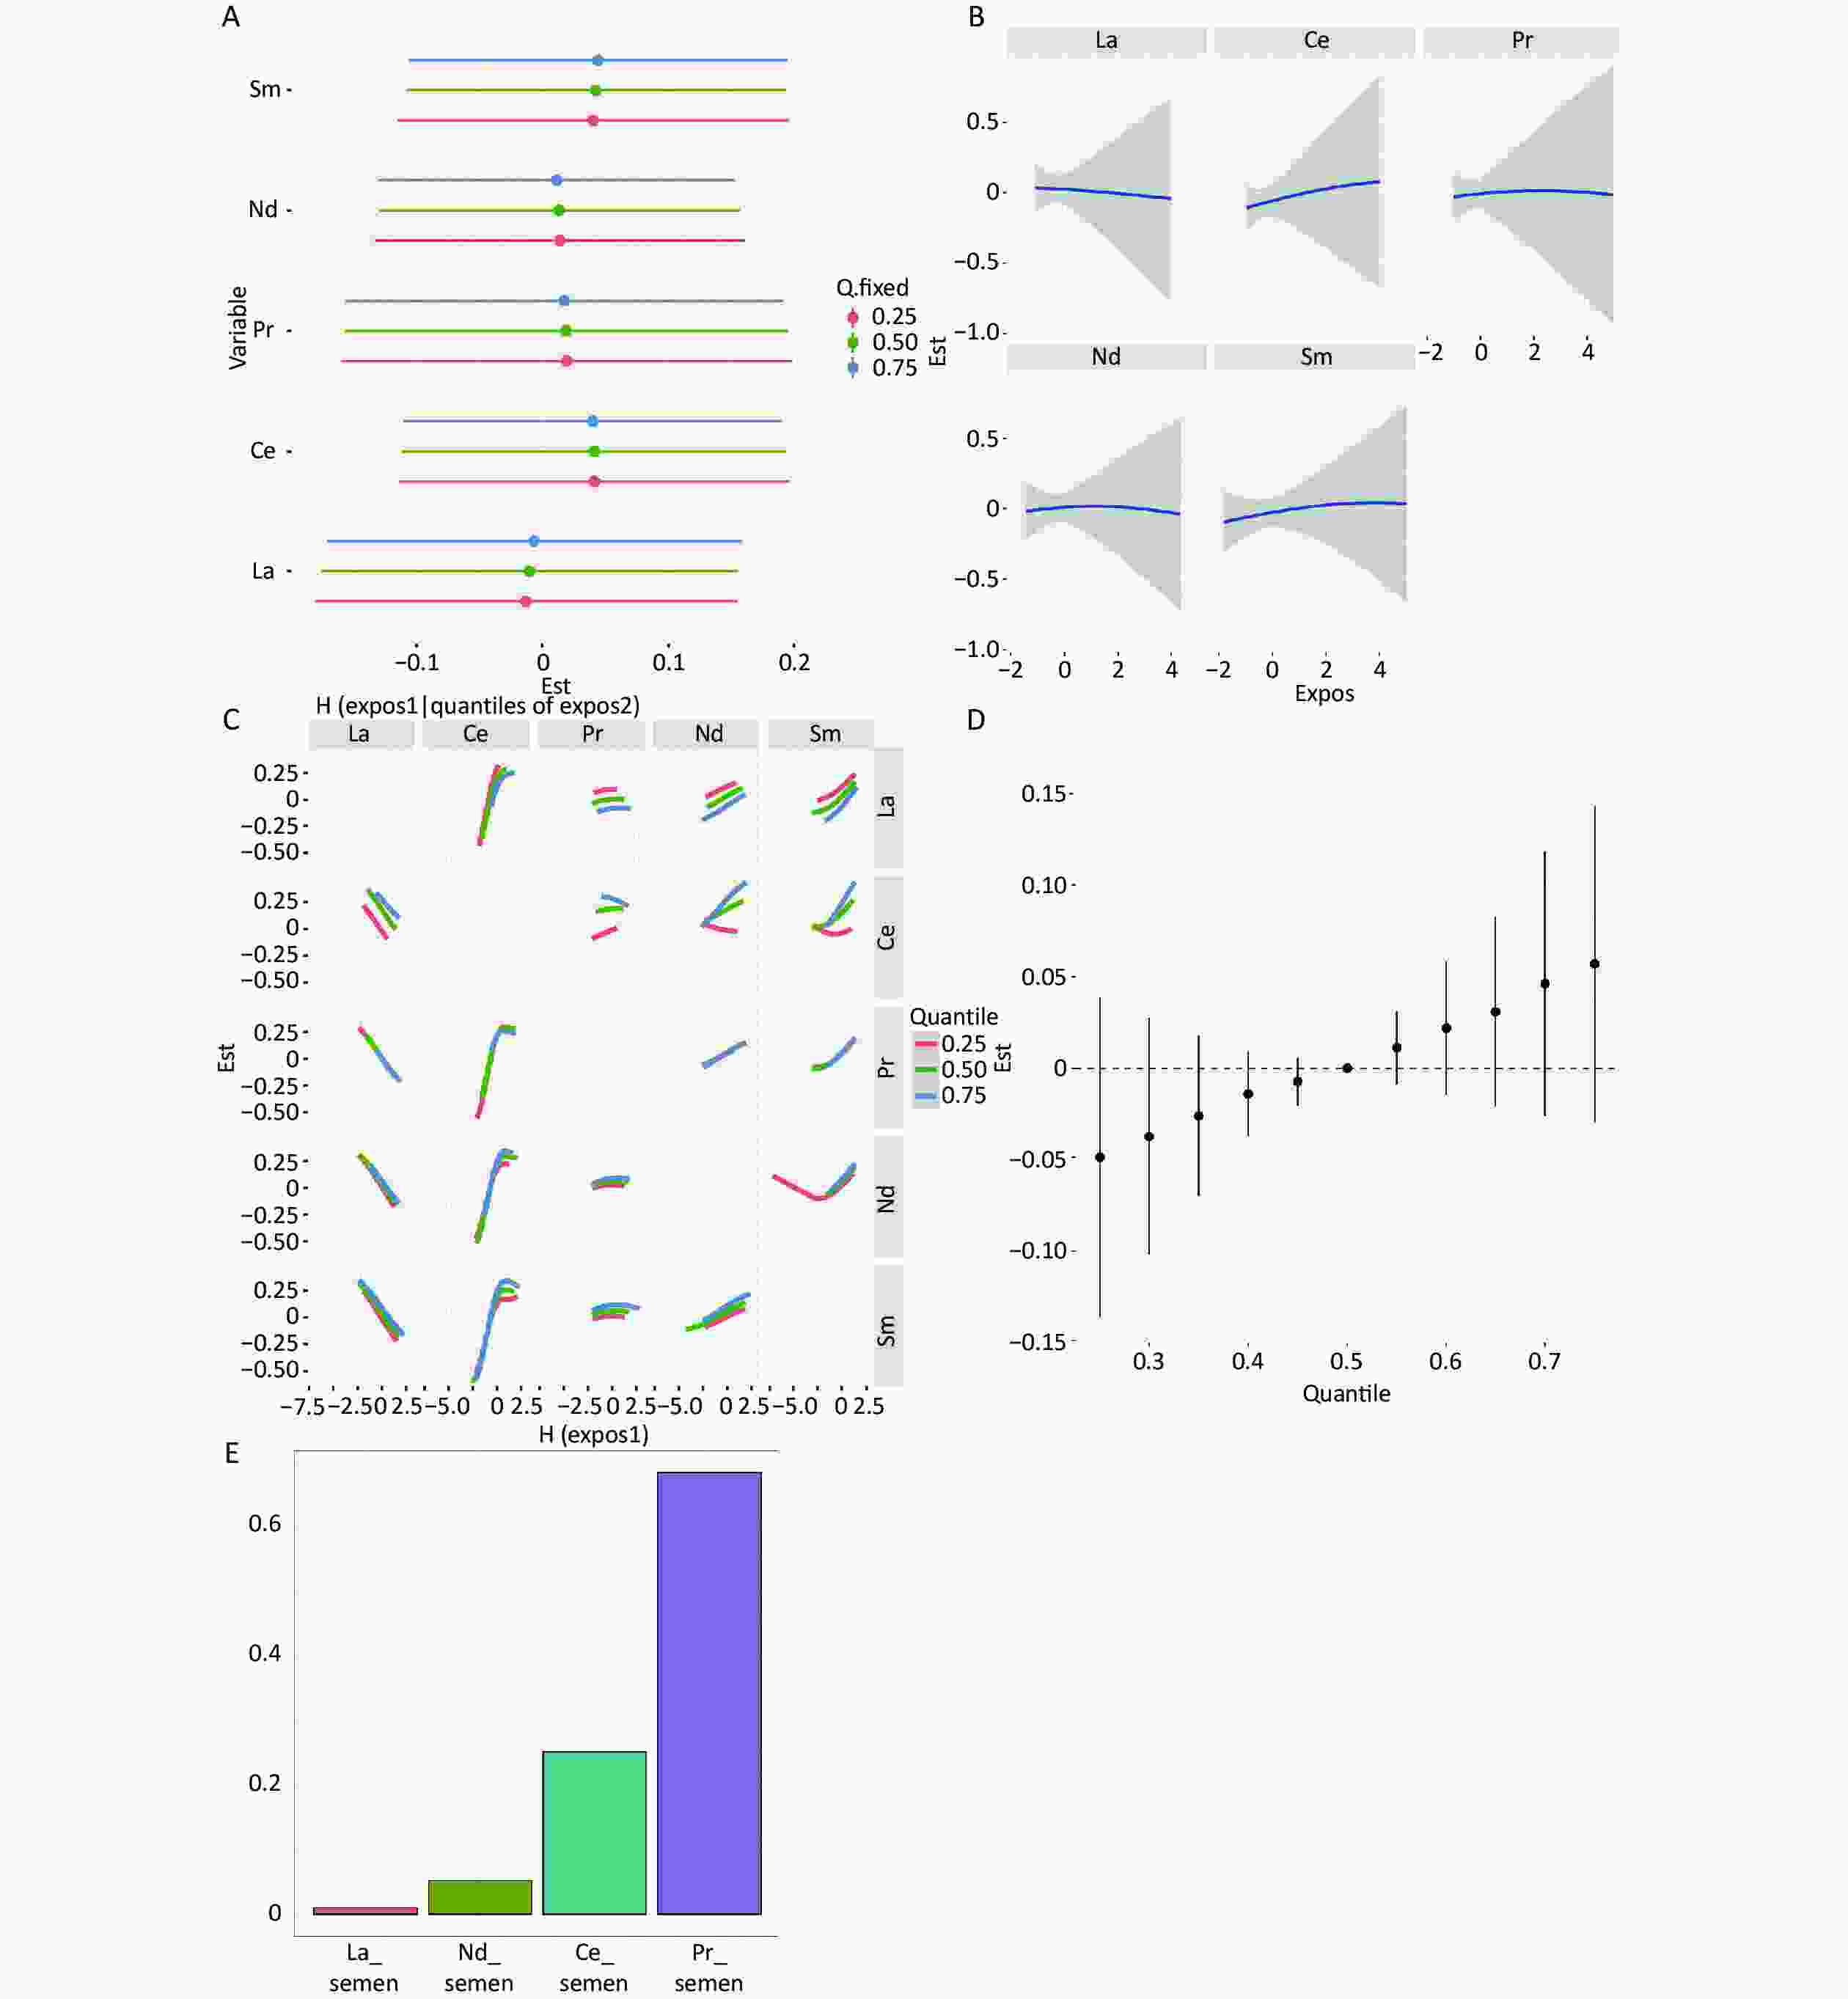
Figure S2. Mixture exposure analysis of WQS model regression models and BKMR models for clinical pregnancy in serum. (A) Single REEs association. The plot compares the changes in clinical pregnancy [h(expo)] when the LREE is at its 75th vs 25th percentile and other elements are fixed at their 25th, 50th, or 75th percentile, respectively. (B) Univariate exposure-response for the associations between each REEs and clinical pregnancy. Univariate exposure-response function and 95% confidence intervals for the associations between each REEs and clinical pregnancy, with other elements fixed at their median concentrations. (C) Bivariate exposure–response functions for a kind of REE fixed at either the 25th, 50th, or 75th percentile and the rest of REEs are fixed at the median. (D) Associations between the mixed exposure to REEs and clinical pregnancy. The plot compares the estimated risk change [h(expo)] when all the REEs are at their specific quantile compared to those that are all at their 50th percentile. (E) The weights of REEs in clinical pregnancy based on WQS regression analysis. Models adjusted age, BMI, fertilization mode, infertility type, and smoking status.
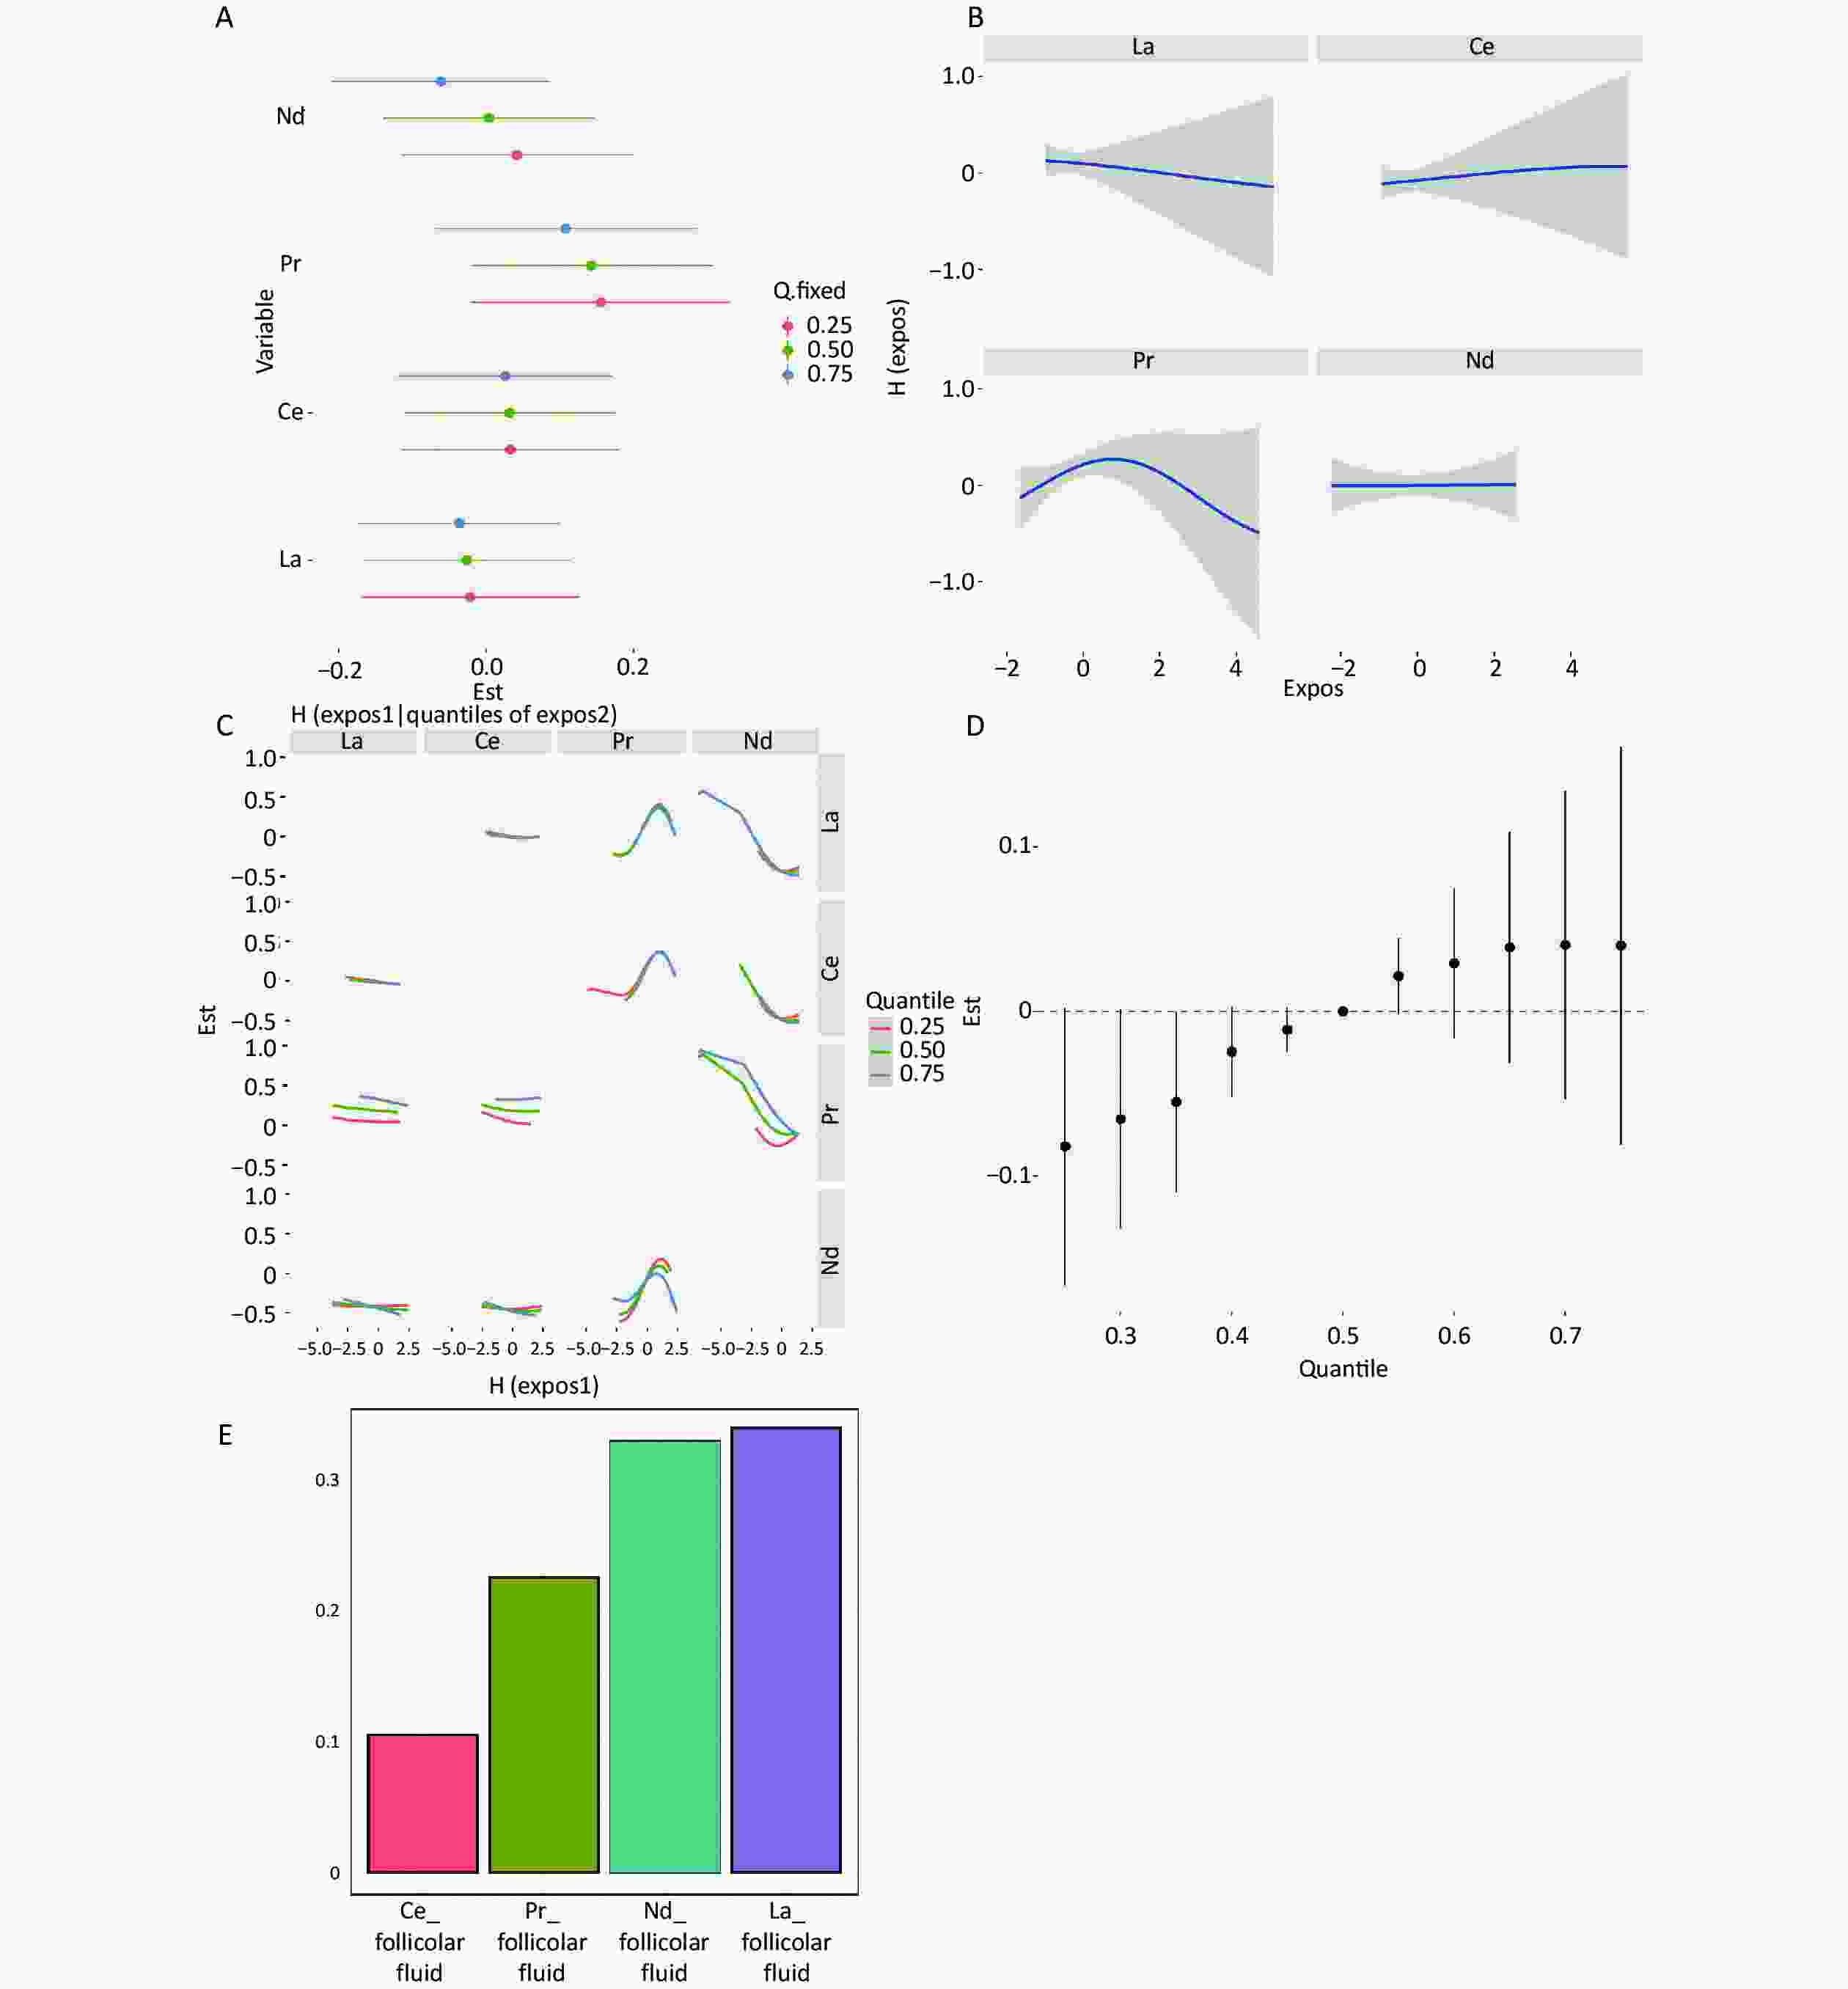
Figure S3. Mixture exposure analysis of WQS model regression models and BKMR models for clinical pregnancy in follicular fluid. (A) Single REEs association. The plot compares the changes in clinical pregnancy [h(expo)] when the LREE is at its 75th vs 25th percentile and other elements are fixed at their 25th, 50th, or 75th percentile, respectively. (B) Univariate exposure-response for the associations between each REEs and clinical pregnancy. Univariate exposure-response function and 95% confidence intervals for the associations between each REEs and clinical pregnancy, with other elements fixed at their median concentrations. (C) Bivariate exposure–response functions for a kind of REE fixed at either the 25th, 50th, or 75th percentile and the rest of REEs are fixed at the median. (D) Associations between the mixed exposure to REEs and clinical pregnancy. The plot compares the estimated risk change [h(expo)] when all the REEs are at their specific quantile compared to those that are all at their 50th percentile. (E) The weights of REEs in clinical pregnancy based on WQS regression analysis. Models adjusted age, BMI, fertilization mode, infertility type, and smoking statu.
-
In this study, the relationship between the REE concentration in samples from both partners and assisted reproductive outcomes was investigated using a prospective cohort design. We found that after adjusting for factors such as age, BMI, infertility type, fertilization method, and smoking, high concentrations of La in semen may be associated with a decrease in fertilization rate. However, existing levels of rare earth element exposure do not have adverse effects on clinical pregnancies. The elements primarily ingested in daily life are predominantly light REEs[31], which is consistent with the high detection rates of REEs we observed. Previous studies have reported positive correlations among REEsin serum[16,20]. Our research conducted correlation analyses on the detected rare earth elements from three sample sources, revealing significant positive correlations, suggesting similar intake, transport, or metabolic pathways among these elements.
The follicular fluid consists of secretions from follicular cells and blood serum[32]. All REEs in follicular fluid originate from the environment and enter the follicles through the bloodstream. The blood-follicle barrier (BFB), acting as a selective “molecular sieve” between follicles and blood, controls molecular exchange based on size and charge. It is composed of endothelial cells, basement membrane, inner layer, follicle basal membrane, and granular membranes[33,34]. Previous research has indicated that the elemental content in follicular fluid better represents long-term exposure levels[35]. Our study detected rare earth element concentrations in the follicular fluid of the same women and found that the concentrations were significantly lower (La: median 0.016 ng/mL) than those in serum and showed no correlation with the rare earth element concentrations in serum. This suggests that serum levels of REEs do not represent levels in follicular fluid, indicating that these elements may not easily accumulate in the reproductive system. The follicular fluid is a crucial microenvironment during oocyte maturation and development, playing a key role in oocyte quality, subsequent fertilization, and embryo development potential[36]. The direct effect of the follicular fluid environment on oocytes may have a greater impact on assisted reproductive outcomes and related indicators. There have been no previous reports on the detection of REEs in follicular fluid, and our study provides preliminary evidence for the transport and metabolism of REEs in the female reproductive system.
When analyzing the concentrations of REEs in semen samples from male partners undergoing assisted reproduction, we found that an increase in La concentration in semen was associated with a decrease in the fertilization rate, which is consistent with previous results from zebrafish and sea urchin studies[37-39]. Short-term exposure to La (III) (10-4–10-5 mol/L) showed a decrease in the sperm fertilization rate[37-39]. Additionally, a decrease in fertilization rate has been found in sea urchins[37,38], zebrafish[39], and humans[40,41], albeit without inducing embryotoxic effects. Our findings align with those of previous studies, indicating that elevated La exposure is associated with reduced fertilization rates, yet seemingly exerts no significant influence on the likelihood of achieving clinical pregnancy. Previous studies have detected the presence of REEs in semen, with findings indicating that La and Ce concentrations do not affect sperm quality and that there is an association between rare earth element concentrations in semen and Ca2+ concentrations[11]. Some studies have reported that La can compete for binding sites with Ca2+, potentially altering cell function and disrupting mitochondrial membrane potential and electrolyte gradients[42]. Furthermore, after stratifying the study cohort based on the fertilization technique employed (IVF and ICSI) after artificial selection, the relationship between La concentration and fertilization rate was no longer statistically significant in couples using ICSI. ICSI procedures may correct the effect of La on the fertilization rate, suggesting that La may inhibit intracellular Ca2+ influx by competing for binding sites with Ca2+, leading to fertilization failure and decreased fertilization rates.
In the correlation analysis of pregnancy outcomes, only high La exposure in semen was associated with a decrease in the fertilization rate in the univariate analysis, with no statistically significant correlations found between various elements in other samples and clinical pregnancy. Additionally, both the BKMR and WQS analyses revealed no correlation between mixed exposure to REEs in semen and clinical pregnancy. The BKMR mixed exposure analysis found a positive correlation between Pr and clinical pregnancy, whereas Nd showed a negative correlation with clinical pregnancy, suggesting inconsistent effects among elements as a possible reason for the lack of an effect in the mixed exposure analysis. However, mixed exposure in females, whether in the follicular fluid or serum, showed a protective effect on clinical pregnancy. Previous studies have reported that REEs exhibit redox behavior, acting as antioxidants at low concentrations/short exposure times, stimulating or protecting biological processes, whereas at high concentrations and long exposure times, oxidative stress may occur, inducing adverse reactions[43]. This indicates that an increase in rare earth element concentration may cause pregnancy toxicity. However, our results indicated that the currently detected concentrations in both partners did not reach toxic thresholds. Additionally, previous research has reported that high Pr (median 0.030 ng/mL) exposure in the maternal serum may increase the risk of premature rupture of membranes, and high La (median 0.072 ng/mL) exposure may increase the risk of neural tube defects. The detected concentrations of REEs in the serum (Pr: median 0.026 ng/mL; La: median 0.080 ng/mL) in our study were similar to those reported in the literature to affect offspring, suggesting that current rare earth element exposure may not have significant toxic effects on pregnancy but may have adverse effects on offspring, necessitating further follow-up and monitoring.
-
Our study revealed a possible association between high La exposure in semen and a decline in fertilization rates. Our study is the first to report REEs concentrations in follicular fluid; La, Ce, Pr, and Nd were found at significantly lower concentrations than in female serum, suggesting that these four REEs may not accumulate in the reproductive system. However, at the currently detected levels ofREEs exposure, mixed exposure did not exhibit reproductive toxicity.
-
Table S1. Relative risk of the LREE concentrations associated with the clinical pregnancy of IVF-embryo transfer
Elements Sample Model-1a Model-2b OR 95% CI P OR 95% CI P Ce serum 1.11 0.80 1.56 0.53 1.13 0.90 1.43 0.30 follicular fluid 1.02 0.73 1.42 0.92 0.95 0.78 1.14 0.57 seminal plasma 0.93 0.66 1.30 0.66 1.01 0.87 1.17 0.87 La serum 0.92 0.66 1.29 0.63 0.86 0.65 1.14 0.28 follicular fluid 0.96 0.68 1.34 0.81 0.99 0.80 1.22 0.90 seminal plasma 1.09 0.78 1.52 0.63 1.13 0.86 1.47 0.39 Nd serum 0.95 0.68 1.33 0.77 1.02 0.89 1.17 0.79 follicular fluid 0.95 0.68 1.33 0.77 0.93 0.75 1.15 0.52 seminal plasma 1.01 0.72 1.42 0.94 1.09 0.86 1.37 0.48 Pr serum 1.11 0.79 1.56 0.56 1.12 0.89 1.41 0.34 follicular fluid 1.27 0.94 1.72 0.12 1.31 1.00 1.72 0.05 seminal plasma 1.13 0.85 1.52 0.40 1.23 0.92 1.66 0.17 Sm serum 1.17 0.87 1.57 0.29 1.23 0.94 1.61 0.13 Note. aModel-1 uses log-binomial regression without adjusting confounders. bModel-2 uses log-binomial regression with adjusting age, BMI, fertilization mode, infertility type and smoking status. Table S2. Posterior inclusion probabilities (PIPs) for semen concentrations of REEs and clinical pregnancy using BKMR
Elements PIPs La 0.53 Ce 0.37 Pr 0.49 Nd 0.40 Table S3. Concentrations of rare earth elements in previous studies
References Region Sample type (ng/mL) Population Subgroup La Ce Pr Nd Sm This study Beijing, China Serum Women − 0.080
(0.048, 0.124)0.097
(0.061, 0.167)0.026
(0.017, 0.040)0.144
(0.097, 0.199)0.050
(0.031, 0.067)Follicular fluid Women − 0.016
(0.009, 0.027)0.034
(0.020, 0.055)0.009
(0.007, 0.012)0.069
(0.054, 0.101)< MDL
(< MDL, 0.0004)seminal plasma Man − 0.089
(0.054, 0.128)0.246
(0.168, 0.374)0.023
(0.013, 0.036)0.118
(0.080, 0.171)< MDL
(< MDL, 0.0004)[1] Shandong/Beijing,
ChinaSerum Women − 0.035
(0.027, 0.047)0.058
(0.044, 0.094)0.010
(0.008, 0.016)0.051
(0.038, 0.090)− [2] Beijing, China Serum Women − 0.076
(0.054, 0.099)0.137
(0.091, 0.179)0.029
(0.023, 0.035)0.178
(0.134, 0.226)0.123
(0.092, 0.164)[3] Beijing, China Plasma Women First trimester 0.073
(0.059, 0.096)0.121
(0.088, 0.162)0.031
(0.023, 0.039)0.162
(0.114, 0.225)0.047
(0.022, 0.077)Women Third trimester 0.071
(0.054, 0.088)0.103
(0.072, 0.138)0.030
(0.023, 0.039)0.176
(0.116, 0.238)0.053
(0.025, 0.093)[4] Shanxi, China Serum Women Cases 0.072
(0.052, 0.107)0.116
(0.080, 0.233)0.030
(0.023, 0.043)0.212
(0.156, 0.265)0.132
(0.098, 0.173)Controls 0.059
(0.045, 0.083)0.090
(0.063, 0.130)0.028
(0.022, 0.037)0.195
(0.150, 0.252)0.127
(0.096, 0.168)[5] Shanxi, China Serum Women First trimester 0.047
(0.036, 0.061)0.066
(0.049, 0.090)0.020
(0.016, 0.024)0.125
(0.103, 0.155)0.094
(0.076, 0.116)Women Second trimester 0.049
(0.038, 0.066)0.069
(0.056, 0.093)0.021
(0.017, 0.025)0.140
(0.109, 0.173)0.094
(0.078, 0.115)[6] Serbia Plasma Women Beginning of the delivery 0.67 ± 0.24a 0.17 ± 0.12 a 0.25 ± 0.09 a 0.78 ± 0.32 a 0.33 ± 0.16 a Umbilical cord plasm − − 0.091 ± 0.077 a 0.16 ± 0.08 a 0.059 ± 0.028 a 0.16 ± 0.09 a 0.12 ± 0.06 a [7] Hubei, China Urine (ug/g creatinine) Women Before delivery 0.066
(0.027, 0.149)0.065
(0.027, 0.149)0.015
(0.006, 0.036)0.043
(0.021, 0.094)− [8] Hubei, China Urine (ug/g creatinine) Women Before delivery − 0.065
(0.026, 0.151)− − − [9] Shanxi, China Umbilical cord tissue (ng/g) Women Cases 0.70
(0.46, 1.11)6.17
(2.56, 18.71)0.18
(0.10, 0.34)0.56
(0.38, 0.94)0.21
(0.11, 0.70)Controls 0.49
(0.23, 0.93)6.64
(2.28, 17.5)0.14
(0.08, 0.24)0.45
(0.20, 0.82)0.17
(0.04, 0.81)[10] Canary Islands, Spain umbilical cord blood − − 0.01
(0.01, 0.03)0.03
(0.02, 0.06)< MDL
(< MDL, 0.01)0.01
(< MDL, 0.01)< MDL
(< MDL, 0.01)[11]a Bangladesh umbilical cord blood − − 0.056 5.536 0.013 0.039 0.015 [12] Caucasus placental tissues (ng/g) − − 0.41
(0.25, 0.61)0.42
(0.27, 0.80)0.043
(0.029, 0.061)0.135
(0.087, 0.196)0.010
(0.006, 0.020)[12] Henan,
ChinaPlasma Woman and man Exposure
(job)0.138 ± 0.161 0.320 ± 0.350 0.031 ± 0.047 0.056 ± 0.087 0.0167 ± 0.029 Control 0.092 ± 0.115 0.240 ± 0.357 0.016 ± 0.019 0.035 ± 0.061 0.0087 ± 0.013 [13] Poland Semen
(ng/g)Man Control 21.5b
(2.27–269)44.0 b
(4.52–140)− − − Abnormal semen 17.5 b
(2.58–79.0)37.9 b
(4.63–167)− − − [14] Baotou,
ChinaWhole blood Non-pregnant women − 0.854
(0.702, 1.061)1.724
(1.446, 2.498)0.132
(0.110, 0.165)0.839
(0.587, 0.815)− Note. Most of the data are presented as “median (IQR)”. a: Data are presented as “mean ± s”. b: Data are presented as “median (minimum–maximum)”. Table S4. The LOD and detection rate of the rest rare earth elements
Elements Sample Median (IQR) LOD Detection ratio Eu Serum 0.001 (0.001, 0.002) 0.0010 52.5% Follicular fluid 0.002 (0.000, 0.004) 0.0010 63.8% Seminal plasma 0.004 (0.000, 0.007) 0.0010 68.8% Gd Serum 0.004 (0.003, 0.007) 0.0020 75.9% Follicular fluid 0.013 (0.007, 0.020) 0.0020 61.7% Seminal plasma 0.024 (0.014, 0.039) 0.0020 66.0% Tb Serum 0.001 (0.000, 0.001) 0.0004 45.4% Follicular fluid 0.001 (0.000, 0.002) 0.0004 39.7% Seminal plasma 0.002 (0.000, 0.005) 0.0004 73.0% Dy Serum 0.006 (0.001, 0.009) 0.0010 64.5% Follicular fluid 0.008 (0.002, 0.014) 0.0010 53.2% Seminal plasma 0.012 (0.004, 0.025) 0.0010 74.5% Ho Serum 0.002 (0.001, 0.002) 0.0020 55.3% Follicular fluid 0.002 (0.002, 0.005) 0.0020 65.2% Seminal plasma 0.003 (0.002, 0.004) 0.0020 68.8% Er Serum 0.003 (0.001, 0.005) 0.0012 65.2% Follicular fluid 0.004 (0.001, 0.007) 0.0012 70.9% Seminal plasma 0.005 (0.000, 0.011) 0.0012 73.8% Tm Serum 0.000 (0.000, 0.000) 0.0040 33.3% Follicular fluid −0.002 (−0.003, −0.001) 0.0040 0.0% Seminal plasma −0.002 (−0.003, −0.001) 0.0040 2.1% Yb Serum 0.002 (0.001, 0.003) 0.0010 53.9% Follicular fluid 0.001 (−0.001, 0.005) 0.0010 50.4% Seminal plasma 0.001 (−0.001, 0.005) 0.0010 51.1% Lu Serum 0.000 (−0.002, 0.001) 0.0001 30.5% Follicular fluid −0.004 (−0.004, −0.003) 0.0001 1.4% Seminal plasma −0.004 (−0.005, −0.003) 0.0001 5.7% 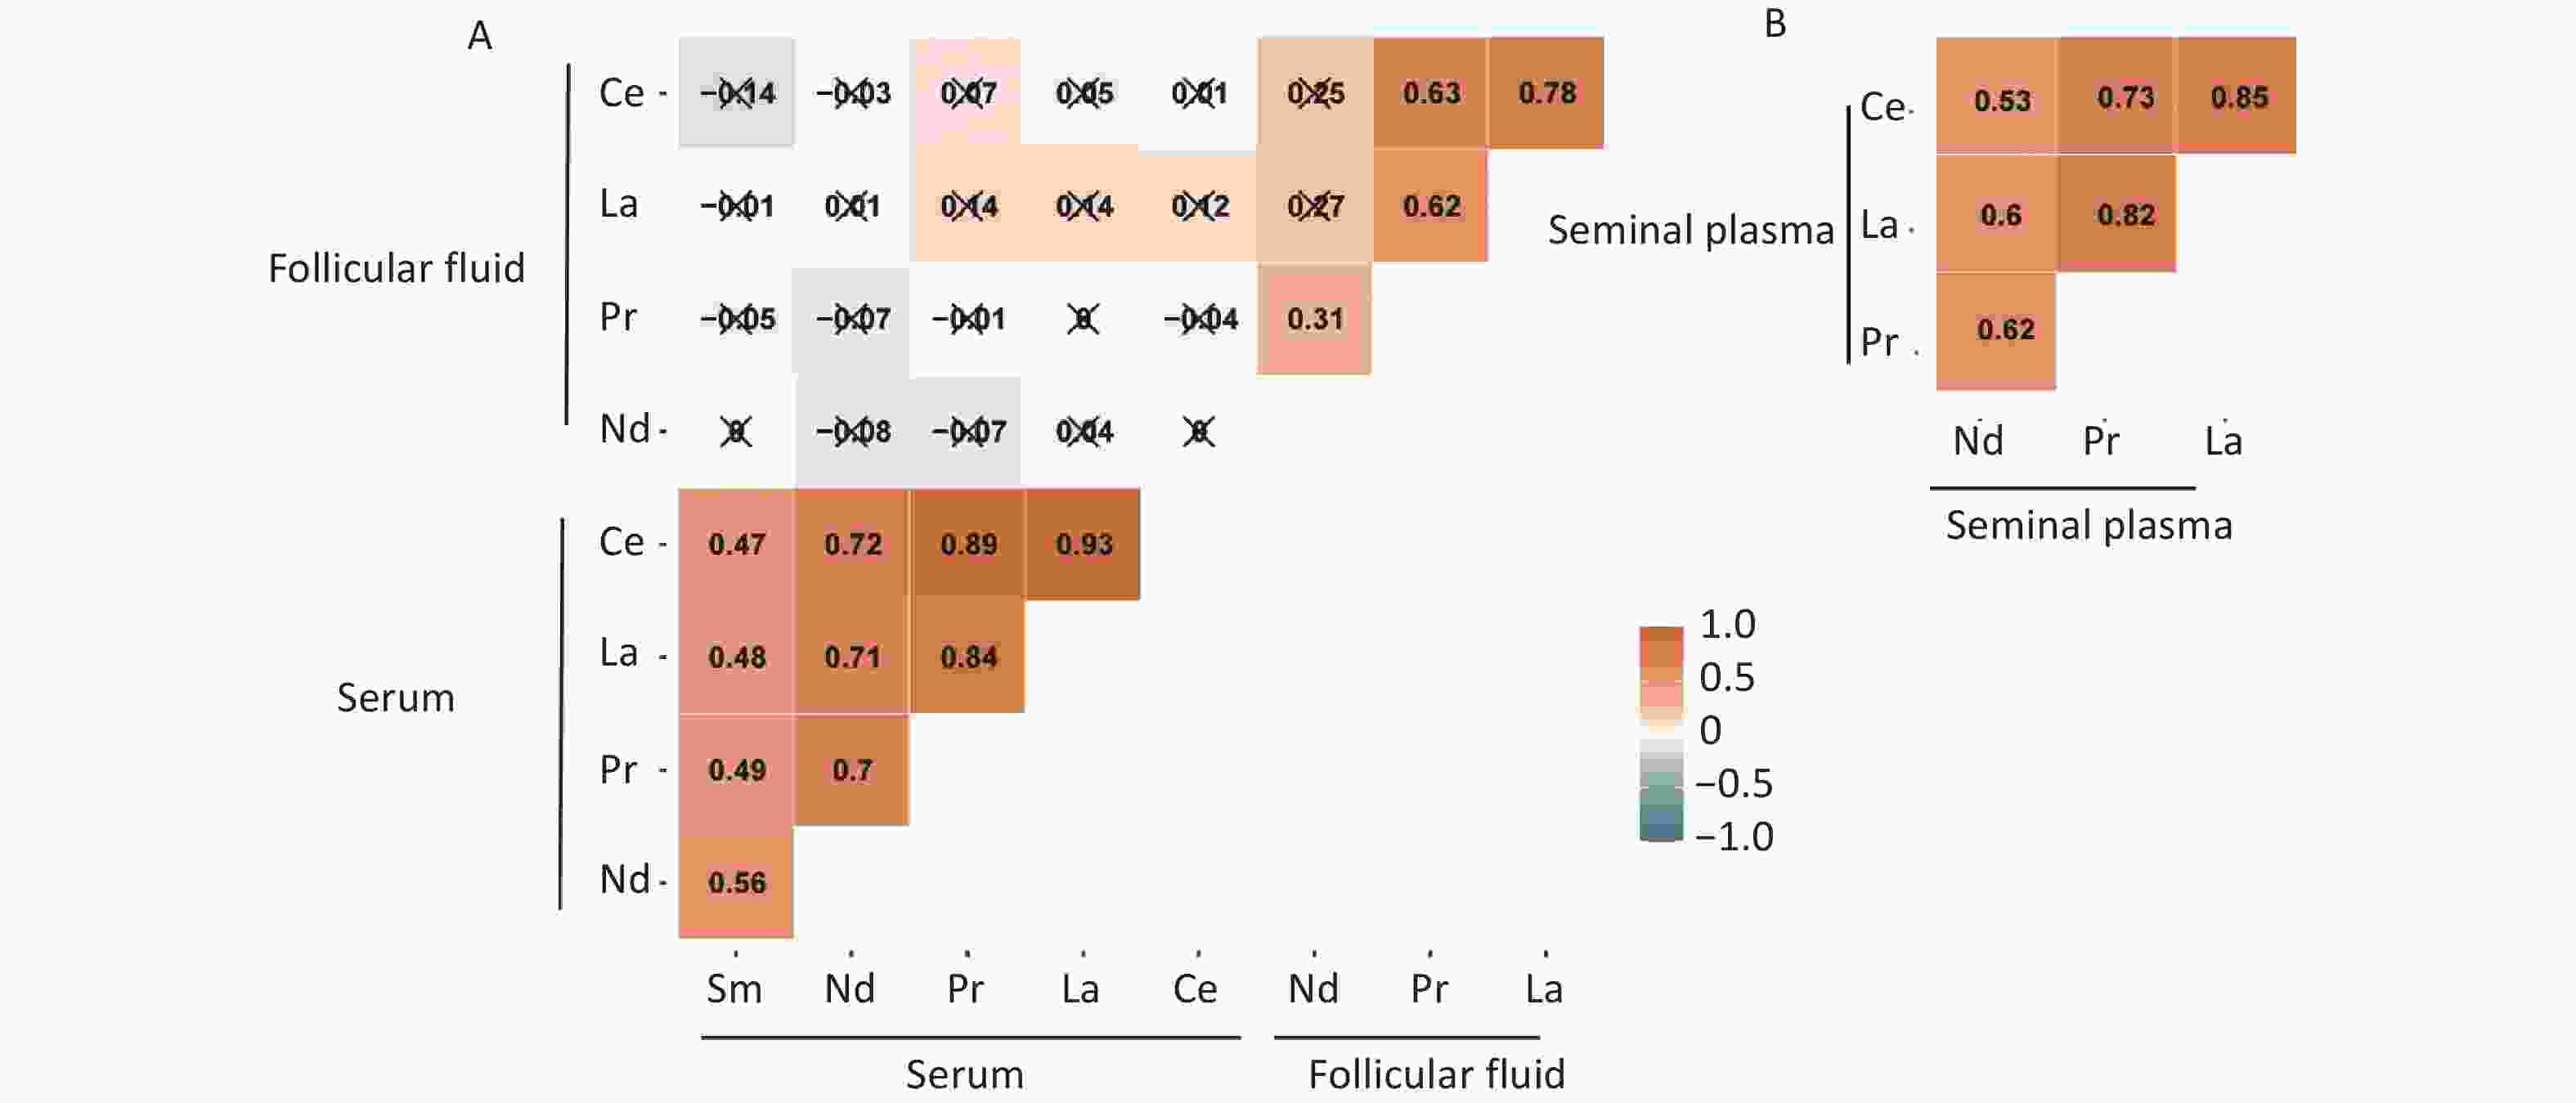
Figure S1. Spearman correlation coefficients for REE concentrations. (A) Spearman correlation coefficients among REEs of serum and follicular fluid. (B) Spearman correlation coefficients among REEs of seminal plasma.
doi: 10.3967/bes2024.123
Association between Exposure of Rare Earth Elements and Outcomes of In Vitro Fertilization-Embryo Transfer in Beijing
-
Abstract:
Objective The study aimed to investigate the impact of rare earth elements (REEs) exposure on pregnancy outcomes of in vitro fertilization-embryo transfer (IVF-ET) by analyzing samples from spouses. Methods A total of 141 couples were included. Blood and follicular fluid from the wives and semen plasma from the husbands, were analyzed for REEs using inductively coupled plasma mass spectrometry (ICP-MS). Spearman’s correlation coefficients and the Mann–Whitney U test were used to assess correlations and compare REE concentrations among three types of samples, respectively. Logistic models were utilized to estimate the individual REE effect on IVF-ET outcomes, while BKMR and WQS models explored the mixture of REE interaction effects on IVF-ET outcomes. Results Higher La concentration in semen (median 0.089 ng/mL, P = 0.03) was associated with a lower fertilization rate. However, this effect was not observed after artificial selection intervention through intracytoplasmic sperm injection (ICSI) (P = 0.27). In semen, the REEs mixture did not exhibit any significant association with clinical pregnancy. Conclusion Our study revealed a potential association between high La exposure in semen and a decline in fertilization rate, but not clinical pregnancy rate. This is the first to report REEs concentrations in follicular fluid with La, Ce, Pr, and Nd found at significantly lower concentrations than in serum, suggesting that these four REEs may not accumulate in the female reproductive system. However, at the current exposure levels, mixed REEs exposure did not exhibit reproductive toxicity. -
Key words:
- Rare earth elements /
- In vitro fertilization /
- Pregnancy outcomes /
- Mixture exposure analysis
&These authors contributed equally to this work.
注释:1) AUTHOR CONTRIBUTIONS: -
Figure 1. Relative risk of LREE concentrations associated with reproductive characteristics in IVF-ET couples. Results of the associations of REE with the number of 2PN, the number of good-quality embryos, fertilization rate, and clinical pregnancy (adjusted by age, BMI, fertilization mode, infertility type, and smoking status). Blue represents a statistically significant negative association; red represents a statistically significant positive association. LREE, light rare earth elements; IVF-ET, in vitro fertilization-embryo transfer; 2PN, two pronuclei.
Figure 2. Mixture exposure analysis of WQS model regression models and BKMR Models for clinical pregnancy in semen. (A) Single REEs association. The plot compares the changes in clinical pregnancy [h(expo)] when the LREE is at its 75th and 25th percentiles, while the other elements are fixed at their 25th, 50th, and 75th percentiles. (B) Univariate exposure-response analysis for the associations between each REE and clinical pregnancy. Univariate exposure-response functions and 95% confidence intervals are calculated for the associations between each REE and clinical pregnancy, with other elements fixed at their median concentrations. (C) Bivariate exposure-response functions for a type of REE were fixed at either the 25th, 50th, or 75th percentile, while the remaining REEs were fixed at the median. (D) Association between mixed REE exposure and clinical pregnancies. The plot compares the estimated risk change [h(expo)] when all REEs are at their specific quantiles to those at their 50th percentile. (E) The weights of REEs in clinical pregnancy based on WQS regression analysis. Models were adjusted for age, BMI, fertilization mode, infertility type, and smoking status. LREE, light rare earth elements.
S2. Mixture exposure analysis of WQS model regression models and BKMR models for clinical pregnancy in serum. (A) Single REEs association. The plot compares the changes in clinical pregnancy [h(expo)] when the LREE is at its 75th vs 25th percentile and other elements are fixed at their 25th, 50th, or 75th percentile, respectively. (B) Univariate exposure-response for the associations between each REEs and clinical pregnancy. Univariate exposure-response function and 95% confidence intervals for the associations between each REEs and clinical pregnancy, with other elements fixed at their median concentrations. (C) Bivariate exposure–response functions for a kind of REE fixed at either the 25th, 50th, or 75th percentile and the rest of REEs are fixed at the median. (D) Associations between the mixed exposure to REEs and clinical pregnancy. The plot compares the estimated risk change [h(expo)] when all the REEs are at their specific quantile compared to those that are all at their 50th percentile. (E) The weights of REEs in clinical pregnancy based on WQS regression analysis. Models adjusted age, BMI, fertilization mode, infertility type, and smoking status.
S3. Mixture exposure analysis of WQS model regression models and BKMR models for clinical pregnancy in follicular fluid. (A) Single REEs association. The plot compares the changes in clinical pregnancy [h(expo)] when the LREE is at its 75th vs 25th percentile and other elements are fixed at their 25th, 50th, or 75th percentile, respectively. (B) Univariate exposure-response for the associations between each REEs and clinical pregnancy. Univariate exposure-response function and 95% confidence intervals for the associations between each REEs and clinical pregnancy, with other elements fixed at their median concentrations. (C) Bivariate exposure–response functions for a kind of REE fixed at either the 25th, 50th, or 75th percentile and the rest of REEs are fixed at the median. (D) Associations between the mixed exposure to REEs and clinical pregnancy. The plot compares the estimated risk change [h(expo)] when all the REEs are at their specific quantile compared to those that are all at their 50th percentile. (E) The weights of REEs in clinical pregnancy based on WQS regression analysis. Models adjusted age, BMI, fertilization mode, infertility type, and smoking statu.
S1. Spearman correlation coefficients for REE concentrations. (A) Spearman correlation coefficients among REEs of serum and follicular fluid. (B) Spearman correlation coefficients among REEs of seminal plasma.
Table 1. The basic demographic and biological characteristics of the couples
Characteristics Females Males Age (years), mean ± SD 32.0 ± 3.1 33.3 ± 4.0 < 35, n (%) 15 (11.0) 98 (69.5) ≥ 35, n (%) 126 (89.0) 43 (30.5) BMI (kg/m2), mean ± SD 23.2 ± 3.7 26.1 ± 5.0 ≤ 25, n (%) 104 (73.8) 62 (46.6) > 25, n (%) 37 (26.2) 71 (53.4) Smoking status, n (%) Smoker 0 52 (37.4) Non-smoker 139 (100.0) 87 (63.6) Infertility type, n (%) Primary infertility 32 (22.7) − Secondary infertility 109 (77.3) − AMH (ng/m), mean ± SD 4.3 ± 3.1 − Basal hormone level, mean ± SD FSH (mIU/mL) 6.3 ± 2.1 − PRL (ng/mL) 14.9 ± 11.1 − LH (mIU/mL) 3.4 ± 2.1 − E2 (pmol/L) 111.9 ± 116.8 − T (nmol/L) 0.8 ± 0.3 − P (ng/mL) 2.8 ± 19.9 − Sperm concentration (× 106/mL), mean ± SD − 47.5 ± 3.5 Progressive motility (%), mean ± SD − 34.0 ± 18.9 Sperm viability (%), mean ± SD − 28.5 ± 17.4 Note. Data was described as n (%) or mean ± SD. SD, standard deviation; BMI, body mass index; IVF, in vitro fertilization; ICSI, intracytoplasmic sperm injection; 2PN, two pronuclei.  下载: 导出CSV
Table 2. The results of IVF and ICSI
Couple/cycle-specific characteristics Couples Fertilization mode, n (%) IVF 93 (66.0) ICSI 48 (34.0) No. of oocytes retrieved, mean ± SD 13.0 ± 7.7 No. of 2PN, mean ± SD 7.8 ± 5.2 No. of good-quality embryos, mean ± SD 5.6 ± 4.3 Fertilization rate (%), mean ± SD 61.2 ± 22.0 IVF outcomes, n (%) HCG test Positive 74 (59.2) Negative 51 (40.8) Clinical pregnancy Yes 57 (47.2) No 64 (52.8) Note. Data was described as n (%) or mean ± SD. SD, standard deviation; IIVF, in vitro fertilization; ICSI, intracytoplasmic sperm injection; 2PN, two pronuclei.
下载: 导出CSV
Table 3. REE concentrations of the IVF-embryo transfer couples
Elements Sample Median (IQR) Mean ± SD LOD Detection ratio (%) Ce (ng/mL) Serum 0.097 (0.061, 0.167) 0.149 ± 0.163 0.0004 100.0 Follicular fluid 0.034 (0.020, 0.05) 0.046 ± 0.044 0.0004 100.0 Seminal plasma 0.246 (0.168, 0.374) 0.289 ± 0.206 0.0004 100.0 La (ng/mL) Serum 0.080 (0.048, 0.124) 0.107 ± 0.097 0.0006 100.0 Follicular fluid 0.016 (0.009, 0.027) 0.022 ± 0.021 0.0006 99.3 Seminal plasma 0.089 (0.054, 0.128) 0.101 ± 0.084 0.0006 97.2 Nd (ng/mL) Serum 0.144 (0.097, 0.199) 0.172 ± 0.119 0.0003 100.0 Follicular fluid 0.069 (0.054, 0.101) 0.076 ± 0.034 0.0003 100.0 Seminal plasma 0.118 (0.080, 0.171) 0.130 ± 0.076 0.0003 100.0 Pr (ng/mL) Serum 0.026 (0.017, 0.040) 0.033 ± 0.026 0.0001 100.0 Follicular fluid 0.009 (0.007, 0.012) 0.010 ± 0.006 0.0001 100.0 Seminal plasma 0.023 (0.013, 0.036) 0.027 ± 0.020 0.0001 100.0 Sm (ng/mL) Serum 0.050 (0.031, 0.06) 0.053 ± 0.030 0.0004 99.3 Note. Data was described as Median (IQR), n (%), or mean ± SD. SD, standard deviation; IQR, interquartile range; LOD, limit of detection. REE, rare earth elements; IVF, in vitro fertilization.
下载: 导出CSV
S1. Relative risk of the LREE concentrations associated with the clinical pregnancy of IVF-embryo transfer
Elements Sample Model-1a Model-2b OR 95% CI P OR 95% CI P Ce serum 1.11 0.80 1.56 0.53 1.13 0.90 1.43 0.30 follicular fluid 1.02 0.73 1.42 0.92 0.95 0.78 1.14 0.57 seminal plasma 0.93 0.66 1.30 0.66 1.01 0.87 1.17 0.87 La serum 0.92 0.66 1.29 0.63 0.86 0.65 1.14 0.28 follicular fluid 0.96 0.68 1.34 0.81 0.99 0.80 1.22 0.90 seminal plasma 1.09 0.78 1.52 0.63 1.13 0.86 1.47 0.39 Nd serum 0.95 0.68 1.33 0.77 1.02 0.89 1.17 0.79 follicular fluid 0.95 0.68 1.33 0.77 0.93 0.75 1.15 0.52 seminal plasma 1.01 0.72 1.42 0.94 1.09 0.86 1.37 0.48 Pr serum 1.11 0.79 1.56 0.56 1.12 0.89 1.41 0.34 follicular fluid 1.27 0.94 1.72 0.12 1.31 1.00 1.72 0.05 seminal plasma 1.13 0.85 1.52 0.40 1.23 0.92 1.66 0.17 Sm serum 1.17 0.87 1.57 0.29 1.23 0.94 1.61 0.13 Note. aModel-1 uses log-binomial regression without adjusting confounders. bModel-2 uses log-binomial regression with adjusting age, BMI, fertilization mode, infertility type and smoking status.
下载: 导出CSV
S2. Posterior inclusion probabilities (PIPs) for semen concentrations of REEs and clinical pregnancy using BKMR
Elements PIPs La 0.53 Ce 0.37 Pr 0.49 Nd 0.40
下载: 导出CSV
S3. Concentrations of rare earth elements in previous studies
References Region Sample type (ng/mL) Population Subgroup La Ce Pr Nd Sm This study Beijing, China Serum Women − 0.080
(0.048, 0.124)0.097
(0.061, 0.167)0.026
(0.017, 0.040)0.144
(0.097, 0.199)0.050
(0.031, 0.067)Follicular fluid Women − 0.016
(0.009, 0.027)0.034
(0.020, 0.055)0.009
(0.007, 0.012)0.069
(0.054, 0.101)< MDL
(< MDL, 0.0004)seminal plasma Man − 0.089
(0.054, 0.128)0.246
(0.168, 0.374)0.023
(0.013, 0.036)0.118
(0.080, 0.171)< MDL
(< MDL, 0.0004)[1] Shandong/Beijing,
ChinaSerum Women − 0.035
(0.027, 0.047)0.058
(0.044, 0.094)0.010
(0.008, 0.016)0.051
(0.038, 0.090)− [2] Beijing, China Serum Women − 0.076
(0.054, 0.099)0.137
(0.091, 0.179)0.029
(0.023, 0.035)0.178
(0.134, 0.226)0.123
(0.092, 0.164)[3] Beijing, China Plasma Women First trimester 0.073
(0.059, 0.096)0.121
(0.088, 0.162)0.031
(0.023, 0.039)0.162
(0.114, 0.225)0.047
(0.022, 0.077)Women Third trimester 0.071
(0.054, 0.088)0.103
(0.072, 0.138)0.030
(0.023, 0.039)0.176
(0.116, 0.238)0.053
(0.025, 0.093)[4] Shanxi, China Serum Women Cases 0.072
(0.052, 0.107)0.116
(0.080, 0.233)0.030
(0.023, 0.043)0.212
(0.156, 0.265)0.132
(0.098, 0.173)Controls 0.059
(0.045, 0.083)0.090
(0.063, 0.130)0.028
(0.022, 0.037)0.195
(0.150, 0.252)0.127
(0.096, 0.168)[5] Shanxi, China Serum Women First trimester 0.047
(0.036, 0.061)0.066
(0.049, 0.090)0.020
(0.016, 0.024)0.125
(0.103, 0.155)0.094
(0.076, 0.116)Women Second trimester 0.049
(0.038, 0.066)0.069
(0.056, 0.093)0.021
(0.017, 0.025)0.140
(0.109, 0.173)0.094
(0.078, 0.115)[6] Serbia Plasma Women Beginning of the delivery 0.67 ± 0.24a 0.17 ± 0.12 a 0.25 ± 0.09 a 0.78 ± 0.32 a 0.33 ± 0.16 a Umbilical cord plasm − − 0.091 ± 0.077 a 0.16 ± 0.08 a 0.059 ± 0.028 a 0.16 ± 0.09 a 0.12 ± 0.06 a [7] Hubei, China Urine (ug/g creatinine) Women Before delivery 0.066
(0.027, 0.149)0.065
(0.027, 0.149)0.015
(0.006, 0.036)0.043
(0.021, 0.094)− [8] Hubei, China Urine (ug/g creatinine) Women Before delivery − 0.065
(0.026, 0.151)− − − [9] Shanxi, China Umbilical cord tissue (ng/g) Women Cases 0.70
(0.46, 1.11)6.17
(2.56, 18.71)0.18
(0.10, 0.34)0.56
(0.38, 0.94)0.21
(0.11, 0.70)Controls 0.49
(0.23, 0.93)6.64
(2.28, 17.5)0.14
(0.08, 0.24)0.45
(0.20, 0.82)0.17
(0.04, 0.81)[10] Canary Islands, Spain umbilical cord blood − − 0.01
(0.01, 0.03)0.03
(0.02, 0.06)< MDL
(< MDL, 0.01)0.01
(< MDL, 0.01)< MDL
(< MDL, 0.01)[11]a Bangladesh umbilical cord blood − − 0.056 5.536 0.013 0.039 0.015 [12] Caucasus placental tissues (ng/g) − − 0.41
(0.25, 0.61)0.42
(0.27, 0.80)0.043
(0.029, 0.061)0.135
(0.087, 0.196)0.010
(0.006, 0.020)[12] Henan,
ChinaPlasma Woman and man Exposure
(job)0.138 ± 0.161 0.320 ± 0.350 0.031 ± 0.047 0.056 ± 0.087 0.0167 ± 0.029 Control 0.092 ± 0.115 0.240 ± 0.357 0.016 ± 0.019 0.035 ± 0.061 0.0087 ± 0.013 [13] Poland Semen
(ng/g)Man Control 21.5b
(2.27–269)44.0 b
(4.52–140)− − − Abnormal semen 17.5 b
(2.58–79.0)37.9 b
(4.63–167)− − − [14] Baotou,
ChinaWhole blood Non-pregnant women − 0.854
(0.702, 1.061)1.724
(1.446, 2.498)0.132
(0.110, 0.165)0.839
(0.587, 0.815)− Note. Most of the data are presented as “median (IQR)”. a: Data are presented as “mean ± s”. b: Data are presented as “median (minimum–maximum)”.
下载: 导出CSV
S4. The LOD and detection rate of the rest rare earth elements
Elements Sample Median (IQR) LOD Detection ratio Eu Serum 0.001 (0.001, 0.002) 0.0010 52.5% Follicular fluid 0.002 (0.000, 0.004) 0.0010 63.8% Seminal plasma 0.004 (0.000, 0.007) 0.0010 68.8% Gd Serum 0.004 (0.003, 0.007) 0.0020 75.9% Follicular fluid 0.013 (0.007, 0.020) 0.0020 61.7% Seminal plasma 0.024 (0.014, 0.039) 0.0020 66.0% Tb Serum 0.001 (0.000, 0.001) 0.0004 45.4% Follicular fluid 0.001 (0.000, 0.002) 0.0004 39.7% Seminal plasma 0.002 (0.000, 0.005) 0.0004 73.0% Dy Serum 0.006 (0.001, 0.009) 0.0010 64.5% Follicular fluid 0.008 (0.002, 0.014) 0.0010 53.2% Seminal plasma 0.012 (0.004, 0.025) 0.0010 74.5% Ho Serum 0.002 (0.001, 0.002) 0.0020 55.3% Follicular fluid 0.002 (0.002, 0.005) 0.0020 65.2% Seminal plasma 0.003 (0.002, 0.004) 0.0020 68.8% Er Serum 0.003 (0.001, 0.005) 0.0012 65.2% Follicular fluid 0.004 (0.001, 0.007) 0.0012 70.9% Seminal plasma 0.005 (0.000, 0.011) 0.0012 73.8% Tm Serum 0.000 (0.000, 0.000) 0.0040 33.3% Follicular fluid −0.002 (−0.003, −0.001) 0.0040 0.0% Seminal plasma −0.002 (−0.003, −0.001) 0.0040 2.1% Yb Serum 0.002 (0.001, 0.003) 0.0010 53.9% Follicular fluid 0.001 (−0.001, 0.005) 0.0010 50.4% Seminal plasma 0.001 (−0.001, 0.005) 0.0010 51.1% Lu Serum 0.000 (−0.002, 0.001) 0.0001 30.5% Follicular fluid −0.004 (−0.004, −0.003) 0.0001 1.4% Seminal plasma −0.004 (−0.005, −0.003) 0.0001 5.7%
下载: 导出CSV
-
[1] Adeel M, Lee JY, Zain M, et al . Cryptic footprints of rare earth elements on natural resources and living organisms. Environ Int,2019 ;127 ,785 −800 .[2] Wei BG, Li YH, Li HR, et al . Rare earth elements in human hair from a mining area of China. Ecotoxicol Environ Saf,2013 ;96 ,118 −23 .[3] Gwenzi W, Mangori L, Danha C, et al . Sources, behaviour, and environmental and human health risks of high-technology rare earth elements as emerging contaminants. Sci Total Environ,2018 ;636 ,299 −313 . doi: 10.1016/j.scitotenv.2018.04.235[4] Gonzalez V, Vignati DAL, Leyval C, et al. Environmental fate and ecotoxicity of lanthanides: are they a uniform group beyond chemistry? Environ Int, 2014; 71, 148-57. [5] Hidayah NN, Abidin SZ . The evolution of mineral processing in extraction of rare earth elements using liquid-liquid extraction: a review. Miner Eng,2018 ;121 ,146 −57 .[6] Pagano G, Aliberti F, Guida M, et al . Rare earth elements in human and animal health: state of art and research priorities. Environ Res,2015 ;142 ,215 −20 .[7] Balaram V . Rare earth elements: a review of applications, occurrence, exploration, analysis, recycling, and environmental impact. Geosci Front,2019 ;10 ,1285 −303 .[8] Migaszewski Z M, Gałuszka A . The characteristics, occurrence, and geochemical behavior of rare earth elements in the environment: a review. Crit Rev Environ Sci Technol,2015 ;45 ,429 −71 .[9] Pagano G, Thomas PJ, Di Nunzio A, et al . Human exposures to rare earth elements: present knowledge and research prospects. Environ Res,2019 ;171 ,493 −500 .[10] Yan Y, Chi HF, Liu JR, et al . Provenance and bioaccessibility of rare earth elements in atmospheric particles in areas impacted by the optoelectronic industry. Environ Pollut,2020 ;263 ,114349 .[11] Marzec-Wróblewska U, Kamiński P, Łakota P, et al . Determination of rare earth elements in human sperm and association with semen quality. Arch Environ Contam Toxicol,2015 ;69 ,191 −201 .[12] Squadrone S, Brizio P, Stella C, et al . Rare earth elements in marine and terrestrial matrices of Northwestern Italy: implications for food safety and human health. Sci Total Environ,2019 ;660 ,1383 −91 .[13] Dai YB, Sun S, Li Y, et al . Residual levels and health risk assessment of rare earth elements in Chinese resident diet: a market-based investigation. Sci Total Environ,2022 ;828 ,154119 .[14] Meryem B, Ji HB, Gao Y, et al . Distribution of rare earth elements in agricultural soil and human body (scalp hair and urine) near smelting and mining areas of Hezhang, China. J Rare Earths,2016 ;34 ,1156 −67 .[15] Rodushkin I, Axelsson MD . Application of double focusing sector field ICP-MS for multielemental characterization of human hair and nails. Part II. A study of the inhabitants of northern Sweden. Sci Total Environ,2000 ;262 ,21 −36 .[16] Bai Y, Long CM, Hu GP, et al . Association of blood chromium and rare earth elements with the risk of DNA damage in chromate exposed population. Environ Toxicol Pharmacol,2019 ;72 ,103237 .[17] Gaman L, Radoi MP, Delia CE, et al . Concentration of heavy metals and rare earth elements in patients with brain tumours: analysis in tumour tissue, non-tumour tissue, and blood. Int J Environ Health Res,2021 ;31 ,741 −54 .[18] Poniedziałek B, Rzymski P, Pięt M, et al . Rare-earth elements in human colostrum milk. Environ Sci Pollut Res,2017 ;24 ,26148 −54 .[19] de Angelis P, Miller RK, Darrah TH, et al . Elemental content of the placenta: a comparison between two high-risk obstetrical populations, adult women carrying multiples and adolescents carrying singletons. Environ Res,2017 ;158 ,553 −65 .[20] Li MS, Zhuang LL, Zhang GH, et al . Association between exposure of light rare earth elements and outcomes of in vitro fertilization-embryo transfer in North China. Sci Total Environ,2021 ;762 ,143106 .[21] Chen J, Xiao HI, Qi T, et al . Rare earths exposure and male infertility: the injury mechanism study of rare earths on male mice and human sperm. Environ Sci Pollut Res,2015 ;22 ,2076 −86 .[22] Adebayo OA, Akinloye O, Adaramoye OA . Cerium oxide nanoparticle elicits oxidative stress, endocrine imbalance and lowers sperm characteristics in testes of balb/c mice. Andrologia,2018 ;50 ,e12920 .[23] Zhu ZY, Shen AY, Shen SD . Effect of rare earth on maturation and parthenogenetic activation of mouse oocytes. J China Public Health,2005 ;21 ,281 −2 . (In Chinese)[24] ChenJX, Wang AL, An H, et al . Association between light rare earth elements in maternal plasma and the risk of spontaneous preterm birth: a nested case-control study from the Beijing birth cohort study. Environ Health,2023 ;22 ,73 . doi: 10.1186/s12940-023-01027-1[25] Dong RH, Zhang H, Zhang MR, et al . Association between phthalate exposure and the use of plastic containers in shanghai adults. Biomed Environ Sci,2017 ;30 ,727 −36 .[26] Liang, Rong, Wang, et al . Correlation between combined urinary metal exposure and grip strength under three statistical models: a cross-sectional study in rural Guangxi. Biomed Environ Sci,2024 ;37 ,3 −18 .[27] Johnson CL, Paulose-Ram R, Ogden CL, et al. National health and nutrition examination survey: analytic guidelines, 1999-2010. Vital Health Stat 2, 2013; 1-24. [28] Evers JL . Female subfertility. Lancet,2002 ;360 ,151 −9 .[29] Maheshwari A, Stofberg L, Bhattacharya S . Effect of overweight and obesity on assisted reproductive technology—a systematic review. Hum Reprod Update,2007 ;13 ,433 −44 . doi: 10.1093/humupd/dmm017[30] Badea M, Luzardo OP, González-Antuña A, et al . Body burden of toxic metals and rare earth elements in non-smokers, cigarette smokers and electronic cigarette users. Environ Res,2018 ;166 ,269 −75 .[31] Egler EG, Niemeyer JC, Correia FV, et al . Effects of rare earth elements (REE) on terrestrial organisms: current status and future directions. Ecotoxicology,2022 ;31 ,689 −99 .[32] Rodgers PJ, Irving-Rodgers HF . Formation of the ovarian follicular antrum and follicular fluid. Biol Reprod,2010 ;82 ,1021 −9 . doi: 10.1095/biolreprod.109.082941[33] Zhou H, Ohno N, Terada N, et al . Involvement of follicular basement membrane and vascular endothelium in blood-follicle barrier formation of mice revealed by 'in vivo cryotechnique'. Reproduction,2007 ;134 ,307 −17 .[34] Shalgi R, Kraicer P, Rimon A, et al . Proteins of human follicular fluid: the blood-follicle barrier. Fertil Steril,1973 ;24 ,429 −34 .[35] Silberstein T, Saphier O, Paz-Tal O, et al . Trace element concentrations in follicular fluid of small follicles differ from those in blood serum, and may represent long-term exposure. Fertil Steril,2009 ;91 ,1771 −4 .[36] Revelli A, Piane LD, Casano S, et al . Follicular fluid content and oocyte quality: from single biochemical markers to metabolomics. Reprod Biol Endocrinol,2009 ;7 ,40 .[37] Oral R, Bustamante P, Warnau M, et al . Cytogenetic and developmental toxicity of cerium and lanthanum to sea urchin embryos. Chemosphere,2010 ;81 ,194 −8 .[38] Trifuoggi M, Pagano G, Guida M, et al . Comparative toxicity of seven rare earth elements in sea urchin early life stages. Environ Sci Pollut Res,2017 ;24 ,20803 −10 .[39] Cui J, Zhang ZY, Bai W, et al . Effects of rare earth elements La and Yb on the morphological and functional development of zebrafish embryos. J Environ Sci,2012 ;24 ,209 −13 .[40] Wei J, Wang CR, Yin SJ, et al . Concentrations of rare earth elements in maternal serum during pregnancy and risk for fetal neural tube defects. Environ Int,2020 ;137 ,105542 .[41] Liu LJ, Wang LL, Ni WL, et al . Rare earth elements in umbilical cord and risk for orofacial clefts. Ecotoxicol Environ Saf,2021 ;207 ,111284 .[42] Hanana H, Kowalczyk J, André C, et al . Insights on the toxicity of selected rare earth elements in rainbow trout hepatocytes. Comp Biochem Physiol C: Toxicol Pharmacol,2021 ;248 ,109097 .[43] Pagano G, Guida M, Tommasi F, et al . Health effects and toxicity mechanisms of rare earth elements—Knowledge gaps and research prospects. Ecotoxicol Environ Saf,2015 ;115 ,40 −8 . -
 24097+Supplementary Materials.pdf

-

 点击查看大图
计量
- 文章访问数: 892
- HTML全文浏览量: 372
- PDF下载量: 78
- 被引次数: 0

 Quick Links