

 下载:
下载:

-
Radon (222Rn) is a radioactive gas generated by the radioactive decay of 238U and 226Ra which exist in rocks, soils, and building materials. Soil gas infiltration is recognized as the most important source of radon in dwellings. However, building materials have become the main source of indoor radon for modern high-rise buildings[1]. Radon is a major source of the ionizing radiation dose received by the general population, accounting for approximately 48% of the annual effective dose[2]. When radon gas is inhaled into the lung, densely ionizing alpha particles emitted by deposited short-lived decay products of radon (218Po and 214Po) could interact with biological tissue and lead to DNA damage, which is generally thought to be related with the cellular mutation and development of cancer[3]. Therefore, exposure to radon and its decay products increases the risk of lung cancer among humans[4-6]. Based on recent pooled studies on indoor radon and lung cancer across Europe, North America, and Asia, the proportion of lung cancers attributable to indoor radon ranges from 3% to 14%. Therefore, WHO has proposed and updated the reference level of indoor radon concentration to be as low as 100 to 300 Bq/m3 since 2009[3]. The International Commission on Radiation Protection (ICRP) and the International Atomic Energy Agency (IAEA) updated their recommendations on radon[7,8]. IAEA Safety Standards make governments responsible for providing information on indoor radon levels and the associated health risks. Therefore radon surveys were started or repeated in many countries, such as European Union members and other countries, in the last years[9].
In China, indoor radon measurement has been conducted since the 1980s. The first nationwide indoor radon survey, covering 26 provinces or cities, was conducted by the former Ministry of Health from 1986 to 1994. The indoor radon level was found to be 23.7 Bq/m3 among 9,967 dwellings[10]. Meanwhile, another nationwide indoor radon survey was conducted by the former Environmental Protection Agency from 1983 to 1990, covering 21 cities, with an indoor radon level of 20.2 Bq/m3 among 1,610 dwellings[11]. From 2001 to 2005, a large-scale indoor radon survey covering 26 cities and 3,098 dwellings was conducted by the Chinese Center for Disease Control and Prevention (CCDC) and reported an average radon level of 43.8 Bq/m3[12]. The increasing trend of indoor radon concentrations has aroused the interest of researchers in indoor radon surveys in China. Thereafter, two regional indoor radon surveys were conducted between 2006 and 2010, and reported radon levels of 32.6 Bq/m3 and 34.9 Bq/m3, respectively[13,14]. However, no large-scale indoor radon survey has been conducted after the 2010s in China. Meanwhile, as the urbanization grows, the number of residential dwellings has greatly increased, and modern high-rise buildings have become prevailing in cities of China. New building materials, building constructions, and energy-saving designs are widely used in modern residential buildings, which may increase indoor radon levels in China. Therefore, it is urgent to carry out a new survey on indoor radon in China.
Study have shown that environmental pollutants, such as tobacco smoke, particulate matter (PM), nitrogen oxides (NOx), radon, etc., all could contribute to lung cancer for humans[15]. Since indoor radon is recognized as the second leading cause of lung cancer after smoking[16], estimating the attributable risk of lung cancer death became essential for assessing its health hazards. Many countries, such as the United States[17], France[18], Canada[19] and Korea[20], have estimated indoor radon risk. In China, some studies have focused on the relationship between indoor radon and lung cancer risk[21,22], but the attributable risk of lung cancer death for indoor radon was only estimated based on regional indoor radon data in recent years[23,24], which could not be generalized to the whole country. Therefore, it is necessary to estimate the attributable risk of lung cancer based on the latest nationwide indoor radon survey in China.
A new nationwide indoor radon survey was conducted in this study, and the lung cancer attributable risk was estimated using the EPA/BEIR-VI model[4], developed by the Committee on the Biological Effects of Ionizing Radiation (BEIR) of the United States and modified by the Environmental Protection Agency (EPA) for risk assessment. This study is expected to provide the current national indoor radon levels and the attributable risk of lung cancer, which can provide a reference for making public health policies in China.
-
In this study, 31 capital cities, covering all provinces in Chinese mainland, were chosen for indoor radon measurements between 2018 and 2023. The sample size for each city was primarily determined by its population, following a proportional guideline of at least 1 per 100 thousand populations. There were at least 40 measurements for the selected cities, which had less population. The population of surveyed cities was more than 240 million, and accounted for 1/7 of the total population in China.
The chosen dwellings predominantly represented multi-story and high-rise residential buildings constructed between the 1960s and 2010s, and 61.6% of the measured dwellings were built after 2010.
The solid-state nuclear track detector (SSNTD) was used for indoor radon measurement. In each dwelling, a single detector was placed in the bedroom or living room, at a distance of at least 20 cm away from the wall, to prevent interference from 220Rn. The measurement period varied from 3 to 6 months for each dwelling. The housing data, including location, building age and floor details, were collected for each dwelling.
-
The LIH radon detector, developed by the National Institute for Radiological Protection (NIRP) of CCDC was used in this study. The construction of the detector has been described in a previous study[25]. CR-39 (Fukuvi Chemical Industry Co., Ltd) was used as the detecting material. It was fixed at the bottom of the chamber. After exposure, CR-39 was etched with 6.25 mol/L NaOH for 8 hours at 80 °C and subsequently analyzed manually using a microscope. The average radon concentration was then calculated using the following Formula 1:
$$ {C}_{{R}_{n}}=\frac{N-{N}_{b}}{F\cdot t} $$ (1) Where CRn is the average radon concentration in Bq/m3, N is the track density after exposure in tracks/cm2, Nb is the track density caused by background in tracks/cm2, F is calibration factor in track/cm2 (Bq/h·m3), and t is sampling duration in h.
The detector was calibrated at the China Institute of Metrology and was used in international intercomparison at the radon chamber of the National Institute of Radiological Sciences (NIRS), Japan. The relative percentage difference (PD) between the measured radon concentrations and the reference values was within a range of 20%. Background measurements were conducted for each batch of detectors. After exposure, the detectors were sealed and returned to the laboratory for etching and analysis as soon as possible.
-
Based on the comprehensive comparison of risk assessment models for radon-induced lung cancer, it was found that among different models, the result of the EPA/BEIR-VI model was closest to the average value, which was conducive to reducing bias[26], which was consistent with a Canadian study[27]. Therefore, in this study, the EPA/BEIR-VI model was selected to estimate the number of lung cancer deaths attributable to indoor radon exposure in China. Mortality data primarily came from tumor registries at the National Cancer Center of China and mortality registration reports were obtained from the CCDC. The smoking rate data were obtained from the 2018 Adult Tobacco Survey conducted by the CCDC, while population data for 2018 were obtained from the National Bureau of Statistics of China.
-
The excess relative risk (ERR) in the calculation of the EPA/BEIR-VI risk model was formulated as follows (Formula 2):
$$ \text{e}\left(\text{a}\right)={\beta }(\text{w}_{5-14}+0.78\text{w}_{15-24}+0.51\text{w}_{25+}){{\phi }}_{\text{age}} ...... $$ (2) Where: a represents age, β represents the parameter denoting the risk increase per unit exposure, with ERR value per working level month (WLM). For smokers, β = 0.069; for non-smokers, β = 0.153. The cumulative exposure W (expressed in WLM) was calculated by weighting three exposure periods: W5−14 for exposure 5–14 years before age a, W15−24 for exposure between 15–24 years before age a, and W25+ for exposure 25 years or more before age a. The assumption in the calculation was that the latent period of radon-induced lung cancer was 5 years, implying that radon exposure within the first 5 years before the onset of lung cancer did not increase the risk. EPA provides a continuous function for $ \varnothing age\left(a\right) $ in risk calculation. Continuous exposure to a radon concentration of 1 Bq/m³ results in an annual exposure of 4.4 × 10⁻³ WLM (assuming 70% occupancy time in indoor residences and a radon equilibrium factor of 0.4)[3].
The radon concentrations from this nationwide survey were categorized into five groups: ≤ 40 Bq/m³, 40–80 Bq/m³, 80–100 Bq/m³, 100–150 Bq/m³, and ≥ 150 Bq/m³. Then, the proportion of dwellings exposed to each concentration and the relative population exposed to different concentrations were calculated. Based on these data, the ERR was estimated for lung cancer attributable risk of indoor radon.
The formula for lung cancer risk calculation is presented in Formula 3:
$$ \begin{aligned} {R}_{e}=& {\sum }_{i=1}^{110}\frac{{h}_{i}(1+{e}_{i})}{{h}_{i}^{*}+{h}_{i}{e}_{i}}{\prod }_{k=1}^{i-1}exp(-({h}_{i}^{*}+{h}_{k}{e}_{k}\left)\right)\\ & \times \left[1-exp(-({h}_{i}^{*}+{h}_{i}{e}_{i}\left)\right)\right] ...... \end{aligned} $$ (3) where Re represents the lifetime risk of lung cancer under specific exposure, $ {h}_{i} $ and $ {h}_{i}^{*} $ denote the lung cancer mortality rate and the overall mortality rate at age a, respectively. $ {e}_{i} $ represents the ERR value induced by exposure to radon and its progeny at age a (given by Formula 2). $ {\prod }_{k=1}^{i-1}exp(-({h}_{i}^{*}+{h}_{k}{e}_{k}\left)\right) $ represents the probability of survival until year i, considering the product of the survival probabilities for each year k from 1 to i-1. $ {\prod }_{k=1}^{i-1}exp(-({h}_{i}^{*}+{h}_{k}{e}_{k}\left)\right)\left[1-exp(-({h}_{i}^{*}+{h}_{i}{e}_{i}\left)\right)\right] $ represents the probability of surviving until i-1 and then dying in the ith year. Following standard literature conventions, the lifelong lung cancer mortality rate was computed using formula 3. Considering $ {e}_{i} $ = 0, then $ {R}_{e} $ is the baseline risk, indicating the lung cancer risk at the background radon concentration level.
Population attributable fraction (PAF) can indicate the degree of hazard that exposure to risk factors poses to the total population, and the extent to which the health hazards to the total population can be reduced after eliminating this exposure. In this study, it was assumed that the PAF of indoor radon-induced lung cancer was equal to the ratio of the number of deaths from indoor radon-induced lung cancer to the total number of deaths from lung cancer. The 95% confidence interval (CI) estimation formula for PAF is given as follows:
$$ \text{PAF} \pm {Z}_{{\alpha}/2}\sqrt{\frac{\text{PAF}(1-\text{PAF})}{n}} $$ (4) -
In total, 3,450 detectors were placed in the survey and approximately 17% of them were missing during measurement. Data on indoor radon concentrations were collected from 2,875 dwellings. The results of indoor radon concentrations from 31 provincial capital cities were shown in Table 1. The overall AM and GM of indoor radon concentrations were respectively 65 Bq/m3 and 55 Bq/m3, ranging from 7 Bq/m3 to 800 Bq/m3. The city of Nanchang showed the highest indoor radon level of 124 Bq/m3, and Haikou had the lowest average indoor radon concentration of 32 Bq/m3.
Table 1. Indoor radon concentrations of 31 cities in China (Bq/m3)
City N AM GM GSD Range Beijing 456 54 48 1.63 13–266 Tianjin 87 53 46 1.69 12–170 Shijiazhuang 114 70 61 1.69 7–315 Taiyuan 58 75 62 1.78 31–301 Hohhot 46 81 67 1.75 29–361 Shenyang 84 86 78 1.51 31–321 Changchun 45 89 55 2.38 12–558 Harbin 73 82 72 1.64 26–312 Shanghai 154 48 41 1.65 7–171 Nanjing 98 51 47 1.48 21–175 Hangzhou 101 82 71 1.65 37–345 Hefei 55 55 48 1.75 8–135 Fuzhou 60 39 34 1.64 11–111 Nanchang 71 124 118 1.42 25–372 Jinan 54 68 48 2.19 9–553 Zhengzhou 117 54 43 1.87 11–245 Wuhan 102 48 42 1.70 12–178 Changsha 92 51 47 1.45 16–123 Guangzhou 162 88 77 1.68 20–364 Nanning 114 43 39 1.50 16–138 Haikou 62 32 30 1.49 14–90 Chongqing 138 56 59 1.35 14–149 Chengdu 59 67 62 1.46 21–169 Guiyang 43 72 63 1.64 24–203 Kunming 86 84 68 1.71 27–800 Lhasa 55 79 63 2.02 13–241 Xi’an 96 77 72 1.43 28–314 Lanzhou 59 81 74 1.52 35–230 Xining 39 89 75 1.78 20–291 Yinchuan 44 59 56 1.42 25–172 Urumqi 51 74 69 1.45 38–214 Note. N, number of samples deployed; AM, arithmetic mean; GM, geometric mean; GSD, geometric standard deviation; Range, min to max range. The frequency distribution of indoor radon concentrations is depicted in Figure 1, exhibiting a log-normal distribution. In total, 13.6% of the measured data exceeded 100 Bq/m3, and 0.6% of the measured data exceeded 300 Bq/m3, which was recommended by the WHO. In comparison, 8.6% and 0.2% of dwellings exceeded 100 Bq/m3 and 300 Bq/m3 in the 2000s survey, respectively. This study indicated a significant increase in the number of dwellings exhibiting elevated indoor radon levels.
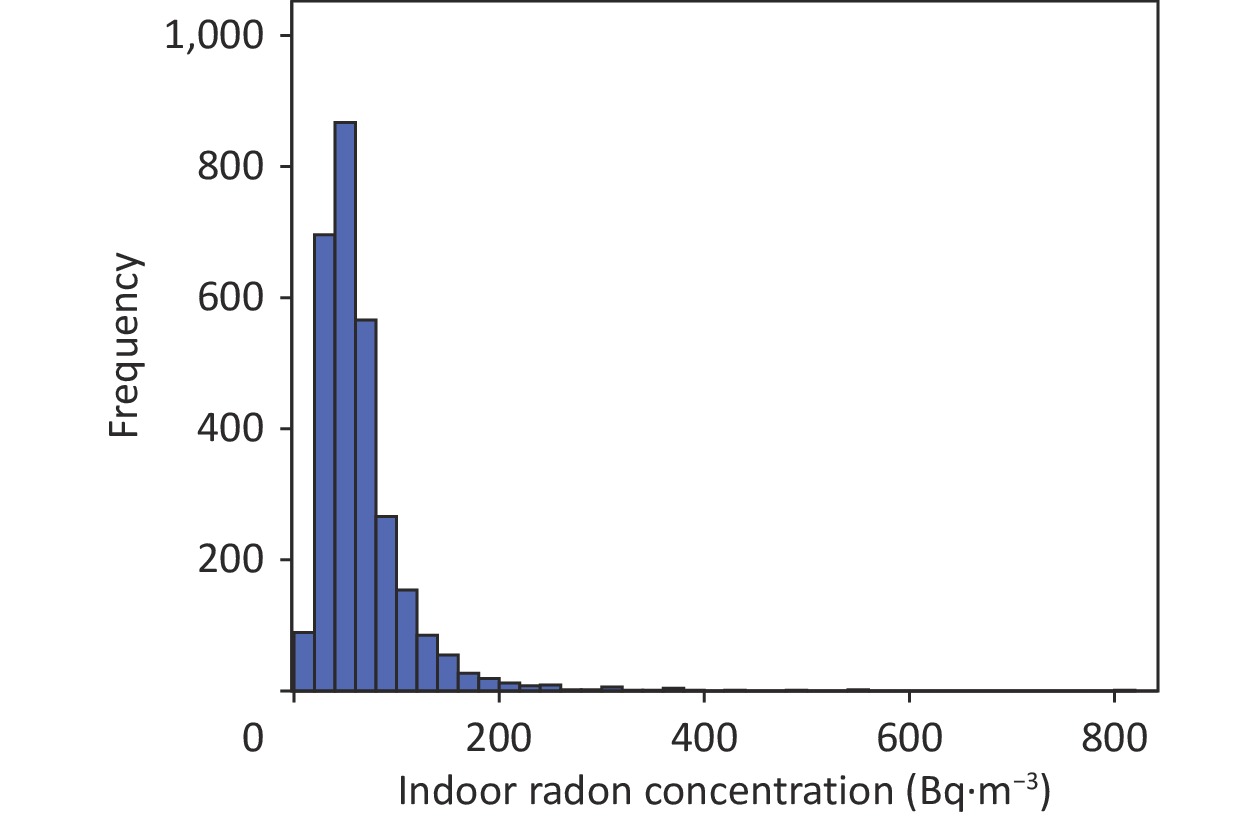
Figure 1. The frequency distribution of indoor radon concentrations.
-
Based on the distribution of radon concentration in this survey, the Chinese population was stratified into groups by gender and smoking status. The indoor radon-induced lung cancer risk and attributable mortality were estimated for each group. Attributable deaths were segmented into 5-year age groups ranging from 15 to 79 years. Those aged 80 years and above were assigned to a separate group. The results were summarized in Table 2.
Table 2. Number of deaths from indoor radon–induced lung cancer in China
Age (year) Male (n) Female (n) Total (n) Non-smoking Smoking Subtotal Non-smoking Smoking Subtotal 15–19 13 13 26 23 0 24 49 20–24 9 59 68 68 5 73 141 25–29 27 183 210 238 9 247 457 30–34 61 379 440 439 35 474 914 35–39 150 994 1,144 1,198 60 1,258 2,401 40–44 290 2,540 2,830 2,933 199 3,132 5,962 45–49 661 6,138 6,799 5,363 656 6,019 12,818 50–54 1,617 12,598 14,215 10,413 1,247 11,660 25,875 55–59 1,502 13,280 14,783 9,749 1,294 11,042 25,825 60–64 1,822 13,244 15,065 9,171 1,698 10,868 25,934 65–69 1,843 10,446 12,289 8,200 1,343 9,543 21,833 70–74 1,673 7,577 9,250 7,191 891 8,082 17,332 75–79 1,131 2,819 3,950 3,340 441 3,781 7,730 ≥ 80 579 844 1,422 2,101 0 2,101 3,524 Total (n) 11,377 71,114 82,491 60,425 7,879 68,304 150,795 Approximately 150,795 people may die from indoor radon-induced lung cancer in China. Among them, 71,114 were smoking males and 11,377 were non-smoking males, indicating that the lung cancer death rate among smoking males was 6.25 times higher than that of non-smoking males. Among females, 7,879 smokers and 60,425 non-smokers died from lung cancer. The lung cancer death rate among non-smoking females was 7.67 times higher than that among smoking females.
-
According to the calculation method for PAF and the 95% CI estimation formula, it was found that nearly 20.30% (95% CI: 20.21%–20.49%) of lung cancer deaths in the Chinese population were attributed to indoor radon exposure. This result was comparable with that found in the previous studies[23,24]. The population-attributable risk in 2016 was estimated to range from 6.66% to 22.42%, with a median of 15.33% for 15 Chinese cities. The variations among the studies were attributed to differences in radon concentrations and other baseline data.
-
This study conducted a new round of nationwide indoor radon survey covering all of the 31 provinces in China from 2018 to 2023. It was the most recent large-scale indoor radon survey in China, and it is essential to estimate the lung cancer risk of the public. The results indicated that the overall AM and GM of indoor radon concentrations in China were 65 Bq/m3 and 55 Bq/m3, respectively. We found indoor radon concentration was the highest in northeastern China, with an AM and GM of 85 Bq/m3 and 71 Bq/m3, respectively, followed by northwest and southwest regions. The high indoor radon concentration in the northeast and northwest regions may be attributed to the extreme cold weather. Longer period of cold days may shorten natural ventilation by opening windows, which may result in elevated indoor radon levels[28]. The higher indoor radon level in the southwest area may be related to the geological background since the highest soil radium content was reported in this region[29]. It indicates that the public should be aware of indoor radon problems in these areas, and measurement of indoor radon levels should be encouraged.
Based on the average radon concentrations in different surveys, it can be inferred that indoor radon concentration markedly increased in China. It increased by approximately 50% compared to that in 2000s[12]. A review[30] of indoor radon concentrations in China over the past 30 years showed that indoor radon concentration was 46.1 Bq/m3 after 2000, indicating 57.0% increase compared to the 1980s. A systematic review[31] of nearly 40 years of indoor radon concentration surveys in China from 1980 to 2019 showed the rapid increase in residential radon concentration. There were two reasons for this trend. On one hand, the wide use of building materials mixed with industrial waste residues in modern high-rise buildings, which have higher radium content compared to soil[32], might have increased radon concentrations in newly constructed dwellings. On the other hand, the energy-saving design in newly constructed buildings also contributed to the increased trend of indoor radon concentrations. The widespread use of energy-saving building designs decreases the air exchange rate, leading to indoor radon accumulation. Increased radon accumulation due to decreased ventilation rate in energy-saving buildings has been reported in other countries, such as Finland[33], Russia[34], Spain[35], and France[36]. This situation deserve more attention.
The indoor radon level was reported in several countries in recent years, such as Canada[37], Austria[38], Bulgaria and Montenegro[39, 40]. The GM of 55 Bq/m3 in this study was in agreement with that of Canada and Montenegro (57 Bq/m3 and 58 Bq/m3, respectively). However, the GM found in this study was much lower than that of Austria and Bulgaria (109 Bq/m3 and 81 Bq/m3 respectively).
After summarizing data on male and female lung cancer deaths due to indoor radon exposure, lung cancer deaths among men were more common than among women. This difference is primarily due to two factors. First, the relative risk of lung cancer subsequent to smoking and radon exposure exhibited a sub-multiplicative relationship in the BEIR VI model. Second, the smoking rate among males was significantly higher than that among females (50.48% vs. 2.07%). However, the proportional relationship between smoking and the risk of radon-induced lung cancer death needs further studies. Smoking is the primary cause of cancer, accounting for 56.8% and 12.5% of male and female cancer patients, respectively[41]. Hence, it is important to investigate how smoking may modify the risks associated with radon exposure. Previous studies have analyzed the specific differences in the attribution of lung cancer mortality between indoor radon exposure alone and smoking combined with indoor radon exposure[42]. These studies used an epidemiological attribution method to calculate attributable deaths for different risk categories based on radon exposure and smoking status. The thresholds of 37 Bq/m3 and 148 Bq/m3 were used for radon exposure, and it was found that lung cancer deaths caused solely by radon exposure accounted for 3% to 5%, while lung cancer deaths caused by smoking combined with radon exposure accounted for approximately 22% (with the total proportion of lung cancer deaths attributable to radon being 25%). Thus, the proportion of lung cancer deaths caused solely by radon exposure may not be very high, but the proportion increases significantly when combined with smoking. This indicates that an important solution for preventing and controlling the health hazards of radon is smoking cessation.
Based on the EPA/BEIR-VI risk model, the PAF of lung cancer deaths caused by indoor radon exposure in China was estimated to be 20.30% (95% CI: 20.21%–20.49%). When comparing our results with those of other studies, it was found that different risk models and inherent parameters, such as indoor radon concentration, population size, smoking prevalence, and lung cancer deaths, lead to different results. A nationwide survey in Canada[27] using the EPA/BEIR-VI risk model and an indoor radon concentration of 41.9 Bq/m3 showed that 16% of lung cancer deaths among Canadians may be attributed to indoor radon exposure. Based on the BEIR-VI (EAC/EAD) risk model, another study from France[18] estimated that 9% to 13% of lung cancer deaths could be attributed to indoor radon exposure when the average indoor radon concentration was 89 Bq/m3. The average radon concentration level in the United States in 1995 was approximately 46 Bq/m3, and the related attributable risk was estimated to be 13.5% using the BEIR-VI (EAC/EAD) risk model[16]. Using the BEIR-VI (EAC/EAD) risk model, the estimated attributable risk was 12.5% to 24.7% in Korea in 2010 when the indoor radon concentration was 62.5 Bq/m3[20]. A retrospective study[43] based on radon concentration survey data from 66 countries estimated the attributable risk of indoor radon-induced lung cancer in China in 2012. With an indoor radon concentration of 34 Bq/m3, the attributable risk was 12.4%–15.9%, based on the BEIR VI (EAC) model and the Hunter model and Cruse model, respectively. Although the results of these studies varied, the attributable risk of lung cancer increased as indoor radon concentrations increased, regardless of the model. The results of this study were comparable to those of the above studies and were consistent with the trend of findings from Canada and Korea.
Reducing indoor radon concentration can be achieved through several methods, which have been analyzed and applied in the context of indoor radon pollution control in China. (a) Natural ventilation: This is considered the most economical and effective method for reducing radon levels. By simply opening windows for 2 to 10 hours, the average reduction rates of radon and its decay products can reach significant levels, with an average reduction rate of 87.7% for radon gas[44]. (b) Air purifiers: While not as effective as natural ventilation for reducing radon gas, air purifiers can significantly decrease the concentrations of attached radon decay products, with a reduction rate of up to 94.5%[44]. (c) Applying radon-resistant materials or sealants to the walls and floors can help to reduce radon levels. (d) Choosing high-quality building materials and paints can prevent radon from seeping through the inner walls of buildings. In China, there has been an increase in indoor radon concentrations, which has increased the need for radon reduction research and practices. The above-mentioned studies and practices have been part of the efforts to address this issue and promote public health. It should be confirmed that effectively reducing indoor radon concentration can lower the risk of lung cancer. To validate this, the estimations were conducted with the same EPA/BEIR VI model and other parameters in this study. If the indoor radon concentration in China decrease to 40 Bq/m³, the PAF of radon-induced lung cancer death can be reduced to 13.3%. If the indoor radon concentration further decrease to 30 Bq/m³, the attributable proportion may decrease to 10.0%. Therefore, more indoor radon mitigation efforts should be implemented to prevent and control this health hazard. In particular, when formulating and issuing public health policies related to indoor radon prevention and control, it is necessary to standardize the quality of building materials, promote the health education of natural ventilation, pay attention to tobacco control, and emphasize the harmful effects of concomitant exposure to indoor radon and smoking.
Frankly speaking, there were still some limitations of this study. Firstly, this nationwide survey mainly focused on the urban residential dwellings of provincial capital cities in China. The results may not be representative of the national level, although the Chinese urbanization rate had exceeded 66% in 2023[45] and no significant differences between radon concentrations in urban and rural areas in China were found in some studies[13]. It is necessary to conduct surveys that are able to reflect the indoor radon concentrations in different living environments of urban and rural areas. Secondly, although the EPA/BEIR VI risk model was optimized, the smoking rate, the amount of smoking, and the risk of lung cancer subsequent to smoking of Chinese citizens may be different from that of American citizens, so the application of EPA/BEIR-VI model originally used in the United States may inevitably bring uncertainties. Thirdly, considering the rapid economic and social development and the rapid population movement among regions in China, it is assumed that the lifetime radon exposure level of the population is constant, which may lead to the uncertainty of the results. In general, the survey data and estimation results of this study provide a valuable reference for the gradual establishment of a more comprehensive indoor radon concentration database and a mature risk estimation model for indoor radon-induced lung cancer.
-
The survey on indoor radon concentrations in modern apartments was conducted across 31 capital cities, covering 31 provinces in China from 2018 to 2023 in this study. It was found an arithmetic mean (AM) indoor radon concentration of 65 Bq/m3. Approximately 13.6% of the measured points exceeded 100 Bq/m3, with 0.6% exceeding 300 Bq/m3. Furthermore, this study estimated the risk of lung cancer deaths attributable to indoor radon exposure using the EPA/BEIR-VI risk model, combined with Chinese lung cancer mortality rates, and other demographic data. In 2018, there were 150,795 lung cancer deaths, and approximately 20.30% of these deaths were attributed to indoor radon exposure. This study provided the latest nationwide data on indoor radon levels and their associated health hazards. Moreover, the findings provided support for further research on estimating and evaluating the disease burden and economic impact of indoor radon exposure in China, which are crucial for making public health policies and raising public awareness about health hazards of indoor radon.
doi: 10.3967/bes2024.165
Indoor Radon Survey in 31 Provincial Capital Cities and Estimation of Lung Cancer Risk in Urban Areas of China
-
Abstract:
Objective We aimed to analyze the current indoor radon level and estimate the population risk of radon-induced lung cancer in urban areas of China. Methods Using the passive monitoring method, a new survey on indoor radon concentrations was conducted in 2,875 dwellings across 31 provincial capital cities in Chinese mainland from 2018 to 2023. The attributable risk of lung cancer induced by indoor radon exposure was estimated based on the risk assessment model. Results The arithmetic mean (AM) and geometric mean (GM) of indoor radon concentrations were 65 Bq/m³ and 55 Bq/m³, respectively, with 13.6% of measured dwellings exceeding 100 Bq/m³ and 0.6% exceeding 300 Bq/m³. The estimated number of lung cancer deaths induced by indoor radon exposure was 150,795, accounting for 20.30% (95% CI: 20.21%–20.49%) of the lung cancer death toll. Conclusion This study provided the most recent data on national indoor radon levels in urban areas and the attributable risk of lung cancer. These results served as an important foundation for further research on the disease burden of indoor radon exposure and radon mitigation efforts. -
Key words:
- Indoor radon /
- Urban /
- Attributable risk /
- Lung cancer
The authors declare that there are no conflicts of interest.
注释:1) AUTHOR CONTRIBUTIONS: 2) CONFLICT OF INTEREST: -
Table 1. Indoor radon concentrations of 31 cities in China (Bq/m3)
City N AM GM GSD Range Beijing 456 54 48 1.63 13–266 Tianjin 87 53 46 1.69 12–170 Shijiazhuang 114 70 61 1.69 7–315 Taiyuan 58 75 62 1.78 31–301 Hohhot 46 81 67 1.75 29–361 Shenyang 84 86 78 1.51 31–321 Changchun 45 89 55 2.38 12–558 Harbin 73 82 72 1.64 26–312 Shanghai 154 48 41 1.65 7–171 Nanjing 98 51 47 1.48 21–175 Hangzhou 101 82 71 1.65 37–345 Hefei 55 55 48 1.75 8–135 Fuzhou 60 39 34 1.64 11–111 Nanchang 71 124 118 1.42 25–372 Jinan 54 68 48 2.19 9–553 Zhengzhou 117 54 43 1.87 11–245 Wuhan 102 48 42 1.70 12–178 Changsha 92 51 47 1.45 16–123 Guangzhou 162 88 77 1.68 20–364 Nanning 114 43 39 1.50 16–138 Haikou 62 32 30 1.49 14–90 Chongqing 138 56 59 1.35 14–149 Chengdu 59 67 62 1.46 21–169 Guiyang 43 72 63 1.64 24–203 Kunming 86 84 68 1.71 27–800 Lhasa 55 79 63 2.02 13–241 Xi’an 96 77 72 1.43 28–314 Lanzhou 59 81 74 1.52 35–230 Xining 39 89 75 1.78 20–291 Yinchuan 44 59 56 1.42 25–172 Urumqi 51 74 69 1.45 38–214 Note. N, number of samples deployed; AM, arithmetic mean; GM, geometric mean; GSD, geometric standard deviation; Range, min to max range.  下载: 导出CSV
Table 2. Number of deaths from indoor radon–induced lung cancer in China
Age (year) Male (n) Female (n) Total (n) Non-smoking Smoking Subtotal Non-smoking Smoking Subtotal 15–19 13 13 26 23 0 24 49 20–24 9 59 68 68 5 73 141 25–29 27 183 210 238 9 247 457 30–34 61 379 440 439 35 474 914 35–39 150 994 1,144 1,198 60 1,258 2,401 40–44 290 2,540 2,830 2,933 199 3,132 5,962 45–49 661 6,138 6,799 5,363 656 6,019 12,818 50–54 1,617 12,598 14,215 10,413 1,247 11,660 25,875 55–59 1,502 13,280 14,783 9,749 1,294 11,042 25,825 60–64 1,822 13,244 15,065 9,171 1,698 10,868 25,934 65–69 1,843 10,446 12,289 8,200 1,343 9,543 21,833 70–74 1,673 7,577 9,250 7,191 891 8,082 17,332 75–79 1,131 2,819 3,950 3,340 441 3,781 7,730 ≥ 80 579 844 1,422 2,101 0 2,101 3,524 Total (n) 11,377 71,114 82,491 60,425 7,879 68,304 150,795
下载: 导出CSV
-
[1] De Jong P, Van Dijk W, van der Graaf ER, et al. National survey on the natural radioactivity and 222Rn exhalation rate of building materials in the Netherlands. Health Phys, 2006; 91, 200−10. doi: 10.1097/01.HP.0000205238.17466.1c [2] United Nations Scientific Committee on the Effects of Atomic Radiation. UNSCEAR 2006 Report Volume II, Annex E—Sources-to-effectsassessment for radon in homes and workplaces. [3] World Health Organization. WHO handbook on indoor radon: a public health perspective. WHO. 2009. [4] United States Environmental Protection Agency. EPA assessment of risks from radon in homes. Office of Radiation and Indoor Air, United States Environmental Protection Agency. 2003. https://www.epa.gov/radiation/epa-assessment-risks-radon-homes. [5] Lubin JH, Wang ZY, Boice Jr JD, et al. Risk of lung cancer and residential radon in China: pooled results of two studies. Int J Cancer, 2004; 109, 132−7. doi: 10.1002/ijc.11683 [6] Darby S, Hill D, Auvinen A, et al. Radon in homes and risk of lung cancer: collaborative analysis of individual data from 13 European case-control studies. BMJ, 2005; 330, 223. doi: 10.1136/bmj.38308.477650.63 [7] International Atomic Energy Agency. Radiation Protection and Safety of Radiation Sources: International Basic Safety Standards, IAEA Safety Standards Series No. GSR Part 3, IAEA, Vienna (2014). https://doi.org/10.61092/iaea.u2pu-60vm. [8] International Commission on Radiological Protection. Radiological protection against radon exposure. ICRP Publication 126. Annals of the ICRP, 2014; 43: 1-77. https://www.icrp.org/publication.asp?id=ICRP%20Publication%20126. [9] Pantelić G, Čeliković I, Živanović M, et al. Qualitative overview of indoor radon surveys in Europe. J Environ Radioact, 2019; 204, 163−74. doi: 10.1016/j.jenvrad.2019.04.010 [10] Cheng JP, Guo QJ, Ren TS. Radon levels in China. J Nucl Sci Technol, 2002; 39, 695−9. doi: 10.1080/18811248.2002.9715251 [11] The Writing Group of the Summary Report on Nationwide Survey of Environmental Radioactivity Level in China. Survey of concentrations of radon and α potential energy of Rn daughter productes in air in some regions of China (1983—1990). Radiat Prot, 1992; 12, 164−71. (In Chinese) [12] Shang B, Cui HX, Wu JH, et al. Study on indoor radon level and influence factor in China[C]. The Second National Seminar on natural radiation irradiation and control. 2005. (In Chinese) [13] Wang CH, Pan ZQ, Liu SL, et al. Investigation on indoor radon levels in some parts of China. Radiat Prot, 2014; 34, 65−73. (In Chinese) doi: 10.1088/0952-4746/34/3/N65 [14] Zhuo WH, Wang XY, Jin Y. The level of indoor 222Rn concentrations in 9 cities of China. In: Proceedings of the Third National Conference on Natural Radiation and Control. [15] Vineis P, Hoek G, Krzyzanowski M, et al. Air pollution and risk of lung cancer in a prospective study in Europe. Int J Cancer, 2006; 119, 169−74. doi: 10.1002/ijc.21801 [16] Smith H. Lung cancer risk from indoor exposure to radon daughters. Radiology, 1988; 167, 580. [17] National Research Council (US) Committee on Health Risks of Exposure to Radon (BEIR VI). Health effects of exposure to radon: BEIR VI. National Academies Press. 1999. [18] Catelinois O, Rogel A, Laurier D, et al. Lung cancer attributable to indoor radon exposure in France: impact of the risk models and uncertainty analysis. Environ Health Perspect, 2006; 114, 1361−6. doi: 10.1289/ehp.9070 [19] Chen J, Moir D, Whyte J. Canadian population risk of radon induced lung cancer: a re-assessment based on the recent cross-Canada radon survey. Radiat Prot Dosimetry, 2012; 152, 9−13. doi: 10.1093/rpd/ncs147 [20] Kim SH, Koh SB, Lee CM, et al. Indoor radon and lung cancer: estimation of attributable risk, disease burden, and effects of mitigation. Yonsei Med J, 2018; 59, 1123−30. doi: 10.3349/ymj.2018.59.9.1123 [21] Wang ZY, Cao JS, Cui HX. Relative risk of lung cancer from radon. Chin J Radiol Med Prot, 2001; 21, 395−6. (In Chinese) [22] Sun QF, Tokonami S, Hou CS, et al. Concentrations of indoor radon and thoron in cave-dwellings with discussions on risk estimation of lung cancer. Chin J Radiol Med Prot, 2015; 25, 1−5. (In Chinese) [23] Miao XX, Su YP, Zhuo WH, et al. Risk estimation for lung cancer caused by indoor radon exposure in China based on EPA/BEIR-VI model. Chin J Radiol Med Prot, 2022; 42, 45−9. (In Chinese) [24] Qiang ZQ, Yao YP, Li ZL, et al. Risk assessment of lung cancer caused by indoor radon exposure in China during 2006-2016: a multicity, longitudinal analysis. Indoor Air, 2023; 2023, 6943333. [25] Wu YY, Sun H, Liu D, et al. Levels and distribution of indoor radon concentrations in Shenzhen, China. Chin J Radiol Med Prot, 2016; 36, 513−6. (In Chinese) [26] Qiang ZQ, Chen B, Zhuo WH. Risk assessment models of radon-induced lung cancer and their preliminary application. Chin J Radiol Med Prot, 2022; 42, 315−20. (In Chinese) [27] Chen J. Lifetime lung cancer risks associated with indoor radon exposure based on various radon risk models for Canadian population. Radiat Prot Dosimetry, 2017; 173, 252−8. doi: 10.1093/rpd/ncw297 [28] Wu YY, Zhang QZ, Song YC, et al. Impact of energy-saving design of residential buildings on both indoor radon concentration and air exchange rate in severe-cold areas and cold areas. Chin J Radiol Med Prot, 2020; 40, 945−50. (In Chinese) [29] Zhuo WH, Chen B, Li DH, et al. Reconstruction of database on natural radionuclide contents in soil in China. J Nucl Sci Technol, 2008; 45, 180−4. doi: 10.1080/00223131.2008.10876003 [30] Lu ZJ, Tu Y, Yu RS. The changes of radon concentration indoor and outdoor in the late three decades in China. Chin J Radiol Health, 2010; 19, 118−21. (In Chinese) [31] Yao YP, Chen B, Zhuo WH. Reanalysis of residential radon surveys in China from 1980 to 2019. Sci Total Environ, 2021; 757, 143767. doi: 10.1016/j.scitotenv.2020.143767 [32] Zhao JF. Indoor radon concentrations and radon exhalation rates of building materials in Shanghai. Fudan University. 2009. (In Chinese) [33] Arvela H, Holmgren O, Reisbacka H, et al. Review of low-energy construction, air tightness, ventilation strategies and indoor radon: results from Finnish houses and apartments. Radiat Prot Dosimetry, 2014; 162, 351−63. doi: 10.1093/rpd/nct278 [34] Vasilyev AV, Yarmoshenko IV, Zhukovsky MV. Low air exchange rate causes high indoor radon concentration in energy-efficient buildings. Radiat Prot Dosimetry, 2015; 164, 601−5. doi: 10.1093/rpd/ncv319 [35] Baeza A, García-Paniagua J, Guillén J, et al. Influence of architectural style on indoor radon concentration in a radon prone area: a case study. Sci Total Environ, 2018; 610-611, 258-66. [36] Collignan B, Powaga E. Impact of ventilation systems and energy savings in a building on the mechanisms governing the indoor radon activity concentration. J Environ Radioact, 2019; 196, 268−73. doi: 10.1016/j.jenvrad.2017.11.023 [37] Chen J. A summary of residential radon surveys and the influence of housing characteristics on indoor radon levels in Canada. Health Phys, 2021; 121, 574−80. doi: 10.1097/HP.0000000000001469 [38] Gruber V, Baumann S, Wurm G, et al. The new Austrian indoor radon survey (ÖNRAP 2, 2013-2019): design, implementation, results. J Environ Radioact, 2021; 233, 106618. doi: 10.1016/j.jenvrad.2021.106618 [39] Ivanova K, Stojanovska Z, Kunovska B, et al. Analysis of the spatial variation of indoor radon concentrations (national survey in Bulgaria). Environ Sci Pollut Res Int, 2019; 26, 6971−9. doi: 10.1007/s11356-019-04163-9 [40] Vukotic P, Antovic N, Zekic R, et al. Main findings from radon indoor survey in Montenegro. Radiat Prot Dosimetry, 2019; 185, 355−70. [41] National Health Commission of China. China reported health hazards of smoking. People's Medical Publishing House. 2020. (In Chinese) [42] Pérez-Ríos M, Barros-Dios JM, Montes-Martínez A, et al. Attributable mortality to radon exposure in Galicia, Spain. Is it necessary to act in the face of this health problem? BMC Public Health, 2010; 10, 256. [43] Gaskin J, Coyle D, Whyte J, et al. Global estimate of lung cancer mortality attributable to residential radon. Environ Health Perspect, 2018; 126, 057009. doi: 10.1289/EHP2503 [44] Kou SS, Wu YY, Song YC, et al. Application and analysis of radon-reduction methods in indoor radon pollution control. Chin J Radiol Health, 2022; 31, 149−52. (In Chinese) [45] National Bureau of Statistics. Statistical Bulletin of the People's Republic of China on national economic and social development for 2023. National Bureau of Statistics. 2024. (In Chinese) -

 点击查看大图

图(1) / 表ll (2)
计量
- 文章访问数: 1570
- HTML全文浏览量: 709
- PDF下载量: 56
- 被引次数: 0

 Quick Links