

 下载:
下载:

-
Perfluoroalkyl and polyfluoroalkyl substances (PFASs) are a class of chemicals composed of fluorinated alkyl chains and a polar head group[1]. They are widely used in industry and consumer products because of their excellent thermal stability[2]. Humans can be exposed to them in a variety of ways, such as air, dust, diet, and drinking water[3-5]. PFASs, as typical endocrine disrupting chemicals (EDCs), can have various negative effects on human health, including diabetes, cardiovascular diseases and metabolic dysregulation[6-9]. Different PFASs may exert diverse toxic effects on human health, probably caused by differences in chemical structure, carbon atom length, and functional groups between different PFASs[10,11]. Therefore, it is necessary to consider the structural characteristics of various PFASs to accurately assess their effects on human and environmental health[12].
An estimated 603.7 million adults are obese, according to the Global Burden of Disease Obesity Collaboration. Additionally, almost 40% of Americans are obese, according to a nationally representative survey[13,14]. Obesity poses a major burden on health and is associated with a greater incidence of chronic disorders[15,16]. Susceptibility to obesity-related diseases depends largely on specific differences in body fat composition[17]. Unlike body mass index (BMI), which fails to identify individuals with excess visceral fat/heterotopic fat, fat distribution has become an important predictor of the risk of obesity-related diseases[17]. Specific regional fat accumulation, especially in the central abdomen, increases the risk of metabolic and cardiovascular diseases and even death[18]. Therefore, as a potent risk factor for the development of obesity and cardiovascular diseases, abdominal fat distribution is more worthy of study as an intermediate variable in the risk of metabolic diseases caused by PFASs.
A number of studies have examined the associations between PFASs and body fat distribution. Children with relatively high levels of perfluorooctane sulfonate (PFOS) and perfluorohexane sulfonate (PFHxS) presented relatively small increases in total fat and trunk fat mass, especially in subcutaneous fat mass[19]. A prospective cohort study of a population at high risk for diabetes revealed a positive association between various plasma PFAS concentrations and a greater sum of skinfold thickness, subcutaneous fat and visceral fat[20]. However, these two studies focused only on the effects of individual PFASs on adiposity. Humans are exposed to multiple PFASs from different sources in the natural environment, and PFAS exposure varies significantly among populations in different regions. In this study, we focused on the dose-response relationships between PFAS congeners of different structures and fat distributions and explored the possible toxic effects of single PFAS exposure, the trait spectrum exposure pattern of PFASs, and different structural-based PFAS exposures on regional fat accumulation.
-
The National Health and Nutrition Examination Survey (NHANES) is a survey conducted by the National Center for Health Statistics (NCHS) to evaluate the health and nutritional status of the civilian noninstitutionalized U.S. population. The survey consists of interviews with household members, standardized physical examinations, and the collection of medical histories and biological samples. All participants under the age of 18 years provided written approval from their parents or guardians. The current study used continuous NHANES data from four cycles from 2011 to 2018. The study sample was limited to adults (20–59 years) with dual-emission X-ray absorptiometry (DXA) measurement information (n = 4,362).
-
We detected 16 PFASs in the serum samples from the participants: perfluorooctanoic acid (PFOA), PFOS, 2-(N-ethyl-perfluorooctane sulfonamido) acetic acid (Et-PFOSA-AcOH), perfluorooctane sulfonamide (PFOSA), PFHxS, 2-(N-methylperfluoroctanesulfonamido) acetic acid (Me-PFOSA-AcOH), perfluorodecanoic acid (PFDeA), perfluorononanoic acid (PFNA), perfluoroundecanoic acid (PFUA), linear perfluorooctanoate (n-PFOA), branch perfluorooctanoic acid isomers (Sb-PFOA), linear perfluorooctane sulfonate (n-PFOS), monomethyl branched isomers of PFOS (Sm-PFOS), perfluorobutane sulfonic acid (PFBuS), perfluoroheptanoic acid (PFHpA), and perfluorododecanoic acid (PFDoA). The concentrations of PFAS were measured in blood samples collected during the medical examination. PFASs were quantified in serum via solid-phase extraction-high-performance liquid chromatography-turbo-ion spray ionization-tandem mass spectrometry (SPE-HPLC-TCI-MS/MS)[21]. Eight PFASs (PFOA, PFOS, PFHxS, PFDeA, PFNA, n-PFOA, n-PFOS, and Sm-PFOS) were detected in at least 79% of the samples and were retained in subsequent analyses. The chemical information, structures, and distributions of these PFASs are shown in Supplementary Tables S1–S2 (available in www.besjournal.com). Samples with PFAS concentrations below the limit of detection (LOD) were assigned a value equal to the LOD divided by the square root of 2.
Table S1. Chemical information and structures of PFAS
Chemical Category Carbon number Molecular formula PFOA, Perfluorooctanoic acid long−chain PFCAs 8 C8HF15O2 PFOS, Perfluorooctanesulfonic acid long−chain PFSAs 8 C8HF17O3S PFHxS, Perfluorohexane sulfonic acid short−chain PFSAs 6 C6HF13O3S PFDeA, Perfluorodecanoic acid long−chain PFCAs 10 C10HF19O2 PFNA, Perfluorononanoic acid long−chain PFCAs 9 C9HF17O2 n-PFOA, linear perfluorooctanoate long−chain PFCAs 8 C8HF15O2 n-PFOS, linear perfluorooctane sulfonate long−chain PFSAs 8 C8HF17O3S Sm-PFOS, monomethyl branched isomers of PFOS long−chain PFSAs 8 C8HF17O3S Table S2. Distributions of concentrations of serum PFAS in the study population
Chemicals Detection rate GM Mean Percentile 25th Percentile 50th Percentile 75th Percentile PFOA 99.53% 1.88 2.35 1.32 2.01 2.76 PFOS 99.55% 5.89 8.39 3.67 6.25 10.05 Et-PFOSA−AcOH 5.71% 0.10 0.11 0.10 0.10 0.10 PFOSA 0.77% 0.10 0.10 0.10 0.10 0.10 PFHxS 98.46% 1.02 1.57 0.60 1.10 1.88 Me-PFOSAAcOH 42.89% 0.14 0.18 0.10 0.10 0.19 PFDeA 79.09% 0.20 0.30 0.10 0.20 0.30 PFNA 96.81% 0.59 0.79 0.40 0.60 0.96 PFUA 52.71% 0.15 0.23 0.10 0.10 0.20 n-PFOA 99.29% 1.23 1.63 0.80 1.30 2.00 Sb-PFOA 5.15% 0.10 0.10 0.10 0.10 0.10 n-PFOS 99.48% 2.82 4.22 2.80 4.80 6.10 Sm-PFOS 98.68% 1.08 1.52 0.60 1.10 2.00 PFBuS 0.67% 0.10 0.10 0.10 0.10 0.10 PFHpA 11.22% 0.11 0.11 0.10 0.10 0.10 PFDoA 14.87% 0.11 0.11 0.10 0.10 0.10 -
From 2011–2018, whole-body and android and gynoid (A/G) region DXA scans were acquired with Hologic Discovery A densitometers (Hologic, Inc.), reviewed and analyzed via Hologic APEX version software with the NHANES Body Composition Analysis option. This study included six major fat distribution variables: trunk fat mass (TR), android fat mass (AN), gynoid fat mass (GY), subcutaneous fat mass (SA), total abdominal fat mass (TA) and visceral adipose tissue mass (VFA). The visualization of fat composition is shown in Supplementary Figure S1, available at www.besjournal.com. Moreover, given that the android to gynoid fat ratio (A/G ratio) is a good predictor of several diseases, we also included it in our analysis[22].
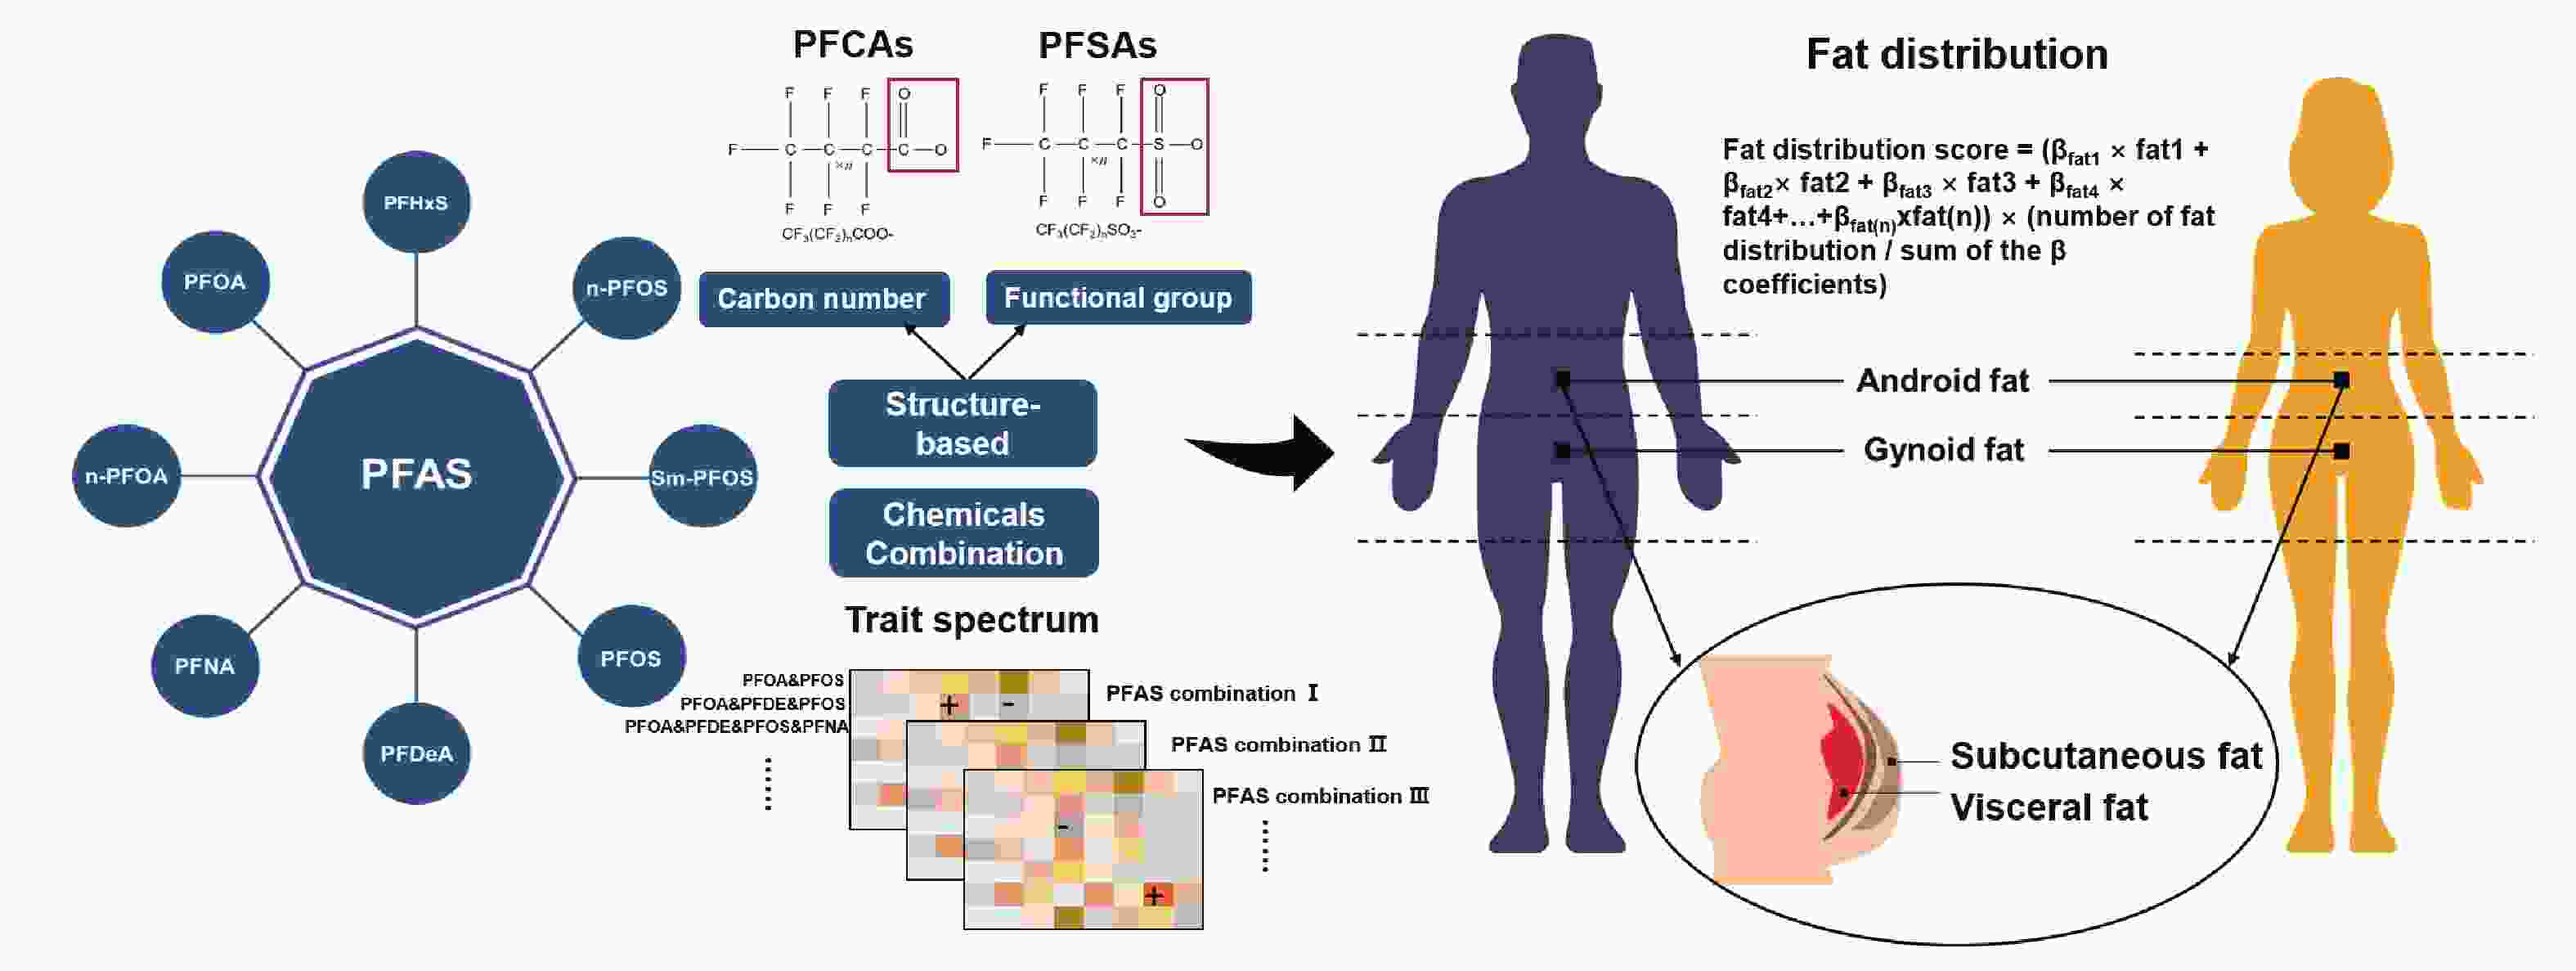
Figure S1. Study design overview.
-
The NHANES collected data on potential confounding variables that might be connected to changes in PFAS concentrations through questionnaires. The variables included race/ethnicity (Mexican American, other Hispanic, non-Hispanic white, non-Hispanic black, other races), household income-to-poverty ratio (< 1.30, 1.30–3.49, > 3.50), physical activity (1–2 times/week, ≥ 3 times/week), smoking status (never smoker, former smoker, current smoker), drinking status (drinker, nondrinker), BMI (< 25.0, 25.0–29.9, > 30.0 kg/m2), waist circumference and high-density lipoprotein (HDL).
-
For the analyses, we applied the primary sampling unit, strata, and weights calculated using the four sampling cycles (2011–2018 cycles) according to the NHANES analytic and reporting guidelines. We stratified all analyses by age and sex group, 20–39 years/39–59 years and female/male subgroups, since previous studies have reported that age-specific and sex-specific differences in fat distribution exist[23,24]. The demographic characteristics are presented as the means ± standard deviations (SDs) or n (%). We compared the demographic characteristics of individuals in the age-specific and sex-specific subgroups by using the chi-square test to compare categorical variables and analysis of variance to compare continuous variables.
Relationships of log-transformed PFAS concentrations with fat distribution and composition were examined by multiple linear regression models to calculate beta values (β) as model regression coefficients and 95% confidence intervals (95% CI). Model 1 was crude (unadjusted), and Model 2 included race, PIR, physical activity, smoking status, and drinking status. Model 3 was further adjusted for BMI, waist circumference and HDL level. Missing covariate values were substituted with median values[25]. The potential effect of the PFAS concentration on the A/G ratio was also evaluated. We created a fat depot score by summing the concentrations of PFASs in 6 regional fat depots, weighted by the multivariable-adjusted risk estimates (β coefficients) caused by PFASs in the present analysis to capture the joint effect of regional fat depots on PFASs. All of the models were fully adjusted for confounders. Moreover, we explored the associations between tertiles of different distributions of body fat and PFASs in subgroups whose BMIs were < 25.0 kg/m2.
Moreover, we classified PFAS congeners on the basis of the structural characteristics of specific PFASs to examine the structure-specific associations between PFASs and fat distribution: a) branched and linear isomers; b) different carbon chain lengths; and c) different functional head groups. We constructed the following summary measures: short-chain perfluoroalkyl carboxylates (PFCAs)/perfluoroalkyl sulfonates (PFSAs), long-chain PFCAs/PFSAs, and total PFCAs/PFSAs. The associations between structurally grouped PFASs and fat distribution were also explored. Considering the complexity of mixed exposure to chemicals in the human body, we explored the potential toxicity of different combinations of PFAS exposures on fat distribution, including 2 PFAS combinations, 3 PFAS combinations, 4 PFAS combinations, 5 PFAS combinations and 6 PFAS combinations. An interaction analysis of PFAS and stratification variables (physical activity, BMI, PIR, smoking status and drinking status) was conducted on the fat distribution. The dose‒response relationship between PFAS exposure and fat distribution was fitted by a cubic spline, and 4 knots were set in the models.
In addition, we estimated the ability of PFAS exposure to predict the risk of obesity (BMI > 30.0 kg/m2). To build and evaluate the prediction model, we randomly assigned the participants to the training set and the test set at a ratio of 7:3. The factors were selected to establish the conventional model according to the results of single-factor regression, including marital status, PIR, smoking status, drinking status, waist circumference, diastolic blood pressure (DBP), HDL, direct HDL-C, total cholesterol, glycohemoglobin (%), insulin, and the insulin resistance index (HOMA-IR). Insulin resistance was estimated by HOMA-IR via the following equation: HOMA-IR = fasting insulin (μIU/mL) × fasting glucose (mmol/L)/22.5[26].
We attempted different combinations (conventional model plus single PFAS exposure) to determine which combination could improve the discriminative ability of the model. The evaluation results in the hold-out testing sets, including areas under the receiver operating characteristic curve (AUCs) of the receiver operating characteristic (ROC) curve, were calculated. The discriminative abilities of the models were assessed using the AUC, and improvements in subject risk.
Additionally, we performed sensitivity analyses to test whether the correlation between PFASs and fat distribution was robust. Concentrations of PFASs more than three times the 75th percentile were removed[12]. We also conducted sensitivity analyses by adjusting for low-density lipoprotein (LDL). All analyses were performed with R (version 4.0.4). To be considered statistically significant, we required a two-tailed P value of less than 0.05.
-
The study was carried out in compliance with the Declaration of Helsinki. Ethical review and approval were not required for this study, as it involved the use of publicly available data and did not qualify as human subject research in the United States.
-
The demographic characteristics of the study population are shown in Supplementary Table S3 (available in www.besjournal.com). Our cohort included 4,362 individuals, including 2,276 (52.2%) females and 2,086 (47.8%) males. We divided the population into four groups by age and sex (males aged 20–39 years and 39–59 years, females aged 20-39 years and 39–59 years). The majority of the participants were non-Hispanic white (33.7%). We observed significant differences in BMI, education, marital status, family, the income‒to‒poverty ratio, physical activity, smoking status and drinking status among the four groups. Moreover, we also analyzed the age-specific and sex-specific distributions of the concentrations of serum PFASs in the study population (Supplementary Table S4, available in www.besjournal.com). PFAS exposure was significantly greater in males than in females, whereas PFAS levels were greater in the 39–59-year-old age group than in the 20–39-year-old age group since PFAS may accumulate.
Table S3. Demographic characteristics of the study population.
Characteristic Male Female P value 20−39 39−59 20−39 39−59 (N = 1,019) (N = 1,067) (N = 1,083) (N = 1,193) Age, mean, y 28.99 (5.56) 48.93 (6.02) 28.93 (5.49) 48.86 (6.00) < 0.001 BMI 28.63 (6.81) 29.18 (5.95) 28.99 (8.28) 30.60 (8.33) < 0.001 BMI < 0.001 < 25.0 153 (33.8%) 119 (22.5%) 180 (37.3%) 146 (27.0%) 25.0−29.9 143 (31.6%) 208 (39.3%) 118 (24.4%) 147 (27.2%) > 30.0 157 (34.7%) 202 (38.2%) 185 (38.3%) 247 (45.7%) Race/ethnicity 0.294 Mexican American 159 (15.6%) 142 (13.3%) 148 (13.7%) 176 (14.8%) Other Hispanic 101 (9.9%) 98 (9.2%) 113 (10.4%) 131 (11.0%) Non−Hispanic White 340 (33.4%) 388 (36.4%) 377 (34.8%) 365 (30.6%) Non−Hispanic Black 224 (22.0%) 226 (21.2%) 250 (23.1%) 288 (24.1%) Other Race − Including Multi−Racial 195 (19.1%) 213 (20.0%) 195 (18.0%) 233 (19.5%) Education < 0.001 Less than 9th grade 38 (3.7%) 104 (9.7%) 53 (4.9%) 87 (7.3%) 9−11th grade 143 (14.0%) 152 (14.2%) 115 (10.6%) 134 (11.2%) High school graduate/GED or equivalent 260 (25.5%) 214 (20.1%) 201 (18.6%) 241 (20.2%) Some college or AA degree 329 (32.3%) 312 (29.2%) 412 (38.0%) 385 (32.3%) College graduate or above 249 (24.4%) 285 (26.7%) 302 (27.9%) 346 (29.0%) Marital status < 0.001 Married 362 (35.5%) 706 (66.2%) 426 (39.3%) 656 (55.0%) Separated 48 (4.7%) 161 (15.1%) 89 (8.2%) 311 (26.1%) Never married 609 (59.8%) 200 (18.7%) 568 (52.4%) 226 (18.9%) Family income−to-Poverty ratio < 0.001 < 1.30 326 (32.0%) 271 (25.4%) 405 (37.4%) 318 (26.7%) ≥ 1.30 to < 3.49 453 (44.5%) 434 (40.7%) 436 (40.3%) 483 (40.5%) ≥ 3.49 240 (23.6%) 362 (33.9%) 242 (22.3%) 392 (32.9%) Physical activity < 0.001 1−2 times/week 179 (17.6%) 198 (19.6%) 119 (16.5%) 149 (12.5%) ≥3 times/week 840 (82.4%) 869 (81.4%) 904 (83.5%) 1044 (87.5%) Smoking status Never smoking 608 (59.7%) 543 (50.9%) 782 (72.2%) 782 (65.5%) < 0.001 Former smoking 154 (15.1%) 257 (24.1%) 103 (9.5%) 169 (14.2%) Current smoking 257 (25.2%) 267 (25.0%) 198 (18.3%) 242 (20.3%) Drinking status Drinker 754 (74.0%) 788 (73.9%) 735 (67.9%) 758 (63.5%) < 0.001 Non−drinker 265 (26.0%) 279 (26.1%) 348 (32.1%) 435 (36.5%) Android fat mass 2,175.42 (1,423.65) 2,668.82 (1,314.05) 2,314.33 (1,405.64) 2,668.30 (1,321.19) < 0.001 Gynoid fat mass 3,989.09 (1,803.61) 4,000.48 (1,536.21) 5,281.31 (1,962.38) 5,353.88 (1,927.38) < 0.001 Subcutaneous fat mass 1,276.78 (812.51) 1,422.21 (656.31) 1,900.23 (862.74) 2,006.84 (779.39) < 0.001 Total abdominal fat mass 1,684.44 (971.58) 2,070.51 (866.36) 2,271.79 (1,042.78) 2,564.01 (982.09) < 0.001 Visceral adipose tissue mass 407.66 (212.26) 648.30 (283.04) 371.57 (230.19) 557.17 (289.35) < 0.001 Trunk fat mass 11,505.87 (6,471.14) 13,710.70 (5,971.95) 13,309.03 (6,777.61) 15,154.10 (6,379.09) < 0.001 Table S4. Age−specific and sex−specific distributions of concentrations of serum PFAS in the study population
Characteristic Male Female P Value 20−39 39−59 20−39 39−59 (N = 1,019) (N = 1,067) (N = 1,083) (N = 1,193) PFOA 2.89 (3.20) 2.74 (1.92) 1.69 (1.10) 2.08 (1.79) < 0.001 PFOS 9.84 (11.24) 11.36 (10.06) 5.50 (4.78) 6.82 (7.93) < 0.001 PFHxS 2.16 (2.65) 2.14 (2.05) 0.94 (1.46) 1.15 (1.92) < 0.001 PFDeA 0.25 (0.33) 0.38 (1.65) 0.25 (0.54) 0.32 (0.46) 0.002 PFNA 0.80 (0.64) 0.95 (0.86) 0.58 (0.52) 0.81 (0.72) < 0.001 n-PFOA 1.85 (1.73) 1.97 (1.34) 1.10 (1.04) 1.62 (2.62) < 0.001 n-PFOS 4.06 (3.09) 6.24 (7.16) 2.48 (3.08) 4.10 (6.05) < 0.001 Sm-PFOS 1.65 (1.07) 2.51 (1.65) 0.75 (0.56) 1.24 (1.17) < 0.001 We found significant associations between single-PFAS exposure and changes in TR, AN, SA, TA, and VFA in Model 3 (Table 1). The results of Model 1 and Model 2 are shown in Supplementary Table S5 and Table S6 (available in www.besjournal.com). For each doubling of PFOS, the change in TR in females aged 39–59 years was 1.52 (95% CI: 0.14289). The participants aged 39–59 with higher concentrations of PFHxS and PFNA had greater accrual of AN (β = 0.40, 95% CI: 0.03, 0.78; β = 0.44, 95% CI: 0.11, 0.77). Moreover, n-PFOA, n-PFOS and Sm-PFOS were associated with fewer SA depots (n-PFOA in females aged 20-39 years, β = −0.64, 95% CI: −1.16, −0.13; n-PFOS in males aged 39–59 years, β = −0.55, 95% CI: −0.99, −0.11); Sm-PFOS in males aged 20–39 years, β = −0.38, 95% CI: −0.72, −0.05; Sm-PFOS in males aged 39–59 years, β = −0.63, 95% CI: –1.03, −0.23). The concentrations of PFOS, PFHxS, and PFNA were shown to be linked with an increase in TA, whereas n-PFOA, n-PFOS, and Sm-PFOS were found to be related to a decrease in TA. Females aged 39–59 years with higher concentrations of PFOS, PFHxS, PFDeA, PFNA and n-PFOA had greater accumulation of VFAs (PFOS, β = 0.68, 95% CI: 0.16, 1.21; PFHxS, β = 0.22, 95% CI: 0.02, 0.42; PFDeA, β = 0.25, 95% CI: 0.08, 0.42; PFNA, β = 0.31, 95% CI: 0.13, 0.49; n-PFOA, β = 0.25, 95% CI: 0.03, 0.47). Moreover, we explored the changes in the A/G ratio. We found that doubling the concentrations of PFOA, PFDeA and PFNA was associated with a significant increase in the A/G ratio in men aged 20-39 years (Supplementary Table S7, available at www.besjournal.com) (PFOA, β = 0.97, 95% CI: 0.04, 1.89; PFDeA, β = 0.59, 95% CI: 0.13, 1.04; PFNA, β = 0.53, 95% CI: 0.04, 1.03). The associations between PFAS exposure and joint assessments of body fat are shown in Supplementary Table S8, available at www.besjournal.com. Among women aged 39–59 years, PFOS, PFHxS, PFDeA, PFNA, n-PFOA, n-PFOS and Sm-PFOS were significantly associated with increased body fat [PFOS, β = 1.68, 95% CI: 0.43, 2.93; PFHxS, β = 0.24, 95% CI: 0.07, 0.42; PFDeA, β = 0.18, 95% CI: 0.07, 0.29; PFNA, β = 0.41, 95% CI: 0.17, 0.65; n-PFOA, β = 0.46, 95% CI: 0.17, 0.76; n-PFOS, β = 0.22, 95% CI: 0.05, 0.38; Sm-PFOS, β = 0.29, 95% CI: 0.07, 0.51). We also observed that PFDeA, n-PFOA and Sm-PFOS were significantly associated with an increase in joint body fat in the subpopulation of men aged 20–39 years [PFDeA, β = 0.14, 95% CI: 0.02, 0.26; n-PFOA, β = 0.14, 95% CI: 0.01, 0.27; Sm-PFOS, β = 0.48, 95% CI: 0.01, 0.96). n-PFOS and Sm-PFOS exposure was associated with a greater risk of fat distribution [n-PFOS, β = 0.62, 95% CI: 0.11, 1.12; Sm-PFOS, β = 0.77, 95% CI: 0.21, 1.34). We performed additional analyses of the relationships between abnormal body fat distribution and PFAS exposure when BMI was normal (Supplementary Tables S9–S11, available in www.besjournal.com). In the BMI < 25.0 subgroup, we found that PFOA exposure may be positively associated with tertile 2 of the VFA in males aged 39–59 years [β = 0.77, 95% CI: 0.26, 1.29), whereas PFHxS and PFNA were positively associated with tertile 2 of the VFA in females aged 39–59 years [PFHxS, β = 0.40, 95% CI: 0.00, 0.80; PFNA, β = 0.65, 95% CI: 0.28, 1.02).
Table 1. Adjusted associations from multivariable linear regression models between serum PFAS and regional fat distribution
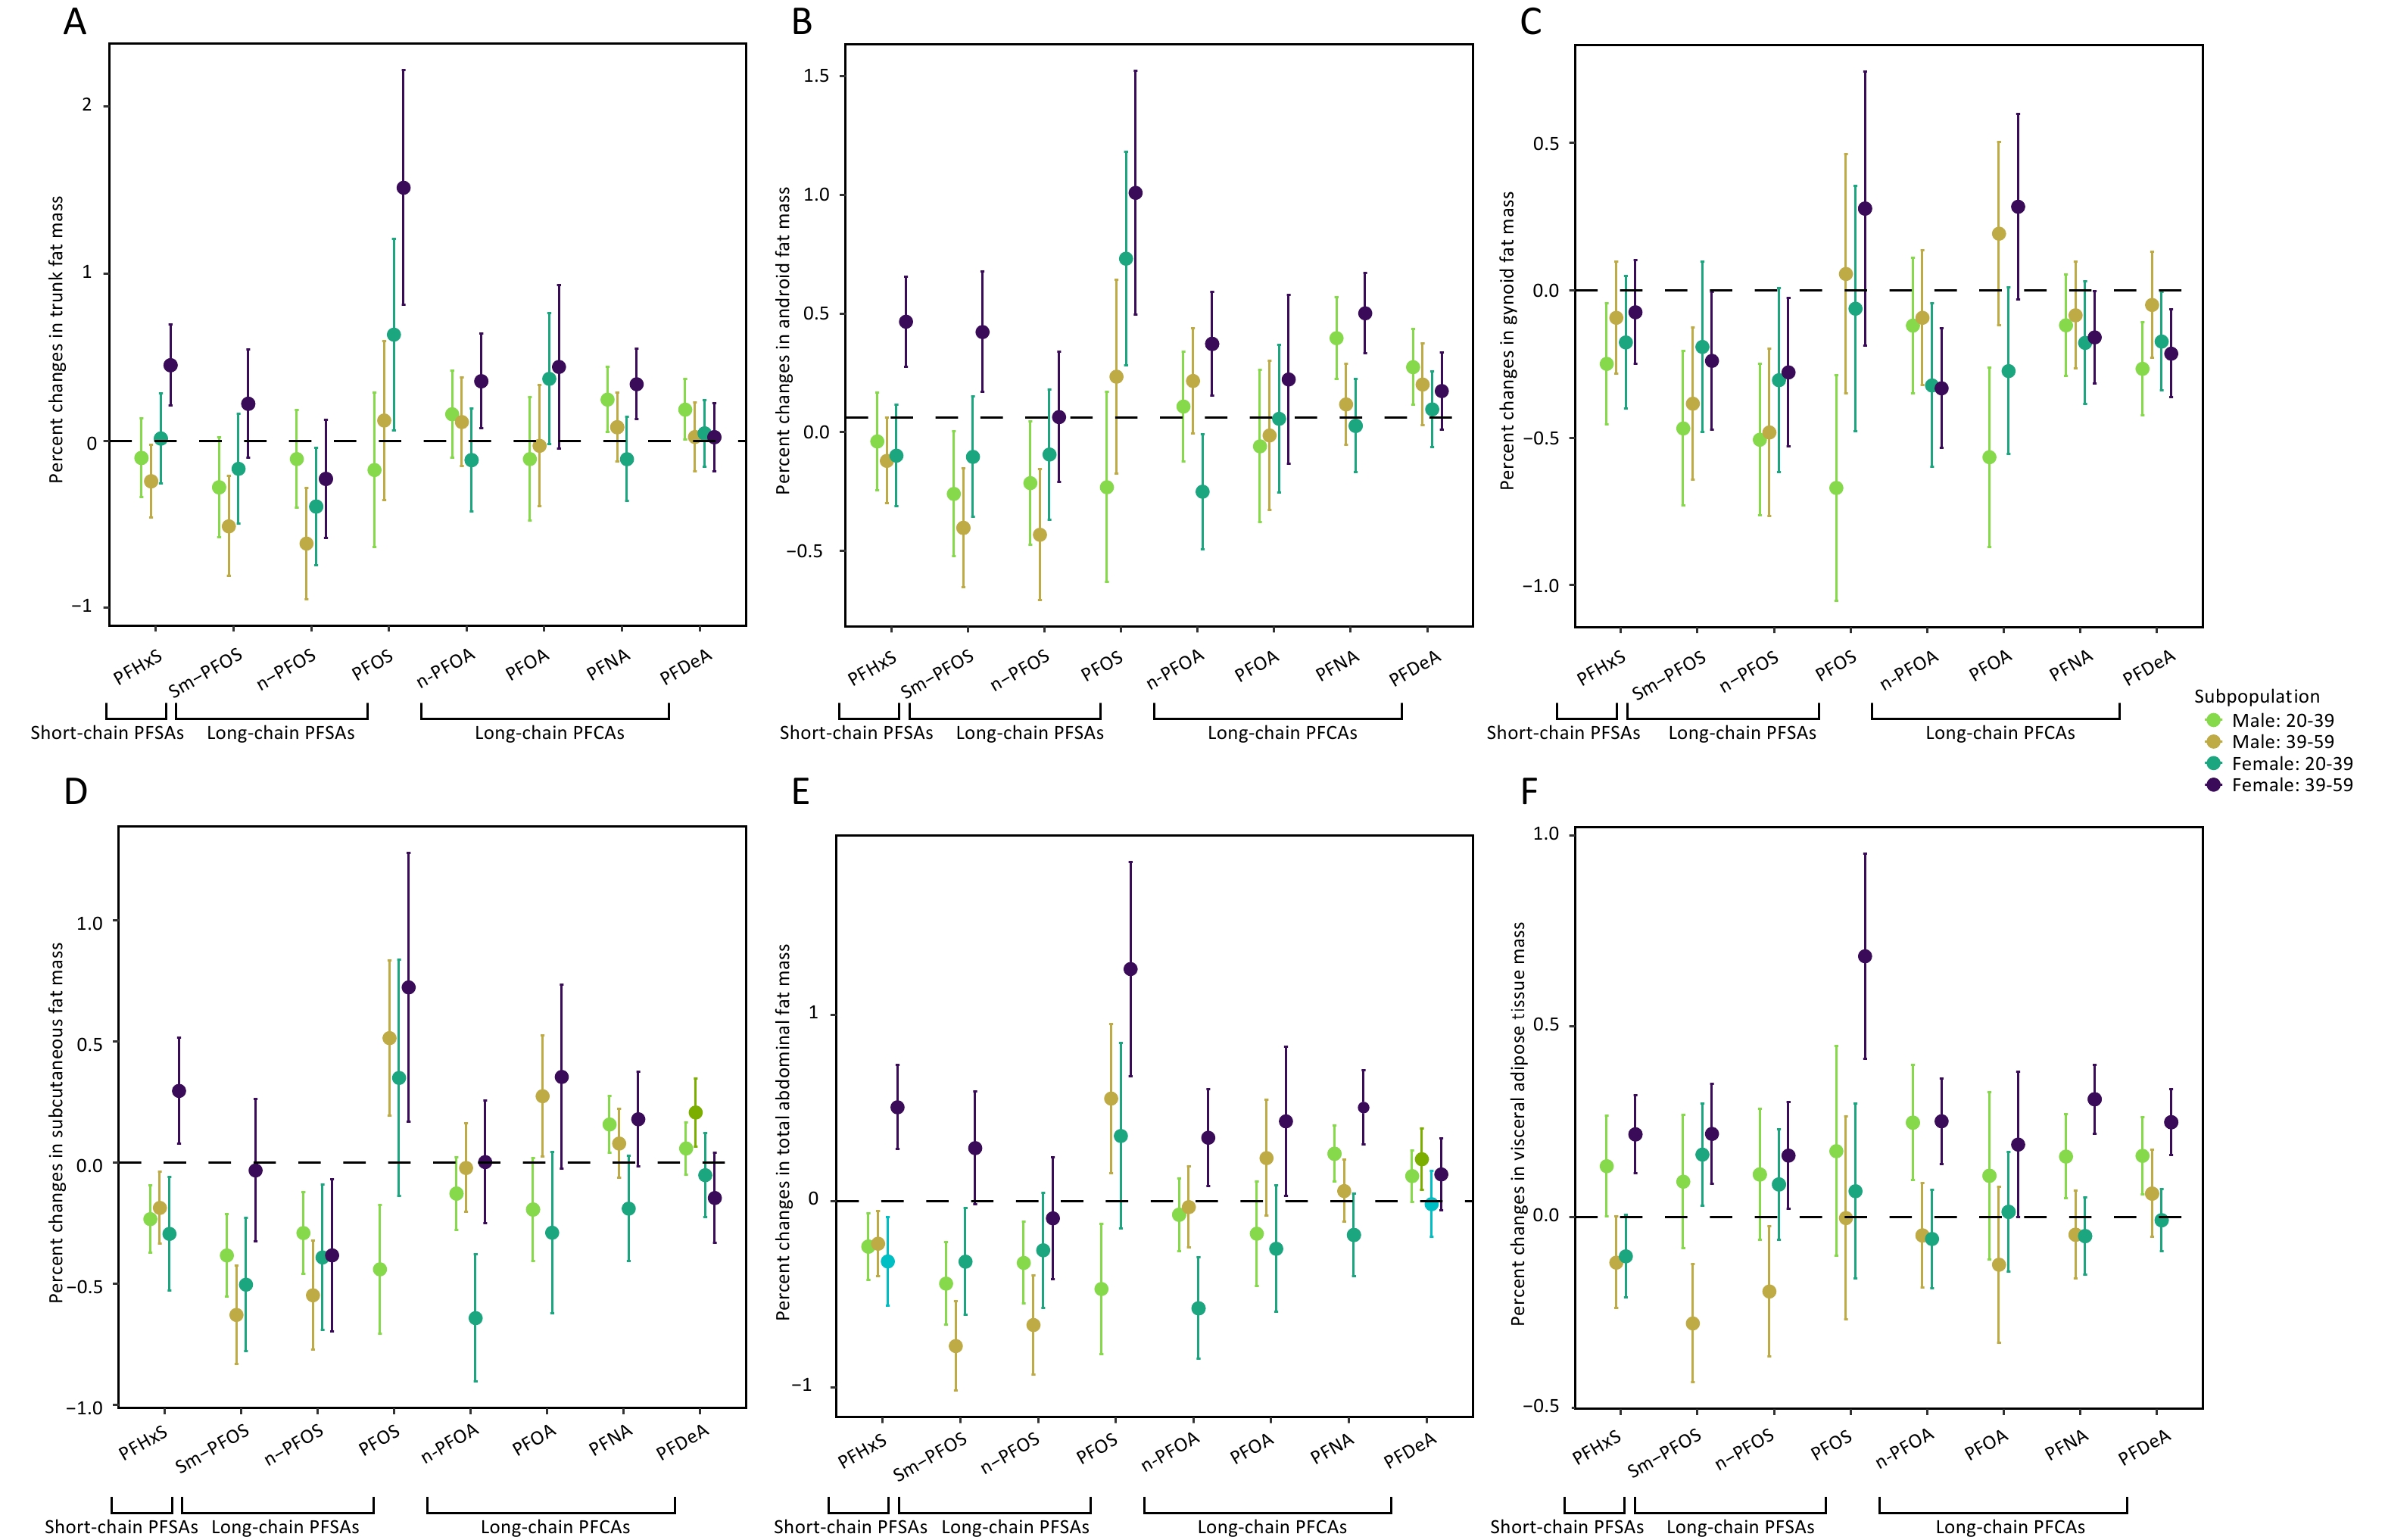
Variables Trunk fat mass Android fat mass Gynoid fat mass Subcutaneous fat mass Total abdominal fat mass Visceral adipose tissue mass PFOA Male, years 20−39 −0.11 (−0.83, 0.61) −0.12 (−0.75, 0.51) −0.57 (−1.16, 0.03) −0.19 (−0.61, 0.22) −0.17 (−0.73, 0.38) 0.11 (−0.32, 0.54) 39−59 −0.03 (−0.74, 0.68) −0.08 (−0.69, 0.54) 0.19 (−0.42, 0.80) 0.27 (−0.21, 0.76) 0.23 (−0.38, 0.84) −0.12 (−0.52, 0.28) Female, years 20−39 0.37 (−0.40, 1.14) −0.01 (−0.62, 0.61) −0.27 (−0.83, 0.28) −0.29 (−0.94, 0.36) −0.26 (−0.92, 0.41) 0.01 (−0.29, 0.32) 39−59 0.44 (−0.52, 1.41) 0.16 (−0.54, 0.86) 0.28 (−0.33, 0.90) 0.35 (−0.39, 1.10) 0.43 (−0.36, 1.21) 0.19 (−0.18, 0.56) PFOS Male, years 20−39 −0.17 (−1.08, 0.73) −0.29 (−1.08, 0.49) −0.67 (−1.42, 0.08) −0.44 (−0.96, 0.08) −0.47 (−1.16, 0.21) 0.17 (−0.37, 0.71) 39−59 0.12 (−0.81, 1.06) 0.17 (−0.63, 0.97) 0.06 (−0.74, 0.85) 0.51 (−0.11, 1.14) 0.55 (−0.24, 1.34) 0.00 (−0.52, 0.52) Female, years 20−39 0.64 (−0.49, 1.76) 0.67 (−0.21, 1.55) −0.06 (−0.88, 0.75) 0.35 (−0.61, 1.31) 0.35 (−0.63, 1.33) 0.07 (−0.38, 0.52) 39−59 1.52 (0.14, 2.89) 0.95 (−0.06, 1.95) 0.28 (−0.63, 1.19) 0.72 (−0.36, 1.81) 1.25 (0.12, 2.38) 0.68 (0.16, 1.21) PFHxS Male, years 20−39 −0.10 (−0.56, 0.36) −0.10 (−0.50, 0.30) −0.25 (−0.65, 0.15) −0.23 (−0.5, 0.04) −0.24 (−0.59, 0.11) 0.13 (−0.12, 0.39) 39−59 −0.24 (−0.67, 0.18) −0.18 (−0.54, 0.17) −0.09 (−0.46, 0.28) −0.19 (−0.48, 0.10) −0.23 (−0.57, 0.11) −0.12 (−0.35, 0.12) Female, years 20−39 0.01 (−0.52, 0.54) −0.16 (−0.58, 0.26) −0.18 (−0.62, 0.27) −0.29 (−0.75, 0.17) −0.32 (−0.79, 0.14) −0.10 (−0.32, 0.11) 39−59 0.45 (−0.02, 0.93) 0.40 (0.03, 0.78) −0.07 (−0.42, 0.27) 0.30 (−0.13, 0.73) 0.50 (0.06, 0.95) 0.22 (0.02, 0.42) PFDeA Male, years 20−39 0.19 (−0.17, 0.54) 0.21 (−0.10, 0.52) −0.27 (−0.58, 0.04) 0.06 (−0.15, 0.27) 0.13 (−0.14, 0.41) 0.16 (−0.04, 0.36) 39−59 0.02 (−0.38, 0.43) 0.14 (−0.20, 0.48) −0.05 (−0.40, 0.30) 0.21 (−0.07, 0.48) 0.23 (−0.10, 0.55) 0.06 (−0.16, 0.29) Female, years 20−39 0.04 (−0.34, 0.43) 0.03 (−0.28, 0.34) −0.17 (−0.50, 0.15) −0.05 (−0.39, 0.29) −0.02 (−0.36, 0.33) −0.01 (−0.17, 0.15) 39−59 0.02 (−0.38, 0.42) 0.11 (−0.21, 0.43) −0.21 (−0.51, 0.08) −0.15 (−0.51, 0.22) 0.14 (−0.23, 0.52) 0.25 (0.08, 0.42) PFNA Male, years 20−39 0.25 (−0.14, 0.63) 0.33 (0.00, 0.67) −0.12 (−0.46, 0.22) 0.16 (−0.07, 0.39) 0.25 (−0.04, 0.55) 0.16 (−0.06, 0.38) 39−59 0.08 (−0.32, 0.49) 0.06 (−0.28, 0.39) −0.08 (−0.44, 0.27) 0.08 (−0.20, 0.36) 0.05 (−0.27, 0.38) −0.05 (−0.27, 0.18) Female, years 20−39 −0.11 (−0.60, 0.38) −0.04 (−0.42, 0.35) −0.18 (−0.59, 0.23) −0.19 (−0.61, 0.24) −0.18 (−0.61, 0.25) −0.05 (−0.25, 0.15) 39−59 0.34 (−0.07, 0.75) 0.44 (0.11, 0.77) −0.16 (−0.46, 0.15) 0.18 (−0.20, 0.56) 0.50 (0.11, 0.89) 0.31 (0.13, 0.49) n-PFOA Male, years 20−39 0.16 (−0.35, 0.67) 0.05 (−0.41, 0.50) −0.12 (−0.57, 0.33) −0.13 (−0.42, 0.17) −0.07 (−0.46, 0.31) 0.25 (−0.05, 0.54) 39−59 0.11 (−0.41, 0.63) 0.15 (−0.28, 0.59) −0.09 (−0.54, 0.36) −0.02 (−0.38, 0.34) −0.03 (−0.46, 0.39) −0.05 (−0.32, 0.22) Female, years 20−39 −0.12 (−0.72, 0.49) −0.31 (−0.79, 0.16) −0.32 (−0.87, 0.22) −0.64 (−1.16, −0.13) −0.58 (−1.11, −0.04) −0.06 (−0.31, 0.20) 39−59 0.36 (−0.20, 0.91) 0.31 (−0.12, 0.74) −0.33 (−0.73, 0.07) 0.00 (−0.50, 0.50) 0.34 (−0.17, 0.85) 0.25 (0.03, 0.47) n-PFOS Male, years 20−39 −0.11 (−0.68, 0.47) −0.28 (−0.79, 0.23) −0.51 (−1.01, 0.00) −0.29 (−0.62, 0.04) −0.33 (−0.76, 0.10) 0.11 (−0.22, 0.45) 39−59 −0.62 (−1.27, 0.04) −0.49 (−1.03, 0.05) −0.48 (−1.04, 0.07) −0.55 (−0.99, −0.11) −0.66 (−1.19, −0.14) −0.19 (−0.53, 0.14) Female, years 20−39 −0.39 (−1.08, 0.29) −0.16 (−0.69, 0.38) −0.30 (−0.91, 0.31) −0.39 (−0.98, 0.20) −0.26 (−0.87, 0.34) 0.09 (−0.20, 0.37) 39−59 −0.23 (−0.92, 0.47) 0.00 (−0.53, 0.54) −0.28 (−0.77, 0.22) −0.38 (−1.00, 0.23) −0.09 (−0.73, 0.55) 0.16 (−0.11, 0.44) Sm-PFOS Male, years 20−39 −0.28 (−0.87, 0.31) −0.32 (−0.84, 0.19) −0.47 (−0.98, 0.04) −0.38 (−0.72, −0.05) −0.44 (−0.88, −0.01) 0.09 (−0.25, 0.44) 39−59 −0.51 (−1.10, 0.07) −0.47 (−0.96, 0.03) −0.38 (−0.89, 0.12) −0.63 (−1.03, −0.23) −0.78 (−1.25, −0.31) −0.28 (−0.58, 0.03) Female, years 20−39 −0.17 (−0.81, 0.47) −0.17 (−0.66, 0.33) −0.19 (−0.76, 0.38) −0.50 (−1.04, 0.04) −0.32 (−0.88, 0.23) 0.16 (−0.10, 0.43) 39−59 0.22 (−0.41, 0.85) 0.36 (−0.14, 0.86) −0.24 (−0.70, 0.22) −0.03 (−0.61, 0.54) 0.29 (−0.31, 0.88) 0.22 (−0.04, 0.47) Note. Data were represented as β and 95% confidence intervals (CI). Models were adjusted for race, PIR, physical activity, smoking status, drinking status, BMI, waist, HDL. PFOA, perfluorooctanoic acid; PFOS, perfluorooctane sulfonate; PFHxS, perfluorohexane sulfonate; PFDeA, perfluorodecanoate; PFNA, perfluorononanoate; n-PFOA, n-Perfluorooctanoate. n-PFOS, linear perfluorooctane sulfonate; Sm-PFOS, monomethyl branched isomers of PFOS; PFAS, Per and polyfluoroalkyl substance; HDL high−density lipoprotein; BMI, body mass index. In the sensitivity analysis, by removing concentrations of PFAS more than three times the 75th percentile (Supplementary Table S12, available in www.besjournal.com), we found that participants with higher concentrations of PFOS, PFHxS and PFNA had less accrual of AN, TA, VFA and TR. Moreover, in the sensitivity analysis adjusted for LDL (Supplementary Table S13, available in www.besjournal.com), most of the results remained the same as those in the primary analyses, which means that our results are relatively robust. The structure-specific associations with outcomes were examined by grouping PFAS congeners according to their structural characteristics, namely, total PFSAs, short-chain PFSAs (PFHxS), long-chain PFSAs (Sm-PFOS, n-PFOS, PFOS) and long-chain PFCAs (n-PFOA, PFOA, PFNA, PFDeA), and the relationships between each of the PFAS and abdominal fat distribution were compared from the perspective of chemical structure, as shown in Figure 1. In all subgroups, the effect of a single PFAS in PFSA congeners on body fat decreased with an increasing number of carbon atoms, reaching the highest level among the effects caused by PFOS exposure. No significant regularity was observed among the PFCAs. The associations of structurally grouped PFAS concentrations with regional fat distribution are shown in Supplementary Table S14, available in www.besjournal.com. Exposure to short-chain PFSAs was significantly associated with increased AN (0.39), TA (0.49), and VFA (0.22) in females aged 39–59. The accumulation of VFA was affected by long-chain PFCAs [β = 0.31, 95% CI: (0.10, 0.52)].
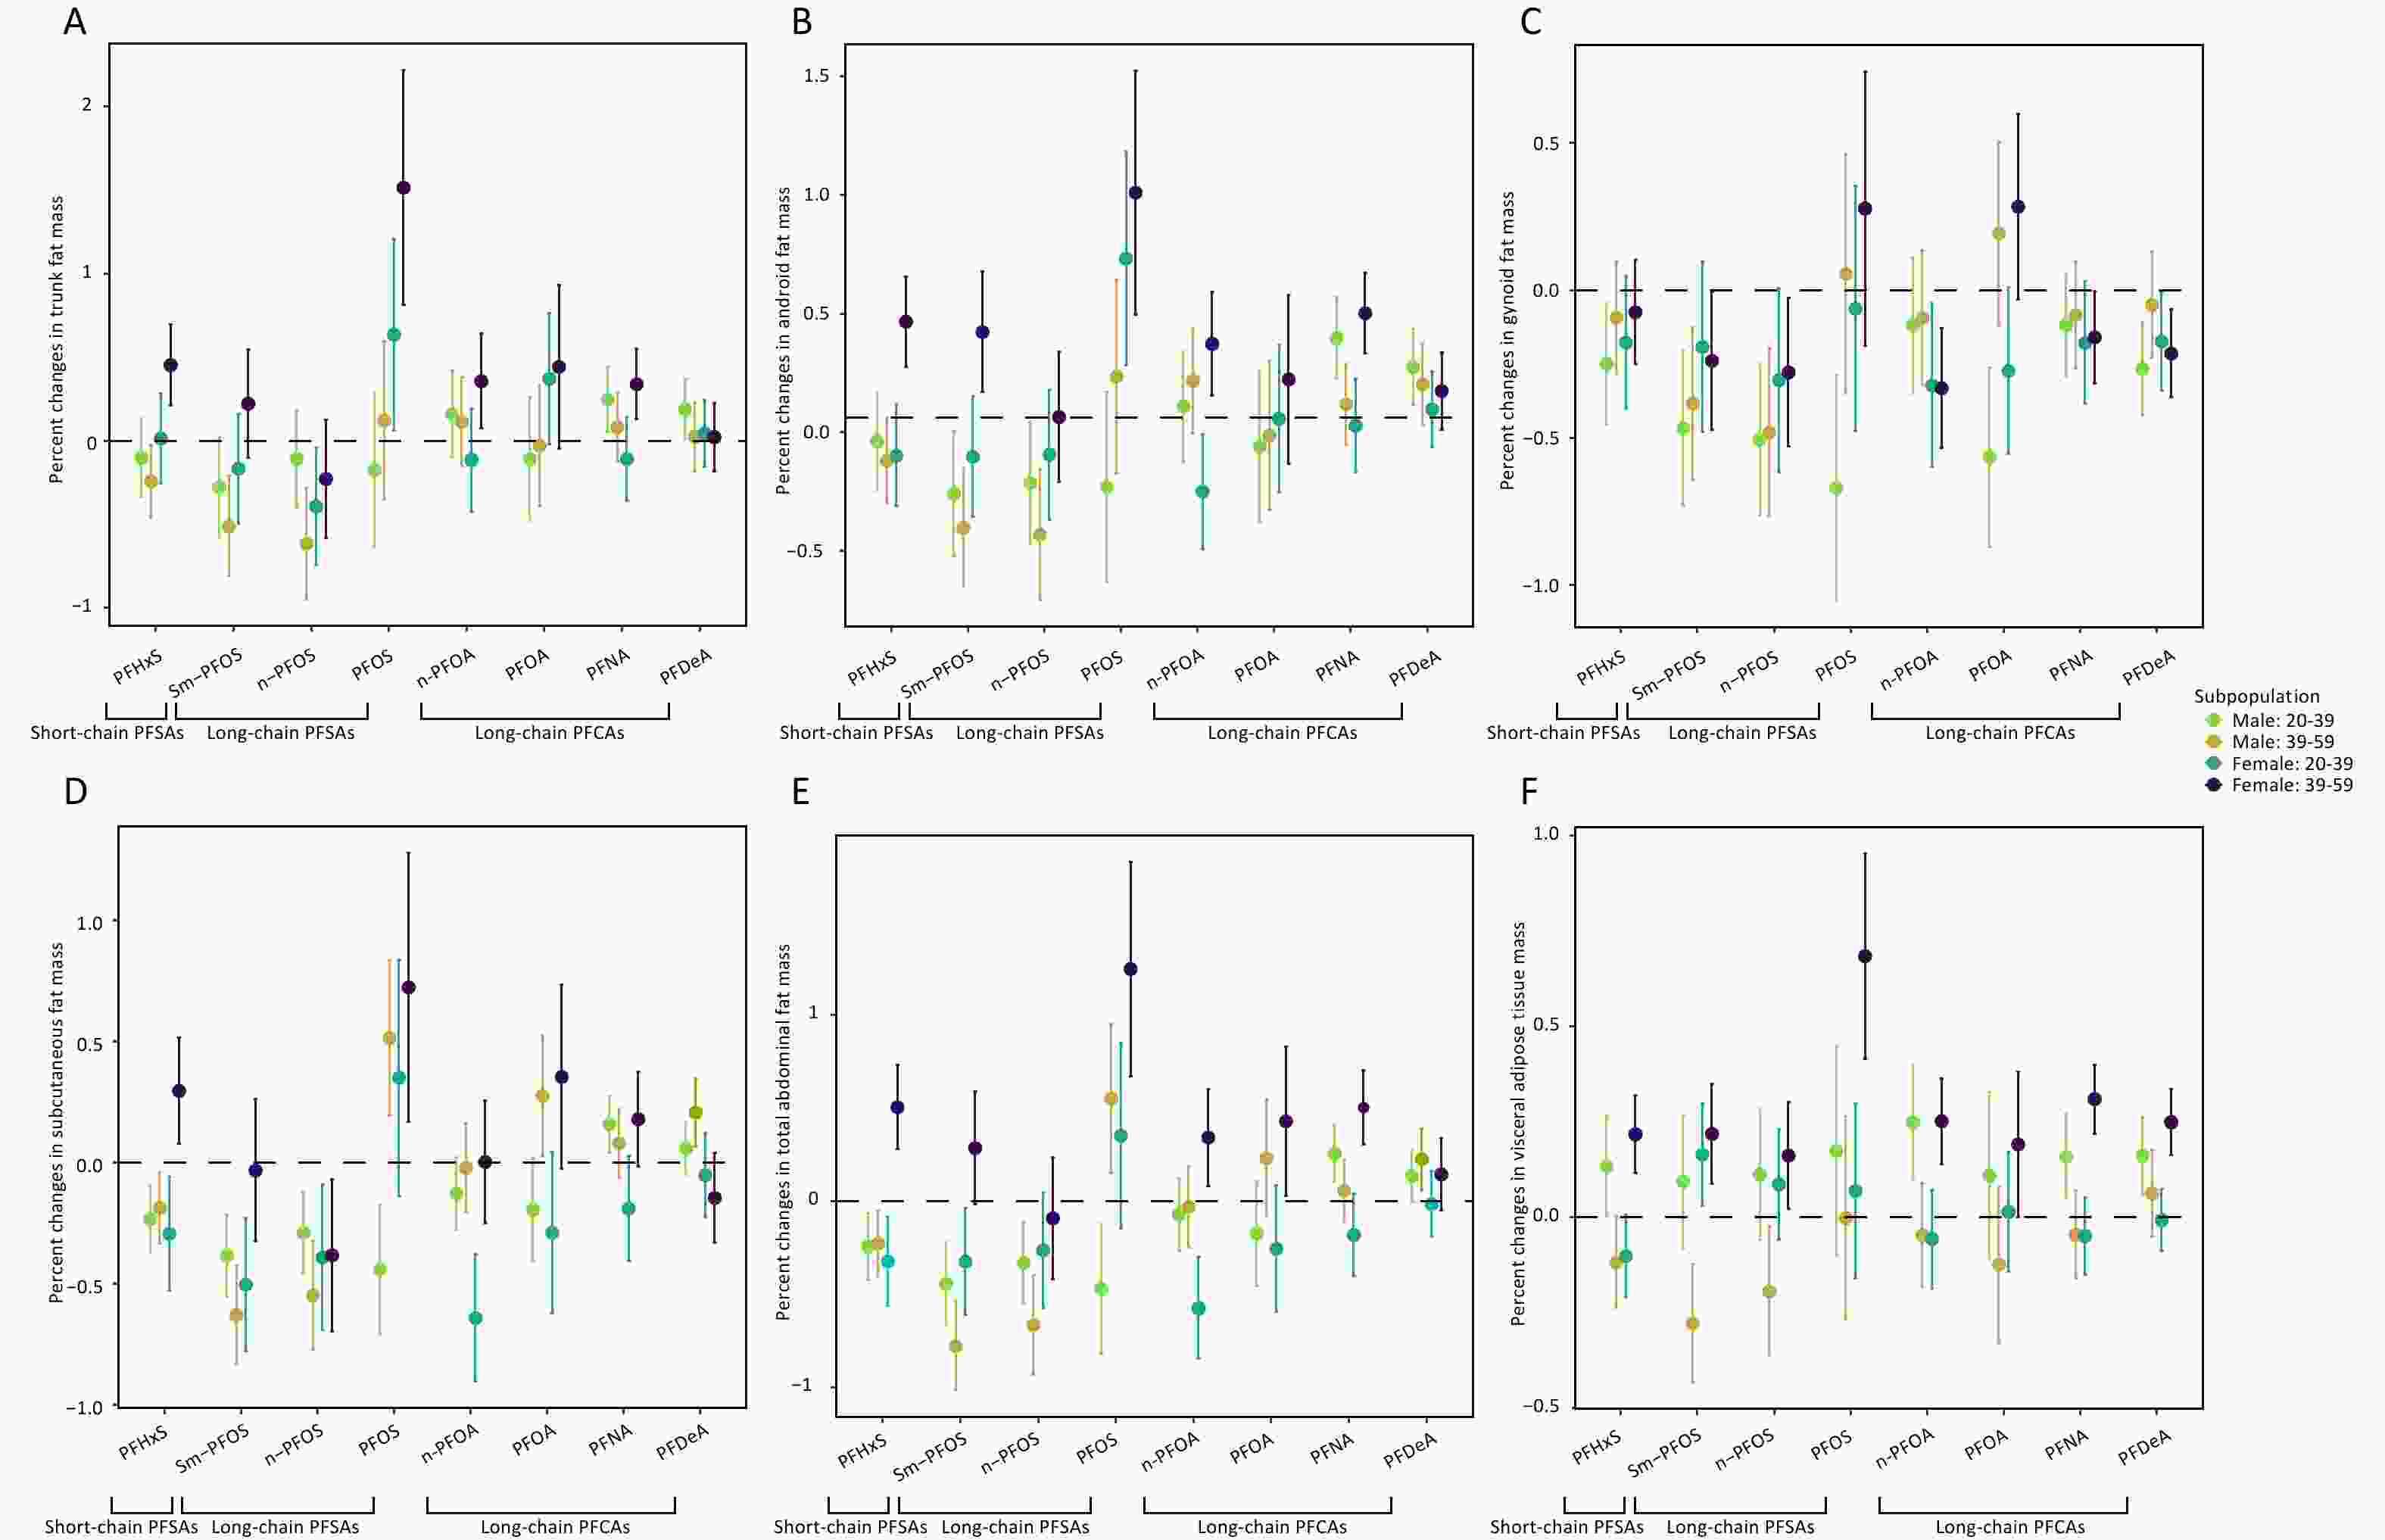
Figure 1. Effect estimates and 95% confidence intervals for associations of single PFAS with regional fat grouped by structural characteristics. PFOA, perfluorooctanoic acid; PFOS, perfluorooctane sulfonate; PFHxS, perfluorohexane sulfonate; PFDeA, perfluorodecanoate; PFNA, perfluorononanoate; n-PFOA, n-perfluorooctanoate. n-PFOS, linear perfluorooctane sulfonate; Sm-PFOS, monomethyl branched isomers of PFOS; PFAS, Per and polyfluoroalkyl substance.
Table S12. Regression coefficients for regional fat distribution associated with PFAS in sensitive analyses by removing concentrations of PFAS more than three times the 75th percentile
Variable Percent Change (95% CI) Trunk fat mass Android fat mass Gynoid fat mass Subcutaneous fat mass Total abdominal fat mass Visceral adipose tissue mass PFOA Male 20−39 −0.02 (−0.69, 0.66) −0.07 (−0.66, 0.51) −0.44 (−1.00, 0.13) −0.13 (−0.52, 0.26) −0.16 (−0.67, 0.35) −0.02 (−0.43, 0.38) 39−59 0.12 (−0.55, 0.79) 0.10 (−0.47, 0.68) 0.24 (−0.33, 0.80) 0.34 (−0.11, 0.80) 0.32 (−0.24, 0.89) −0.1 (−0.47, 0.27) Female 20−39 0.37 (−0.40, 1.14) −0.01 (−0.62, 0.61) −0.27 (−0.83, 0.28) −0.29 (−0.94, 0.36) −0.26 (−0.92, 0.41) 0.01 (−0.29, 0.32) 39−59 0.44 (−0.52, 1.41) 0.09 (−0.60, 0.78) 0.20 (−0.40, 0.81) 0.20 (−0.53, 0.93) 0.33 (−0.45, 1.11) 0.19 (−0.17, 0.55) PFOS Male 20−39 0.11 (−0.69, 0.90) −0.10 (−0.79, 0.59) −0.41 (−1.07, 0.26) −0.18 (−0.65, 0.29) −0.21 (−0.82, 0.40) 0.05 (−0.42, 0.52) 39−59 0.17 (−0.74, 1.07) 0.19 (−0.57, 0.96) 0.14 (−0.58, 0.87) 0.53 (−0.05, 1.12) 0.53 (−0.20, 1.27) −0.06 (−0.55, 0.43) Female 20−39 0.48 (−0.61, 1.57) 0.47 (−0.39, 1.34) −0.12 (−0.91, 0.66) 0.11 (−0.82, 1.05) 0.11 (−0.85, 1.06) 0.01 (−0.42, 0.45) 39−59 1.36 (0.00, 2.72) 0.90 (−0.02, 1.83) 0.32 (−0.51, 1.15) 0.63 (−0.36, 1.61) 1.11 (0.06, 2.15) 0.55 (0.07, 1.03) PFHxS Male 20−39 −0.19 (−0.61, 0.23) −0.19 (−0.57, 0.18) −0.14 (−0.51, 0.23) −0.21 (−0.46, 0.04) −0.27 (−0.60, 0.05) −0.01 (−0.25, 0.23) 39−59 −0.16 (−0.54, 0.23) −0.11 (−0.42, 0.21) −0.03 (−0.36, 0.31) −0.12 (−0.38, 0.14) −0.14 (−0.45, 0.16) −0.08 (−0.29, 0.13) Female 20−39 0.03 (−0.49, 0.56) −0.09 (−0.50, 0.32) −0.16 (−0.60, 0.27) −0.21 (−0.67, 0.24) −0.24 (−0.70, 0.22) −0.09 (−0.30, 0.12) 39−59 0.45 (0.00, 0.90) 0.39 (0.04, 0.74) 0.04 (−0.28, 0.36) 0.33 (−0.07, 0.73) 0.53 (0.12, 0.95) 0.21 (0.02, 0.40) PFDeA Male 20−39 −0.02 (−0.33, 0.28) 0.05 (−0.22, 0.31) −0.32 (−0.58, −0.06) 0.00 (−0.18, 0.18) 0.02 (−0.21, 0.25) 0.06 (−0.11, 0.23) 39−59 −0.15 (−0.51, 0.20) −0.09 (−0.37, 0.20) −0.01 (−0.31, 0.30) 0.03 (−0.21, 0.26) −0.01 (−0.29, 0.27) −0.05 (−0.24, 0.14) Female 20−39 0.10 (−0.26, 0.45) 0.05 (−0.22, 0.33) −0.10 (−0.39, 0.19) −0.03 (−0.34, 0.28) −0.01 (−0.32, 0.30) 0.00 (−0.14, 0.15) 39−59 −0.09 (−0.43, 0.25) −0.04 (−0.31, 0.23) −0.19 (−0.44, 0.06) −0.13 (−0.44, 0.18) 0.02 (−0.30, 0.34) 0.12 (−0.03, 0.26) PFNA Male 20−39 0.16 (−0.20, 0.52) 0.23 (−0.09, 0.55) −0.19 (−0.51, 0.13) 0.13 (−0.09, 0.34) 0.20 (−0.08, 0.47) 0.12 (−0.09, 0.32) 39−59 −0.08 (−0.46, 0.31) −0.04 (−0.36, 0.27) −0.11 (−0.44, 0.21) −0.01 (−0.27, 0.25) −0.06 (−0.36, 0.24) −0.10 (−0.3, 0.11) Female 20−39 −0.1 (−0.58, 0.38) −0.02 (−0.40, 0.36) −0.17 (−0.57, 0.23) −0.14 (−0.55, 0.28) −0.15 (−0.58, 0.27) −0.08 (−0.27, 0.12) 39−59 0.29 (−0.11, 0.69) 0.42 (0.11, 0.73) −0.20 (−0.49, 0.09) 0.18 (−0.17, 0.54) 0.51 (0.14, 0.88) 0.31 (0.14, 0.48) n-PFOA Male 20−39 0.02 (−0.45, 0.49) −0.12 (−0.54, 0.30) −0.15 (−0.56, 0.26) −0.15 (−0.42, 0.12) −0.18 (−0.53, 0.17) 0.09 (−0.18, 0.37) 39−59 0.09 (−0.42, 0.60) 0.07 (−0.35, 0.49) −0.24 (−0.67, 0.18) −0.07 (−0.41, 0.27) −0.06 (−0.46, 0.35) −0.01 (−0.27, 0.24) Female 20−39 −0.12 (−0.72, 0.49) −0.28 (−0.74, 0.19) −0.33 (−0.86, 0.20) −0.65 (−1.15, −0.15) −0.55 (−1.07, −0.03) 0.03 (−0.23, 0.28) 39−59 0.29 (−0.23, 0.82) 0.34 (−0.07, 0.75) −0.29 (−0.67, 0.10) 0.10 (−0.37, 0.57) 0.37 (−0.11, 0.85) 0.23 (0.01, 0.44) n-PFOS Male 20−39 −0.25 (−0.81, 0.31) −0.37 (−0.86, 0.13) −0.49 (−0.98, −0.01) −0.32 (−0.64, 0.00) −0.40 (−0.81, 0.02) 0.05 (−0.28, 0.37) 39−59 −0.65 (−1.25, −0.06) −0.59 (−1.06, −0.11) −0.45 (−0.95, 0.04) −0.61 (−0.99, −0.23) −0.75 (−1.20, −0.29) −0.20 (−0.50, 0.11) Female 20−39 −0.35 (−1.02, 0.32) −0.15 (−0.67, 0.37) −0.25 (−0.84, 0.35) −0.35 (−0.92, 0.22) −0.25 (−0.84, 0.34) 0.06 (−0.22, 0.33) 39−59 −0.18 (−0.81, 0.45) −0.03 (−0.52, 0.45) −0.37 (−0.82, 0.08) −0.27 (−0.82, 0.28) −0.06 (−0.63, 0.51) 0.12 (−0.13, 0.37) Sm-PFOS Male 20−39 −0.28 (−0.87, 0.31) −0.32 (−0.84, 0.19) −0.47 (−0.98, 0.04) −0.38 (−0.72, −0.05) −0.44 (−0.88, −0.01) 0.09 (−0.25, 0.44) 39−59 −0.60 (−1.18, −0.02) −0.54 (−1.01, −0.07) −0.39 (−0.87, 0.09) −0.57 (−0.95, −0.19) −0.73 (−1.18, −0.28) −0.27 (−0.57, 0.02) Female 20−39 −0.17 (−0.81, 0.47) −0.17 (−0.66, 0.33) −0.19 (−0.76, 0.38) −0.50 (−1.04, 0.04) −0.32 (−0.88, 0.23) 0.16 (−0.10, 0.43) 39−59 0.23 (−0.40, 0.85) 0.38 (−0.10, 0.87) −0.25 (−0.70, 0.21) 0.00 (−0.56, 0.57) 0.35 (−0.23, 0.93) 0.25 (0.00, 0.50) Note. Models were adjusted for race, PIR, physical activity, smoking status, drinking status, BMI, waist, HDL. Table S13. Regression coefficients for regional fat distribution associated with PFAS in sensitive analyses by additionally adjusting low−density lipoproteins (LDL)
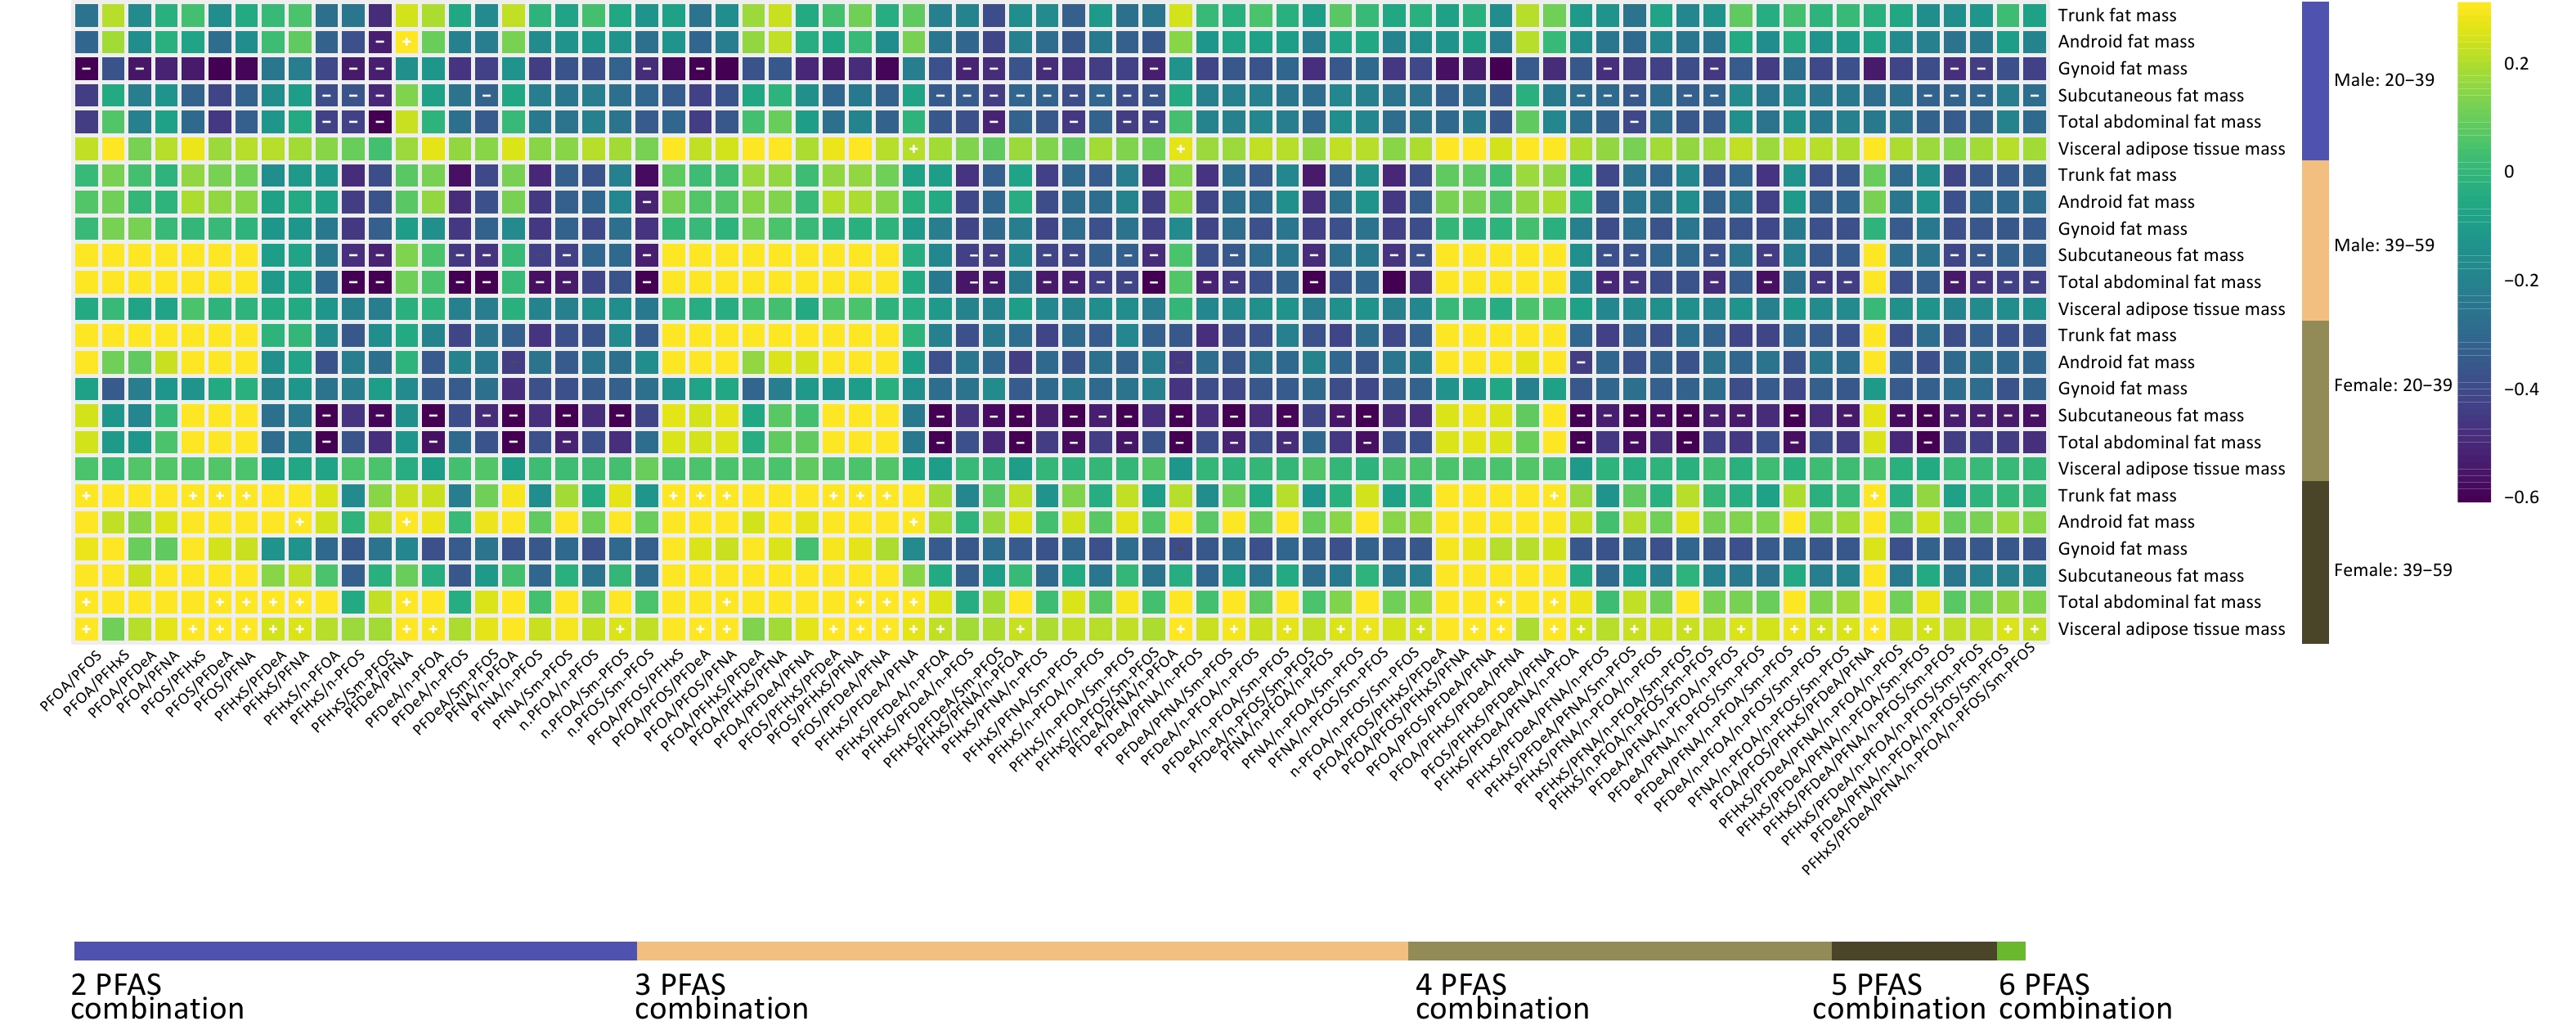
Variable Percent Change (95% CI) Trunk fat mass Android fat mass Gynoid fat mass Subcutaneous fat mass Total abdominal fat mass Visceral adipose tissue mass PFOA Male 20−39 −0.11 (−0.83, 0.61) −0.16 (−0.79, 0.47) −0.63 (−1.22, −0.03) −0.23 (−0.65, 0.19) −0.21 (−0.76, 0.34) 0.13 (−0.30, 0.56) 39−59 −0.06 (−0.78, 0.66) −0.07 (−0.68, 0.54) 0.10 (−0.51, 0.71) 0.22 (−0.26, 0.71) 0.18 (−0.42, 0.79) −0.11 (−0.50, 0.29) Female 20−39 0.37 (−0.40, 1.14) −0.04 (−0.65, 0.58) −0.26 (−0.82, 0.29) −0.32 (−0.97, 0.34) −0.29 (−0.96, 0.38) 0.00 (−0.30, 0.31) 39−59 0.61 (−0.36, 1.59) 0.05 (−0.63, 0.72) 0.30 (−0.29, 0.89) 0.28 (−0.44, 0.99) 0.26 (−0.51, 1.03) 0.06 (−0.31, 0.43) PFOS Male 20−39 −0.17 (−1.08, 0.73) −0.35 (−1.13, 0.44) −0.75 (−1.50, 0.00) −0.49 (−1.01, 0.03) −0.53 (−1.21, 0.16) 0.20 (−0.34, 0.74) 39−59 0.11 (−0.84, 1.06) 0.17 (−0.63, 0.97) −0.02 (−0.83, 0.78) 0.47 (−0.16, 1.11) 0.52 (−0.27, 1.30) 0.01 (−0.51, 0.53) Female 20−39 0.64 (−0.49, 1.76) 0.62 (−0.26, 1.51) −0.04 (−0.85, 0.77) 0.30 (−0.65, 1.26) 0.30 (−0.68, 1.28) 0.05 (−0.40, 0.50) 39−59 1.66 (0.23, 3.10) 0.81 (−0.17, 1.80) 0.30 (−0.58, 1.18) 0.63 (−0.43, 1.69) 1.05 (−0.07, 2.17) 0.55 (0.01, 1.09) PFHxS Male 20−39 −0.10 (−0.56, 0.36) −0.14 (−0.55, 0.27) −0.26 (−0.66, 0.14) −0.26 (−0.53, 0.02) −0.28 (−0.64, 0.07) 0.12 (−0.14, 0.38) 39−59 −0.24 (−0.67, 0.19) −0.20 (−0.55, 0.16) −0.11 (−0.48, 0.27) −0.21 (−0.50, 0.08) −0.25 (−0.59, 0.09) −0.12 (−0.35, 0.12) Female 20−39 0.01 (−0.52, 0.54) −0.15 (−0.57, 0.27) −0.18 (−0.62, 0.27) −0.29 (−0.75, 0.17) −0.32 (−0.79, 0.15) −0.10 (−0.32, 0.12) 39−59 0.49 (0.02, 0.97) 0.39 (0.02, 0.76) −0.04 (−0.38, 0.30) 0.31 (−0.11, 0.74) 0.48 (0.04, 0.92) 0.18 (−0.02, 0.38) PFDeA Male 20−39 0.19 (−0.17, 0.54) 0.18 (−0.14, 0.49) −0.28 (−0.59, 0.03) 0.04 (−0.18, 0.25) 0.10 (−0.17, 0.38) 0.14 (−0.06, 0.34) 39−59 0.09 (−0.33, 0.50) 0.11 (−0.23, 0.44) −0.08 (−0.43, 0.27) 0.17 (−0.11, 0.44) 0.19 (−0.14, 0.51) 0.06 (−0.16, 0.29) Female 20−39 0.04 (−0.34, 0.43) 0.01 (−0.30, 0.32) −0.17 (−0.50, 0.15) −0.07 (−0.41, 0.27) −0.04 (−0.39, 0.31) −0.03 (−0.19, 0.13) 39−59 0.01 (−0.40, 0.41) 0.10 (−0.21, 0.42) −0.20 (−0.49, 0.10) −0.14 (−0.50, 0.23) 0.13 (−0.24, 0.51) 0.23 (0.06, 0.40) PFNA Male 20−39 0.25 (−0.14, 0.63) 0.26 (−0.08, 0.60) −0.14 (−0.48, 0.19) 0.11 (−0.12, 0.34) 0.19 (−0.11, 0.49) 0.12 (−0.10, 0.34) 39−59 0.09 (−0.32, 0.51) 0.03 (−0.31, 0.36) −0.11 (−0.46, 0.24) 0.04 (−0.24, 0.32) 0.02 (−0.31, 0.35) −0.04 (−0.27, 0.18) Female 20−39 −0.11 (−0.60, 0.38) −0.06 (−0.45, 0.33) −0.18 (−0.59, 0.23) −0.21 (−0.64, 0.22) −0.21 (−0.65, 0.22) −0.07 (−0.27, 0.13) 39−59 0.34 (−0.08, 0.76) 0.43 (0.10, 0.75) −0.12 (−0.42, 0.18) 0.20 (−0.18, 0.57) 0.48 (0.09, 0.86) 0.27 (0.09, 0.44) n-PFOA Male 20−39 0.16 (−0.35, 0.67) −0.03 (−0.50, 0.43) −0.14 (−0.59, 0.31) −0.17 (−0.47, 0.13) −0.14 (−0.53, 0.25) 0.20 (−0.10, 0.51) 39−59 0.18 (−0.35, 0.71) 0.14 (−0.31, 0.58) −0.11 (−0.56, 0.34) −0.04 (−0.41, 0.32) −0.06 (−0.49, 0.38) −0.05 (−0.33, 0.22) Female 20−39 −0.12 (−0.72, 0.49) −0.29 (−0.78, 0.19) −0.34 (−0.89, 0.21) −0.63 (−1.15, −0.12) −0.56 (−1.10, −0.02) −0.03 (−0.30, 0.23) 39−59 0.35 (−0.20, 0.91) 0.34 (−0.08, 0.76) −0.25 (−0.65, 0.14) 0.06 (−0.43, 0.55) 0.38 (−0.13, 0.88) 0.24 (0.02, 0.45) n-PFOS Male 20−39 −0.11 (−0.68, 0.47) −0.36 (−0.88, 0.16) −0.52 (−1.03, −0.02) −0.33 (−0.66, 0.00) −0.40 (−0.84, 0.04) 0.07 (−0.27, 0.42) 39−59 −0.51 (−1.18, 0.16) −0.57 (−1.12, −0.02) −0.52 (−1.08, 0.04) −0.62 (−1.07, −0.17) −0.75 (−1.28, −0.22) −0.21 (−0.55, 0.12) Female 20−39 −0.39 (−1.08, 0.29) −0.16 (−0.70, 0.38) −0.31 (−0.92, 0.31) −0.39 (−0.98, 0.20) −0.27 (−0.88, 0.34) 0.09 (−0.20, 0.39) 39−59 −0.25 (−0.94, 0.44) 0.02 (−0.52, 0.56) −0.23 (−0.73, 0.27) −0.35 (−0.96, 0.27) −0.07 (−0.71, 0.57) 0.15 (−0.12, 0.43) Sm-PFOS Male 20−39 −0.28 (−0.87, 0.31) −0.43 (−0.95, 0.10) −0.49 (−1.00, 0.02) −0.44 (−0.77, −0.10) −0.54 (−0.97, −0.10) 0.04 (−0.31, 0.38) 39−59 −0.44 (−1.04, 0.16) −0.47 (−0.97, 0.03) −0.38 (−0.89, 0.13) −0.64 (−1.05, −0.24) −0.80 (−1.28, −0.31) −0.28 (−0.58, 0.03) Female 20−39 −0.17 (−0.81, 0.47) −0.16 (−0.66, 0.34) −0.20 (−0.77, 0.37) −0.50 (−1.04, 0.04) −0.32 (−0.89, 0.25) 0.19 (−0.08, 0.47) 39−59 0.22 (−0.41, 0.85) 0.40 (−0.09, 0.88) −0.15 (−0.60, 0.31) 0.04 (−0.53, 0.60) 0.32 (−0.26, 0.91) 0.20 (−0.05, 0.45) Note. Models were adjusted for race, PIR, physical activity, smoking status, drinking status, BMI, waist, HDL, LDL. Considering the differences in the distribution of PFASs in different regions that may lead to the diversity of PFAS exposure in the human body, we comprehensively evaluated the effects of different PFAS combination exposures on regional fat depots (Figure 2). The results revealed that combinations containing PFOS and/or PFOA as exposure traits were more likely to be positively associated with abdominal fat, and this association was more pronounced in women aged 39–59 years. Positive associations were focused on the endpoint of visceral fat.
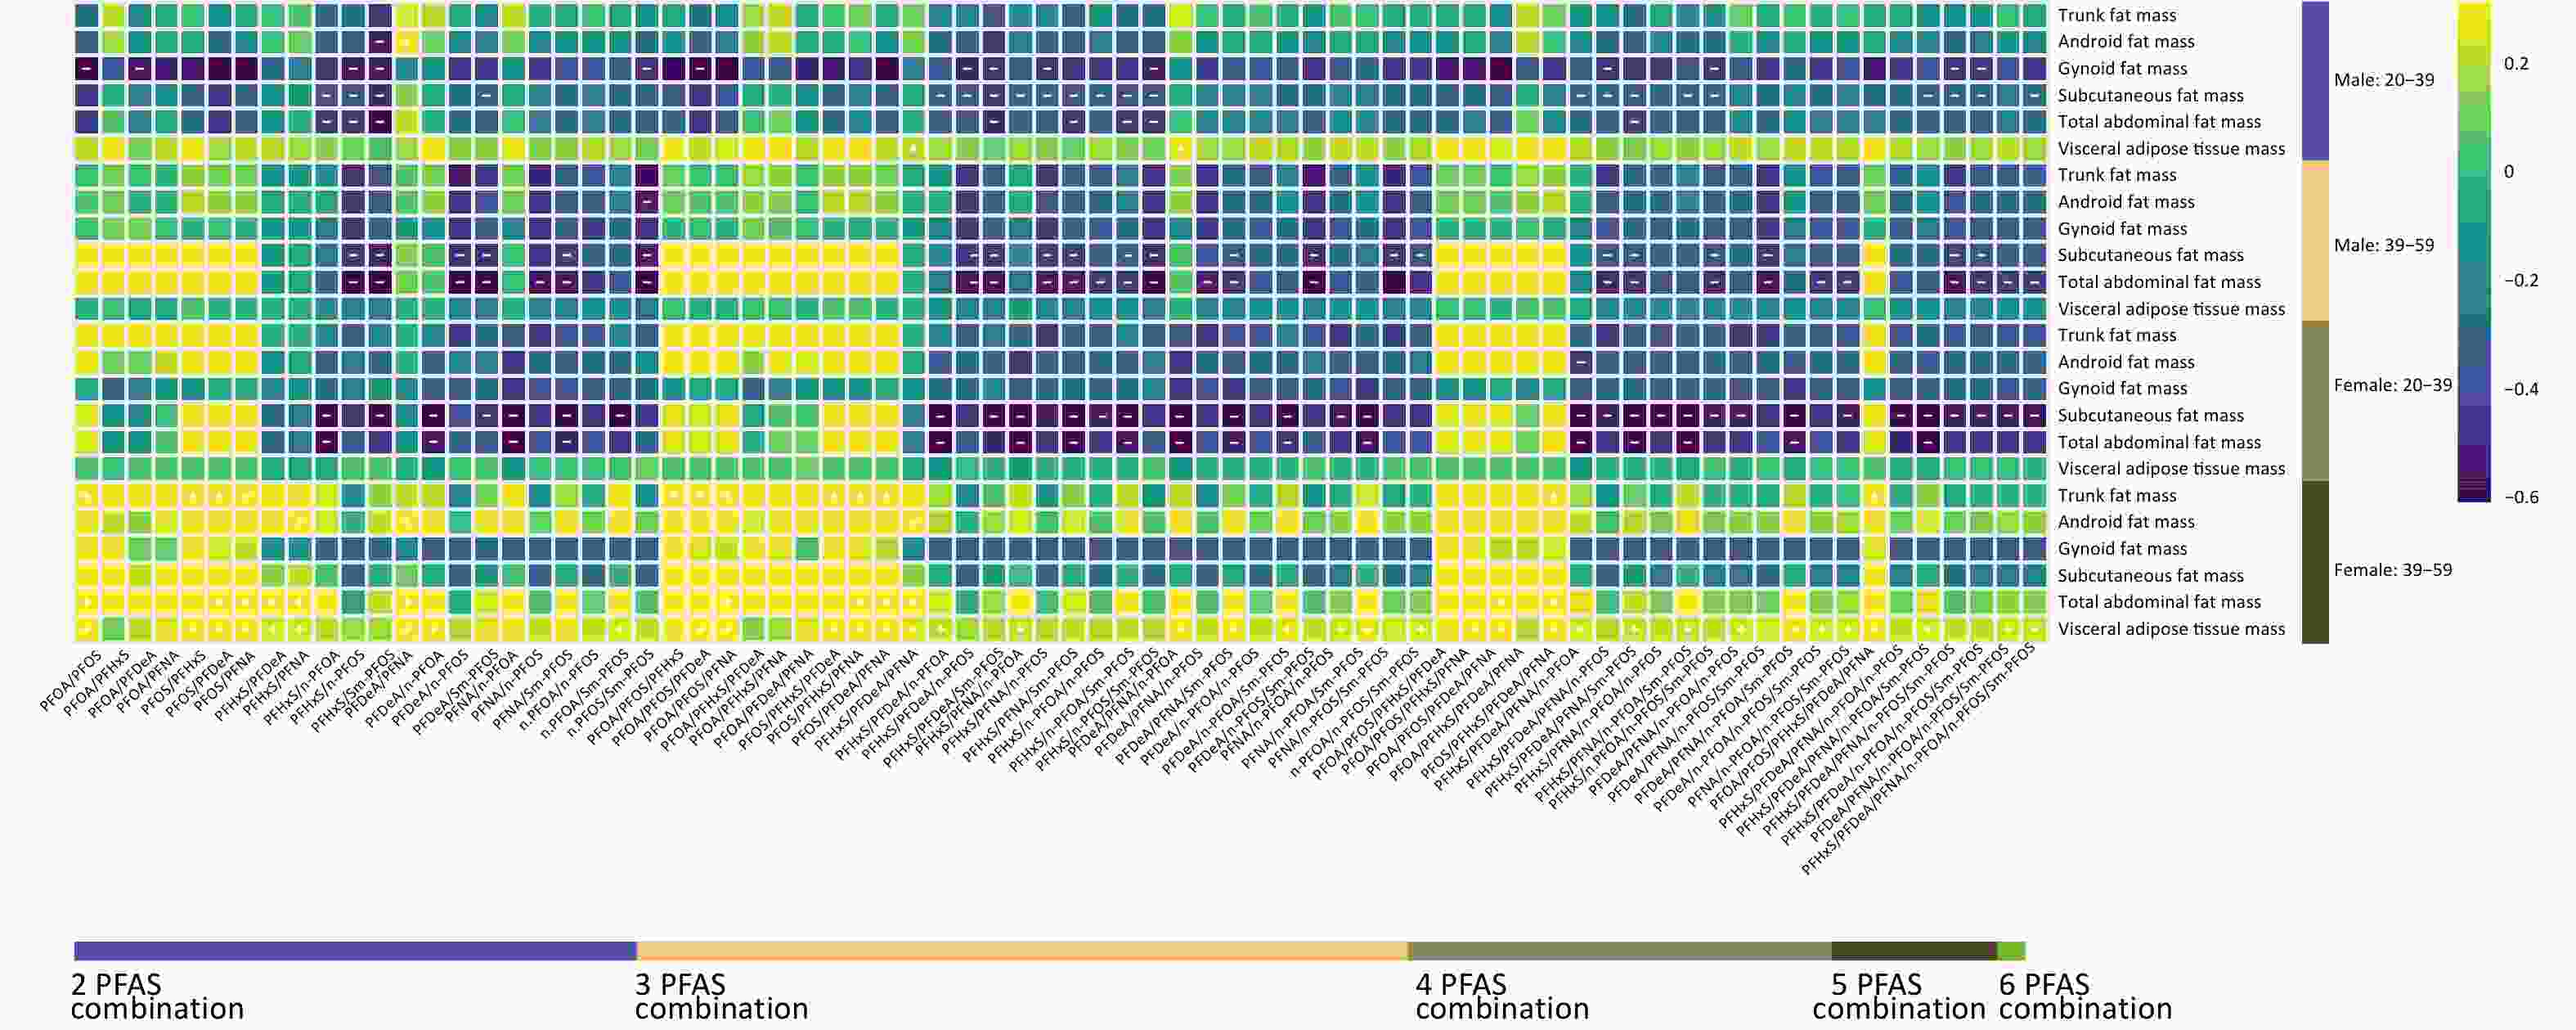
Figure 2. Association of trait spectrum exposure pattern of per and polyfluoroalkyl substance (PFAS) with regional fat depots.
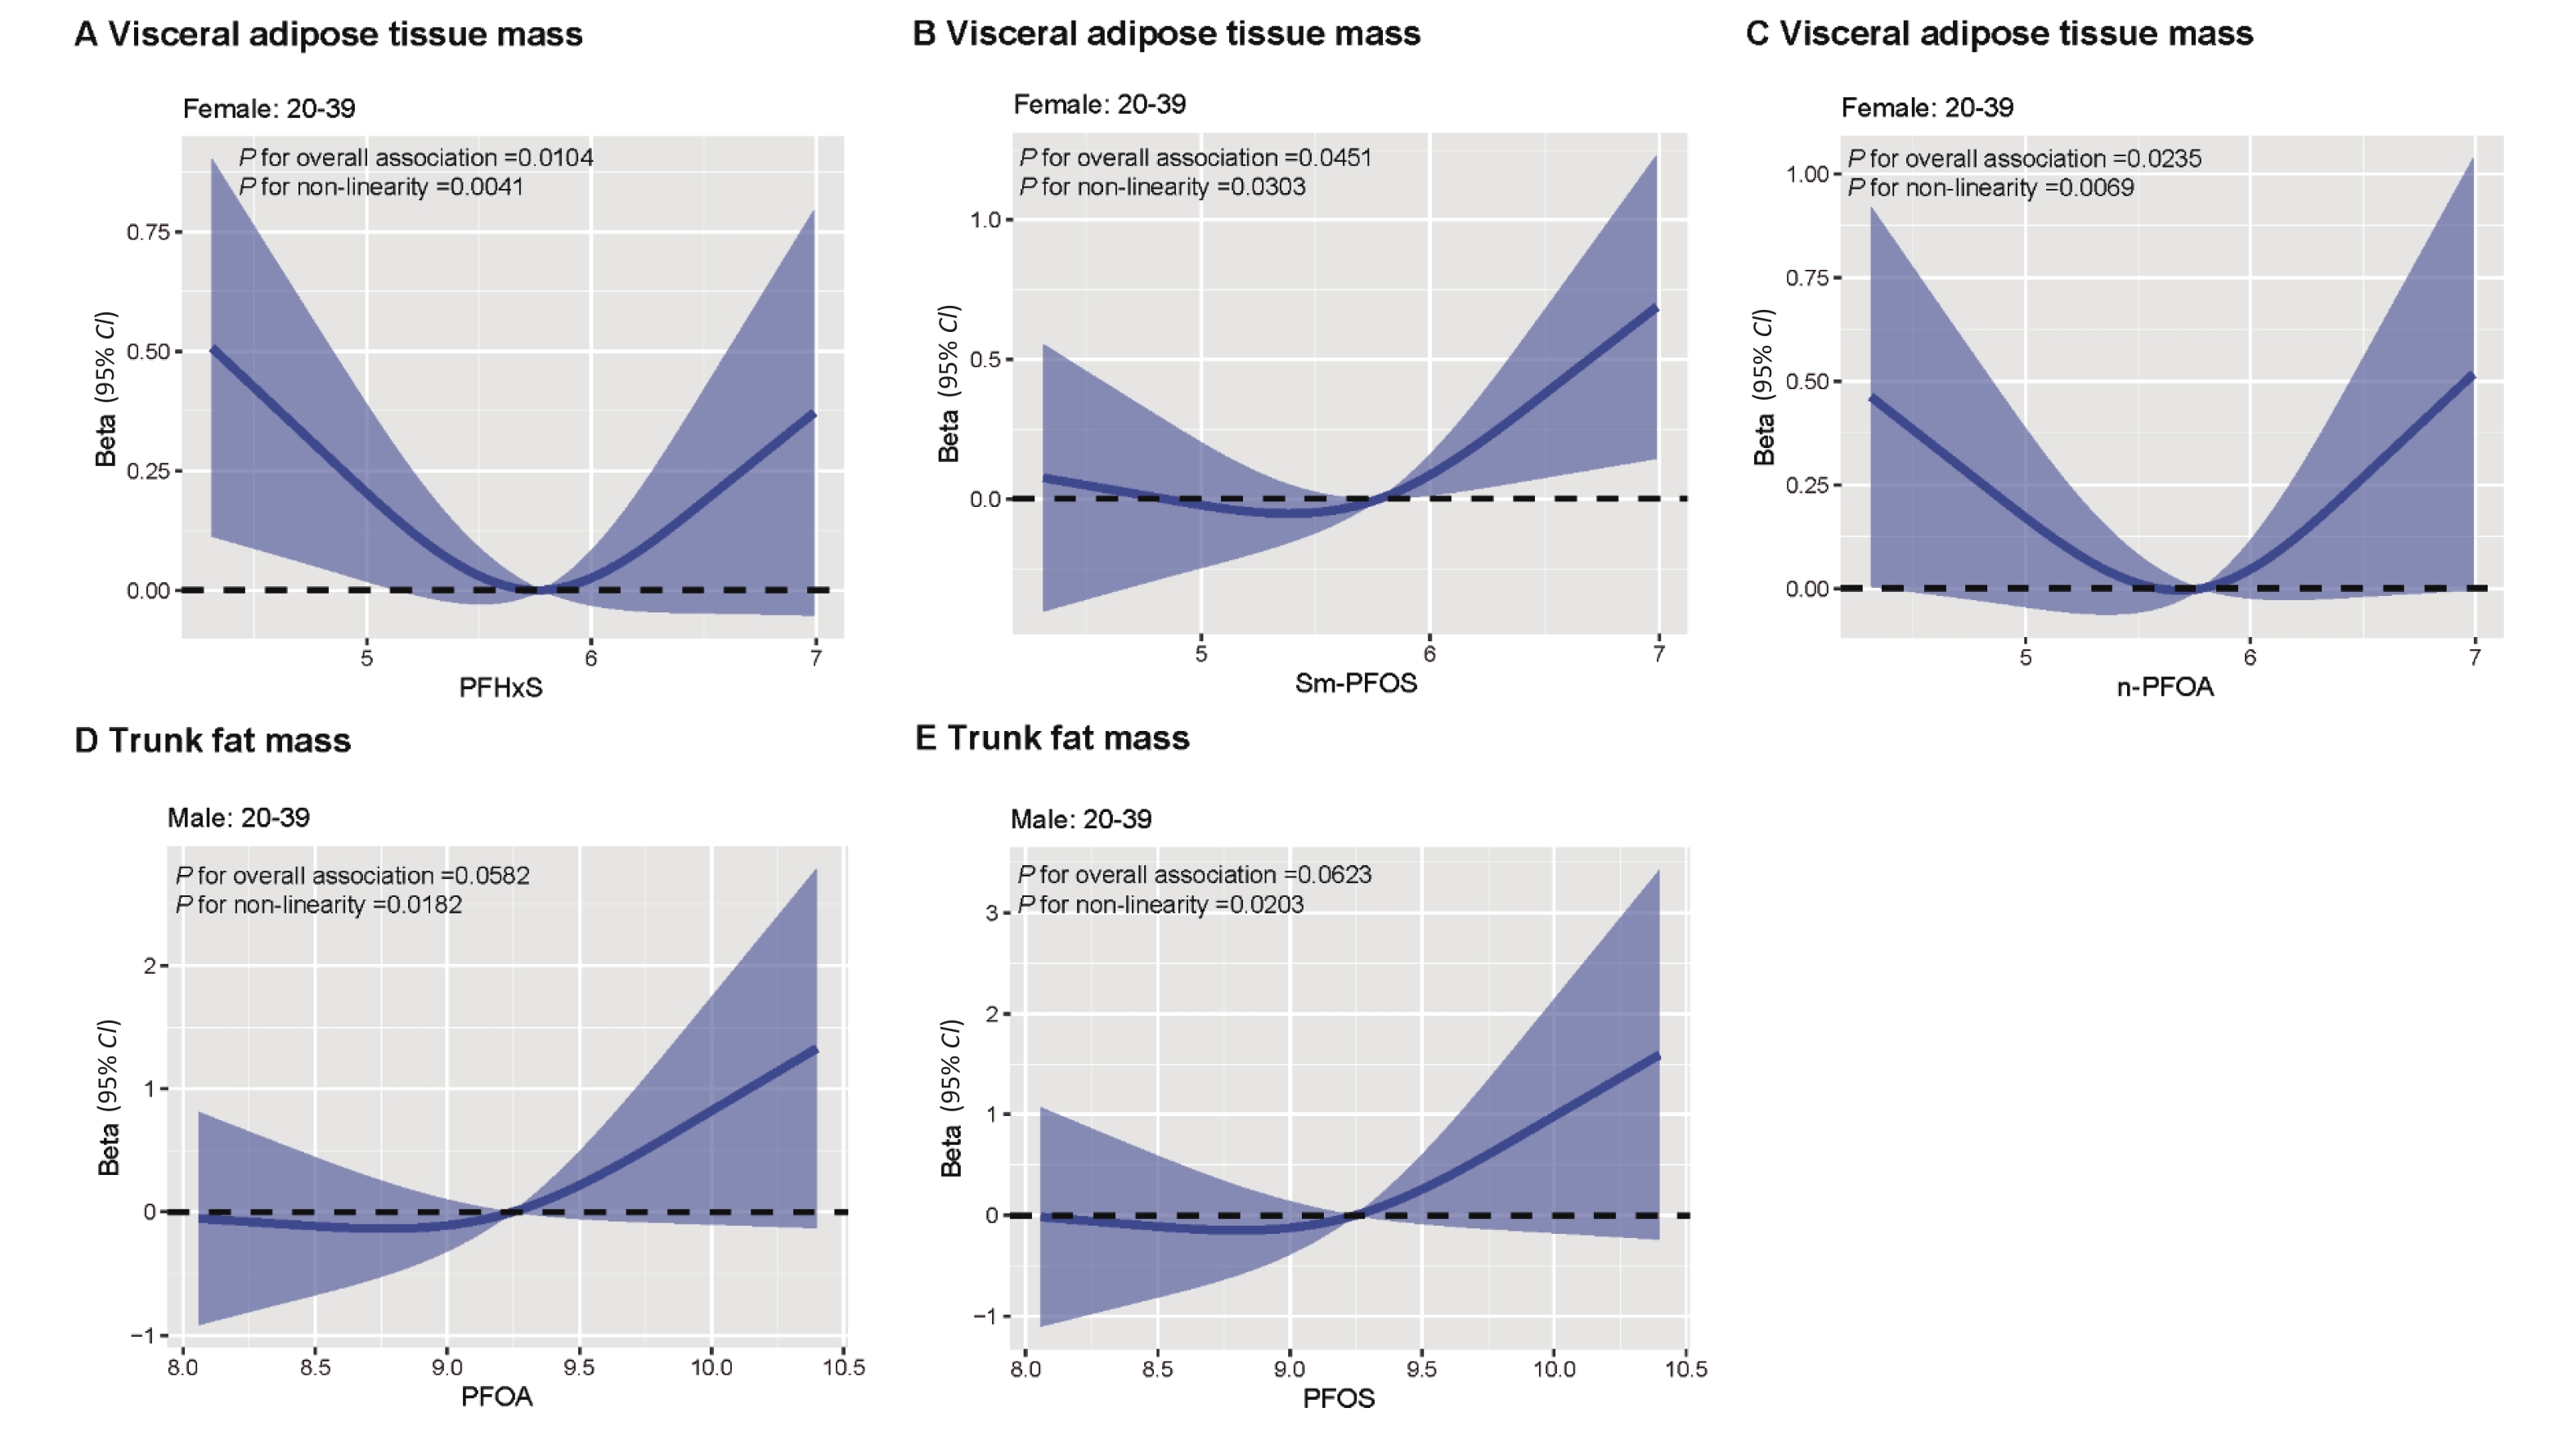
Next, we used restricted cubic splines to visualize the relationship between PFAS exposure and body fat in various regions (Supplementary Figure S2, available in www.besjournal.com). We found that both PFOA and PFOS have nonlinear associations with TR in men aged 20-39 years, with TR relatively flat at first and then increasing rapidly until PFOA exposure of approximately 9.25 µg/dL (P values for nonlinearity were 0.0182 and 0.0203, respectively). In women aged 20-39 years, PFHxS, n-PFOA and Sm-PFOS were nonlinearly associated with VFA (P values for nonlinearity were 0.0041, 0.0069 and 0.0303, respectively). We explored the interaction effects of several indicator variables (smoking status, drinking status, BMI, physical activity and PIR) that may affect the effect of PFAS exposure on each component of body fat (Supplementary Tables S16–S19, available in www.besjournal.com). There was a marked difference in the interaction between PFAS exposure and abdominal fat distribution in subgroups with different smoking habits, physical activity levels and PIR. For males aged 20–39 years, smoking status (P for interaction: AN = 0.022; GY = 0.013; TA = 0.030; TR = 0.018) and physical activity (P for interaction: AN = 0.006; GY = 0.003; TA = 0.007; TR = 0.014) interacted with Sm-PFOS in AN, GY, TA and TR. Moreover, Sm-PFOS interacted with physical activity in SA (P for interaction: 0.005) and smoking status, and the PIR level in VFA (P for interaction: 0.016; 0.008), n-PFOS interacted with smoking status in VFA (P for interaction: 0.015), n-PFOA interacted with physical activity in GY (P for interaction: 0.039), and PFHxS interacted with physical activity in SA (P for interaction: 0.019). In males aged 39–59 years, the effect of PFHxS was modified by smoking status in AN and TA (P for interaction: 0.040; 0.036). n-PFOS interacted with smoking status and the PIR level in VFA (P for interaction: 0.002; 0.016). Sm-PFOS was modified by smoking status in VFA and TR (P for interaction: 0.016; 0.018), physical activity in TR (P for interaction: 0.014), and PIR level in VFA (P for interaction: 0.008). In addition, PFHxS interacted with BMI in VFA (P for interaction: 0.012), and n-PFOS interacted with BMI in SA and TR in females aged 20–39 years (P for interaction: 0.011; 0.044). In females aged 39–59 years, PFOS was modified by physical activity in AN (P for interaction: 0.038), whereas PFHxS was modified by smoking status in AN, GY, and SA (P for interaction: 0.006, 0.003, 0.009), and BMI in VFA (P for interaction: 0.012). Moreover, PFDeA was modified by smoking status in GY (P for interaction: 0.020), and n-PFOS interacted with BMI in TR (P for interaction: 0.044).
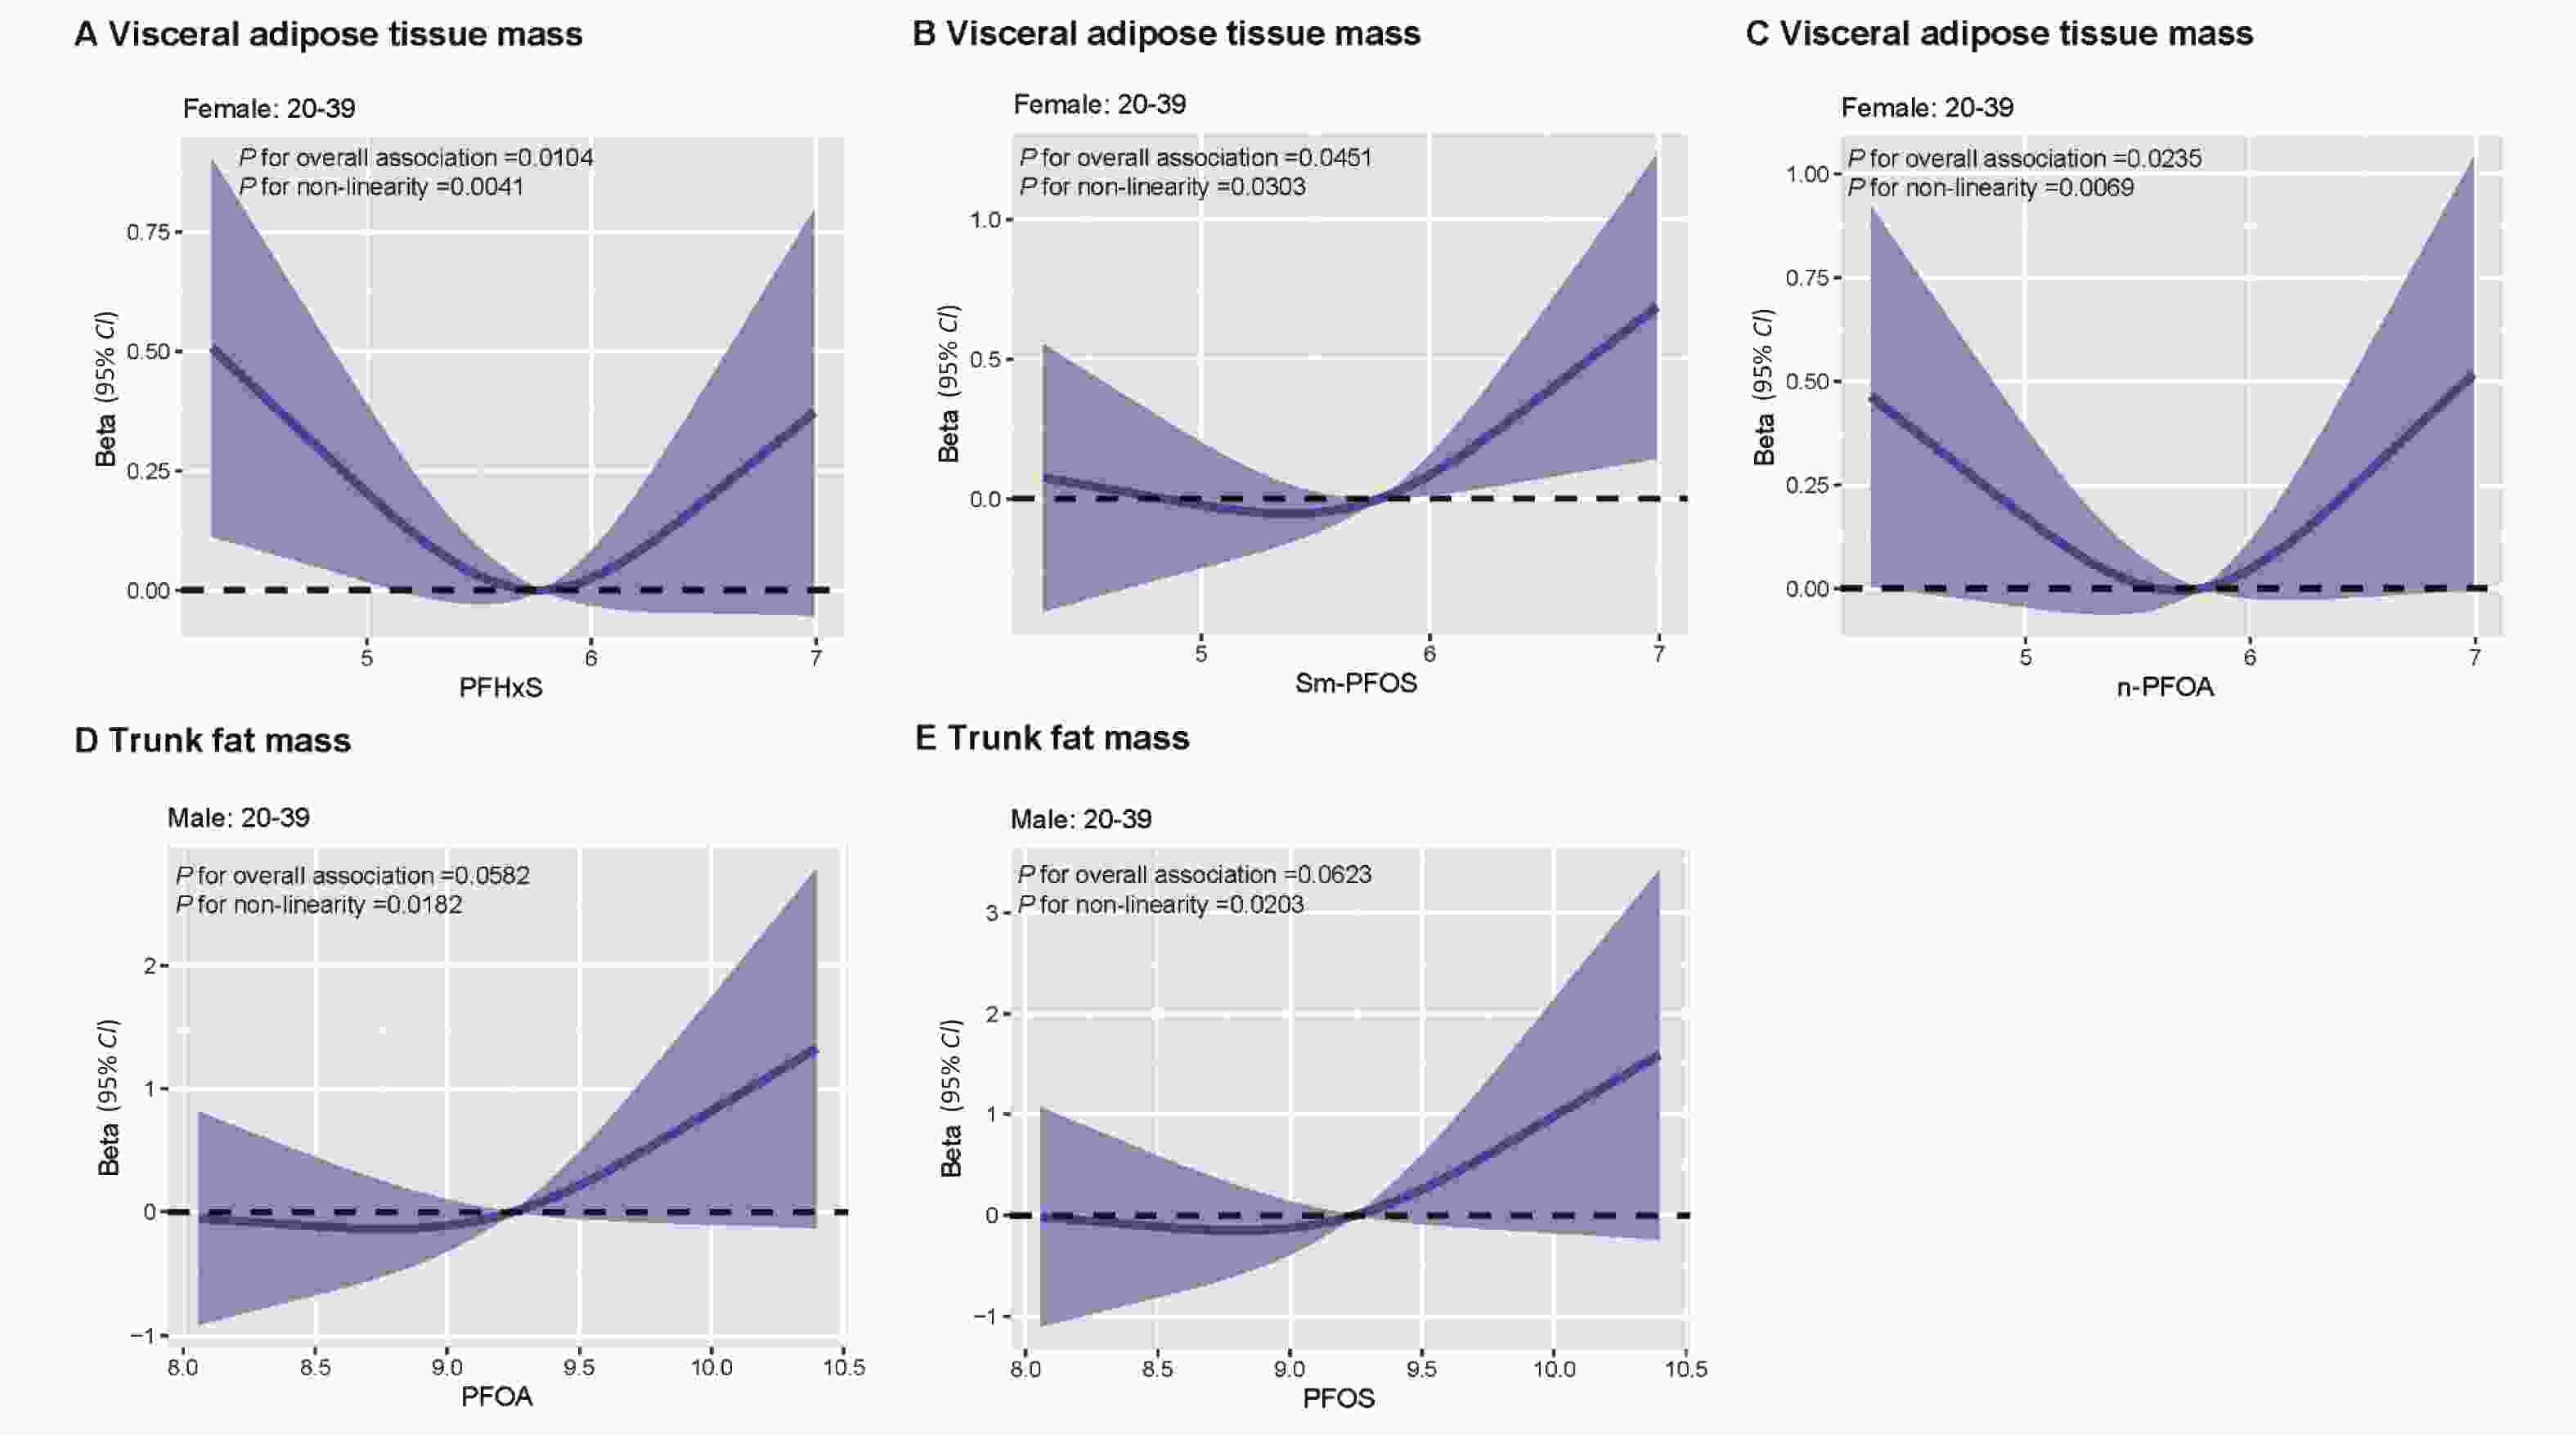
Figure S2. Dose-response association of PFAS level with regional fat depots.
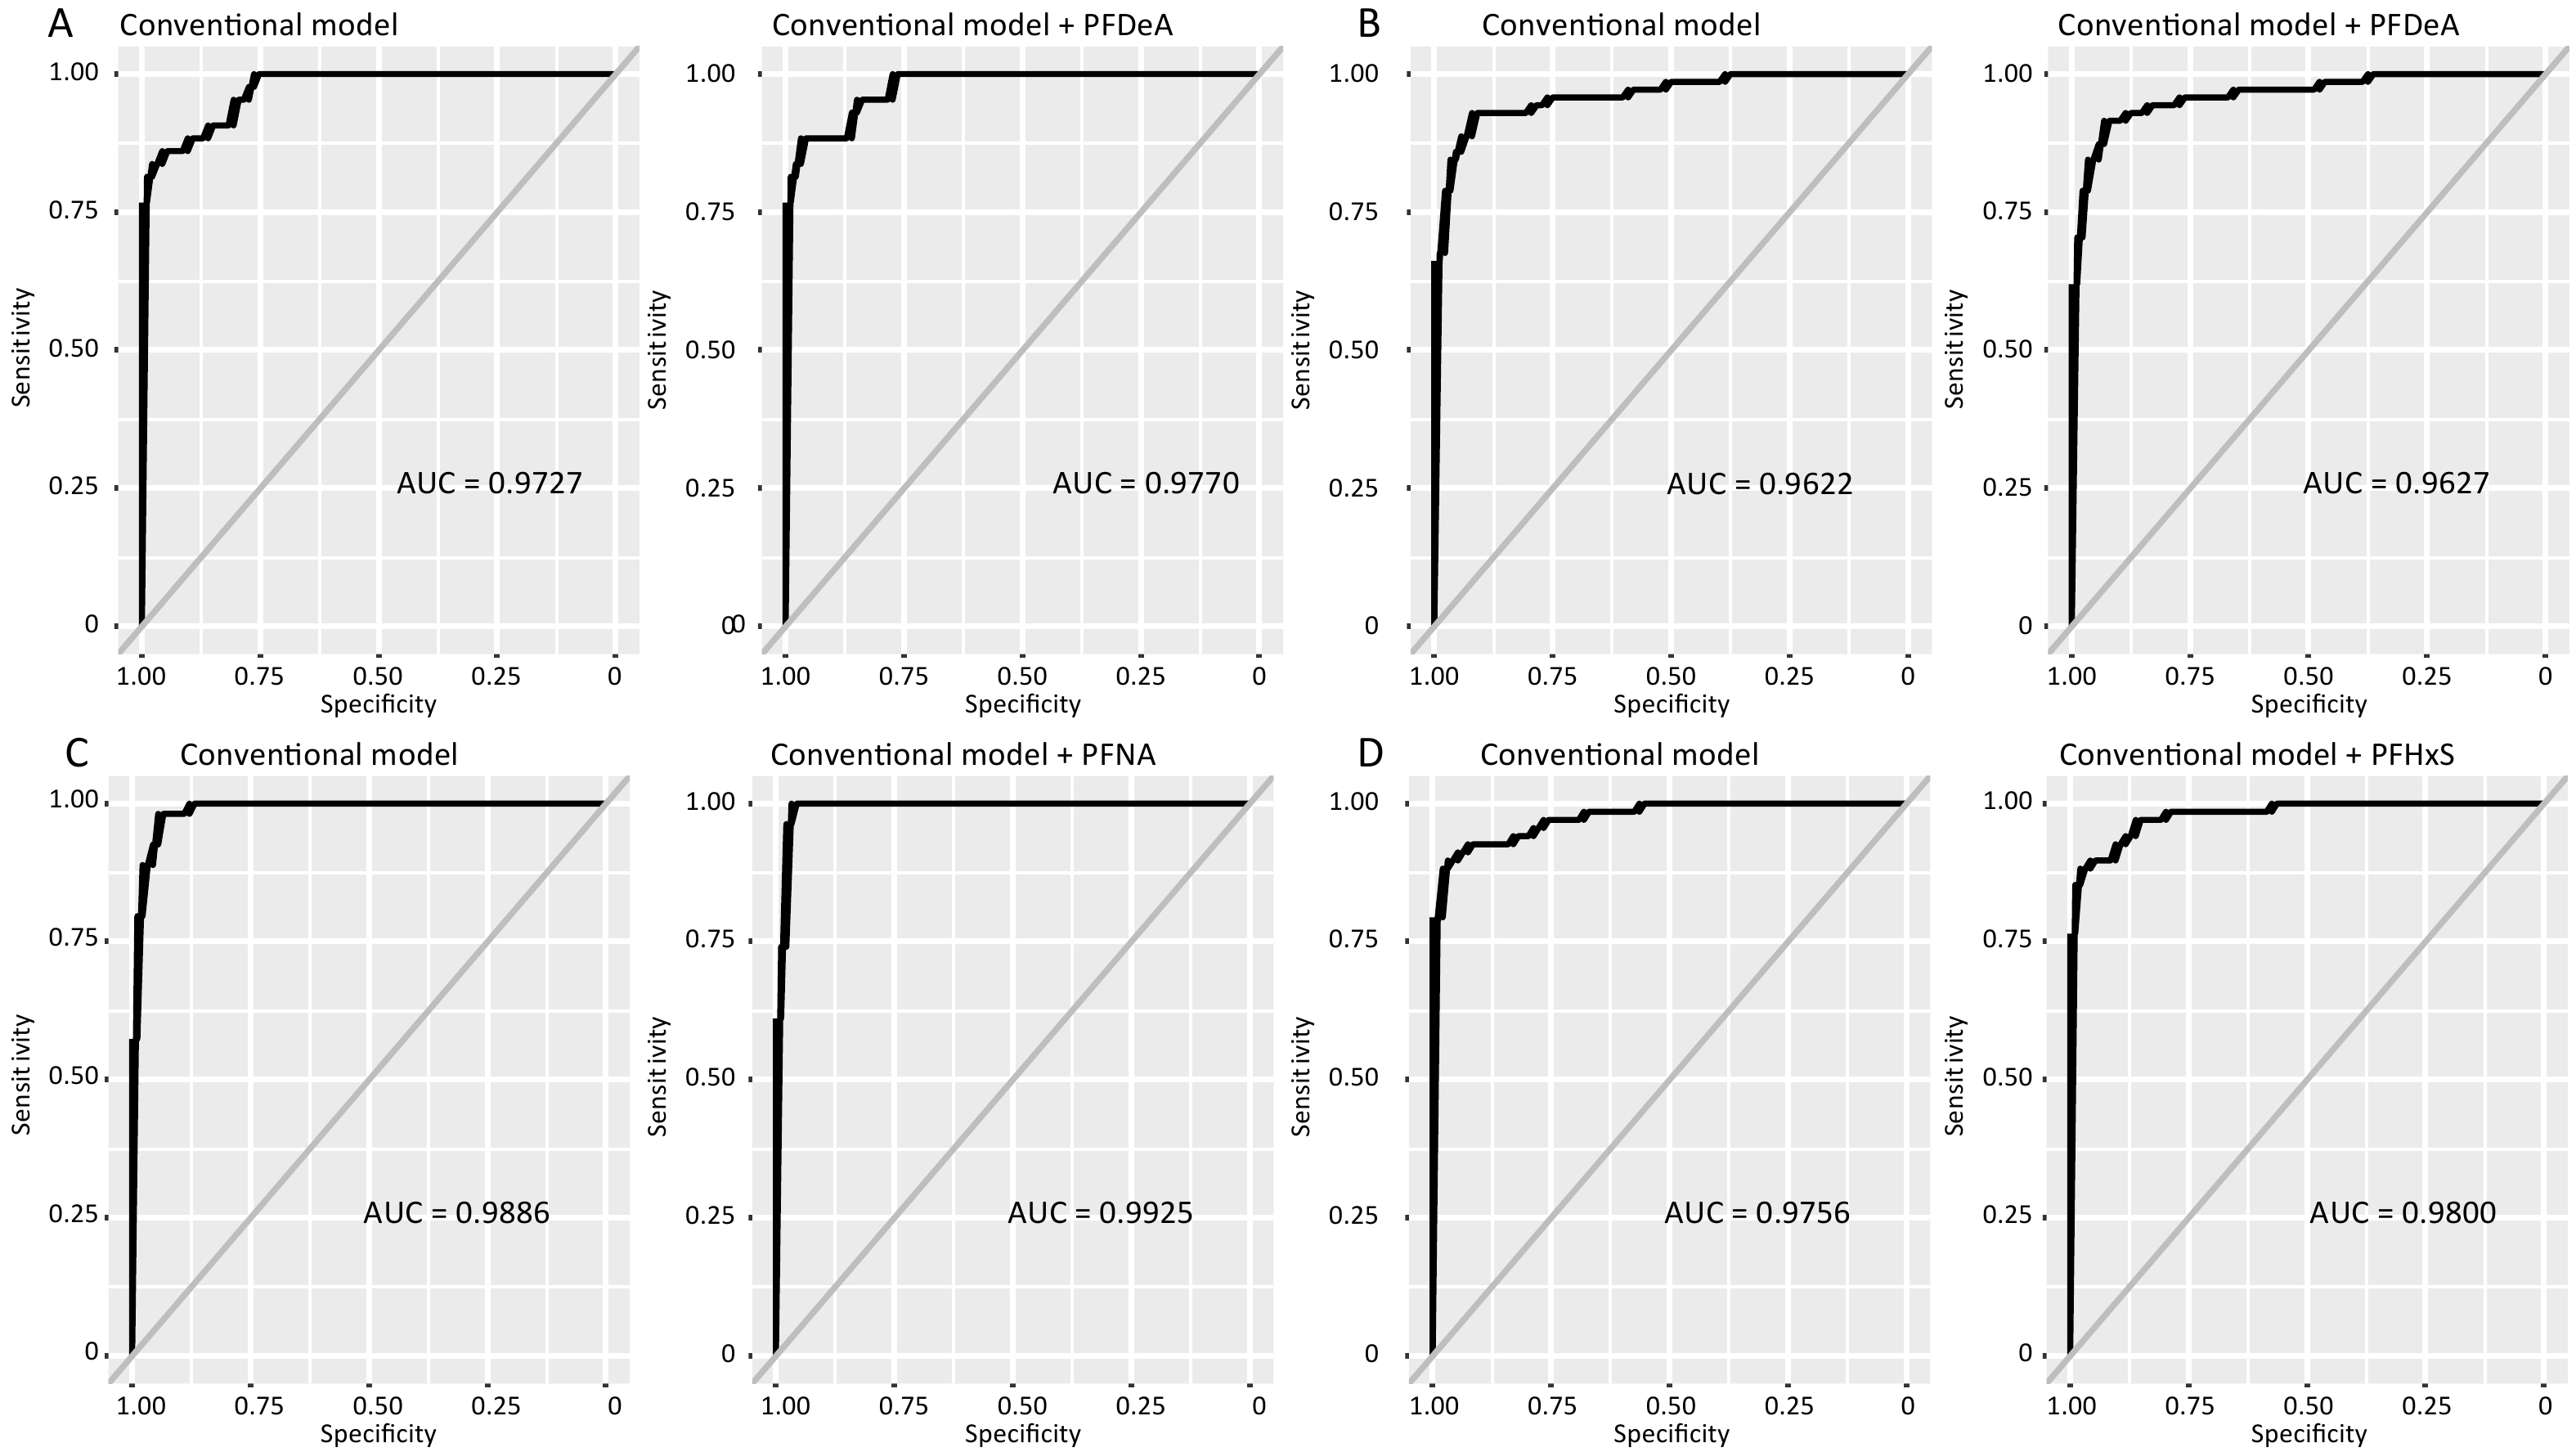
ROC analyses were used to explore the predictive power of PFAS exposure and conventional risk factors for obesity in the age-specific and sex-specific population (Supplementary Table S15, Figure 3, available in www.besjournal.com). The AUCs of the conventional models ranged from 0.9557 to 0.9886. Among the single PFAS exposures, the addition of PFDeA and PFNA increased the AUC to 0.9770 in the male participants (20–39; 39–59 years). Moreover, only PFDeA increased the ability to predict obesity in the younger female population. In women aged 39 to 59 years, the AUC of the prediction model increased to a certain degree after being combined with three single chemicals (PFHxS, PFDeA, and PFNA).
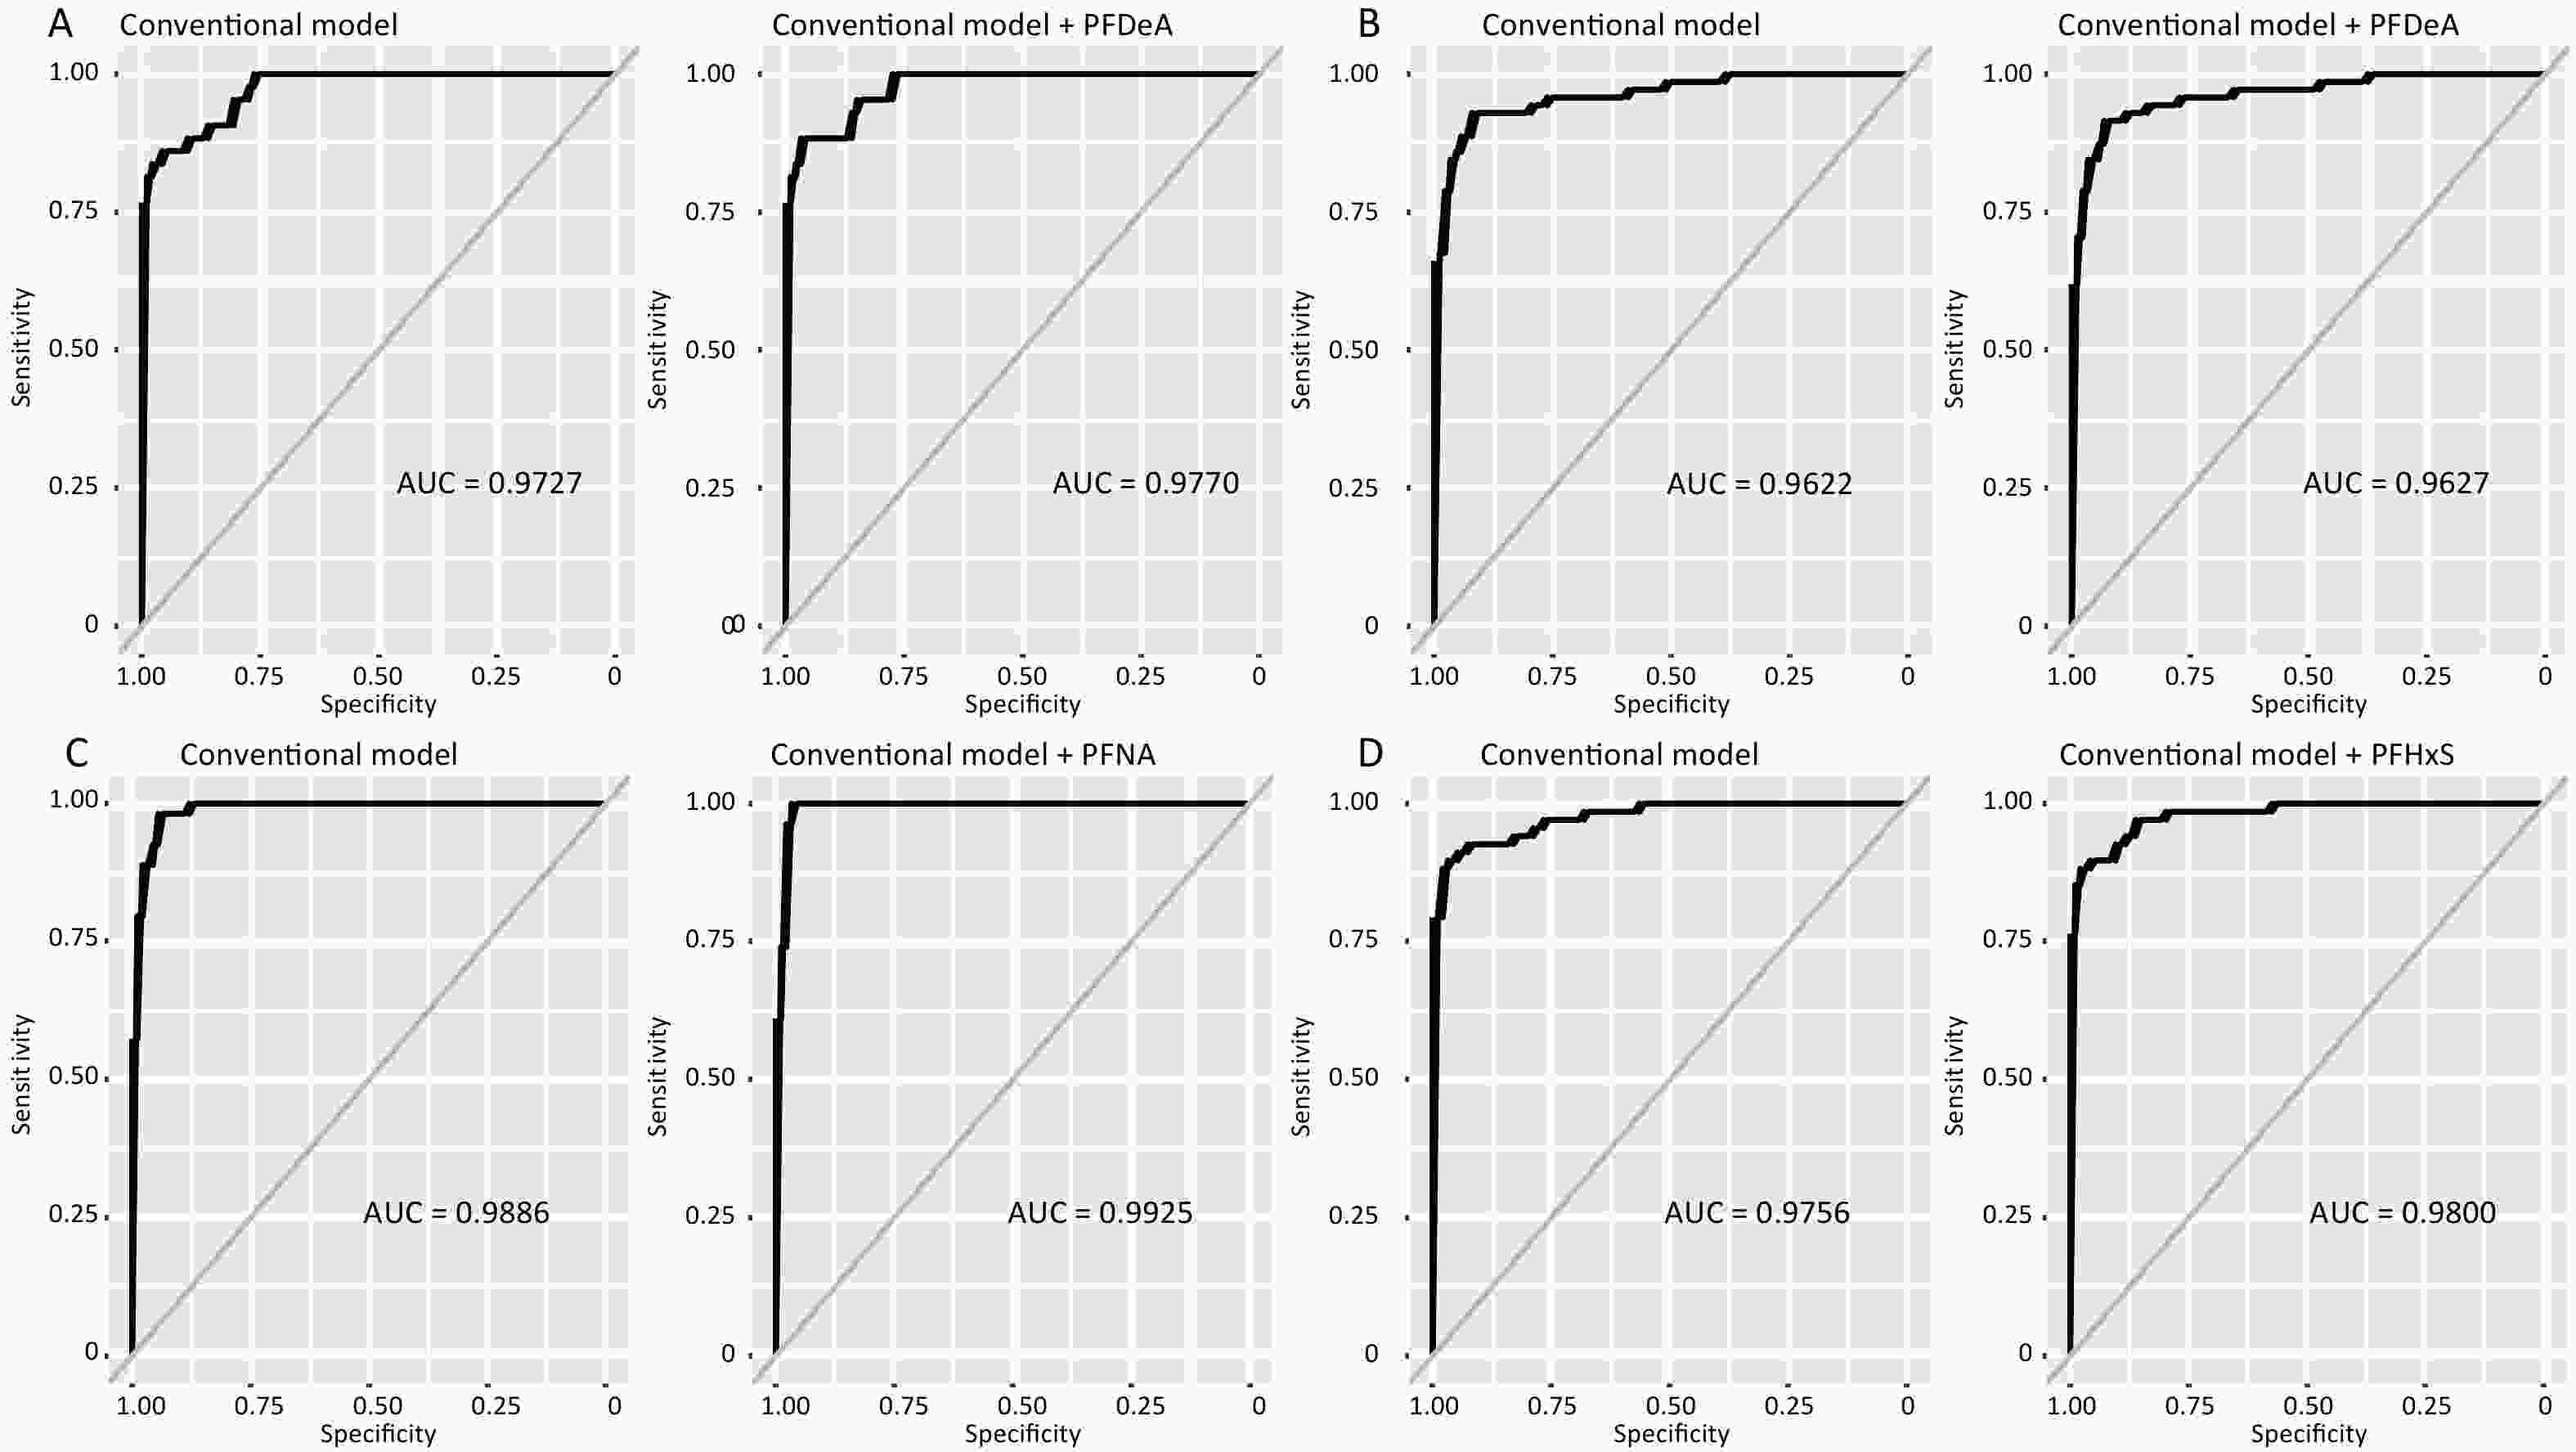
Figure 3. ROC curves comparing the prediction of different models of obesity.
Table S15. Receiver operating characteristic analysis of different PFAS to predict obesity
Dataset Predict model in training dataset AUC Predict model in test dataset AUC Male:20−39 Conventional model 0.9736 Conventional model 0.9727 Conventional model+PFOA 1.0000 Conventional model+PFOA 1.0000 Conventional model+PFOS 0.9961 Conventional model+PFOS 1.0000 Conventional model+PFHxS 0.9737 Conventional model+PFHxS 0.9752 Conventional model+PFDeA 0.9749 Conventional model+PFDeA 0.9770 Conventional model+PFNA 0.9737 Conventional model+PFNA 0.9740 Conventional model+n-PFOA 0.9701 Conventional model+n-PFOA 1.0000 Conventional model+n-PFOS 0.9699 Conventional model+n-PFOS 1.0000 Conventional model+Sm-PFOS 0.9701 Conventional model+Sm-PFOS 1.0000 Male:39−59 Conventional model 0.9557 Conventional model 0.9622 Conventional model+PFOA 0.9874 Conventional model+PFOA 1.0000 Conventional model+PFOS 0.9874 Conventional model+PFOS 1.0000 Conventional model+PFHxS 0.9557 Conventional model+PFHxS 0.9661 Conventional model+PFDeA 0.9560 Conventional model+PFDeA 0.9627 Conventional model+PFNA 0.9555 Conventional model+PFNA 0.9627 Conventional model+n-PFOA 0.9633 Conventional model+n-PFOA 1.0000 Conventional model+n-PFOS 0.9623 Conventional model+n-PFOS 1.0000 Conventional model+Sm-PFOS 0.9628 Conventional model+Sm-PFOS 1.0000 Female:20−39 Conventional model 0.9805 Conventional model 0.9886 Conventional model+PFOA 0.9915 Conventional model+PFOA 1.0000 Conventional model+PFOS 0.9908 Conventional model+PFOS 1.0000 Conventional model+PFHxS 0.9811 Conventional model+PFHxS 0.9884 Conventional model+PFDeA 0.9807 Conventional model+PFDeA 0.9910 Conventional model+PFNA 0.9805 Conventional model+PFNA 0.9925 Conventional model+n-PFOA 0.9733 Conventional model+n-PFOA 0.9953 Conventional model+n-PFOS 0.9738 Conventional model+n-PFOS 1.0000 Conventional model+Sm-PFOS 0.9731 Conventional model+Sm-PFOS 1.0000 Female:39−59 Conventional model 0.9642 Conventional model 0.9756 Conventional model+PFOA 0.9791 Conventional model+PFOA 1.0000 Conventional model+PFOS 0.9785 Conventional model+PFOS 1.0000 Conventional model+PFHxS 0.9643 Conventional model+PFHxS 0.9800 Conventional model+PFDeA 0.9651 Conventional model+PFDeA 0.9767 Conventional model+PFNA 0.9651 Conventional model+PFNA 0.9764 Conventional model+n-PFOA 0.9584 Conventional model+n-PFOA 0.9773 Conventional model+n-PFOS 0.9577 Conventional model+n-PFOS 0.9785 Conventional model+Sm-PFOS 0.9581 Conventional model+Sm-PFOS 0.9779 Note. Conventional model includes marital status, PIR, smoking status, drinking status, waist, diastolic blood pressure (DBP), high−density lipoprotein (HDL), direct HDL−cholesterol, total cholesterol, glycohemoglobin (%), insulin, insulin resistance index (HOMA−IR). -
In this large-scale study based on a representative cohort in the U.S., we comprehensively explored the possible toxic effects of single PFAS exposure, the trait spectrum exposure pattern of PFASs, and the effects of different structural-based PFAS exposures on regional fat accumulation. Specifically, the results demonstrated stronger associations between PFNA and AN in males aged 20–39 years, specific PFASs (PFOS, PFHxS, PFDeA, PFNA, and PFOA) and fat distribution (TR, AN, TA, and VFA) in females aged 39–59 years. Furthermore, we found that long-chain PFCAs and short-chain PFSAs were associated with body fat. Additionally, in people with a normal BMI, exposure to PFOA, PFHxS, PFNA, n-PFOS, and Sm-PFOS may lead to increased body fat. Combinations containing PFOS and/or PFOA as exposure traits were more likely to be positively associated with abdominal fat in women aged 39–59 years. These findings suggest that PFAS exposure confers a differential risk of fat depots in different regions between males and females, a notion that is supported by findings from other exposure studies in animal models[27-29].
Previous studies have focused mainly on the potential adverse effects caused by prenatal exposure to PFASs on childhood adiposity[30-36]. In addition, several studies have explored the effects of childhood/adolescent PFAS exposure on childhood/adolescent obesity[19,37]. In research on middle-aged women, Park et.al found that total PFOS and PFOA were related to greater fat mass at baseline[38]. A prospective cohort study conducted in the Diabetes Prevention Program trial revealed that the subcutaneous fat area was positively associated with PFOS and PFOA. A positive correlation between Me-PFOSA-AcOH and visceral fat was also found. Moreover, no significant associations were found between PFOA and adiposity in a study population consisting of 102 young adults[39]. Most recently, another study measured five PFASs (PFOS, PFOA, PFHxS, PFNA, and PFDA) in 321 participants aged over 50 years and reported that PFDA and PFNA exposure were negatively associated with subcutaneous fat, which was reflected mainly in the arm, trunk and hip regions in females, whereas no significant correlation was detected in males[40].
Owing to the limited number of detected PFASs, our study did not comprehensively assess the effects of the different structures of PFASs on regional fat; however, we found that short-chain PFSAs (PFHxS) and long-chain PFCAs (PFDeA, PFNA, and n-PFOA) have strong effects on regional fat. Previous studies have reported differential health effects associated with linear versus branched PFAS exposure[41,42]. In part, the difference between the effects of PFAS isomers may be explained by their toxicokinetic properties, which include differential bioaccumulation and toxicity[43,44]. Available evidence suggests that the toxicity of PFASs increases with increasing carbon chain length[45,46]. It is believed that long-chain PFASs result in greater bioaccumulation in the body[47,48]. Whether short-chain or long-chain PFASs have biological mechanisms that differ in body fat accumulation and whether they may exert competitive or synergistic effects deserve further study.
The trait spectrum exposure pattern analysis revealed that combinations containing PFOS and/or PFOA as exposure traits were more likely to be positively associated with abdominal fat in women aged 39–59 years. Long-chain PFASs have been reported to be widespread in the United States, although short-chain PFASs are increasingly being used to replace long-chain PFASs. Short-chain PFASs are still rarely detected in NHANES participants, and at comparably low concentrations, owing to the relatively short half-lives of these PFASs, they can be effectively eliminated in the urine[49]. The toxic effects of the two most studied long-chain PFASs, PFOS and PFOA, still require close attention.
In general, we found similar results to those reported in previous studies. This study overcomes the limitations of previous studies, which were limited to special populations, measured fewer types of chemicals/body fat, and did not consider the high collinearity between regional fat depots. The results of our study confirmed that PFAS exposure affects fat distribution. Investigation of the possible mechanisms behind the health risks associated with PFAS exposure is imperative.
The underlying mechanisms for the different effects of PFASs on fat stored in different regions are still unclear. However, studies have justified the biological plausibility of the potential effect on regional fat depots caused by PFAS exposure. The good binding of PFASs to the nuclear receptors peroxisome proliferator-activated receptor (PPAR) alpha and gamma may influence the action of PFASs on fat tissue, while PPAR-α in mice, rats, and humans can be stimulated by PFOA and PFOS, with human PPAR-α demonstrating the highest sensitivity to perfluorooctanoic acid and perfluorooctane sulfonic acid[50]. In addition to regulating lipid metabolism, PPARs play a role in adipogenesis and inflammation[51]. Furthermore, an animal study demonstrated that PFAS exposure disrupted leptin signaling pathways, leading to increased weight in middle-aged mice[52].
Moreover, the explanation for the sex-specific toxicology caused by PFASs on fat depots seems to be reasonable. Kato et.al have shown that PFAS elimination is sex dependent[53]. PFASs may also affect sex hormones[54]. PFASs have been shown to adversely affect estradiol (E2) and follicle stimulating hormone (FSH)[55,56]. Energy expenditure and oxygen consumption increased in mice in which FSH was blocked, which was accompanied by a decrease in the metabolic rate and body fat content[57]. Therefore, alterations in FSH are a possible mechanism of PFAS-induced obesity toxicity, as PFASs are associated with elevated FSH levels and accelerated ovarian aging in middle-aged women[56].
Moreover, the mechanism by which PFASs cause fat accumulation in different regions has not been elucidated. Research has suggested that site-specific developmental genes, such as HOXA6, HOXA5, and TBX5 in abdominal subcutaneous adipose tissue and HOTAIR, SHOX2 and HOXC11 in gluteal-femoral adipose tissue, determine the functional differences between upper- and lower-body tissues[58]. Future research should further explore and verify the possible mechanisms of fat accumulation in different parts caused by different PFAS exposures.
The major strengths of this study are as follows. First, the study was conducted in a nationally representative sample of U.S. citizens. Second, considering the multicollinearity of the regional fat depots, we explored the associations with the fat distribution score. Third, considering the complexity of exposure to PFASs in the environment, we comprehensively evaluated the associations between different PFAS combinations and fat distribution.
This study also has several limitations. First, owing to the cross-sectional nature of the NHANES, causal conclusions could not be drawn. Second, since PFAS exposure was not detected multiple times, the coefficient of variation, etc., cannot be calculated. Third, even though potential confounding variables were adjusted, unmeasured confounding variables existed. Fourth, owing to the limitations of the species and cycles of PFASs detected by the NHANES, we were unable to further assess the mixed effects of PFASs on the outcomes. Fifth, owing to sample size limitations, we did not perform multiple corrections.
In conclusion, this study suggested positive associations between PFASs and regional fat depots. We innovatively investigated the trait spectrum exposure pattern of PFASs and explored the potential toxicity of structurally grouped PFASs on body fat accumulation. Furthermore, we found that fat distribution and PFASs were related in a sex-specific manner. The incorporation of PFHxS, PFDeA and PFNA into the conventional model modestly increased the discrimination ability and significantly improved the reclassification ability of the new model. Future longitudinal studies are warranted to examine the long-term toxicity of PFASs on regional fat mass and the underlying mechanisms involved.
-
NHANES has obtained informed consent from all participants.
-
Table S5. Unadjusted associations from multivariable linear regression models between serum PFAS and regional fat distribution (Model 1)
Variable Trunk fat mass Android fat mass Gynoid fat mass Subcutaneous fat mass Total abdominal fat mass Visceral adipose tissue mass PFOA Male 20−39 −0.01 (−0.16, 0.15) −0.01 (−0.14, 0.13) 0.01 (−0.19, 0.20) −0.01 (−0.13, 0.11) −0.01 (−0.15, 0.12) −0.04 (−0.22, 0.13) 39−59 −0.11 (−0.29, 0.08) −0.10 (−0.27, 0.06) −0.09 (−0.32, 0.14) −0.06 (−0.22, 0.10) −0.08 (−0.26, 0.10) −0.12 (−0.31, 0.06) Female 20−39 −0.17 (−0.32, −0.01) −0.14 (−0.27, −0.02) −0.25 (−0.47, −0.03) −0.17 (−0.33, −0.01) −0.19 (−0.34, −0.03) −0.19 (−0.30, −0.07) 39−59 −0.07 (−0.29, 0.14) −0.09 (−0.28, 0.10) −0.02 (−0.31, 0.27) −0.12 (−0.36, 0.12) −0.11 (−0.34, 0.12) −0.04 (−0.21, 0.12) PFOS Male 20−39 0.07 (−0.13, 0.28) 0.06 (−0.12, 0.23) 0.10 (−0.16, 0.35) 0.03 (−0.13, 0.18) 0.04 (−0.14, 0.22) 0.07 (−0.16, 0.31) 39−59 −0.20 (−0.45, 0.04) −0.19 (−0.41, 0.02) −0.30 (−0.61, 0.00) −0.11 (−0.32, 0.11) −0.16 (−0.40, 0.07) −0.27 (−0.51, −0.02) Female 20−39 −0.04 (−0.24, 0.16) −0.02 (−0.19, 0.15) −0.05 (−0.33, 0.24) −0.02 (−0.23, 0.20) −0.04 (−0.25, 0.17) −0.08 (−0.24, 0.08) 39−59 0.02 (−0.28, 0.32) 0.01 (−0.24, 0.27) 0.21 (−0.19, 0.60) 0.03 (−0.29, 0.36) 0.04 (−0.28, 0.35) 0.04 (−0.19, 0.26) PFHxS Male 20−39 0.01 (−0.09, 0.11) 0.01 (−0.07, 0.09) 0.05 (−0.07, 0.17) 0.00 (−0.07, 0.08) 0.00 (−0.09, 0.08) −0.02 (−0.13, 0.09) 39−59 −0.09 (−0.20, 0.02) −0.08 (−0.17, 0.02) −0.06 (−0.19, 0.07) −0.05 (−0.15, 0.04) −0.08 (−0.18, 0.02) −0.13 (−0.24, −0.02) Female 20−39 −0.16 (−0.28, −0.05) −0.16 (−0.25, −0.06) −0.18 (−0.34, −0.02) −0.19 (−0.31, −0.07) −0.20 (−0.32, −0.08) −0.19 (−0.28, −0.10) 39−59 0.05 (−0.08, 0.17) 0.05 (−0.05, 0.16) 0.00 (−0.15, 0.16) 0.02 (−0.11, 0.15) 0.04 (−0.09, 0.17) 0.07 (−0.03, 0.16) PFDeA Male 20−39 −0.07 (−0.14, 0.01) −0.06 (−0.13, 0.00) −0.12 (−0.21, −0.03) −0.06 (−0.11, 0.00) −0.07 (−0.13, 0.00) −0.04 (−0.12, 0.04) 39−59 −0.33 (−0.45, −0.21) −0.27 (−0.38, −0.17) −0.37 (−0.51, −0.22) −0.22 (−0.32, −0.12) −0.27 (−0.38, −0.16) −0.30 (−0.42, −0.19) Female 20−39 −0.21 (−0.29, −0.12) −0.18 (−0.25, −0.11) −0.29 (−0.41, −0.17) −0.23 (−0.32, −0.14) −0.23 (−0.31, −0.14) −0.16 (−0.23, −0.10) 39−59 −0.36 (−0.47, −0.25) −0.29 (−0.39, −0.20) −0.40 (−0.54, −0.27) −0.38 (−0.49, −0.26) −0.36 (−0.47, −0.24) −0.18 (−0.27, −0.10) PFNA Male 20−39 0.02 (−0.06, 0.10) 0.02 (−0.05, 0.09) 0.02 (−0.08, 0.12) 0.01 (−0.05, 0.08) 0.02 (−0.05, 0.09) 0.04 (−0.05, 0.13) 39−59 −0.17 (−0.28, −0.06) −0.14 (−0.23, −0.05) −0.20 (−0.33, −0.07) −0.11 (−0.20, −0.02) −0.14 (−0.24, −0.04) −0.17 (−0.28, −0.07) Female 20−39 −0.19 (−0.29, −0.09) −0.15 (−0.24, −0.07) −0.22 (−0.36, −0.08) −0.19 (−0.30, −0.09) −0.2 (−0.31, −0.09) −0.17 (−0.25, −0.09) 39−59 −0.13 (−0.24, −0.02) −0.09 (−0.18, 0.00) −0.21 (−0.34, −0.07) −0.14 (−0.25, −0.02) −0.11 (−0.23, 0.00) −0.03 (−0.11, 0.05) n-PFOA Male 20−39 −0.11 (−0.22, −0.01) −0.10 (−0.2, −0.01) −0.16 (−0.30, −0.03) −0.10 (−0.18, −0.02) −0.11 (−0.20, −0.01) −0.03 (−0.16, 0.09) 39−59 −0.06 (−0.20, 0.08) −0.06 (−0.17, 0.06) −0.05 (−0.21, 0.11) −0.04 (−0.15, 0.07) −0.07 (−0.19, 0.06) −0.12 (−0.26, 0.01) Female 20−39 −0.29 (−0.43, −0.15) −0.26 (−0.38, −0.15) −0.40 (−0.59, −0.20) −0.35 (−0.49, −0.20) −0.34 (−0.49, −0.20) −0.24 (−0.35, −0.13) 39−59 −0.06 (−0.22, 0.10) −0.06 (−0.19, 0.07) −0.23 (−0.42, −0.04) −0.12 (−0.29, 0.04) −0.09 (−0.25, 0.07) 0.01 (−0.11, 0.13) n-PFOS Male 20−39 −0.17 (−0.29, −0.05) −0.16 (−0.26, −0.05) −0.22 (−0.37, −0.07) −0.15 (−0.24, −0.05) −0.17 (−0.27, −0.06) −0.14 (−0.28, 0.00) 39−59 −0.22 (−0.40, −0.04) −0.21 (−0.37, −0.06) −0.24 (−0.45, −0.02) −0.20 (−0.34, −0.05) −0.24 (−0.40, −0.07) −0.25 (−0.43, −0.07) Female 20−39 −0.23 (−0.37, −0.08) −0.20 (−0.33, −0.08) −0.31 (−0.51, −0.10) −0.24 (−0.40, −0.09) −0.24 (−0.39, −0.09) −0.17 (−0.29, −0.05) 39−59 −0.26 (−0.45, −0.07) −0.18 (−0.33, −0.02) −0.33 (−0.55, −0.11) −0.27 (−0.47, −0.08) −0.24 (−0.43, −0.05) −0.07 (−0.21, 0.08) Sm-PFOS Male 20−39 −0.06 (−0.18, 0.05) −0.06 (−0.16, 0.05) −0.07 (−0.22, 0.07) −0.07 (−0.16, 0.02) −0.07 (−0.18, 0.03) −0.02 (−0.16, 0.11) 39−59 0.03 (−0.13, 0.18) −0.02 (−0.15, 0.11) 0.00 (−0.18, 0.18) −0.03 (−0.15, 0.10) −0.04 (−0.18, 0.10) −0.08 (−0.23, 0.07) Female 20−39 −0.09 (−0.22, 0.05) −0.08 (−0.19, 0.03) −0.09 (−0.27, 0.10) −0.11 (−0.25, 0.03) −0.1 (−0.24, 0.04) −0.06 (−0.16, 0.05) 39−59 0.08 (−0.10, 0.25) 0.08 (−0.07, 0.23) −0.01 (−0.22, 0.20) 0.04 (−0.15, 0.22) 0.07 (−0.11, 0.25) 0.10 (−0.03, 0.23) Table S6. Adjusted associations from multivariable linear regression models between serum PFAS and regional fat distribution (Model 2)
Variable Trunk fat mass Android fat mass Gynoid fat mass Subcutaneous fat mass Total abdominal fat mass Visceral adipose tissue mass PFOA Male 20−39 0.02 (−0.13, 0.17) 0.02 (−0.11, 0.15) 0.02 (−0.17, 0.21) 0.01 (−0.1, 0.13) 0.02 (−0.12, 0.15) 0.00 (−0.18, 0.18) 39−59 −0.11 (−0.30, 0.08) −0.10 (−0.27, 0.08) −0.08 (−0.32, 0.15) −0.06 (−0.23, 0.11) −0.08 (−0.26, 0.11) −0.11 (−0.31, 0.08) Female 20−39 −0.08 (−0.24, 0.07) −0.08 (−0.21, 0.05) −0.16 (−0.38, 0.05) −0.08 (−0.25, 0.08) −0.10 (−0.26, 0.06) −0.12 (−0.24, 0.01) 39−59 −0.04 (−0.26, 0.19) −0.05 (−0.24, 0.15) 0.04 (−0.26, 0.33) −0.06 (−0.31, 0.18) −0.05 (−0.29, 0.18) −0.01 (−0.18, 0.16) PFOS Male 20−39 0.10 (−0.10, 0.31) 0.09 (−0.08, 0.27) 0.11 (−0.14, 0.37) 0.05 (−0.1, 0.21) 0.08 (−0.11, 0.26) 0.13 (−0.11, 0.37) 39−59 −0.16 (−0.41, 0.09) −0.15 (−0.37, 0.08) −0.25 (−0.55, 0.05) −0.07 (−0.29, 0.15) −0.11 (−0.36, 0.13) −0.20 (−0.45, 0.06) Female 20−39 0.11 (−0.10, 0.32) 0.10 (−0.07, 0.27) 0.10 (−0.18, 0.39) 0.14 (−0.08, 0.35) 0.12 (−0.09, 0.33) 0.04 (−0.12, 0.21) 39−59 0.08 (−0.23, 0.39) 0.07 (−0.20, 0.34) 0.26 (−0.14, 0.67) 0.1 (−0.24, 0.45) 0.11 (−0.22, 0.44) 0.09 (−0.14, 0.33) PFHxS Male 20−39 0.01 (−0.09, 0.11) 0.01 (−0.08, 0.09) 0.05 (−0.08, 0.17) 0 (−0.08, 0.07) 0.00 (−0.09, 0.08) −0.02 (−0.14, 0.09) 39−59 −0.10 (−0.21, 0.01) −0.09 (−0.18, 0.01) −0.07 (−0.20, 0.06) −0.06 (−0.16, 0.03) −0.09 (−0.19, 0.01) −0.15 (−0.26, −0.03) Female 20−39 −0.13 (−0.25, −0.01) −0.13 (−0.23, −0.03) −0.15 (−0.31, 0.01) −0.16 (−0.28, −0.03) −0.17 (−0.29, −0.05) −0.16 (−0.25, −0.07) 39−59 0.06 (−0.07, 0.19) 0.07 (−0.04, 0.17) 0.02 (−0.14, 0.18) 0.04 (−0.09, 0.18) 0.07 (−0.07, 0.20) 0.09 (−0.01, 0.18) PFDeA Male 20−39 −0.05 (−0.12, 0.02) −0.05 (−0.11, 0.01) −0.11 (−0.20, −0.02) −0.05 (−0.1, 0.01) −0.05 (−0.12, 0.01) −0.01 (−0.09, 0.08) 39−59 −0.27 (−0.39, −0.15) −0.22 (−0.32, −0.12) −0.33 (−0.47, −0.19) −0.18 (−0.28, −0.08) −0.21 (−0.32, −0.10) −0.20 (−0.32, −0.09) Female 20−39 −0.15 (−0.23, −0.06) −0.13 (−0.20, −0.06) −0.22 (−0.34, −0.11) −0.17 (−0.26, −0.08) −0.17 (−0.25, −0.08) −0.11 (−0.18, −0.04) 39−59 −0.26 (−0.37, −0.16) −0.22 (−0.31, −0.13) −0.34 (−0.47, −0.21) −0.3 (−0.41, −0.19) −0.26 (−0.37, −0.15) −0.09 (−0.17, −0.01) PFNA Male 20−39 0.03 (−0.05, 0.11) 0.03 (−0.04, 0.09) 0.03 (−0.07, 0.12) 0.02 (−0.04, 0.08) 0.03 (−0.05, 0.10) 0.06 (−0.04, 0.15) 39−59 −0.12 (−0.22, −0.01) −0.1 (−0.19, 0.00) −0.16 (−0.28, −0.03) −0.07 (−0.16, 0.02) −0.09 (−0.19, 0.01) −0.11 (−0.21, 0.00) Female 20−39 −0.14 (−0.24, −0.04) −0.12 (−0.20, −0.03) −0.18 (−0.32, −0.03) −0.15 (−0.26, −0.04) −0.15 (−0.26, −0.04) −0.12 (−0.2, −0.04) 39−59 −0.06 (−0.16, 0.05) −0.02 (−0.12, 0.07) −0.15 (−0.29, −0.02) −0.07 (−0.18, 0.05) −0.03 (−0.15, 0.08) 0.04 (−0.04, 0.12) n-PFOA Male 20−39 −0.10 (−0.21, 0.01) −0.09 (−0.19, 0.00) −0.15 (−0.29, −0.02) −0.09 (−0.18, −0.01) −0.1 (−0.2, 0.00) −0.01 (−0.14, 0.12) 39−59 −0.06 (−0.20, 0.08) −0.05 (−0.17, 0.07) −0.07 (−0.23, 0.09) −0.04 (−0.15, 0.07) −0.06 (−0.18, 0.07) −0.10 (−0.23, 0.04) Female 20−39 −0.25 (−0.39, −0.12) −0.23 (−0.35, −0.12) −0.34 (−0.53, −0.14) −0.31 (−0.45, −0.16) −0.30 (−0.44, −0.16) −0.21 (−0.32, −0.10) 39−59 −0.01 (−0.17, 0.15) −0.02 (−0.15, 0.11) −0.21 (−0.39, −0.02) −0.09 (−0.25, 0.07) −0.05 (−0.21, 0.11) 0.06 (−0.05, 0.18) n-PFOS Male 20−39 −0.14 (−0.26, −0.02) −0.13 (−0.23, −0.02) −0.19 (−0.34, −0.03) −0.12 (−0.22, −0.03) −0.14 (−0.25, −0.03) −0.09 (−0.24, 0.05) 39−59 −0.19 (−0.38, −0.01) −0.19 (−0.34, −0.03) −0.22 (−0.43, −0.01) −0.18 (−0.33, −0.03) −0.21 (−0.37, −0.04) −0.20 (−0.38, −0.02) Female 20−39 −0.17 (−0.32, −0.02) −0.16 (−0.28, −0.03) −0.24 (−0.45, −0.04) −0.18 (−0.34, −0.03) −0.19 (−0.34, −0.03) −0.14 (−0.26, −0.02) 39−59 −0.18 (−0.37, 0.00) −0.12 (−0.27, 0.03) −0.28 (−0.50, −0.06) −0.22 (−0.41, −0.03) −0.17 (−0.36, 0.02) 0.01 (−0.13, 0.15) Sm-PFOS Male 20−39 −0.06 (−0.18, 0.07) −0.05 (−0.15, 0.06) −0.07 (−0.22, 0.08) −0.06 (−0.16, 0.03) −0.06 (−0.17, 0.04) 0.00 (−0.14, 0.14) 39−59 0.01 (−0.14, 0.17) −0.02 (−0.16, 0.11) −0.01 (−0.19, 0.18) −0.04 (−0.16, 0.09) −0.05 (−0.19, 0.09) −0.09 (−0.24, 0.06) Female 20−39 −0.06 (−0.20, 0.07) −0.06 (−0.17, 0.05) −0.05 (−0.23, 0.14) −0.08 (−0.22, 0.06) −0.07 (−0.21, 0.06) −0.04 (−0.15, 0.07) 39−59 0.12 (−0.06, 0.29) 0.11 (−0.04, 0.26) 0.01 (−0.20, 0.22) 0.07 (−0.12, 0.25) 0.11 (−0.07, 0.29) 0.14 (0.01, 0.28) Note. Model 2 was adjusted for race, PIR, physical activity, smoking status, drinking status. Table S7. Adjusted associations from multivariable linear regression models between serum PFAS and A/G ratio
Variable Male Female β (95% CI) P value β (95% CI) P value PFOA 20−39 0.97 (0.04, 1.89) 0.04 0.54 (−0.55, 1.64) 0.33 39−59 0.18 (−0.61, 0.98) 0.65 −0.60 (−1.62, 0.41) 0.25 PFOS 20−39 0.79 (−0.38, 1.96) 0.19 0.85 (−0.75, 2.45) 0.30 39−59 0.68 (−0.33, 1.70) 0.19 −0.27 (−1.74, 1.21) 0.72 PFHxS 20−39 0.11 (−0.49, 0.70) 0.72 0.04 (−0.77, 0.85) 0.93 39−59 0.11 (−0.33, 0.55) 0.64 0.39 (−0.23, 1.00) 0.21 PFDeA 20−39 0.59 (0.13, 1.04) 0.01 0.07 (−0.53, 0.67) 0.83 39−59 0.28 (−0.14, 0.69) 0.19 0.47 (−0.06, 0.99) 0.08 PFNA 20−39 0.53 (0.04, 1.03) 0.04 0.15 (−0.60, 0.90) 0.70 39−59 0.30 (−0.12, 0.72) 0.16 0.96 (0.43, 1.50) <0.01 n-PFOA 20−39 0.31 (−0.43, 1.05) 0.41 −0.15 (−1.11, 0.81) 0.76 39−59 0.19 (−0.33, 0.71) 0.48 0.88 (0.20, 1.57) 0.01 n-PFOS 20−39 0.31 (−0.53, 1.14) 0.47 −0.05 (−1.13, 1.02) 0.92 39−59 0.13 (−0.52, 0.78) 0.69 0.36 (−0.49, 1.21) 0.41 Sm-PFOS 20−39 0.02 (−0.83, 0.86) 0.97 −0.25 (−1.25, 0.75) 0.62 39−59 −0.04 (−0.63, 0.55) 0.89 0.60 (−0.19, 1.39) 0.14 Table S8. Associations between joint assessments of fat distribution and serum PFAS in NHANES, 2011–2018
Variable Male Female 20−39 39−59 20−39 39−59 PFOA 0.28 (−0.11, 0.67) 0.13 (−0.09, 0.36) 0.22 (0.00, 0.44) 0.33 (−0.06, 0.72) PFOS 0.48 (−0.08, 1.04) 0.27 (−0.13, 0.67) 0.33 (−0.23, 0.89) 1.68 (0.43, 2.93) PFHxS 0.11 (−0.02, 0.24) 0.09 (−0.03, 0.22) 0.08 (−0.06, 0.22) 0.24 (0.07, 0.42) PFDeA 0.14 (0.02, 0.26) 0.03 (−0.04, 0.11) 0.02 (−0.01, 0.05) 0.18 (0.07, 0.29) PFNA 0.19 (0.00, 0.37) 0.02 (−0.02, 0.06) 0.04 (−0.05, 0.14) 0.41 (0.17, 0.65) n-PFOA 0.14 (0.01, 0.27) 0.03 (−0.01, 0.06) 0.46 (−0.03, 0.95) 0.46 (0.17, 0.76) n-PFOS 0.35 (−0.03, 0.74) 0.62 (0.11, 1.12) 0.18 (−0.11, 0.48) 0.22 (0.05, 0.38) Sm-PFOS 0.48 (0.01, 0.96) 0.77 (0.21, 1.34) 0.25 (−0.04, 0.54) 0.29 (0.07, 0.51) Table S9. Adjusted associations from multivariable linear regression models between serum PFAS and trunk fat mass, android fat mass in subgroup (BMI < 25.0)
Variable Trunk fat mass Android fat mass Male Female Male Female 20−39 39−59 20−39 39−59 20−39 39−59 20−39 39−59 PFOA Tertile 1 Ref Ref Ref Ref Ref Ref Ref Ref Tertile 2 0.09
(−0.42, 0.60)−1.76
(−3.06, −0.45)0.16
(−0.62, 0.94)− 0.23
(−0.28, 0.74)0.28
(−0.69, 1.25)−0.25
(−0.93, 0.43)−0.18
(−0.90, 0.53)Tertile 3 − − − − − − − − PFOS Tertile 1 Ref Ref Ref Ref Ref Ref Ref Ref Tertile 2 0.16
(−0.77, 1.09)−1.61
(−3.41, 0.19)0.18
(−0.87, 1.23)− 0.18
(−0.76, 1.11)0.27
(−0.95, 1.48)0.56
(−0.34, 1.46)0.62
(−0.24, 1.49)Tertile 3 − − − − − − − − PFHxS Tertile 1 Ref Ref Ref Ref Ref Ref Ref Ref Tertile 2 −0.14
(−0.57, 0.28)−0.43
(−0.96, 0.09)−0.23
(−0.70, 0.23)0.47
(−0.19, 1.14)−0.06
(−0.50, 0.38)−0.20
(−0.64, 0.24)0.09
(−0.34, 0.53)0.20
(−0.35, 0.75)Tertile 3 − − − − − − − − PFDeA Tertile 1 Ref Ref Ref Ref Ref Ref Ref Ref Tertile 2 0.21
(−0.16, 0.58)−0.61
(−1.20, −0.03)−0.12
(−0.46, 0.22)−0.26
(−0.88, 0.36)0.24
(−0.14, 0.62)−0.3
(−0.78, 0.18)0.00
(−0.31, 0.31)−0.20
(−0.71, 0.30)Tertile 3 − − − − − − − − PFNA Tertile 1 Ref Ref Ref Ref Ref Ref Ref Ref Tertile 2 0.01
(−0.33, 0.36)−0.21
(−0.74, 0.32)−0.12
(−0.50, 0.25)0.20
(−0.44, 0.83)0.06
(−0.29, 0.42)0.03
(−0.40, 0.47)0.00
(−0.34, 0.35)0.24
(−0.28, 0.77)Tertile 3 − − − − − − − − n-PFOA Tertile 1 Ref Ref Ref Ref Ref Ref Ref Ref Tertile 2 −0.13
(−0.63, 0.37)−0.36
(−1.05, 0.33)−0.03
(−0.57, 0.51)0.61
(−0.07, 1.30)0.03
(−0.45, 0.51)−0.26
(−0.90, 0.37)0.05
(−0.44, 0.53)0.53
(−0.12, 1.17)Tertile 3 − − − − − − − − n-PFOS Tertile 1 Ref Ref Ref Ref Ref Ref Ref Ref Tertile 2 −0.68
(−1.20, −0.17)−0.51
(−1.26, 0.24)−0.76
(−1.24, −0.28)0.12
(−0.73, 0.98)−0.46
(−0.97, 0.05)−0.64
(−1.31, 0.04)−0.27
(−0.74, 0.21)0.12
(−0.64, 0.89)Tertile 3 − − − − − − − − Sm-PFOS Tertile 1 Ref Ref Ref Ref Ref Ref Ref Ref Tertile 2 −0.38
(−0.95, 0.20)−0.19
(−0.87, 0.48)−0.53
(−1.08, 0.03)0.58
(−0.18, 1.34)−0.16
(−0.72, 0.40)−0.21
(−0.84, 0.42)−0.18
(−0.70, 0.34)0.58
(−0.10, 1.26)Tertile 3 − − − − − − − − Note. Models were adjusted for race, PIR, physical activity, smoking status, drinking status, BMI, waist, HDL. Table S10. Adjusted associations from multivariable linear regression models between serum PFAS and gynoid fat mass, subcutaneous fat mass in subgroup (BMI < 25.0)
Variable Gynoid fat mass Subcutaneous fat mass Male Female Male Female 20−39 39−59 20−39 39−59 20−39 39−59 20−39 39−59 PFOA Tertile 1 Ref Ref Ref Ref Ref Ref Ref Ref Tertile 2 −0.14
(−0.59, 0.31)−0.13
(−0.95, 0.68)−0.17
(−0.67, 0.33)0.41
(−0.05, 0.87)0.29
(−0.22, 0.79)0.88
(−0.18, 1.95)−0.47
(−1.19, 0.25)−0.31
(−1.08, 0.46)Tertile 3 − − − − − − − − PFOS Tertile 1 Ref Ref Ref Ref Ref Ref Ref Ref Tertile 2 0.40
(−0.41, 1.20)0.37
(−0.64, 1.38)−0.27
(−0.94, 0.39)0.08
(−0.56, 0.71)0.40
(−0.53, 1.33)−0.34
(−1.76, 1.09)0.44
(−0.55, 1.43)0.31
(−0.67, 1.30)Tertile 3 − − − − − − − − PFHxS Tertile 1 Ref Ref Ref Ref Ref Ref Ref Ref Tertile 2 −0.05
(−0.41, 0.31)−0.16
(−0.53, 0.21)0.04
(−0.34, 0.41)0.19
(−0.19, 0.57)−0.30
(−0.71, 0.11)−0.37
(−0.78, 0.04)0.13
(−0.30, 0.56)−0.18
(−0.76, 0.41)Tertile 3 − − − − − − − − PFDeA Tertile 1 Ref Ref Ref Ref Ref Ref Ref Ref Tertile 2 0.00
(−0.32, 0.31)0.20
(−0.20, 0.61)−0.13
(−0.40, 0.14)−0.04
(−0.39, 0.32)−0.07
(−0.44, 0.29)0.10
(−0.36, 0.56)−0.05
(−0.36, 0.27)−0.38
(−0.91, 0.16)Tertile 3 − − − − − − − − PFNA Tertile 1 Ref Ref Ref Ref Ref Ref Ref Ref Tertile 2 −0.01
(−0.30, 0.28)0.18
(−0.18, 0.54)−0.09
(−0.39, 0.21)0.92
(−0.28, 0.46)−0.05
(−0.38, 0.28)0.13
(−0.28, 0.54)−0.01
(−0.35, 0.34)0.02
(−0.54, 0.58)Tertile 3 − − − − − − − − n-PFOA Tertile 1 Ref Ref Ref Ref Ref Ref Ref Ref Tertile 2 0.13
(−0.28, 0.53)0.19
(−0.36, 0.75)−0.24
(−0.65, 0.17)0.02
(−0.49, 0.52)−0.44
(−0.87, 0.00)0.28
(−0.32, 0.87)−0.02
(−0.48, 0.44)−0.19
(−0.94, 0.55)Tertile 3 − − − − − − − − n-PFOS Tertile 1 Ref Ref Ref Ref Ref Ref Ref Ref Tertile 2 −0.15
(−0.60, 0.29)0.19
(−0.36, 0.75)−0.03
(−0.43, 0.37)0.10
(−0.48, 0.69)−0.61
(−1.07, −0.15)−0.45
(−1.08, 0.19)−0.02
(−0.48, 0.43)−0.19
(−1.06, 0.67)Tertile 3 − − − − − − − − Sm-PFOS Tertile 1 Ref Ref Ref Ref Ref Ref Ref Ref Tertile 2 0.09
(−0.38, 0.57)0.05
(−0.50, 0.60)−0.04
(−0.48, 0.40)0.17
(−0.35, 0.70)−0.56
(−1.06, −0.06)−0.24
(−0.82, 0.35)0.07
(−0.43, 0.57)−0.04
(−0.83, 0.75)Tertile 3 − − − − − − − − Note. Models were adjusted for race, PIR, physical activity, smoking status, drinking status, BMI, waist, HDL. Table S11. Adjusted associations from multivariable linear regression models between serum PFAS and total abdominal fat mass, visceral adipose tissue mass in subgroup (BMI < 25.0)
Variable Total abdominal fat mass Visceral adipose tissue mass Male Female Male Female 20−39 39−59 20−39 39−59 20−39 39−59 20−39 39−59 PFOA Tertile 1 Ref Ref Ref Ref Ref Ref Ref Ref Tertile 2 0.22
(−0.37, 0.81)−0.7
(−1.94, 0.55)−0.47
(−1.19, 0.25)−0.64
(−1.46, 0.19)0.28
(−0.14, 0.71)0.77
(0.26, 1.29)−0.12
(−0.59, 0.34)−0.66
(−1.26, −0.07)Tertile 3 − − − − − − − − PFOS Tertile 1 Ref Ref Ref Ref Ref Ref Ref Ref Tertile 2 0.55
(−0.52, 1.62)−1.23
(−2.73, 0.28)0.44
(−0.55, 1.43)−0.23
(−1.35, 0.88)−0.02
(−0.80, 0.77)0.32
(−0.54, 1.19)0.17
(−0.46, 0.80)−0.39
(−1.24, 0.45)Tertile 3 − − − − − − − − PFHxS Tertile 1 Ref Ref Ref Ref Ref Ref Ref Ref Tertile 2 −0.35
(−0.78, 0.08)−0.56
(−1.01, −0.11)−0.14
(−0.56, 0.29)0.00
(−0.58, 0.58)0.10
(−0.26, 0.45)−0.06
(−0.41, 0.30)−0.06
(−0.41, 0.29)0.40
(0.00, 0.80)Tertile 3 − − − − − − − − PFDeA Tertile 1 Ref Ref Ref Ref Ref Ref Ref Ref Tertile 2 0.27
(−0.11, 0.64)−0.54
(−1.04, −0.04)−0.02
(−0.33, 0.29)−0.33
(−0.86, 0.21)0.20
(−0.11, 0.51)−0.10
(−0.49, 0.29)0.08
(−0.17, 0.34)0.35
(−0.02, 0.72)Tertile 3 − − − − − − − − PFNA Tertile 1 Ref Ref Ref Ref Ref Ref Ref Ref Tertile 2 0.13
(−0.22, 0.48)−0.36
(−0.81, 0.09)0.05
(−0.29, 0.39)0.12
(−0.43, 0.68)0.11
(−0.18, 0.39)0.11
(−0.24, 0.45)0.14
(−0.14, 0.43)0.65
(0.28, 1.02)Tertile 3 − − − − − − − − n-PFOA Tertile 1 Ref Ref Ref Ref Ref Ref Ref Ref Tertile 2 −0.20
(−0.67, 0.26)−0.26
(−0.90, 0.37)0.09
(−0.38, 0.55)0.26
(−0.39, 0.91)−0.06
(−0.47, 0.35)−0.11
(−0.65, 0.42)−0.18
(−0.60, 0.25)0.35
(−0.11, 0.81)Tertile 3 − − − − − − − − n-PFOS Tertile 1 Ref Ref Ref Ref Ref Ref Ref Ref Tertile 2 −0.59
(−1.07, −0.10)−0.64
(−1.31, 0.04)−0.16
(−0.62, 0.30)−0.03
(−0.79, 0.73)−0.06
(−0.50, 0.39)−0.42
(−0.98, 0.15)−0.33
(−0.75, 0.08)0.74
(0.22, 1.26)Tertile 3 − − − − − − − − Sm-PFOS Tertile 1 Ref Ref Ref Ref Ref Ref Ref Ref Tertile 2 −0.36
(−0.89, 0.18)−0.21
(−0.84, 0.42)−0.04
(−0.54, 0.47)0.32
(−0.37, 1.01)−0.03
(−0.52, 0.45)−0.49
(−0.99, 0.01)−0.25
(−0.71, 0.20)0.62
(0.14, 1.10)Tertile 3 − − − − − − − − Note. Models were adjusted for race, PIR, physical activity, smoking status, drinking status, BMI, waist, HDL. Table S14. Effect estimates and 95%confidence intervals (CI) for associations of structurally grouped PFAS concentrations with regional fat distribution
Variable Percent Change (95% CI) Trunk fat mass Android fat mass Gynoid fat mass Subcutaneous fat mass Total abdominal fat mass Visceral adipose tissue mass Total PFSAs level Male 20−39 −0.19 (−0.74, 0.35) −0.32 (−0.80, 0.16) −0.52 (−0.99, −0.04) −0.35 (−0.66, −0.04) −0.39 (−0.80, 0.01) 0.12 (−0.20, 0.44) 39−59 −0.52 (−1.11, 0.07) −0.47 (−0.95, 0.00) −0.44 (−0.93, 0.05) −0.51 (−0.90, −0.12) −0.65 (−1.11, −0.19) −0.22 (−0.52, 0.07) Female 20−39 −0.34 (−0.98, 0.30) −0.20 (−0.70, 0.30) −0.24 (−0.81, 0.33) −0.46 (−1.00, 0.09) −0.33 (−0.90, 0.23) 0.08 (−0.19, 0.34) 39−59 −0.11 (−0.75, 0.53) 0.08 (−0.42, 0.57) −0.35 (−0.80, 0.11) −0.27 (−0.84, 0.29) 0.04 (−0.55, 0.63) 0.21 (−0.05, 0.46) Short−chain PFSAs Male 20−39 −0.10 (−0.56, 0.36) −0.10 (−0.50, 0.30) −0.25 (−0.65, 0.15) −0.23 (−0.50, 0.04) −0.24 (−0.59, 0.11) 0.13 (−0.12, 0.39) 39−59 −0.24 (−0.67, 0.18) −0.15 (−0.50, 0.19) −0.13 (−0.50, 0.23) −0.18 (−0.46, 0.11) −0.20 (−0.53, 0.14) −0.08 (−0.31, 0.15) Female 20−39 0.01 (−0.52, 0.54) −0.16 (−0.58, 0.26) −0.18 (−0.62, 0.27) −0.29 (−0.75, 0.17) −0.32 (−0.79, 0.14) −0.1 (−0.32, 0.11) 39−59 0.45 (−0.02, 0.93) 0.39 (0.03, 0.76) −0.05 (−0.39, 0.29) 0.29 (−0.13, 0.71) 0.49 (0.06, 0.93) 0.22 (0.02, 0.41) Long−chain PFSAs Male 20−39 −0.13 (−0.69, 0.42) −0.27 (−0.76, 0.22) −0.5 (−0.98, −0.01) −0.31 (−0.63, 0.01) −0.35 (−0.76, 0.07) 0.13 (−0.20, 0.45) 39−59 −0.57 (−1.19, 0.04) −0.52 (−1.01, −0.03) −0.47 (−0.97, 0.04) −0.53 (−0.93, −0.13) −0.69 (−1.16, −0.21) −0.24 (−0.54, 0.07) Female 20−39 −0.35 (−1.00, 0.30) −0.17 (−0.67, 0.34) −0.27 (−0.85, 0.31) −0.42 (−0.97, 0.13) −0.29 (−0.86, 0.29) 0.10 (−0.17, 0.37) 39−59 −0.12 (−0.79, 0.55) 0.10 (−0.41, 0.62) −0.34 (−0.81, 0.14) −0.29 (−0.87, 0.30) 0.05 (−0.56, 0.66) 0.22 (−0.04, 0.49) Long−chain PFCAs Male 20−39 0.24 (−0.22, 0.70) 0.15 (−0.25, 0.56) −0.13 (−0.54, 0.27) −0.05 (−0.31, 0.22) 0.04 (−0.31, 0.38) 0.27 (0.01, 0.54) 39−59 0.14 (−0.34, 0.62) 0.15 (−0.24, 0.54) −0.17 (−0.57, 0.24) 0.05 (−0.27, 0.37) 0.06 (−0.33, 0.44) −0.01 (−0.25, 0.24) Female 20−39 −0.35 (−0.88, 0.17) −0.45 (−0.86, −0.03) −0.47 (−0.95, 0.00) −0.71 (−1.16, −0.26) −0.67 (−1.14, −0.21) −0.12 (−0.34, 0.11) 39−59 0.21 (−0.31, 0.74) 0.33 (−0.08, 0.73) −0.39 (−0.77, −0.01) −0.03 (−0.50, 0.44) 0.37 (−0.11, 0.85) 0.31 (0.10, 0.52) Note. Models were adjusted for race, PIR, physical activity, smoking status, drinking status, BMI, waist, HDL. Long−chain PFCAs:PFDeA; PFNA; n-PFOA; Long−chain PFSAs: PFOS; n-PFOS; Sm-PFOS; Short−chain PFSAs: PFHxS.
doi: 10.3967/bes2024.176
Association between Per and Polyfluoroalkyl Substance and Abdominal Fat Distribution: A Trait Spectrum Exposure Pattern and Structure-Based Investigation
-
Abstract:
Objective To investigate the associations between eight serum per- and polyfluoroalkyl substances (PFASs) and regional fat depots, we analyzed the data from the National Health and Nutrition Examination Survey (NHANES) 2011–2018 cycles. Methods Multiple linear regression models were developed to explore the associations between serum PFAS concentrations and six fat compositions along with a fat distribution score created by summing the concentrations of the six fat compositions. The associations between structurally grouped PFASs and fat distribution were assessed, and a prediction model was developed to estimate the ability of PFAS exposure to predict obesity risk. Results Among females aged 39–59 years, trunk fat mass was positively associated with perfluorooctane sulfonate (PFOS). Higher concentrations of PFOS, perfluorohexane sulfonate (PFHxS), perfluorodecanoate (PFDeA), perfluorononanoate (PFNA), and n-perfluorooctanoate (n-PFOA) were linked to greater visceral adipose tissue in this group. In men, exposure to total perfluoroalkane sulfonates (PFSAs) and long-chain PFSAs was associated with reductions in abdominal fat, while higher abdominal fat in women aged 39–59 years was associated with short-chain PFSAs. The prediction model demonstrated high accuracy, with an area under the curve (AUC) of 0.9925 for predicting obesity risk. Conclusion PFAS exposure is associated with regional fat distribution, with varying effects based on age, sex, and PFAS structure. The findings highlight the potential role of PFAS exposure in influencing fat depots and obesity risk, with significant implications for public health. The prediction model provides a highly accurate tool for assessing obesity risk related to PFAS exposure. -
Key words:
- Per- and polyfluoroalkyl substances /
- Regional fat depots /
- Obesity /
- Structure-based /
- NHANES
The authors declare no competing interests.
The study was carried out in compliance with the Declaration of Helsinki. Ethical review and approval were not required for this study, as it involved the use of publicly available data and did not qualify as human subject research in the United States.
&These authors contributed equally to this work.
注释:1) Authors’ Contributions: 2) Competing Interests: 3) Ethics: -
Figure 1. Effect estimates and 95% confidence intervals for associations of single PFAS with regional fat grouped by structural characteristics. PFOA, perfluorooctanoic acid; PFOS, perfluorooctane sulfonate; PFHxS, perfluorohexane sulfonate; PFDeA, perfluorodecanoate; PFNA, perfluorononanoate; n-PFOA, n-perfluorooctanoate. n-PFOS, linear perfluorooctane sulfonate; Sm-PFOS, monomethyl branched isomers of PFOS; PFAS, Per and polyfluoroalkyl substance.
Figure 2. Association of trait spectrum exposure pattern of per and polyfluoroalkyl substance (PFAS) with regional fat depots.
Figure 3. ROC curves comparing the prediction of different models of obesity.
Conventional model included marital status, PIR, smoking status, drinking status, waist, diastolic blood pressure (DBP), high-density lipoprotein (HDL), direct HDL-cholesterol, total cholesterol, glycohemoglobin (%), insulin, insulin resistance index (HOMA-IR). (A) ROC curve of conventional model and conventional model + PFDeA in 20–39 male participants; (B) ROC curve of conventional model and conventional model + PFDeA in 30–59 male participants; (C) ROC curve of conventional model and conventional model + PFNA in 20–39 female participants; (D) ROC curve of conventional model and conventional model + PFHxS in 30–59 female participants. ROC, receiver operating characteristic curve; AUC, area under ROC; PFDeA, perfluorodecanoate; PFNA, perfluorononanoate; PFHxS, perfluorohexane sulfonate.
S1. Chemical information and structures of PFAS
Chemical Category Carbon number Molecular formula PFOA, Perfluorooctanoic acid long−chain PFCAs 8 C8HF15O2 PFOS, Perfluorooctanesulfonic acid long−chain PFSAs 8 C8HF17O3S PFHxS, Perfluorohexane sulfonic acid short−chain PFSAs 6 C6HF13O3S PFDeA, Perfluorodecanoic acid long−chain PFCAs 10 C10HF19O2 PFNA, Perfluorononanoic acid long−chain PFCAs 9 C9HF17O2 n-PFOA, linear perfluorooctanoate long−chain PFCAs 8 C8HF15O2 n-PFOS, linear perfluorooctane sulfonate long−chain PFSAs 8 C8HF17O3S Sm-PFOS, monomethyl branched isomers of PFOS long−chain PFSAs 8 C8HF17O3S  下载: 导出CSV
S2. Distributions of concentrations of serum PFAS in the study population
Chemicals Detection rate GM Mean Percentile 25th Percentile 50th Percentile 75th Percentile PFOA 99.53% 1.88 2.35 1.32 2.01 2.76 PFOS 99.55% 5.89 8.39 3.67 6.25 10.05 Et-PFOSA−AcOH 5.71% 0.10 0.11 0.10 0.10 0.10 PFOSA 0.77% 0.10 0.10 0.10 0.10 0.10 PFHxS 98.46% 1.02 1.57 0.60 1.10 1.88 Me-PFOSAAcOH 42.89% 0.14 0.18 0.10 0.10 0.19 PFDeA 79.09% 0.20 0.30 0.10 0.20 0.30 PFNA 96.81% 0.59 0.79 0.40 0.60 0.96 PFUA 52.71% 0.15 0.23 0.10 0.10 0.20 n-PFOA 99.29% 1.23 1.63 0.80 1.30 2.00 Sb-PFOA 5.15% 0.10 0.10 0.10 0.10 0.10 n-PFOS 99.48% 2.82 4.22 2.80 4.80 6.10 Sm-PFOS 98.68% 1.08 1.52 0.60 1.10 2.00 PFBuS 0.67% 0.10 0.10 0.10 0.10 0.10 PFHpA 11.22% 0.11 0.11 0.10 0.10 0.10 PFDoA 14.87% 0.11 0.11 0.10 0.10 0.10
下载: 导出CSV
S3. Demographic characteristics of the study population.
Characteristic Male Female P value 20−39 39−59 20−39 39−59 (N = 1,019) (N = 1,067) (N = 1,083) (N = 1,193) Age, mean, y 28.99 (5.56) 48.93 (6.02) 28.93 (5.49) 48.86 (6.00) < 0.001 BMI 28.63 (6.81) 29.18 (5.95) 28.99 (8.28) 30.60 (8.33) < 0.001 BMI < 0.001 < 25.0 153 (33.8%) 119 (22.5%) 180 (37.3%) 146 (27.0%) 25.0−29.9 143 (31.6%) 208 (39.3%) 118 (24.4%) 147 (27.2%) > 30.0 157 (34.7%) 202 (38.2%) 185 (38.3%) 247 (45.7%) Race/ethnicity 0.294 Mexican American 159 (15.6%) 142 (13.3%) 148 (13.7%) 176 (14.8%) Other Hispanic 101 (9.9%) 98 (9.2%) 113 (10.4%) 131 (11.0%) Non−Hispanic White 340 (33.4%) 388 (36.4%) 377 (34.8%) 365 (30.6%) Non−Hispanic Black 224 (22.0%) 226 (21.2%) 250 (23.1%) 288 (24.1%) Other Race − Including Multi−Racial 195 (19.1%) 213 (20.0%) 195 (18.0%) 233 (19.5%) Education < 0.001 Less than 9th grade 38 (3.7%) 104 (9.7%) 53 (4.9%) 87 (7.3%) 9−11th grade 143 (14.0%) 152 (14.2%) 115 (10.6%) 134 (11.2%) High school graduate/GED or equivalent 260 (25.5%) 214 (20.1%) 201 (18.6%) 241 (20.2%) Some college or AA degree 329 (32.3%) 312 (29.2%) 412 (38.0%) 385 (32.3%) College graduate or above 249 (24.4%) 285 (26.7%) 302 (27.9%) 346 (29.0%) Marital status < 0.001 Married 362 (35.5%) 706 (66.2%) 426 (39.3%) 656 (55.0%) Separated 48 (4.7%) 161 (15.1%) 89 (8.2%) 311 (26.1%) Never married 609 (59.8%) 200 (18.7%) 568 (52.4%) 226 (18.9%) Family income−to-Poverty ratio < 0.001 < 1.30 326 (32.0%) 271 (25.4%) 405 (37.4%) 318 (26.7%) ≥ 1.30 to < 3.49 453 (44.5%) 434 (40.7%) 436 (40.3%) 483 (40.5%) ≥ 3.49 240 (23.6%) 362 (33.9%) 242 (22.3%) 392 (32.9%) Physical activity < 0.001 1−2 times/week 179 (17.6%) 198 (19.6%) 119 (16.5%) 149 (12.5%) ≥3 times/week 840 (82.4%) 869 (81.4%) 904 (83.5%) 1044 (87.5%) Smoking status Never smoking 608 (59.7%) 543 (50.9%) 782 (72.2%) 782 (65.5%) < 0.001 Former smoking 154 (15.1%) 257 (24.1%) 103 (9.5%) 169 (14.2%) Current smoking 257 (25.2%) 267 (25.0%) 198 (18.3%) 242 (20.3%) Drinking status Drinker 754 (74.0%) 788 (73.9%) 735 (67.9%) 758 (63.5%) < 0.001 Non−drinker 265 (26.0%) 279 (26.1%) 348 (32.1%) 435 (36.5%) Android fat mass 2,175.42 (1,423.65) 2,668.82 (1,314.05) 2,314.33 (1,405.64) 2,668.30 (1,321.19) < 0.001 Gynoid fat mass 3,989.09 (1,803.61) 4,000.48 (1,536.21) 5,281.31 (1,962.38) 5,353.88 (1,927.38) < 0.001 Subcutaneous fat mass 1,276.78 (812.51) 1,422.21 (656.31) 1,900.23 (862.74) 2,006.84 (779.39) < 0.001 Total abdominal fat mass 1,684.44 (971.58) 2,070.51 (866.36) 2,271.79 (1,042.78) 2,564.01 (982.09) < 0.001 Visceral adipose tissue mass 407.66 (212.26) 648.30 (283.04) 371.57 (230.19) 557.17 (289.35) < 0.001 Trunk fat mass 11,505.87 (6,471.14) 13,710.70 (5,971.95) 13,309.03 (6,777.61) 15,154.10 (6,379.09) < 0.001
下载: 导出CSV
S4. Age−specific and sex−specific distributions of concentrations of serum PFAS in the study population
Characteristic Male Female P Value 20−39 39−59 20−39 39−59 (N = 1,019) (N = 1,067) (N = 1,083) (N = 1,193) PFOA 2.89 (3.20) 2.74 (1.92) 1.69 (1.10) 2.08 (1.79) < 0.001 PFOS 9.84 (11.24) 11.36 (10.06) 5.50 (4.78) 6.82 (7.93) < 0.001 PFHxS 2.16 (2.65) 2.14 (2.05) 0.94 (1.46) 1.15 (1.92) < 0.001 PFDeA 0.25 (0.33) 0.38 (1.65) 0.25 (0.54) 0.32 (0.46) 0.002 PFNA 0.80 (0.64) 0.95 (0.86) 0.58 (0.52) 0.81 (0.72) < 0.001 n-PFOA 1.85 (1.73) 1.97 (1.34) 1.10 (1.04) 1.62 (2.62) < 0.001 n-PFOS 4.06 (3.09) 6.24 (7.16) 2.48 (3.08) 4.10 (6.05) < 0.001 Sm-PFOS 1.65 (1.07) 2.51 (1.65) 0.75 (0.56) 1.24 (1.17) < 0.001
下载: 导出CSV
Table 1. Adjusted associations from multivariable linear regression models between serum PFAS and regional fat distribution
Variables Trunk fat mass Android fat mass Gynoid fat mass Subcutaneous fat mass Total abdominal fat mass Visceral adipose tissue mass PFOA Male, years 20−39 −0.11 (−0.83, 0.61) −0.12 (−0.75, 0.51) −0.57 (−1.16, 0.03) −0.19 (−0.61, 0.22) −0.17 (−0.73, 0.38) 0.11 (−0.32, 0.54) 39−59 −0.03 (−0.74, 0.68) −0.08 (−0.69, 0.54) 0.19 (−0.42, 0.80) 0.27 (−0.21, 0.76) 0.23 (−0.38, 0.84) −0.12 (−0.52, 0.28) Female, years 20−39 0.37 (−0.40, 1.14) −0.01 (−0.62, 0.61) −0.27 (−0.83, 0.28) −0.29 (−0.94, 0.36) −0.26 (−0.92, 0.41) 0.01 (−0.29, 0.32) 39−59 0.44 (−0.52, 1.41) 0.16 (−0.54, 0.86) 0.28 (−0.33, 0.90) 0.35 (−0.39, 1.10) 0.43 (−0.36, 1.21) 0.19 (−0.18, 0.56) PFOS Male, years 20−39 −0.17 (−1.08, 0.73) −0.29 (−1.08, 0.49) −0.67 (−1.42, 0.08) −0.44 (−0.96, 0.08) −0.47 (−1.16, 0.21) 0.17 (−0.37, 0.71) 39−59 0.12 (−0.81, 1.06) 0.17 (−0.63, 0.97) 0.06 (−0.74, 0.85) 0.51 (−0.11, 1.14) 0.55 (−0.24, 1.34) 0.00 (−0.52, 0.52) Female, years 20−39 0.64 (−0.49, 1.76) 0.67 (−0.21, 1.55) −0.06 (−0.88, 0.75) 0.35 (−0.61, 1.31) 0.35 (−0.63, 1.33) 0.07 (−0.38, 0.52) 39−59 1.52 (0.14, 2.89) 0.95 (−0.06, 1.95) 0.28 (−0.63, 1.19) 0.72 (−0.36, 1.81) 1.25 (0.12, 2.38) 0.68 (0.16, 1.21) PFHxS Male, years 20−39 −0.10 (−0.56, 0.36) −0.10 (−0.50, 0.30) −0.25 (−0.65, 0.15) −0.23 (−0.5, 0.04) −0.24 (−0.59, 0.11) 0.13 (−0.12, 0.39) 39−59 −0.24 (−0.67, 0.18) −0.18 (−0.54, 0.17) −0.09 (−0.46, 0.28) −0.19 (−0.48, 0.10) −0.23 (−0.57, 0.11) −0.12 (−0.35, 0.12) Female, years 20−39 0.01 (−0.52, 0.54) −0.16 (−0.58, 0.26) −0.18 (−0.62, 0.27) −0.29 (−0.75, 0.17) −0.32 (−0.79, 0.14) −0.10 (−0.32, 0.11) 39−59 0.45 (−0.02, 0.93) 0.40 (0.03, 0.78) −0.07 (−0.42, 0.27) 0.30 (−0.13, 0.73) 0.50 (0.06, 0.95) 0.22 (0.02, 0.42) PFDeA Male, years 20−39 0.19 (−0.17, 0.54) 0.21 (−0.10, 0.52) −0.27 (−0.58, 0.04) 0.06 (−0.15, 0.27) 0.13 (−0.14, 0.41) 0.16 (−0.04, 0.36) 39−59 0.02 (−0.38, 0.43) 0.14 (−0.20, 0.48) −0.05 (−0.40, 0.30) 0.21 (−0.07, 0.48) 0.23 (−0.10, 0.55) 0.06 (−0.16, 0.29) Female, years 20−39 0.04 (−0.34, 0.43) 0.03 (−0.28, 0.34) −0.17 (−0.50, 0.15) −0.05 (−0.39, 0.29) −0.02 (−0.36, 0.33) −0.01 (−0.17, 0.15) 39−59 0.02 (−0.38, 0.42) 0.11 (−0.21, 0.43) −0.21 (−0.51, 0.08) −0.15 (−0.51, 0.22) 0.14 (−0.23, 0.52) 0.25 (0.08, 0.42) PFNA Male, years 20−39 0.25 (−0.14, 0.63) 0.33 (0.00, 0.67) −0.12 (−0.46, 0.22) 0.16 (−0.07, 0.39) 0.25 (−0.04, 0.55) 0.16 (−0.06, 0.38) 39−59 0.08 (−0.32, 0.49) 0.06 (−0.28, 0.39) −0.08 (−0.44, 0.27) 0.08 (−0.20, 0.36) 0.05 (−0.27, 0.38) −0.05 (−0.27, 0.18) Female, years 20−39 −0.11 (−0.60, 0.38) −0.04 (−0.42, 0.35) −0.18 (−0.59, 0.23) −0.19 (−0.61, 0.24) −0.18 (−0.61, 0.25) −0.05 (−0.25, 0.15) 39−59 0.34 (−0.07, 0.75) 0.44 (0.11, 0.77) −0.16 (−0.46, 0.15) 0.18 (−0.20, 0.56) 0.50 (0.11, 0.89) 0.31 (0.13, 0.49) n-PFOA Male, years 20−39 0.16 (−0.35, 0.67) 0.05 (−0.41, 0.50) −0.12 (−0.57, 0.33) −0.13 (−0.42, 0.17) −0.07 (−0.46, 0.31) 0.25 (−0.05, 0.54) 39−59 0.11 (−0.41, 0.63) 0.15 (−0.28, 0.59) −0.09 (−0.54, 0.36) −0.02 (−0.38, 0.34) −0.03 (−0.46, 0.39) −0.05 (−0.32, 0.22) Female, years 20−39 −0.12 (−0.72, 0.49) −0.31 (−0.79, 0.16) −0.32 (−0.87, 0.22) −0.64 (−1.16, −0.13) −0.58 (−1.11, −0.04) −0.06 (−0.31, 0.20) 39−59 0.36 (−0.20, 0.91) 0.31 (−0.12, 0.74) −0.33 (−0.73, 0.07) 0.00 (−0.50, 0.50) 0.34 (−0.17, 0.85) 0.25 (0.03, 0.47) n-PFOS Male, years 20−39 −0.11 (−0.68, 0.47) −0.28 (−0.79, 0.23) −0.51 (−1.01, 0.00) −0.29 (−0.62, 0.04) −0.33 (−0.76, 0.10) 0.11 (−0.22, 0.45) 39−59 −0.62 (−1.27, 0.04) −0.49 (−1.03, 0.05) −0.48 (−1.04, 0.07) −0.55 (−0.99, −0.11) −0.66 (−1.19, −0.14) −0.19 (−0.53, 0.14) Female, years 20−39 −0.39 (−1.08, 0.29) −0.16 (−0.69, 0.38) −0.30 (−0.91, 0.31) −0.39 (−0.98, 0.20) −0.26 (−0.87, 0.34) 0.09 (−0.20, 0.37) 39−59 −0.23 (−0.92, 0.47) 0.00 (−0.53, 0.54) −0.28 (−0.77, 0.22) −0.38 (−1.00, 0.23) −0.09 (−0.73, 0.55) 0.16 (−0.11, 0.44) Sm-PFOS Male, years 20−39 −0.28 (−0.87, 0.31) −0.32 (−0.84, 0.19) −0.47 (−0.98, 0.04) −0.38 (−0.72, −0.05) −0.44 (−0.88, −0.01) 0.09 (−0.25, 0.44) 39−59 −0.51 (−1.10, 0.07) −0.47 (−0.96, 0.03) −0.38 (−0.89, 0.12) −0.63 (−1.03, −0.23) −0.78 (−1.25, −0.31) −0.28 (−0.58, 0.03) Female, years 20−39 −0.17 (−0.81, 0.47) −0.17 (−0.66, 0.33) −0.19 (−0.76, 0.38) −0.50 (−1.04, 0.04) −0.32 (−0.88, 0.23) 0.16 (−0.10, 0.43) 39−59 0.22 (−0.41, 0.85) 0.36 (−0.14, 0.86) −0.24 (−0.70, 0.22) −0.03 (−0.61, 0.54) 0.29 (−0.31, 0.88) 0.22 (−0.04, 0.47) Note. Data were represented as β and 95% confidence intervals (CI). Models were adjusted for race, PIR, physical activity, smoking status, drinking status, BMI, waist, HDL. PFOA, perfluorooctanoic acid; PFOS, perfluorooctane sulfonate; PFHxS, perfluorohexane sulfonate; PFDeA, perfluorodecanoate; PFNA, perfluorononanoate; n-PFOA, n-Perfluorooctanoate. n-PFOS, linear perfluorooctane sulfonate; Sm-PFOS, monomethyl branched isomers of PFOS; PFAS, Per and polyfluoroalkyl substance; HDL high−density lipoprotein; BMI, body mass index.
下载: 导出CSV
S12. Regression coefficients for regional fat distribution associated with PFAS in sensitive analyses by removing concentrations of PFAS more than three times the 75th percentile
Variable Percent Change (95% CI) Trunk fat mass Android fat mass Gynoid fat mass Subcutaneous fat mass Total abdominal fat mass Visceral adipose tissue mass PFOA Male 20−39 −0.02 (−0.69, 0.66) −0.07 (−0.66, 0.51) −0.44 (−1.00, 0.13) −0.13 (−0.52, 0.26) −0.16 (−0.67, 0.35) −0.02 (−0.43, 0.38) 39−59 0.12 (−0.55, 0.79) 0.10 (−0.47, 0.68) 0.24 (−0.33, 0.80) 0.34 (−0.11, 0.80) 0.32 (−0.24, 0.89) −0.1 (−0.47, 0.27) Female 20−39 0.37 (−0.40, 1.14) −0.01 (−0.62, 0.61) −0.27 (−0.83, 0.28) −0.29 (−0.94, 0.36) −0.26 (−0.92, 0.41) 0.01 (−0.29, 0.32) 39−59 0.44 (−0.52, 1.41) 0.09 (−0.60, 0.78) 0.20 (−0.40, 0.81) 0.20 (−0.53, 0.93) 0.33 (−0.45, 1.11) 0.19 (−0.17, 0.55) PFOS Male 20−39 0.11 (−0.69, 0.90) −0.10 (−0.79, 0.59) −0.41 (−1.07, 0.26) −0.18 (−0.65, 0.29) −0.21 (−0.82, 0.40) 0.05 (−0.42, 0.52) 39−59 0.17 (−0.74, 1.07) 0.19 (−0.57, 0.96) 0.14 (−0.58, 0.87) 0.53 (−0.05, 1.12) 0.53 (−0.20, 1.27) −0.06 (−0.55, 0.43) Female 20−39 0.48 (−0.61, 1.57) 0.47 (−0.39, 1.34) −0.12 (−0.91, 0.66) 0.11 (−0.82, 1.05) 0.11 (−0.85, 1.06) 0.01 (−0.42, 0.45) 39−59 1.36 (0.00, 2.72) 0.90 (−0.02, 1.83) 0.32 (−0.51, 1.15) 0.63 (−0.36, 1.61) 1.11 (0.06, 2.15) 0.55 (0.07, 1.03) PFHxS Male 20−39 −0.19 (−0.61, 0.23) −0.19 (−0.57, 0.18) −0.14 (−0.51, 0.23) −0.21 (−0.46, 0.04) −0.27 (−0.60, 0.05) −0.01 (−0.25, 0.23) 39−59 −0.16 (−0.54, 0.23) −0.11 (−0.42, 0.21) −0.03 (−0.36, 0.31) −0.12 (−0.38, 0.14) −0.14 (−0.45, 0.16) −0.08 (−0.29, 0.13) Female 20−39 0.03 (−0.49, 0.56) −0.09 (−0.50, 0.32) −0.16 (−0.60, 0.27) −0.21 (−0.67, 0.24) −0.24 (−0.70, 0.22) −0.09 (−0.30, 0.12) 39−59 0.45 (0.00, 0.90) 0.39 (0.04, 0.74) 0.04 (−0.28, 0.36) 0.33 (−0.07, 0.73) 0.53 (0.12, 0.95) 0.21 (0.02, 0.40) PFDeA Male 20−39 −0.02 (−0.33, 0.28) 0.05 (−0.22, 0.31) −0.32 (−0.58, −0.06) 0.00 (−0.18, 0.18) 0.02 (−0.21, 0.25) 0.06 (−0.11, 0.23) 39−59 −0.15 (−0.51, 0.20) −0.09 (−0.37, 0.20) −0.01 (−0.31, 0.30) 0.03 (−0.21, 0.26) −0.01 (−0.29, 0.27) −0.05 (−0.24, 0.14) Female 20−39 0.10 (−0.26, 0.45) 0.05 (−0.22, 0.33) −0.10 (−0.39, 0.19) −0.03 (−0.34, 0.28) −0.01 (−0.32, 0.30) 0.00 (−0.14, 0.15) 39−59 −0.09 (−0.43, 0.25) −0.04 (−0.31, 0.23) −0.19 (−0.44, 0.06) −0.13 (−0.44, 0.18) 0.02 (−0.30, 0.34) 0.12 (−0.03, 0.26) PFNA Male 20−39 0.16 (−0.20, 0.52) 0.23 (−0.09, 0.55) −0.19 (−0.51, 0.13) 0.13 (−0.09, 0.34) 0.20 (−0.08, 0.47) 0.12 (−0.09, 0.32) 39−59 −0.08 (−0.46, 0.31) −0.04 (−0.36, 0.27) −0.11 (−0.44, 0.21) −0.01 (−0.27, 0.25) −0.06 (−0.36, 0.24) −0.10 (−0.3, 0.11) Female 20−39 −0.1 (−0.58, 0.38) −0.02 (−0.40, 0.36) −0.17 (−0.57, 0.23) −0.14 (−0.55, 0.28) −0.15 (−0.58, 0.27) −0.08 (−0.27, 0.12) 39−59 0.29 (−0.11, 0.69) 0.42 (0.11, 0.73) −0.20 (−0.49, 0.09) 0.18 (−0.17, 0.54) 0.51 (0.14, 0.88) 0.31 (0.14, 0.48) n-PFOA Male 20−39 0.02 (−0.45, 0.49) −0.12 (−0.54, 0.30) −0.15 (−0.56, 0.26) −0.15 (−0.42, 0.12) −0.18 (−0.53, 0.17) 0.09 (−0.18, 0.37) 39−59 0.09 (−0.42, 0.60) 0.07 (−0.35, 0.49) −0.24 (−0.67, 0.18) −0.07 (−0.41, 0.27) −0.06 (−0.46, 0.35) −0.01 (−0.27, 0.24) Female 20−39 −0.12 (−0.72, 0.49) −0.28 (−0.74, 0.19) −0.33 (−0.86, 0.20) −0.65 (−1.15, −0.15) −0.55 (−1.07, −0.03) 0.03 (−0.23, 0.28) 39−59 0.29 (−0.23, 0.82) 0.34 (−0.07, 0.75) −0.29 (−0.67, 0.10) 0.10 (−0.37, 0.57) 0.37 (−0.11, 0.85) 0.23 (0.01, 0.44) n-PFOS Male 20−39 −0.25 (−0.81, 0.31) −0.37 (−0.86, 0.13) −0.49 (−0.98, −0.01) −0.32 (−0.64, 0.00) −0.40 (−0.81, 0.02) 0.05 (−0.28, 0.37) 39−59 −0.65 (−1.25, −0.06) −0.59 (−1.06, −0.11) −0.45 (−0.95, 0.04) −0.61 (−0.99, −0.23) −0.75 (−1.20, −0.29) −0.20 (−0.50, 0.11) Female 20−39 −0.35 (−1.02, 0.32) −0.15 (−0.67, 0.37) −0.25 (−0.84, 0.35) −0.35 (−0.92, 0.22) −0.25 (−0.84, 0.34) 0.06 (−0.22, 0.33) 39−59 −0.18 (−0.81, 0.45) −0.03 (−0.52, 0.45) −0.37 (−0.82, 0.08) −0.27 (−0.82, 0.28) −0.06 (−0.63, 0.51) 0.12 (−0.13, 0.37) Sm-PFOS Male 20−39 −0.28 (−0.87, 0.31) −0.32 (−0.84, 0.19) −0.47 (−0.98, 0.04) −0.38 (−0.72, −0.05) −0.44 (−0.88, −0.01) 0.09 (−0.25, 0.44) 39−59 −0.60 (−1.18, −0.02) −0.54 (−1.01, −0.07) −0.39 (−0.87, 0.09) −0.57 (−0.95, −0.19) −0.73 (−1.18, −0.28) −0.27 (−0.57, 0.02) Female 20−39 −0.17 (−0.81, 0.47) −0.17 (−0.66, 0.33) −0.19 (−0.76, 0.38) −0.50 (−1.04, 0.04) −0.32 (−0.88, 0.23) 0.16 (−0.10, 0.43) 39−59 0.23 (−0.40, 0.85) 0.38 (−0.10, 0.87) −0.25 (−0.70, 0.21) 0.00 (−0.56, 0.57) 0.35 (−0.23, 0.93) 0.25 (0.00, 0.50) Note. Models were adjusted for race, PIR, physical activity, smoking status, drinking status, BMI, waist, HDL.
下载: 导出CSV
S13. Regression coefficients for regional fat distribution associated with PFAS in sensitive analyses by additionally adjusting low−density lipoproteins (LDL)
Variable Percent Change (95% CI) Trunk fat mass Android fat mass Gynoid fat mass Subcutaneous fat mass Total abdominal fat mass Visceral adipose tissue mass PFOA Male 20−39 −0.11 (−0.83, 0.61) −0.16 (−0.79, 0.47) −0.63 (−1.22, −0.03) −0.23 (−0.65, 0.19) −0.21 (−0.76, 0.34) 0.13 (−0.30, 0.56) 39−59 −0.06 (−0.78, 0.66) −0.07 (−0.68, 0.54) 0.10 (−0.51, 0.71) 0.22 (−0.26, 0.71) 0.18 (−0.42, 0.79) −0.11 (−0.50, 0.29) Female 20−39 0.37 (−0.40, 1.14) −0.04 (−0.65, 0.58) −0.26 (−0.82, 0.29) −0.32 (−0.97, 0.34) −0.29 (−0.96, 0.38) 0.00 (−0.30, 0.31) 39−59 0.61 (−0.36, 1.59) 0.05 (−0.63, 0.72) 0.30 (−0.29, 0.89) 0.28 (−0.44, 0.99) 0.26 (−0.51, 1.03) 0.06 (−0.31, 0.43) PFOS Male 20−39 −0.17 (−1.08, 0.73) −0.35 (−1.13, 0.44) −0.75 (−1.50, 0.00) −0.49 (−1.01, 0.03) −0.53 (−1.21, 0.16) 0.20 (−0.34, 0.74) 39−59 0.11 (−0.84, 1.06) 0.17 (−0.63, 0.97) −0.02 (−0.83, 0.78) 0.47 (−0.16, 1.11) 0.52 (−0.27, 1.30) 0.01 (−0.51, 0.53) Female 20−39 0.64 (−0.49, 1.76) 0.62 (−0.26, 1.51) −0.04 (−0.85, 0.77) 0.30 (−0.65, 1.26) 0.30 (−0.68, 1.28) 0.05 (−0.40, 0.50) 39−59 1.66 (0.23, 3.10) 0.81 (−0.17, 1.80) 0.30 (−0.58, 1.18) 0.63 (−0.43, 1.69) 1.05 (−0.07, 2.17) 0.55 (0.01, 1.09) PFHxS Male 20−39 −0.10 (−0.56, 0.36) −0.14 (−0.55, 0.27) −0.26 (−0.66, 0.14) −0.26 (−0.53, 0.02) −0.28 (−0.64, 0.07) 0.12 (−0.14, 0.38) 39−59 −0.24 (−0.67, 0.19) −0.20 (−0.55, 0.16) −0.11 (−0.48, 0.27) −0.21 (−0.50, 0.08) −0.25 (−0.59, 0.09) −0.12 (−0.35, 0.12) Female 20−39 0.01 (−0.52, 0.54) −0.15 (−0.57, 0.27) −0.18 (−0.62, 0.27) −0.29 (−0.75, 0.17) −0.32 (−0.79, 0.15) −0.10 (−0.32, 0.12) 39−59 0.49 (0.02, 0.97) 0.39 (0.02, 0.76) −0.04 (−0.38, 0.30) 0.31 (−0.11, 0.74) 0.48 (0.04, 0.92) 0.18 (−0.02, 0.38) PFDeA Male 20−39 0.19 (−0.17, 0.54) 0.18 (−0.14, 0.49) −0.28 (−0.59, 0.03) 0.04 (−0.18, 0.25) 0.10 (−0.17, 0.38) 0.14 (−0.06, 0.34) 39−59 0.09 (−0.33, 0.50) 0.11 (−0.23, 0.44) −0.08 (−0.43, 0.27) 0.17 (−0.11, 0.44) 0.19 (−0.14, 0.51) 0.06 (−0.16, 0.29) Female 20−39 0.04 (−0.34, 0.43) 0.01 (−0.30, 0.32) −0.17 (−0.50, 0.15) −0.07 (−0.41, 0.27) −0.04 (−0.39, 0.31) −0.03 (−0.19, 0.13) 39−59 0.01 (−0.40, 0.41) 0.10 (−0.21, 0.42) −0.20 (−0.49, 0.10) −0.14 (−0.50, 0.23) 0.13 (−0.24, 0.51) 0.23 (0.06, 0.40) PFNA Male 20−39 0.25 (−0.14, 0.63) 0.26 (−0.08, 0.60) −0.14 (−0.48, 0.19) 0.11 (−0.12, 0.34) 0.19 (−0.11, 0.49) 0.12 (−0.10, 0.34) 39−59 0.09 (−0.32, 0.51) 0.03 (−0.31, 0.36) −0.11 (−0.46, 0.24) 0.04 (−0.24, 0.32) 0.02 (−0.31, 0.35) −0.04 (−0.27, 0.18) Female 20−39 −0.11 (−0.60, 0.38) −0.06 (−0.45, 0.33) −0.18 (−0.59, 0.23) −0.21 (−0.64, 0.22) −0.21 (−0.65, 0.22) −0.07 (−0.27, 0.13) 39−59 0.34 (−0.08, 0.76) 0.43 (0.10, 0.75) −0.12 (−0.42, 0.18) 0.20 (−0.18, 0.57) 0.48 (0.09, 0.86) 0.27 (0.09, 0.44) n-PFOA Male 20−39 0.16 (−0.35, 0.67) −0.03 (−0.50, 0.43) −0.14 (−0.59, 0.31) −0.17 (−0.47, 0.13) −0.14 (−0.53, 0.25) 0.20 (−0.10, 0.51) 39−59 0.18 (−0.35, 0.71) 0.14 (−0.31, 0.58) −0.11 (−0.56, 0.34) −0.04 (−0.41, 0.32) −0.06 (−0.49, 0.38) −0.05 (−0.33, 0.22) Female 20−39 −0.12 (−0.72, 0.49) −0.29 (−0.78, 0.19) −0.34 (−0.89, 0.21) −0.63 (−1.15, −0.12) −0.56 (−1.10, −0.02) −0.03 (−0.30, 0.23) 39−59 0.35 (−0.20, 0.91) 0.34 (−0.08, 0.76) −0.25 (−0.65, 0.14) 0.06 (−0.43, 0.55) 0.38 (−0.13, 0.88) 0.24 (0.02, 0.45) n-PFOS Male 20−39 −0.11 (−0.68, 0.47) −0.36 (−0.88, 0.16) −0.52 (−1.03, −0.02) −0.33 (−0.66, 0.00) −0.40 (−0.84, 0.04) 0.07 (−0.27, 0.42) 39−59 −0.51 (−1.18, 0.16) −0.57 (−1.12, −0.02) −0.52 (−1.08, 0.04) −0.62 (−1.07, −0.17) −0.75 (−1.28, −0.22) −0.21 (−0.55, 0.12) Female 20−39 −0.39 (−1.08, 0.29) −0.16 (−0.70, 0.38) −0.31 (−0.92, 0.31) −0.39 (−0.98, 0.20) −0.27 (−0.88, 0.34) 0.09 (−0.20, 0.39) 39−59 −0.25 (−0.94, 0.44) 0.02 (−0.52, 0.56) −0.23 (−0.73, 0.27) −0.35 (−0.96, 0.27) −0.07 (−0.71, 0.57) 0.15 (−0.12, 0.43) Sm-PFOS Male 20−39 −0.28 (−0.87, 0.31) −0.43 (−0.95, 0.10) −0.49 (−1.00, 0.02) −0.44 (−0.77, −0.10) −0.54 (−0.97, −0.10) 0.04 (−0.31, 0.38) 39−59 −0.44 (−1.04, 0.16) −0.47 (−0.97, 0.03) −0.38 (−0.89, 0.13) −0.64 (−1.05, −0.24) −0.80 (−1.28, −0.31) −0.28 (−0.58, 0.03) Female 20−39 −0.17 (−0.81, 0.47) −0.16 (−0.66, 0.34) −0.20 (−0.77, 0.37) −0.50 (−1.04, 0.04) −0.32 (−0.89, 0.25) 0.19 (−0.08, 0.47) 39−59 0.22 (−0.41, 0.85) 0.40 (−0.09, 0.88) −0.15 (−0.60, 0.31) 0.04 (−0.53, 0.60) 0.32 (−0.26, 0.91) 0.20 (−0.05, 0.45) Note. Models were adjusted for race, PIR, physical activity, smoking status, drinking status, BMI, waist, HDL, LDL.
下载: 导出CSV
S15. Receiver operating characteristic analysis of different PFAS to predict obesity
Dataset Predict model in training dataset AUC Predict model in test dataset AUC Male:20−39 Conventional model 0.9736 Conventional model 0.9727 Conventional model+PFOA 1.0000 Conventional model+PFOA 1.0000 Conventional model+PFOS 0.9961 Conventional model+PFOS 1.0000 Conventional model+PFHxS 0.9737 Conventional model+PFHxS 0.9752 Conventional model+PFDeA 0.9749 Conventional model+PFDeA 0.9770 Conventional model+PFNA 0.9737 Conventional model+PFNA 0.9740 Conventional model+n-PFOA 0.9701 Conventional model+n-PFOA 1.0000 Conventional model+n-PFOS 0.9699 Conventional model+n-PFOS 1.0000 Conventional model+Sm-PFOS 0.9701 Conventional model+Sm-PFOS 1.0000 Male:39−59 Conventional model 0.9557 Conventional model 0.9622 Conventional model+PFOA 0.9874 Conventional model+PFOA 1.0000 Conventional model+PFOS 0.9874 Conventional model+PFOS 1.0000 Conventional model+PFHxS 0.9557 Conventional model+PFHxS 0.9661 Conventional model+PFDeA 0.9560 Conventional model+PFDeA 0.9627 Conventional model+PFNA 0.9555 Conventional model+PFNA 0.9627 Conventional model+n-PFOA 0.9633 Conventional model+n-PFOA 1.0000 Conventional model+n-PFOS 0.9623 Conventional model+n-PFOS 1.0000 Conventional model+Sm-PFOS 0.9628 Conventional model+Sm-PFOS 1.0000 Female:20−39 Conventional model 0.9805 Conventional model 0.9886 Conventional model+PFOA 0.9915 Conventional model+PFOA 1.0000 Conventional model+PFOS 0.9908 Conventional model+PFOS 1.0000 Conventional model+PFHxS 0.9811 Conventional model+PFHxS 0.9884 Conventional model+PFDeA 0.9807 Conventional model+PFDeA 0.9910 Conventional model+PFNA 0.9805 Conventional model+PFNA 0.9925 Conventional model+n-PFOA 0.9733 Conventional model+n-PFOA 0.9953 Conventional model+n-PFOS 0.9738 Conventional model+n-PFOS 1.0000 Conventional model+Sm-PFOS 0.9731 Conventional model+Sm-PFOS 1.0000 Female:39−59 Conventional model 0.9642 Conventional model 0.9756 Conventional model+PFOA 0.9791 Conventional model+PFOA 1.0000 Conventional model+PFOS 0.9785 Conventional model+PFOS 1.0000 Conventional model+PFHxS 0.9643 Conventional model+PFHxS 0.9800 Conventional model+PFDeA 0.9651 Conventional model+PFDeA 0.9767 Conventional model+PFNA 0.9651 Conventional model+PFNA 0.9764 Conventional model+n-PFOA 0.9584 Conventional model+n-PFOA 0.9773 Conventional model+n-PFOS 0.9577 Conventional model+n-PFOS 0.9785 Conventional model+Sm-PFOS 0.9581 Conventional model+Sm-PFOS 0.9779 Note. Conventional model includes marital status, PIR, smoking status, drinking status, waist, diastolic blood pressure (DBP), high−density lipoprotein (HDL), direct HDL−cholesterol, total cholesterol, glycohemoglobin (%), insulin, insulin resistance index (HOMA−IR).
下载: 导出CSV
S5. Unadjusted associations from multivariable linear regression models between serum PFAS and regional fat distribution (Model 1)
Variable Trunk fat mass Android fat mass Gynoid fat mass Subcutaneous fat mass Total abdominal fat mass Visceral adipose tissue mass PFOA Male 20−39 −0.01 (−0.16, 0.15) −0.01 (−0.14, 0.13) 0.01 (−0.19, 0.20) −0.01 (−0.13, 0.11) −0.01 (−0.15, 0.12) −0.04 (−0.22, 0.13) 39−59 −0.11 (−0.29, 0.08) −0.10 (−0.27, 0.06) −0.09 (−0.32, 0.14) −0.06 (−0.22, 0.10) −0.08 (−0.26, 0.10) −0.12 (−0.31, 0.06) Female 20−39 −0.17 (−0.32, −0.01) −0.14 (−0.27, −0.02) −0.25 (−0.47, −0.03) −0.17 (−0.33, −0.01) −0.19 (−0.34, −0.03) −0.19 (−0.30, −0.07) 39−59 −0.07 (−0.29, 0.14) −0.09 (−0.28, 0.10) −0.02 (−0.31, 0.27) −0.12 (−0.36, 0.12) −0.11 (−0.34, 0.12) −0.04 (−0.21, 0.12) PFOS Male 20−39 0.07 (−0.13, 0.28) 0.06 (−0.12, 0.23) 0.10 (−0.16, 0.35) 0.03 (−0.13, 0.18) 0.04 (−0.14, 0.22) 0.07 (−0.16, 0.31) 39−59 −0.20 (−0.45, 0.04) −0.19 (−0.41, 0.02) −0.30 (−0.61, 0.00) −0.11 (−0.32, 0.11) −0.16 (−0.40, 0.07) −0.27 (−0.51, −0.02) Female 20−39 −0.04 (−0.24, 0.16) −0.02 (−0.19, 0.15) −0.05 (−0.33, 0.24) −0.02 (−0.23, 0.20) −0.04 (−0.25, 0.17) −0.08 (−0.24, 0.08) 39−59 0.02 (−0.28, 0.32) 0.01 (−0.24, 0.27) 0.21 (−0.19, 0.60) 0.03 (−0.29, 0.36) 0.04 (−0.28, 0.35) 0.04 (−0.19, 0.26) PFHxS Male 20−39 0.01 (−0.09, 0.11) 0.01 (−0.07, 0.09) 0.05 (−0.07, 0.17) 0.00 (−0.07, 0.08) 0.00 (−0.09, 0.08) −0.02 (−0.13, 0.09) 39−59 −0.09 (−0.20, 0.02) −0.08 (−0.17, 0.02) −0.06 (−0.19, 0.07) −0.05 (−0.15, 0.04) −0.08 (−0.18, 0.02) −0.13 (−0.24, −0.02) Female 20−39 −0.16 (−0.28, −0.05) −0.16 (−0.25, −0.06) −0.18 (−0.34, −0.02) −0.19 (−0.31, −0.07) −0.20 (−0.32, −0.08) −0.19 (−0.28, −0.10) 39−59 0.05 (−0.08, 0.17) 0.05 (−0.05, 0.16) 0.00 (−0.15, 0.16) 0.02 (−0.11, 0.15) 0.04 (−0.09, 0.17) 0.07 (−0.03, 0.16) PFDeA Male 20−39 −0.07 (−0.14, 0.01) −0.06 (−0.13, 0.00) −0.12 (−0.21, −0.03) −0.06 (−0.11, 0.00) −0.07 (−0.13, 0.00) −0.04 (−0.12, 0.04) 39−59 −0.33 (−0.45, −0.21) −0.27 (−0.38, −0.17) −0.37 (−0.51, −0.22) −0.22 (−0.32, −0.12) −0.27 (−0.38, −0.16) −0.30 (−0.42, −0.19) Female 20−39 −0.21 (−0.29, −0.12) −0.18 (−0.25, −0.11) −0.29 (−0.41, −0.17) −0.23 (−0.32, −0.14) −0.23 (−0.31, −0.14) −0.16 (−0.23, −0.10) 39−59 −0.36 (−0.47, −0.25) −0.29 (−0.39, −0.20) −0.40 (−0.54, −0.27) −0.38 (−0.49, −0.26) −0.36 (−0.47, −0.24) −0.18 (−0.27, −0.10) PFNA Male 20−39 0.02 (−0.06, 0.10) 0.02 (−0.05, 0.09) 0.02 (−0.08, 0.12) 0.01 (−0.05, 0.08) 0.02 (−0.05, 0.09) 0.04 (−0.05, 0.13) 39−59 −0.17 (−0.28, −0.06) −0.14 (−0.23, −0.05) −0.20 (−0.33, −0.07) −0.11 (−0.20, −0.02) −0.14 (−0.24, −0.04) −0.17 (−0.28, −0.07) Female 20−39 −0.19 (−0.29, −0.09) −0.15 (−0.24, −0.07) −0.22 (−0.36, −0.08) −0.19 (−0.30, −0.09) −0.2 (−0.31, −0.09) −0.17 (−0.25, −0.09) 39−59 −0.13 (−0.24, −0.02) −0.09 (−0.18, 0.00) −0.21 (−0.34, −0.07) −0.14 (−0.25, −0.02) −0.11 (−0.23, 0.00) −0.03 (−0.11, 0.05) n-PFOA Male 20−39 −0.11 (−0.22, −0.01) −0.10 (−0.2, −0.01) −0.16 (−0.30, −0.03) −0.10 (−0.18, −0.02) −0.11 (−0.20, −0.01) −0.03 (−0.16, 0.09) 39−59 −0.06 (−0.20, 0.08) −0.06 (−0.17, 0.06) −0.05 (−0.21, 0.11) −0.04 (−0.15, 0.07) −0.07 (−0.19, 0.06) −0.12 (−0.26, 0.01) Female 20−39 −0.29 (−0.43, −0.15) −0.26 (−0.38, −0.15) −0.40 (−0.59, −0.20) −0.35 (−0.49, −0.20) −0.34 (−0.49, −0.20) −0.24 (−0.35, −0.13) 39−59 −0.06 (−0.22, 0.10) −0.06 (−0.19, 0.07) −0.23 (−0.42, −0.04) −0.12 (−0.29, 0.04) −0.09 (−0.25, 0.07) 0.01 (−0.11, 0.13) n-PFOS Male 20−39 −0.17 (−0.29, −0.05) −0.16 (−0.26, −0.05) −0.22 (−0.37, −0.07) −0.15 (−0.24, −0.05) −0.17 (−0.27, −0.06) −0.14 (−0.28, 0.00) 39−59 −0.22 (−0.40, −0.04) −0.21 (−0.37, −0.06) −0.24 (−0.45, −0.02) −0.20 (−0.34, −0.05) −0.24 (−0.40, −0.07) −0.25 (−0.43, −0.07) Female 20−39 −0.23 (−0.37, −0.08) −0.20 (−0.33, −0.08) −0.31 (−0.51, −0.10) −0.24 (−0.40, −0.09) −0.24 (−0.39, −0.09) −0.17 (−0.29, −0.05) 39−59 −0.26 (−0.45, −0.07) −0.18 (−0.33, −0.02) −0.33 (−0.55, −0.11) −0.27 (−0.47, −0.08) −0.24 (−0.43, −0.05) −0.07 (−0.21, 0.08) Sm-PFOS Male 20−39 −0.06 (−0.18, 0.05) −0.06 (−0.16, 0.05) −0.07 (−0.22, 0.07) −0.07 (−0.16, 0.02) −0.07 (−0.18, 0.03) −0.02 (−0.16, 0.11) 39−59 0.03 (−0.13, 0.18) −0.02 (−0.15, 0.11) 0.00 (−0.18, 0.18) −0.03 (−0.15, 0.10) −0.04 (−0.18, 0.10) −0.08 (−0.23, 0.07) Female 20−39 −0.09 (−0.22, 0.05) −0.08 (−0.19, 0.03) −0.09 (−0.27, 0.10) −0.11 (−0.25, 0.03) −0.1 (−0.24, 0.04) −0.06 (−0.16, 0.05) 39−59 0.08 (−0.10, 0.25) 0.08 (−0.07, 0.23) −0.01 (−0.22, 0.20) 0.04 (−0.15, 0.22) 0.07 (−0.11, 0.25) 0.10 (−0.03, 0.23)
下载: 导出CSV
S6. Adjusted associations from multivariable linear regression models between serum PFAS and regional fat distribution (Model 2)
Variable Trunk fat mass Android fat mass Gynoid fat mass Subcutaneous fat mass Total abdominal fat mass Visceral adipose tissue mass PFOA Male 20−39 0.02 (−0.13, 0.17) 0.02 (−0.11, 0.15) 0.02 (−0.17, 0.21) 0.01 (−0.1, 0.13) 0.02 (−0.12, 0.15) 0.00 (−0.18, 0.18) 39−59 −0.11 (−0.30, 0.08) −0.10 (−0.27, 0.08) −0.08 (−0.32, 0.15) −0.06 (−0.23, 0.11) −0.08 (−0.26, 0.11) −0.11 (−0.31, 0.08) Female 20−39 −0.08 (−0.24, 0.07) −0.08 (−0.21, 0.05) −0.16 (−0.38, 0.05) −0.08 (−0.25, 0.08) −0.10 (−0.26, 0.06) −0.12 (−0.24, 0.01) 39−59 −0.04 (−0.26, 0.19) −0.05 (−0.24, 0.15) 0.04 (−0.26, 0.33) −0.06 (−0.31, 0.18) −0.05 (−0.29, 0.18) −0.01 (−0.18, 0.16) PFOS Male 20−39 0.10 (−0.10, 0.31) 0.09 (−0.08, 0.27) 0.11 (−0.14, 0.37) 0.05 (−0.1, 0.21) 0.08 (−0.11, 0.26) 0.13 (−0.11, 0.37) 39−59 −0.16 (−0.41, 0.09) −0.15 (−0.37, 0.08) −0.25 (−0.55, 0.05) −0.07 (−0.29, 0.15) −0.11 (−0.36, 0.13) −0.20 (−0.45, 0.06) Female 20−39 0.11 (−0.10, 0.32) 0.10 (−0.07, 0.27) 0.10 (−0.18, 0.39) 0.14 (−0.08, 0.35) 0.12 (−0.09, 0.33) 0.04 (−0.12, 0.21) 39−59 0.08 (−0.23, 0.39) 0.07 (−0.20, 0.34) 0.26 (−0.14, 0.67) 0.1 (−0.24, 0.45) 0.11 (−0.22, 0.44) 0.09 (−0.14, 0.33) PFHxS Male 20−39 0.01 (−0.09, 0.11) 0.01 (−0.08, 0.09) 0.05 (−0.08, 0.17) 0 (−0.08, 0.07) 0.00 (−0.09, 0.08) −0.02 (−0.14, 0.09) 39−59 −0.10 (−0.21, 0.01) −0.09 (−0.18, 0.01) −0.07 (−0.20, 0.06) −0.06 (−0.16, 0.03) −0.09 (−0.19, 0.01) −0.15 (−0.26, −0.03) Female 20−39 −0.13 (−0.25, −0.01) −0.13 (−0.23, −0.03) −0.15 (−0.31, 0.01) −0.16 (−0.28, −0.03) −0.17 (−0.29, −0.05) −0.16 (−0.25, −0.07) 39−59 0.06 (−0.07, 0.19) 0.07 (−0.04, 0.17) 0.02 (−0.14, 0.18) 0.04 (−0.09, 0.18) 0.07 (−0.07, 0.20) 0.09 (−0.01, 0.18) PFDeA Male 20−39 −0.05 (−0.12, 0.02) −0.05 (−0.11, 0.01) −0.11 (−0.20, −0.02) −0.05 (−0.1, 0.01) −0.05 (−0.12, 0.01) −0.01 (−0.09, 0.08) 39−59 −0.27 (−0.39, −0.15) −0.22 (−0.32, −0.12) −0.33 (−0.47, −0.19) −0.18 (−0.28, −0.08) −0.21 (−0.32, −0.10) −0.20 (−0.32, −0.09) Female 20−39 −0.15 (−0.23, −0.06) −0.13 (−0.20, −0.06) −0.22 (−0.34, −0.11) −0.17 (−0.26, −0.08) −0.17 (−0.25, −0.08) −0.11 (−0.18, −0.04) 39−59 −0.26 (−0.37, −0.16) −0.22 (−0.31, −0.13) −0.34 (−0.47, −0.21) −0.3 (−0.41, −0.19) −0.26 (−0.37, −0.15) −0.09 (−0.17, −0.01) PFNA Male 20−39 0.03 (−0.05, 0.11) 0.03 (−0.04, 0.09) 0.03 (−0.07, 0.12) 0.02 (−0.04, 0.08) 0.03 (−0.05, 0.10) 0.06 (−0.04, 0.15) 39−59 −0.12 (−0.22, −0.01) −0.1 (−0.19, 0.00) −0.16 (−0.28, −0.03) −0.07 (−0.16, 0.02) −0.09 (−0.19, 0.01) −0.11 (−0.21, 0.00) Female 20−39 −0.14 (−0.24, −0.04) −0.12 (−0.20, −0.03) −0.18 (−0.32, −0.03) −0.15 (−0.26, −0.04) −0.15 (−0.26, −0.04) −0.12 (−0.2, −0.04) 39−59 −0.06 (−0.16, 0.05) −0.02 (−0.12, 0.07) −0.15 (−0.29, −0.02) −0.07 (−0.18, 0.05) −0.03 (−0.15, 0.08) 0.04 (−0.04, 0.12) n-PFOA Male 20−39 −0.10 (−0.21, 0.01) −0.09 (−0.19, 0.00) −0.15 (−0.29, −0.02) −0.09 (−0.18, −0.01) −0.1 (−0.2, 0.00) −0.01 (−0.14, 0.12) 39−59 −0.06 (−0.20, 0.08) −0.05 (−0.17, 0.07) −0.07 (−0.23, 0.09) −0.04 (−0.15, 0.07) −0.06 (−0.18, 0.07) −0.10 (−0.23, 0.04) Female 20−39 −0.25 (−0.39, −0.12) −0.23 (−0.35, −0.12) −0.34 (−0.53, −0.14) −0.31 (−0.45, −0.16) −0.30 (−0.44, −0.16) −0.21 (−0.32, −0.10) 39−59 −0.01 (−0.17, 0.15) −0.02 (−0.15, 0.11) −0.21 (−0.39, −0.02) −0.09 (−0.25, 0.07) −0.05 (−0.21, 0.11) 0.06 (−0.05, 0.18) n-PFOS Male 20−39 −0.14 (−0.26, −0.02) −0.13 (−0.23, −0.02) −0.19 (−0.34, −0.03) −0.12 (−0.22, −0.03) −0.14 (−0.25, −0.03) −0.09 (−0.24, 0.05) 39−59 −0.19 (−0.38, −0.01) −0.19 (−0.34, −0.03) −0.22 (−0.43, −0.01) −0.18 (−0.33, −0.03) −0.21 (−0.37, −0.04) −0.20 (−0.38, −0.02) Female 20−39 −0.17 (−0.32, −0.02) −0.16 (−0.28, −0.03) −0.24 (−0.45, −0.04) −0.18 (−0.34, −0.03) −0.19 (−0.34, −0.03) −0.14 (−0.26, −0.02) 39−59 −0.18 (−0.37, 0.00) −0.12 (−0.27, 0.03) −0.28 (−0.50, −0.06) −0.22 (−0.41, −0.03) −0.17 (−0.36, 0.02) 0.01 (−0.13, 0.15) Sm-PFOS Male 20−39 −0.06 (−0.18, 0.07) −0.05 (−0.15, 0.06) −0.07 (−0.22, 0.08) −0.06 (−0.16, 0.03) −0.06 (−0.17, 0.04) 0.00 (−0.14, 0.14) 39−59 0.01 (−0.14, 0.17) −0.02 (−0.16, 0.11) −0.01 (−0.19, 0.18) −0.04 (−0.16, 0.09) −0.05 (−0.19, 0.09) −0.09 (−0.24, 0.06) Female 20−39 −0.06 (−0.20, 0.07) −0.06 (−0.17, 0.05) −0.05 (−0.23, 0.14) −0.08 (−0.22, 0.06) −0.07 (−0.21, 0.06) −0.04 (−0.15, 0.07) 39−59 0.12 (−0.06, 0.29) 0.11 (−0.04, 0.26) 0.01 (−0.20, 0.22) 0.07 (−0.12, 0.25) 0.11 (−0.07, 0.29) 0.14 (0.01, 0.28) Note. Model 2 was adjusted for race, PIR, physical activity, smoking status, drinking status.
下载: 导出CSV
S7. Adjusted associations from multivariable linear regression models between serum PFAS and A/G ratio
Variable Male Female β (95% CI) P value β (95% CI) P value PFOA 20−39 0.97 (0.04, 1.89) 0.04 0.54 (−0.55, 1.64) 0.33 39−59 0.18 (−0.61, 0.98) 0.65 −0.60 (−1.62, 0.41) 0.25 PFOS 20−39 0.79 (−0.38, 1.96) 0.19 0.85 (−0.75, 2.45) 0.30 39−59 0.68 (−0.33, 1.70) 0.19 −0.27 (−1.74, 1.21) 0.72 PFHxS 20−39 0.11 (−0.49, 0.70) 0.72 0.04 (−0.77, 0.85) 0.93 39−59 0.11 (−0.33, 0.55) 0.64 0.39 (−0.23, 1.00) 0.21 PFDeA 20−39 0.59 (0.13, 1.04) 0.01 0.07 (−0.53, 0.67) 0.83 39−59 0.28 (−0.14, 0.69) 0.19 0.47 (−0.06, 0.99) 0.08 PFNA 20−39 0.53 (0.04, 1.03) 0.04 0.15 (−0.60, 0.90) 0.70 39−59 0.30 (−0.12, 0.72) 0.16 0.96 (0.43, 1.50) <0.01 n-PFOA 20−39 0.31 (−0.43, 1.05) 0.41 −0.15 (−1.11, 0.81) 0.76 39−59 0.19 (−0.33, 0.71) 0.48 0.88 (0.20, 1.57) 0.01 n-PFOS 20−39 0.31 (−0.53, 1.14) 0.47 −0.05 (−1.13, 1.02) 0.92 39−59 0.13 (−0.52, 0.78) 0.69 0.36 (−0.49, 1.21) 0.41 Sm-PFOS 20−39 0.02 (−0.83, 0.86) 0.97 −0.25 (−1.25, 0.75) 0.62 39−59 −0.04 (−0.63, 0.55) 0.89 0.60 (−0.19, 1.39) 0.14
下载: 导出CSV
S8. Associations between joint assessments of fat distribution and serum PFAS in NHANES, 2011–2018
Variable Male Female 20−39 39−59 20−39 39−59 PFOA 0.28 (−0.11, 0.67) 0.13 (−0.09, 0.36) 0.22 (0.00, 0.44) 0.33 (−0.06, 0.72) PFOS 0.48 (−0.08, 1.04) 0.27 (−0.13, 0.67) 0.33 (−0.23, 0.89) 1.68 (0.43, 2.93) PFHxS 0.11 (−0.02, 0.24) 0.09 (−0.03, 0.22) 0.08 (−0.06, 0.22) 0.24 (0.07, 0.42) PFDeA 0.14 (0.02, 0.26) 0.03 (−0.04, 0.11) 0.02 (−0.01, 0.05) 0.18 (0.07, 0.29) PFNA 0.19 (0.00, 0.37) 0.02 (−0.02, 0.06) 0.04 (−0.05, 0.14) 0.41 (0.17, 0.65) n-PFOA 0.14 (0.01, 0.27) 0.03 (−0.01, 0.06) 0.46 (−0.03, 0.95) 0.46 (0.17, 0.76) n-PFOS 0.35 (−0.03, 0.74) 0.62 (0.11, 1.12) 0.18 (−0.11, 0.48) 0.22 (0.05, 0.38) Sm-PFOS 0.48 (0.01, 0.96) 0.77 (0.21, 1.34) 0.25 (−0.04, 0.54) 0.29 (0.07, 0.51)
下载: 导出CSV
S9. Adjusted associations from multivariable linear regression models between serum PFAS and trunk fat mass, android fat mass in subgroup (BMI < 25.0)
Variable Trunk fat mass Android fat mass Male Female Male Female 20−39 39−59 20−39 39−59 20−39 39−59 20−39 39−59 PFOA Tertile 1 Ref Ref Ref Ref Ref Ref Ref Ref Tertile 2 0.09
(−0.42, 0.60)−1.76
(−3.06, −0.45)0.16
(−0.62, 0.94)− 0.23
(−0.28, 0.74)0.28
(−0.69, 1.25)−0.25
(−0.93, 0.43)−0.18
(−0.90, 0.53)Tertile 3 − − − − − − − − PFOS Tertile 1 Ref Ref Ref Ref Ref Ref Ref Ref Tertile 2 0.16
(−0.77, 1.09)−1.61
(−3.41, 0.19)0.18
(−0.87, 1.23)− 0.18
(−0.76, 1.11)0.27
(−0.95, 1.48)0.56
(−0.34, 1.46)0.62
(−0.24, 1.49)Tertile 3 − − − − − − − − PFHxS Tertile 1 Ref Ref Ref Ref Ref Ref Ref Ref Tertile 2 −0.14
(−0.57, 0.28)−0.43
(−0.96, 0.09)−0.23
(−0.70, 0.23)0.47
(−0.19, 1.14)−0.06
(−0.50, 0.38)−0.20
(−0.64, 0.24)0.09
(−0.34, 0.53)0.20
(−0.35, 0.75)Tertile 3 − − − − − − − − PFDeA Tertile 1 Ref Ref Ref Ref Ref Ref Ref Ref Tertile 2 0.21
(−0.16, 0.58)−0.61
(−1.20, −0.03)−0.12
(−0.46, 0.22)−0.26
(−0.88, 0.36)0.24
(−0.14, 0.62)−0.3
(−0.78, 0.18)0.00
(−0.31, 0.31)−0.20
(−0.71, 0.30)Tertile 3 − − − − − − − − PFNA Tertile 1 Ref Ref Ref Ref Ref Ref Ref Ref Tertile 2 0.01
(−0.33, 0.36)−0.21
(−0.74, 0.32)−0.12
(−0.50, 0.25)0.20
(−0.44, 0.83)0.06
(−0.29, 0.42)0.03
(−0.40, 0.47)0.00
(−0.34, 0.35)0.24
(−0.28, 0.77)Tertile 3 − − − − − − − − n-PFOA Tertile 1 Ref Ref Ref Ref Ref Ref Ref Ref Tertile 2 −0.13
(−0.63, 0.37)−0.36
(−1.05, 0.33)−0.03
(−0.57, 0.51)0.61
(−0.07, 1.30)0.03
(−0.45, 0.51)−0.26
(−0.90, 0.37)0.05
(−0.44, 0.53)0.53
(−0.12, 1.17)Tertile 3 − − − − − − − − n-PFOS Tertile 1 Ref Ref Ref Ref Ref Ref Ref Ref Tertile 2 −0.68
(−1.20, −0.17)−0.51
(−1.26, 0.24)−0.76
(−1.24, −0.28)0.12
(−0.73, 0.98)−0.46
(−0.97, 0.05)−0.64
(−1.31, 0.04)−0.27
(−0.74, 0.21)0.12
(−0.64, 0.89)Tertile 3 − − − − − − − − Sm-PFOS Tertile 1 Ref Ref Ref Ref Ref Ref Ref Ref Tertile 2 −0.38
(−0.95, 0.20)−0.19
(−0.87, 0.48)−0.53
(−1.08, 0.03)0.58
(−0.18, 1.34)−0.16
(−0.72, 0.40)−0.21
(−0.84, 0.42)−0.18
(−0.70, 0.34)0.58
(−0.10, 1.26)Tertile 3 − − − − − − − − Note. Models were adjusted for race, PIR, physical activity, smoking status, drinking status, BMI, waist, HDL.
下载: 导出CSV
S10. Adjusted associations from multivariable linear regression models between serum PFAS and gynoid fat mass, subcutaneous fat mass in subgroup (BMI < 25.0)
Variable Gynoid fat mass Subcutaneous fat mass Male Female Male Female 20−39 39−59 20−39 39−59 20−39 39−59 20−39 39−59 PFOA Tertile 1 Ref Ref Ref Ref Ref Ref Ref Ref Tertile 2 −0.14
(−0.59, 0.31)−0.13
(−0.95, 0.68)−0.17
(−0.67, 0.33)0.41
(−0.05, 0.87)0.29
(−0.22, 0.79)0.88
(−0.18, 1.95)−0.47
(−1.19, 0.25)−0.31
(−1.08, 0.46)Tertile 3 − − − − − − − − PFOS Tertile 1 Ref Ref Ref Ref Ref Ref Ref Ref Tertile 2 0.40
(−0.41, 1.20)0.37
(−0.64, 1.38)−0.27
(−0.94, 0.39)0.08
(−0.56, 0.71)0.40
(−0.53, 1.33)−0.34
(−1.76, 1.09)0.44
(−0.55, 1.43)0.31
(−0.67, 1.30)Tertile 3 − − − − − − − − PFHxS Tertile 1 Ref Ref Ref Ref Ref Ref Ref Ref Tertile 2 −0.05
(−0.41, 0.31)−0.16
(−0.53, 0.21)0.04
(−0.34, 0.41)0.19
(−0.19, 0.57)−0.30
(−0.71, 0.11)−0.37
(−0.78, 0.04)0.13
(−0.30, 0.56)−0.18
(−0.76, 0.41)Tertile 3 − − − − − − − − PFDeA Tertile 1 Ref Ref Ref Ref Ref Ref Ref Ref Tertile 2 0.00
(−0.32, 0.31)0.20
(−0.20, 0.61)−0.13
(−0.40, 0.14)−0.04
(−0.39, 0.32)−0.07
(−0.44, 0.29)0.10
(−0.36, 0.56)−0.05
(−0.36, 0.27)−0.38
(−0.91, 0.16)Tertile 3 − − − − − − − − PFNA Tertile 1 Ref Ref Ref Ref Ref Ref Ref Ref Tertile 2 −0.01
(−0.30, 0.28)0.18
(−0.18, 0.54)−0.09
(−0.39, 0.21)0.92
(−0.28, 0.46)−0.05
(−0.38, 0.28)0.13
(−0.28, 0.54)−0.01
(−0.35, 0.34)0.02
(−0.54, 0.58)Tertile 3 − − − − − − − − n-PFOA Tertile 1 Ref Ref Ref Ref Ref Ref Ref Ref Tertile 2 0.13
(−0.28, 0.53)0.19
(−0.36, 0.75)−0.24
(−0.65, 0.17)0.02
(−0.49, 0.52)−0.44
(−0.87, 0.00)0.28
(−0.32, 0.87)−0.02
(−0.48, 0.44)−0.19
(−0.94, 0.55)Tertile 3 − − − − − − − − n-PFOS Tertile 1 Ref Ref Ref Ref Ref Ref Ref Ref Tertile 2 −0.15
(−0.60, 0.29)0.19
(−0.36, 0.75)−0.03
(−0.43, 0.37)0.10
(−0.48, 0.69)−0.61
(−1.07, −0.15)−0.45
(−1.08, 0.19)−0.02
(−0.48, 0.43)−0.19
(−1.06, 0.67)Tertile 3 − − − − − − − − Sm-PFOS Tertile 1 Ref Ref Ref Ref Ref Ref Ref Ref Tertile 2 0.09
(−0.38, 0.57)0.05
(−0.50, 0.60)−0.04
(−0.48, 0.40)0.17
(−0.35, 0.70)−0.56
(−1.06, −0.06)−0.24
(−0.82, 0.35)0.07
(−0.43, 0.57)−0.04
(−0.83, 0.75)Tertile 3 − − − − − − − − Note. Models were adjusted for race, PIR, physical activity, smoking status, drinking status, BMI, waist, HDL.
下载: 导出CSV
S11. Adjusted associations from multivariable linear regression models between serum PFAS and total abdominal fat mass, visceral adipose tissue mass in subgroup (BMI < 25.0)
Variable Total abdominal fat mass Visceral adipose tissue mass Male Female Male Female 20−39 39−59 20−39 39−59 20−39 39−59 20−39 39−59 PFOA Tertile 1 Ref Ref Ref Ref Ref Ref Ref Ref Tertile 2 0.22
(−0.37, 0.81)−0.7
(−1.94, 0.55)−0.47
(−1.19, 0.25)−0.64
(−1.46, 0.19)0.28
(−0.14, 0.71)0.77
(0.26, 1.29)−0.12
(−0.59, 0.34)−0.66
(−1.26, −0.07)Tertile 3 − − − − − − − − PFOS Tertile 1 Ref Ref Ref Ref Ref Ref Ref Ref Tertile 2 0.55
(−0.52, 1.62)−1.23
(−2.73, 0.28)0.44
(−0.55, 1.43)−0.23
(−1.35, 0.88)−0.02
(−0.80, 0.77)0.32
(−0.54, 1.19)0.17
(−0.46, 0.80)−0.39
(−1.24, 0.45)Tertile 3 − − − − − − − − PFHxS Tertile 1 Ref Ref Ref Ref Ref Ref Ref Ref Tertile 2 −0.35
(−0.78, 0.08)−0.56
(−1.01, −0.11)−0.14
(−0.56, 0.29)0.00
(−0.58, 0.58)0.10
(−0.26, 0.45)−0.06
(−0.41, 0.30)−0.06
(−0.41, 0.29)0.40
(0.00, 0.80)Tertile 3 − − − − − − − − PFDeA Tertile 1 Ref Ref Ref Ref Ref Ref Ref Ref Tertile 2 0.27
(−0.11, 0.64)−0.54
(−1.04, −0.04)−0.02
(−0.33, 0.29)−0.33
(−0.86, 0.21)0.20
(−0.11, 0.51)−0.10
(−0.49, 0.29)0.08
(−0.17, 0.34)0.35
(−0.02, 0.72)Tertile 3 − − − − − − − − PFNA Tertile 1 Ref Ref Ref Ref Ref Ref Ref Ref Tertile 2 0.13
(−0.22, 0.48)−0.36
(−0.81, 0.09)0.05
(−0.29, 0.39)0.12
(−0.43, 0.68)0.11
(−0.18, 0.39)0.11
(−0.24, 0.45)0.14
(−0.14, 0.43)0.65
(0.28, 1.02)Tertile 3 − − − − − − − − n-PFOA Tertile 1 Ref Ref Ref Ref Ref Ref Ref Ref Tertile 2 −0.20
(−0.67, 0.26)−0.26
(−0.90, 0.37)0.09
(−0.38, 0.55)0.26
(−0.39, 0.91)−0.06
(−0.47, 0.35)−0.11
(−0.65, 0.42)−0.18
(−0.60, 0.25)0.35
(−0.11, 0.81)Tertile 3 − − − − − − − − n-PFOS Tertile 1 Ref Ref Ref Ref Ref Ref Ref Ref Tertile 2 −0.59
(−1.07, −0.10)−0.64
(−1.31, 0.04)−0.16
(−0.62, 0.30)−0.03
(−0.79, 0.73)−0.06
(−0.50, 0.39)−0.42
(−0.98, 0.15)−0.33
(−0.75, 0.08)0.74
(0.22, 1.26)Tertile 3 − − − − − − − − Sm-PFOS Tertile 1 Ref Ref Ref Ref Ref Ref Ref Ref Tertile 2 −0.36
(−0.89, 0.18)−0.21
(−0.84, 0.42)−0.04
(−0.54, 0.47)0.32
(−0.37, 1.01)−0.03
(−0.52, 0.45)−0.49
(−0.99, 0.01)−0.25
(−0.71, 0.20)0.62
(0.14, 1.10)Tertile 3 − − − − − − − − Note. Models were adjusted for race, PIR, physical activity, smoking status, drinking status, BMI, waist, HDL.
下载: 导出CSV
S14. Effect estimates and 95%confidence intervals (CI) for associations of structurally grouped PFAS concentrations with regional fat distribution
Variable Percent Change (95% CI) Trunk fat mass Android fat mass Gynoid fat mass Subcutaneous fat mass Total abdominal fat mass Visceral adipose tissue mass Total PFSAs level Male 20−39 −0.19 (−0.74, 0.35) −0.32 (−0.80, 0.16) −0.52 (−0.99, −0.04) −0.35 (−0.66, −0.04) −0.39 (−0.80, 0.01) 0.12 (−0.20, 0.44) 39−59 −0.52 (−1.11, 0.07) −0.47 (−0.95, 0.00) −0.44 (−0.93, 0.05) −0.51 (−0.90, −0.12) −0.65 (−1.11, −0.19) −0.22 (−0.52, 0.07) Female 20−39 −0.34 (−0.98, 0.30) −0.20 (−0.70, 0.30) −0.24 (−0.81, 0.33) −0.46 (−1.00, 0.09) −0.33 (−0.90, 0.23) 0.08 (−0.19, 0.34) 39−59 −0.11 (−0.75, 0.53) 0.08 (−0.42, 0.57) −0.35 (−0.80, 0.11) −0.27 (−0.84, 0.29) 0.04 (−0.55, 0.63) 0.21 (−0.05, 0.46) Short−chain PFSAs Male 20−39 −0.10 (−0.56, 0.36) −0.10 (−0.50, 0.30) −0.25 (−0.65, 0.15) −0.23 (−0.50, 0.04) −0.24 (−0.59, 0.11) 0.13 (−0.12, 0.39) 39−59 −0.24 (−0.67, 0.18) −0.15 (−0.50, 0.19) −0.13 (−0.50, 0.23) −0.18 (−0.46, 0.11) −0.20 (−0.53, 0.14) −0.08 (−0.31, 0.15) Female 20−39 0.01 (−0.52, 0.54) −0.16 (−0.58, 0.26) −0.18 (−0.62, 0.27) −0.29 (−0.75, 0.17) −0.32 (−0.79, 0.14) −0.1 (−0.32, 0.11) 39−59 0.45 (−0.02, 0.93) 0.39 (0.03, 0.76) −0.05 (−0.39, 0.29) 0.29 (−0.13, 0.71) 0.49 (0.06, 0.93) 0.22 (0.02, 0.41) Long−chain PFSAs Male 20−39 −0.13 (−0.69, 0.42) −0.27 (−0.76, 0.22) −0.5 (−0.98, −0.01) −0.31 (−0.63, 0.01) −0.35 (−0.76, 0.07) 0.13 (−0.20, 0.45) 39−59 −0.57 (−1.19, 0.04) −0.52 (−1.01, −0.03) −0.47 (−0.97, 0.04) −0.53 (−0.93, −0.13) −0.69 (−1.16, −0.21) −0.24 (−0.54, 0.07) Female 20−39 −0.35 (−1.00, 0.30) −0.17 (−0.67, 0.34) −0.27 (−0.85, 0.31) −0.42 (−0.97, 0.13) −0.29 (−0.86, 0.29) 0.10 (−0.17, 0.37) 39−59 −0.12 (−0.79, 0.55) 0.10 (−0.41, 0.62) −0.34 (−0.81, 0.14) −0.29 (−0.87, 0.30) 0.05 (−0.56, 0.66) 0.22 (−0.04, 0.49) Long−chain PFCAs Male 20−39 0.24 (−0.22, 0.70) 0.15 (−0.25, 0.56) −0.13 (−0.54, 0.27) −0.05 (−0.31, 0.22) 0.04 (−0.31, 0.38) 0.27 (0.01, 0.54) 39−59 0.14 (−0.34, 0.62) 0.15 (−0.24, 0.54) −0.17 (−0.57, 0.24) 0.05 (−0.27, 0.37) 0.06 (−0.33, 0.44) −0.01 (−0.25, 0.24) Female 20−39 −0.35 (−0.88, 0.17) −0.45 (−0.86, −0.03) −0.47 (−0.95, 0.00) −0.71 (−1.16, −0.26) −0.67 (−1.14, −0.21) −0.12 (−0.34, 0.11) 39−59 0.21 (−0.31, 0.74) 0.33 (−0.08, 0.73) −0.39 (−0.77, −0.01) −0.03 (−0.50, 0.44) 0.37 (−0.11, 0.85) 0.31 (0.10, 0.52) Note. Models were adjusted for race, PIR, physical activity, smoking status, drinking status, BMI, waist, HDL. Long−chain PFCAs:PFDeA; PFNA; n-PFOA; Long−chain PFSAs: PFOS; n-PFOS; Sm-PFOS; Short−chain PFSAs: PFHxS.
下载: 导出CSV
-
[1] Buck RC, Franklin J, Berger U, et al. Perfluoroalkyl and polyfluoroalkyl substances in the environment: terminology, classification, and origins. Integr Environ Assess, 2011; 7, 513−41. doi: 10.1002/ieam.258 [2] Glüge J, Scheringer M, Cousins IT, et al. An overview of the uses of per- and polyfluoroalkyl substances (PFAS). Environ Sci-Proc Imp, 2020; 22, 2345−73. [3] Rumsby PC, Mclaughlin CL, Hall T. Perfluorooctane sulphonate and perfluorooctanoic acid in drinking and environmental waters. Philos T Roy Soc A-Math, Phy, Eng Sci, 2009; 367, 4119−36. [4] Trudel D, Horowitz L, Wormuth M, et al. Estimating consumer exposure to PFOS and PFOA. Risk Anal, 2008; 28, 251−69. doi: 10.1111/j.1539-6924.2008.01017.x [5] Zhang T, Sun HW, Wu Q, et al. Perfluorochemicals in meat, eggs and indoor dust in China: assessment of sources and pathways of human exposure to perfluorochemicals. Environ Sci Technol, 2010; 44, 3572−9. doi: 10.1021/es1000159 [6] Steenland K, Tinker S, Frisbee S, et al. Association of perfluorooctanoic acid and perfluorooctane sulfonate with serum lipids among adults living near a chemical plant. American J Epidemiol, 2009; 170, 1268−78. doi: 10.1093/aje/kwp279 [7] Rosenmai AK, Taxvig C, Svingen T, et al. Fluorinated alkyl substances and technical mixtures used in food paper-packaging exhibit endocrine-related activity in vitro. Andrology, 2016; 4, 662−72. doi: 10.1111/andr.12190 [8] Cardenas A, Hivert MF, Gold DR, et al. Associations of perfluoroalkyl and polyfluoroalkyl substances with incident diabetes and microvascular disease. Diabetes Care, 2019; 42, 1824−32. doi: 10.2337/dc18-2254 [9] Lin CY, Chen PC, Lin YC, et al. Association among serum perfluoroalkyl chemicals, glucose homeostasis, and metabolic syndrome in adolescents and adults. Diabetes Care, 2009; 32, 702−7. doi: 10.2337/dc08-1816 [10] Conder JM, Hoke RA, De Wolf W, et al. Are PFCAs bioaccumulative? A critical review and comparison with regulatory criteria and persistent lipophilic compounds. Environ Sci Technol, 2008; 42, 995−1003. doi: 10.1021/es070895g [11] Gaballah S, Swank A, Sobus JR, et al. Evaluation of developmental toxicity, developmental neurotoxicity, and tissue dose in Zebrafish exposed to GenX and other PFAS. Environ Health Perspect, 2020; 128, 47005. doi: 10.1289/EHP5843 [12] Liu X, Zhang L, Chen LK, et al. Structure-based investigation on the association between perfluoroalkyl acids exposure and both gestational diabetes mellitus and glucose homeostasis in pregnant women. Environ Int, 2019; 127, 85−93. doi: 10.1016/j.envint.2019.03.035 [13] Caballero B. Humans against obesity: Who will win?. Adv Nutr, 2019; 10, S4−9. doi: 10.1093/advances/nmy055 [14] Kumanyika S, Dietz WH. Solving population-wide obesity - progress and future prospects. N Engl J Med, 2020; 383, 2197−200. doi: 10.1056/NEJMp2029646 [15] Lauby-Secretan B, Scoccianti C, Loomis D, et al. Body fatness and cancer--viewpoint of the IARC working group. N Engl J Med, 2016; 375, 794-8. [16] Wormser D, Kaptoge S, Di Angelantonio E, et al. Separate and combined associations of body-mass index and abdominal adiposity with cardiovascular disease: collaborative analysis of 58 prospective studies. Lancet, 2011; 377, 1085−95. doi: 10.1016/S0140-6736(11)60105-0 [17] Piché ME, Poirier P, Lemieux I, et al. Overview of epidemiology and contribution of obesity and body fat distribution to cardiovascular disease: an update. Prog Cardiovasc Dis, 2018; 61, 103−13. doi: 10.1016/j.pcad.2018.06.004 [18] Pischon T, Boeing H, Hoffmann K, et al. General and abdominal adiposity and risk of death in Europe. N Eng J Med, 2008; 359, 2105−20. doi: 10.1056/NEJMoa0801891 [19] Janis JA, Rifas-Shiman SL, Seshasayee SM, et al. Plasma concentrations of per- and polyfluoroalkyl substances and body composition from mid-childhood to early adolescence. J Clin Endocrinol Metab, 2021; 106, e3760−70. doi: 10.1210/clinem/dgab187 [20] Cardenas A, Hauser R, Gold DR, et al. Association of perfluoroalkyl and polyfluoroalkyl substances with adiposity. JAMA Netw Open, 2018; 1, e181493. doi: 10.1001/jamanetworkopen.2018.1493 [21] Calafat AM, Wong LY, Kuklenyik Z, et al. Polyfluoroalkyl chemicals in the U. S. population: data from the National Health and Nutrition Examination Survey (NHANES) 2003-2004 and comparisons with NHANES 1999-2000. Environ Health Perspect, 2007; 115, 1596−602. doi: 10.1289/ehp.10598 [22] Dos Santos MR, Da Fonseca GWP, Sherveninas LP, et al. Android to gynoid fat ratio and its association with functional capacity in male patients with heart failure. ESC Heart Fail, 2020; 7, 1101−8. doi: 10.1002/ehf2.12657 [23] Min Y, Ma XG, Sankaran K, et al. Sex-specific association between gut microbiome and fat distribution. Nat Commun, 2019; 10, 2408. doi: 10.1038/s41467-019-10440-5 [24] Xiao ZY, Guo B, Gong J, et al. Sex- and age-specific percentiles of body composition indices for Chinese adults using dual-energy X-ray absorptiometry. Eur J Nutr, 2017; 56, 2393−406. doi: 10.1007/s00394-016-1279-9 [25] Shan ZL, Guo YJ, Hu FB, et al. Association of low-carbohydrate and low-fat diets with mortality among US adults. JAMA Intern Med, 2020; 180, 513−23. doi: 10.1001/jamainternmed.2019.6980 [26] Motevalizadeh E, Díaz-López A, MartÍN-Luján F, et al. Prenatal factors associated with maternal cardiometabolic risk markers during pregnancy: the ECLIPSES study. Nutrients, 2023; 15, 1135. doi: 10.3390/nu15051135 [27] Sen P, Qadri S, Luukkonen PK, et al. Exposure to environmental contaminants is associated with altered hepatic lipid metabolism in non-alcoholic fatty liver disease. J Hepatol, 2022; 76, 283−93. doi: 10.1016/j.jhep.2021.09.039 [28] Attanasio R. Association between perfluoroalkyl acids and liver function: data on sex differences in adolescents. Data Brief, 2019; 27, 104618. doi: 10.1016/j.dib.2019.104618 [29] Attanasio R. Sex differences in the association between perfluoroalkyl acids and liver function in US adolescents: analyses of NHANES 2013-2016. Environ Pollut, 2019; 254, 113061. doi: 10.1016/j.envpol.2019.113061 [30] Mora AM, Oken E, Rifas-Shiman SL, et al. Prenatal exposure to perfluoroalkyl substances and adiposity in early and mid-childhood. Environ Health Perspect, 2017; 125, 467−73. doi: 10.1289/EHP246 [31] Braun JM, Chen A, Romano ME, et al. Prenatal perfluoroalkyl substance exposure and child adiposity at 8 years of age: the HOME study. Obesity, 2016; 24, 231−7. doi: 10.1002/oby.21258 [32] Chen Q, Zhang X, Zhao YJ, et al. Prenatal exposure to perfluorobutanesulfonic acid and childhood adiposity: a prospective birth cohort study in Shanghai, China. Chemosphere, 2019; 226, 17−23. doi: 10.1016/j.chemosphere.2019.03.095 [33] Domazet SL, Jensen TK, Wedderkopp N, et al. Exposure to perfluoroalkylated substances (PFAS) in relation to fitness, physical activity, and adipokine levels in childhood: the European youth heart study. Environ Res, 2020; 191, 110110. doi: 10.1016/j.envres.2020.110110 [34] Bloom MS, Commodore S, Ferguson PL, et al. Association between gestational PFAS exposure and Children's adiposity in a diverse population. Environ Res, 2022; 203, 111820. doi: 10.1016/j.envres.2021.111820 [35] Braun JM, Papandonatos GD, Li N, et al. Physical activity modifies the relation between gestational perfluorooctanoic acid exposure and adolescent cardiometabolic risk. Environ Res, 2022; 214, 114021. doi: 10.1016/j.envres.2022.114021 [36] Liu Y, Li N, Papandonatos GD, et al. Exposure to per- and polyfluoroalkyl substances and adiposity at age 12 years: evaluating periods of susceptibility. Environ Sc Technol, 2020; 54, 16039−49. doi: 10.1021/acs.est.0c06088 [37] Thomsen ML, Henriksen LS, Tinggaard J, et al. Associations between exposure to perfluoroalkyl substances and body fat evaluated by DXA and MRI in 109 adolescent boys. Environ Health, 2021; 20, 73. doi: 10.1186/s12940-021-00758-3 [38] Ding N, Karvonen-Gutierrez CA, Herman WH, et al. Perfluoroalkyl and polyfluoroalkyl substances and body size and composition trajectories in midlife women: the study of women's health across the nation 1999-2018. Int J Obes, 2021; 45, 1937−48. doi: 10.1038/s41366-021-00848-9 [39] Chen ZH, Yang TY, Walker DI, et al. Dysregulated lipid and fatty acid metabolism link perfluoroalkyl substances exposure and impaired glucose metabolism in young adults. Environ Int, 2020; 145, 106091. doi: 10.1016/j.envint.2020.106091 [40] Lind PM, Lind L, Salihovic S, et al. Serum levels of perfluoroalkyl substances (PFAS) and body composition - a cross-sectional study in a middle-aged population. Environ Res, 2022; 209, 112677. doi: 10.1016/j.envres.2022.112677 [41] Schulz K, Silva MR, Klaper R. Distribution and effects of branched versus linear isomers of PFOA, PFOS, and PFHxS: a review of recent literature. Sci Total Environ, 2020; 733, 139186. doi: 10.1016/j.scitotenv.2020.139186 [42] Zeeshan M, Yang YQ, Zhou Y, et al. Incidence of ocular conditions associated with perfluoroalkyl substances exposure: isomers of C8 Health Project in China. Environ Int, 2020; 137, 105555. doi: 10.1016/j.envint.2020.105555 [43] Chen FF, Yin SS, Kelly BC, et al. Isomer-specific transplacental transfer of perfluoroalkyl acids: results from a survey of paired maternal, cord sera, and placentas. Environ Sci Technol, 2017; 51, 5756−63. doi: 10.1021/acs.est.7b00268 [44] Liu YX, Li A, Buchanan S, et al. Exposure characteristics for congeners, isomers, and enantiomers of perfluoroalkyl substances in mothers and infants. Environ Int, 2020; 144, 106012. doi: 10.1016/j.envint.2020.106012 [45] Upham BL, Deocampo ND, Wurl B, et al. Inhibition of gap junctional intercellular communication by perfluorinated fatty acids is dependent on the chain length of the fluorinated tail. Int J Cancer, 1998; 78, 491−5. doi: 10.1002/(SICI)1097-0215(19981109)78:4<491::AID-IJC16>3.0.CO;2-9 [46] Kudo N, Suzuki-Nakajima E, Mitsumoto A, et al. Responses of the liver to perfluorinated fatty acids with different carbon chain length in male and female mice: in relation to induction of hepatomegaly, peroxisomal beta-oxidation and microsomal 1-acylglycerophosphocholine acyltransferase. Biol Pharm Bull, 2006; 29, 1952−7. doi: 10.1248/bpb.29.1952 [47] Gebbink WA, Berger U, Cousins IT. Estimating human exposure to PFOS isomers and PFCA homologues: the relative importance of direct and indirect (precursor) exposure. Environ Int, 2015; 74, 160−9. doi: 10.1016/j.envint.2014.10.013 [48] Zhang HM, Yolton K, Webster GM, et al. Prenatal and childhood perfluoroalkyl substances exposures and children's reading skills at ages 5 and 8years. Environ Int, 2018; 111, 224−31. doi: 10.1016/j.envint.2017.11.031 [49] Calafat AM, Kato K, Hubbard K, et al. Legacy and alternative per- and polyfluoroalkyl substances in the U. S. general population: paired serum-urine data from the 2013-2014 National Health and Nutrition Examination Survey. Environ Int, 2019; 131, 105048. doi: 10.1016/j.envint.2019.105048 [50] Lau C, Anitole K, Hodes C, et al. Perfluoroalkyl acids: a review of monitoring and toxicological findings. Toxicol Sci, 2007; 99, 366−94. doi: 10.1093/toxsci/kfm128 [51] Oberfield JL, Collins JL, Holmes CP, et al. A peroxisome proliferator-activated receptor gamma ligand inhibits adipocyte differentiation. Proc Natl Acad Sci U S A, 1999; 96, 6102−6. doi: 10.1073/pnas.96.11.6102 [52] Hines EP, White SS, Stanko JP, et al. Phenotypic dichotomy following developmental exposure to perfluorooctanoic acid (PFOA) in female CD-1 mice: low doses induce elevated serum leptin and insulin, and overweight in mid-life. Mol Cell Endocrinol, 2009; 304, 97−105. doi: 10.1016/j.mce.2009.02.021 [53] Kato K, Wong LY, Jia LT, et al. Trends in exposure to polyfluoroalkyl chemicals in the U. S. population: 1999-2008. Environ Sci Technol, 2011; 45, 8037−45. doi: 10.1021/es1043613 [54] Joensen UN, Veyrand B, Antignac JP, et al. PFOS (perfluorooctanesulfonate) in serum is negatively associated with testosterone levels, but not with semen quality, in healthy men. Hum Reprod, 2013; 28, 599−608. doi: 10.1093/humrep/des425 [55] Jensen AA, Leffers H. Emerging endocrine disrupters: perfluoroalkylated substances. Int J Androl, 2008; 31, 161−9. doi: 10.1111/j.1365-2605.2008.00870.x [56] Ding N, Harlow SD, Randolph JR JF, et al. Perfluoroalkyl and polyfluoroalkyl substances (PFAS) and their effects on the ovary. Hum Reprod Update, 2020; 26, 724−52. doi: 10.1093/humupd/dmaa018 [57] Liu P, Ji YT, Yuen T, et al. Blocking FSH induces thermogenic adipose tissue and reduces body fat. Nature, 2017; 546, 107−12. doi: 10.1038/nature22342 [58] Karpe F, Pinnick KE. Biology of upper-body and lower-body adipose tissue--link to whole-body phenotypes. Nat Rev Endocrinol, 2015; 11, 90-100. -

 点击查看大图
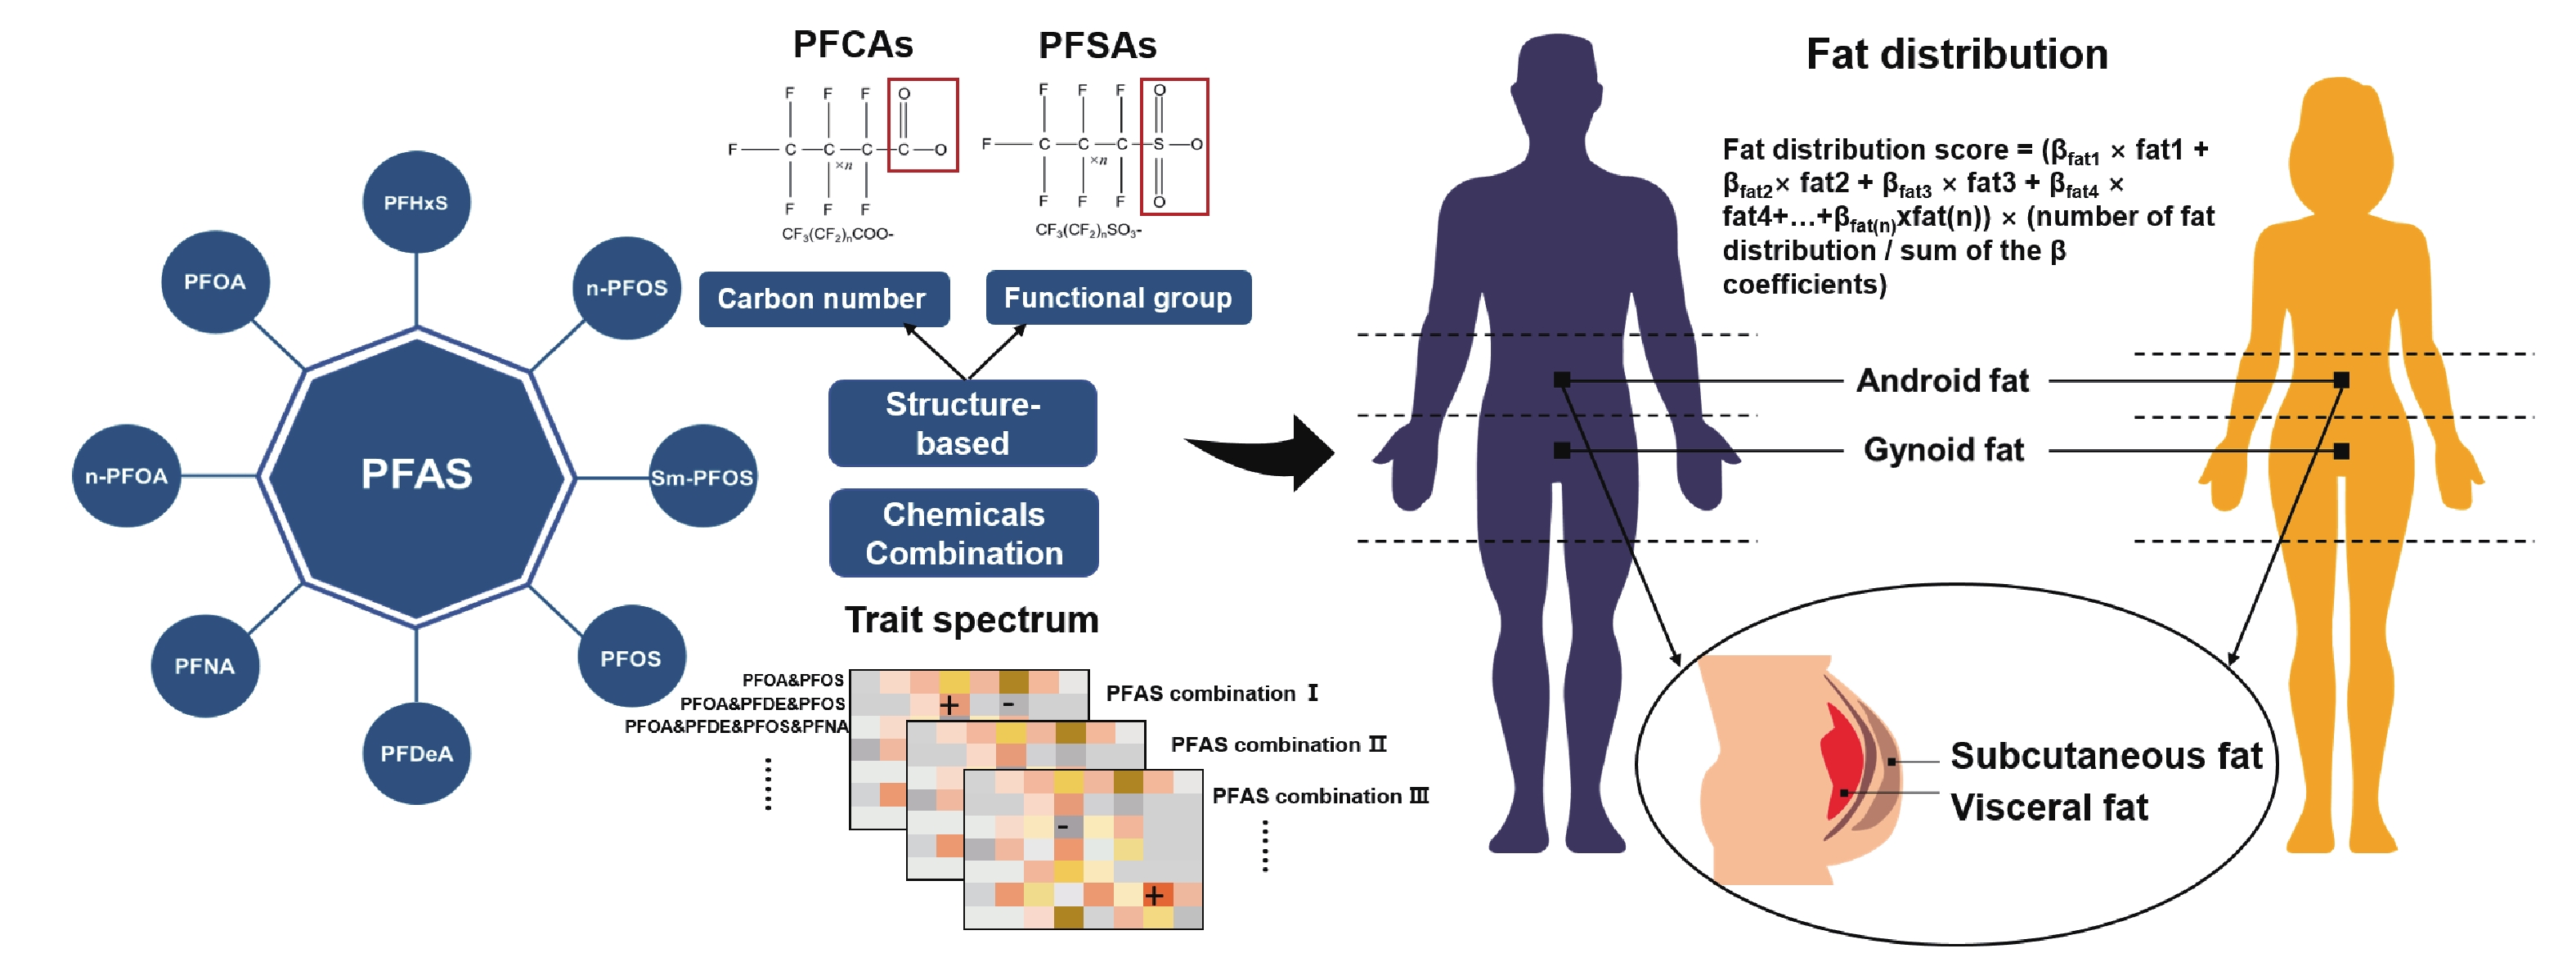
计量
- 文章访问数: 7462
- HTML全文浏览量: 3665
- PDF下载量: 99
- 被引次数: 0

 Quick Links