

 下载:
下载:


-
According to GLOBOCAN 2022, breast cancer remains the most prevalent malignancy among women worldwide, with an estimated 2.31 million new cases and 670,000 deaths reported in 2022. Triple-negative breast cancer (TNBC), characterized by the absence of estrogen receptor (ER), progesterone receptor (PR), and human epidermal growth factor receptor 2 (HER2) expression, accounts for approximately 10%–20% of all breast cancer cases globally, representing more than 230,000 new diagnoses each year. In China alone, approximately 357,200 new breast cancer cases and 75,000 deaths were reported in 2022, contributing to 15.5% of the global incidence and 11.2% of global mortality[1,2]. Compared with hormone receptor-positive or HER2-positive subtypes, TNBC exhibits a more aggressive biological phenotype and is associated with poorer clinical outcomes, with over 20% of patients experiencing disease recurrence within 3–5 years after diagnosis[3]. Despite numerous investigations exploring prognostic determinants—spanning clinicopathological, genomic, transcriptomic, and tumor microenvironmental factors[4,5]—traditional indicators such as tumor size, axillary lymph node status, and age at diagnosis remain suboptimal for accurately stratifying recurrence risk[6]. Meanwhile, the widespread clinical implementation of comprehensive molecular profiling is constrained by high cost, extended turnaround time, and technical complexity.
Hematoxylin and eosin (H&E) staining remains a cornerstone of pathological assessment due to its simplicity, cost-effectiveness, and ability to capture critical morphological features, such as tumor architecture, cellular composition, and spatial distribution. Recent studies have demonstrated that subtle variations in cell morphology visible in H&E-stained histopathological images can reflect underlying molecular alterations and are strongly associated with the prognosis of multiple malignancies[7-9]. The rapid development of deep learning has transformed image analysis, particularly within medical imaging and digital pathology. Applying deep learning algorithms to H&E-stained whole-slide images (WSIs) facilitates the extraction of high-dimensional morphological patterns associated with disease recurrence and metastasis potential. For instance, Zhang et al[8]. developed a prognostic model (PathoSig) based on H&E digital slides and validated its predictive performance in independent cohorts. Similarly, Saillard et al[10]. constructed deep learning models that outperformed conventional clinicopathological variables in predicting overall survival among patients with liver cancer. Collectively, these findings highlight the growing potential of integrating digital pathology with artificial intelligence for patient risk stratification. However, research focusing on early-stage TNBC remains limited.
A major challenge to the clinical translation of deep learning-based models lies in their limited interpretability. Due to the complex, nonlinear structure of neural networks, elucidating how parameters such as weights, biases, and inter-layer interactions influence the model output is often challenging. As a result, these models are frequently regarded as “black boxes”[11-13]. In the medical field, where transparency and decision accountability are paramount, model interpretability is especially critical. Current strategies to enhance interpretability generally fall into two major categories[14-16]: (1) direct visualization of model attention using techniques such as class activation maps (CAM)[17]; and (2) feature engineering approaches that transform image data into structured quantitative features—similar to those used in radiomics or pathomics[18]—followed by correlation analyses employing descriptors such as shape, texture, and first-order statistical metrics[19-21]. However, these approaches often compromise the predictive performance of the model. Moreover, few studies have explored interpretable, deep learning-based prognostic modeling using histopathological images in TNBC.
In this study, we analyzed 340 postoperative H&E-stained pathological sections from 318 TNBC patients with complete recurrence and metastasis follow-up data obtained from the Cancer Hospital, Chinese Academy of Medical Sciences (2009–2017). A deep learning framework was developed to extract image-derived features from WSIs and integrate them with clinical variables for recurrence and metastasis risk prediction. Independent external validation was performed using WSIs from 81 patients with TNBC in the Cancer Genome Atlas (TCGA) cohort. Furthermore, we conducted a differential analysis of cellular composition, extracted texture-related features from WSIs, and examined their associations with the tumor immune microenvironment and gene expression profiles. Through interpretability analysis of the model, we aimed to explore the biological mechanisms captured in histopathological images that may contribute to early TNBC recurrence and metastasis.
-
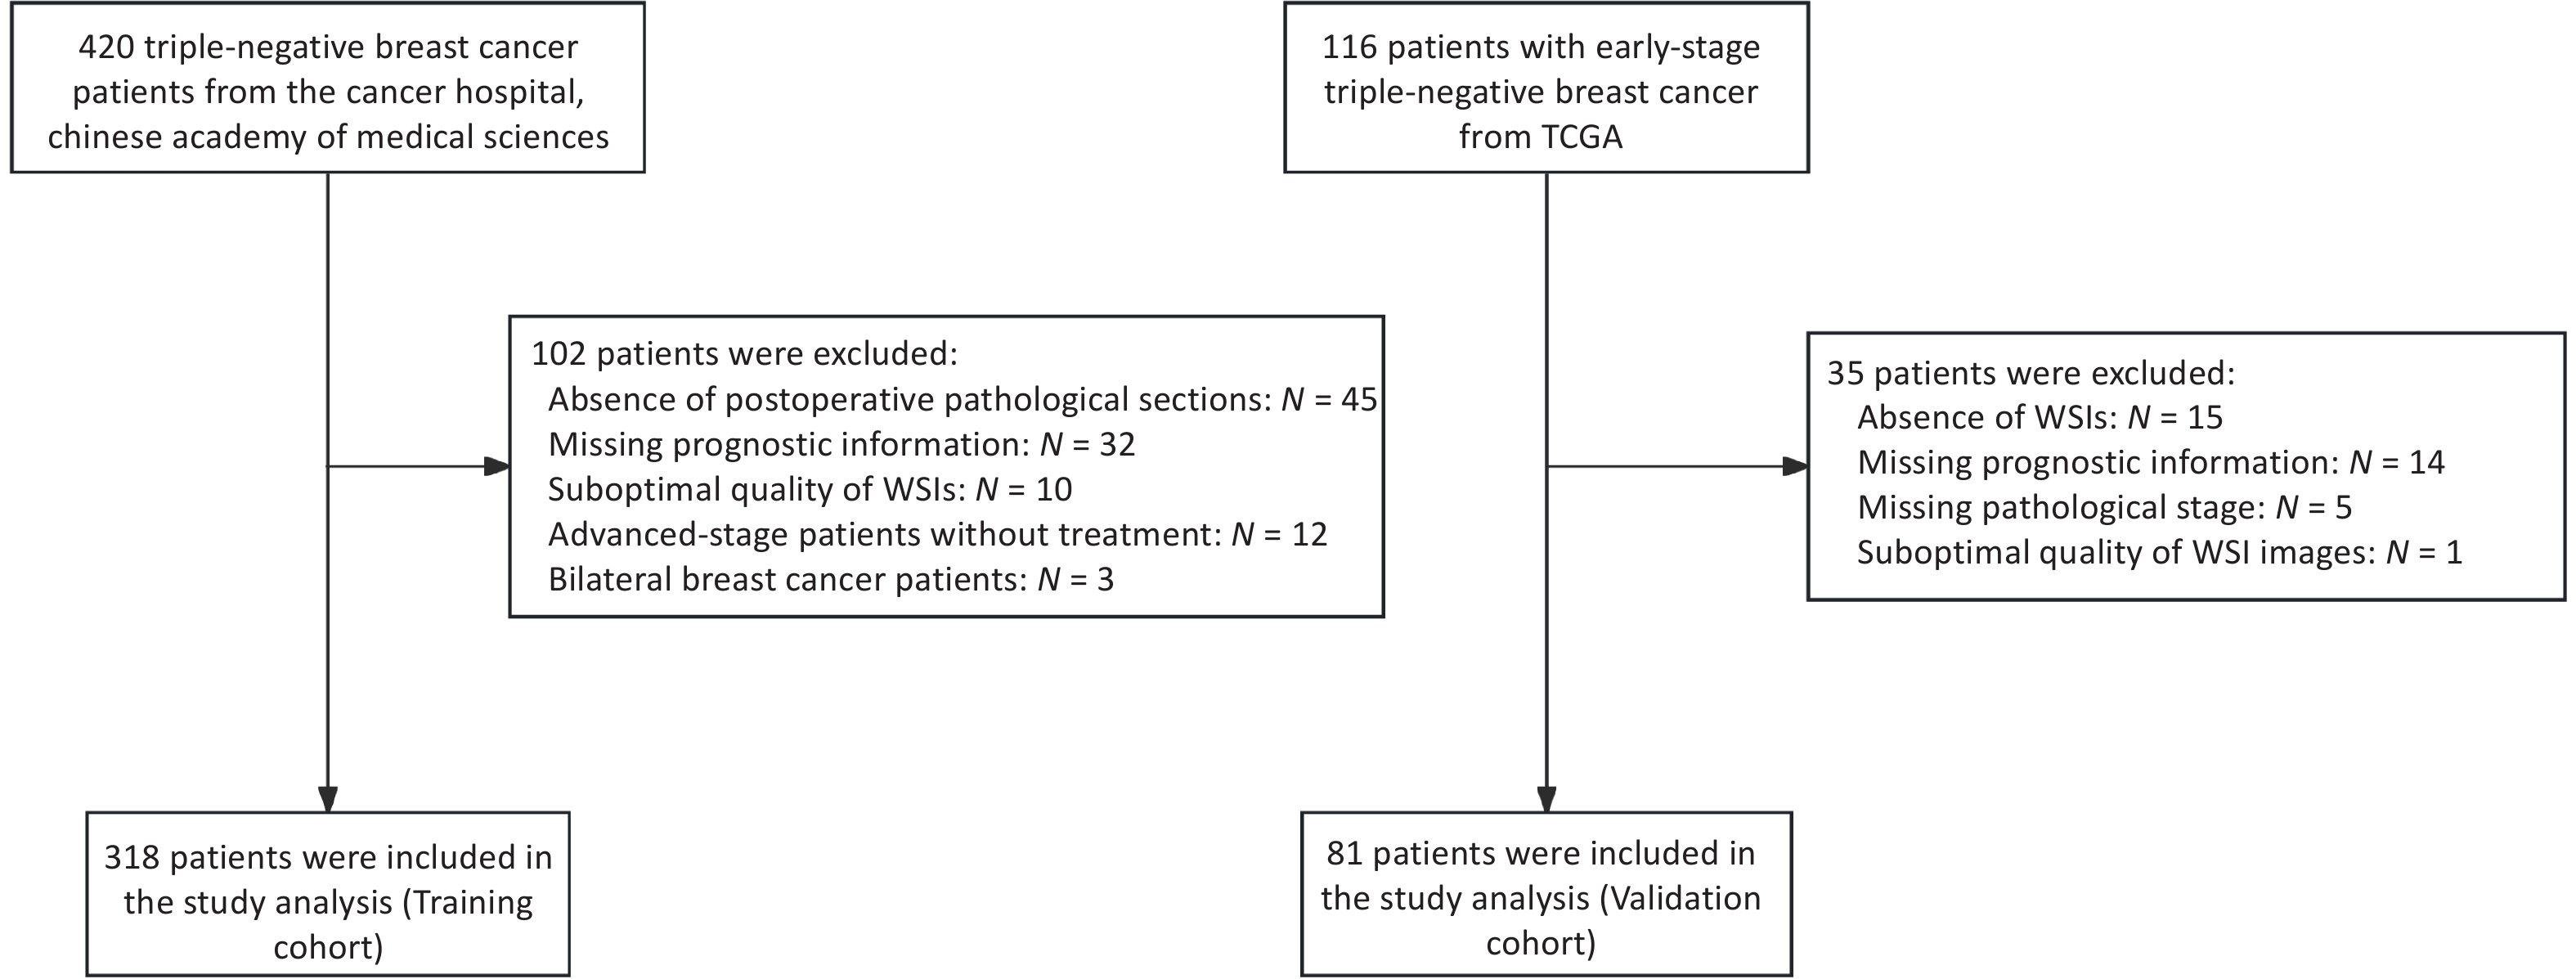
The clinical data of patients with TNBC admitted to the Cancer Hospital, Chinese Academy of Medical Sciences, between January 2009 and December 2017 were retrospectively collected. Patients were included if they met all of the following criteria: (1) Female patients who underwent breast-conserving surgery or modified radical mastectomy for the first time, with available H&E-stained pathological sections of the primary tumor; (2) Histologically confirmed primary invasive breast cancer with a postoperative pathological stage of I–III, according to the AJCC 8th edition; (3) Immunohistochemistry (IHC) results showing ER-, PR-, and HER2 1+ or 2+ with non-amplified HER2 gene status confirmed by fluorescence in situ hybridization (FISH); and (4) Availability of complete clinicopathological data, including age, date of surgery, pathological findings, treatment details, and recurrence/metastasis status. The exclusion criteria were as follows: (1) presence of other malignant tumors; (2) diagnosis of bilateral breast cancer; (3) low-quality whole-slide images (WSIs); and (4) absence of prognostic follow-up data. In total, 318 patients with 340 eligible WSIs were included in the training cohort. Using the same inclusion and exclusion criteria, an independent external validation cohort was established from 81 early-stage TNBC patients in the TCGA database (https://portal.gdc.cancer.gov/repository), which included postoperative H&E-stained WSIs, corresponding clinicopathological data, and mRNA sequencing (mRNA-seq) profiles. All datasets were standardized to ensure consistency and comparability across cohorts. The patient enrollment flow chart is presented in Figure 1.
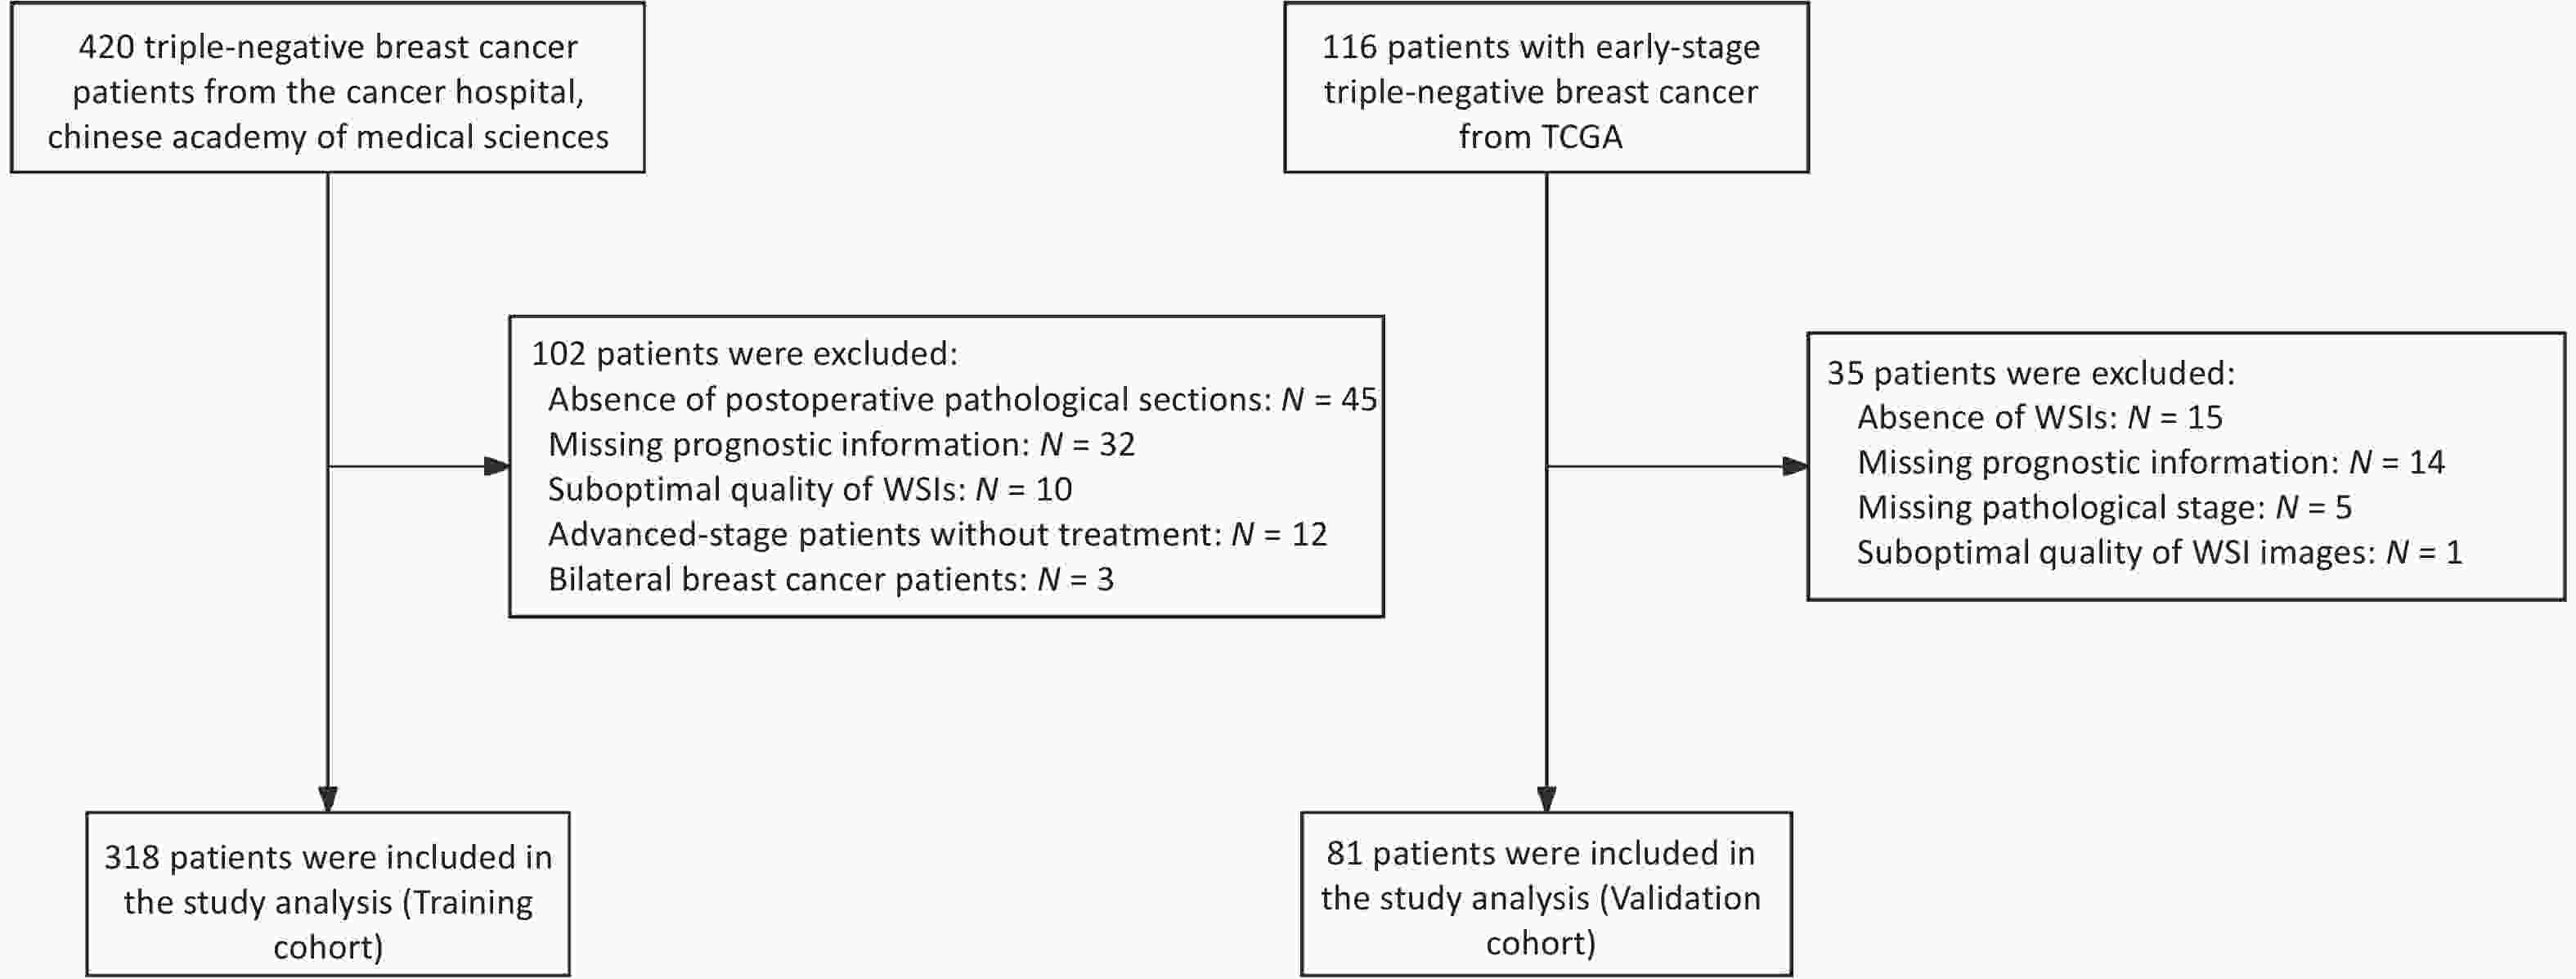
Figure 1. Flowchart of patient selection for the training cohort and external validation cohort.
-
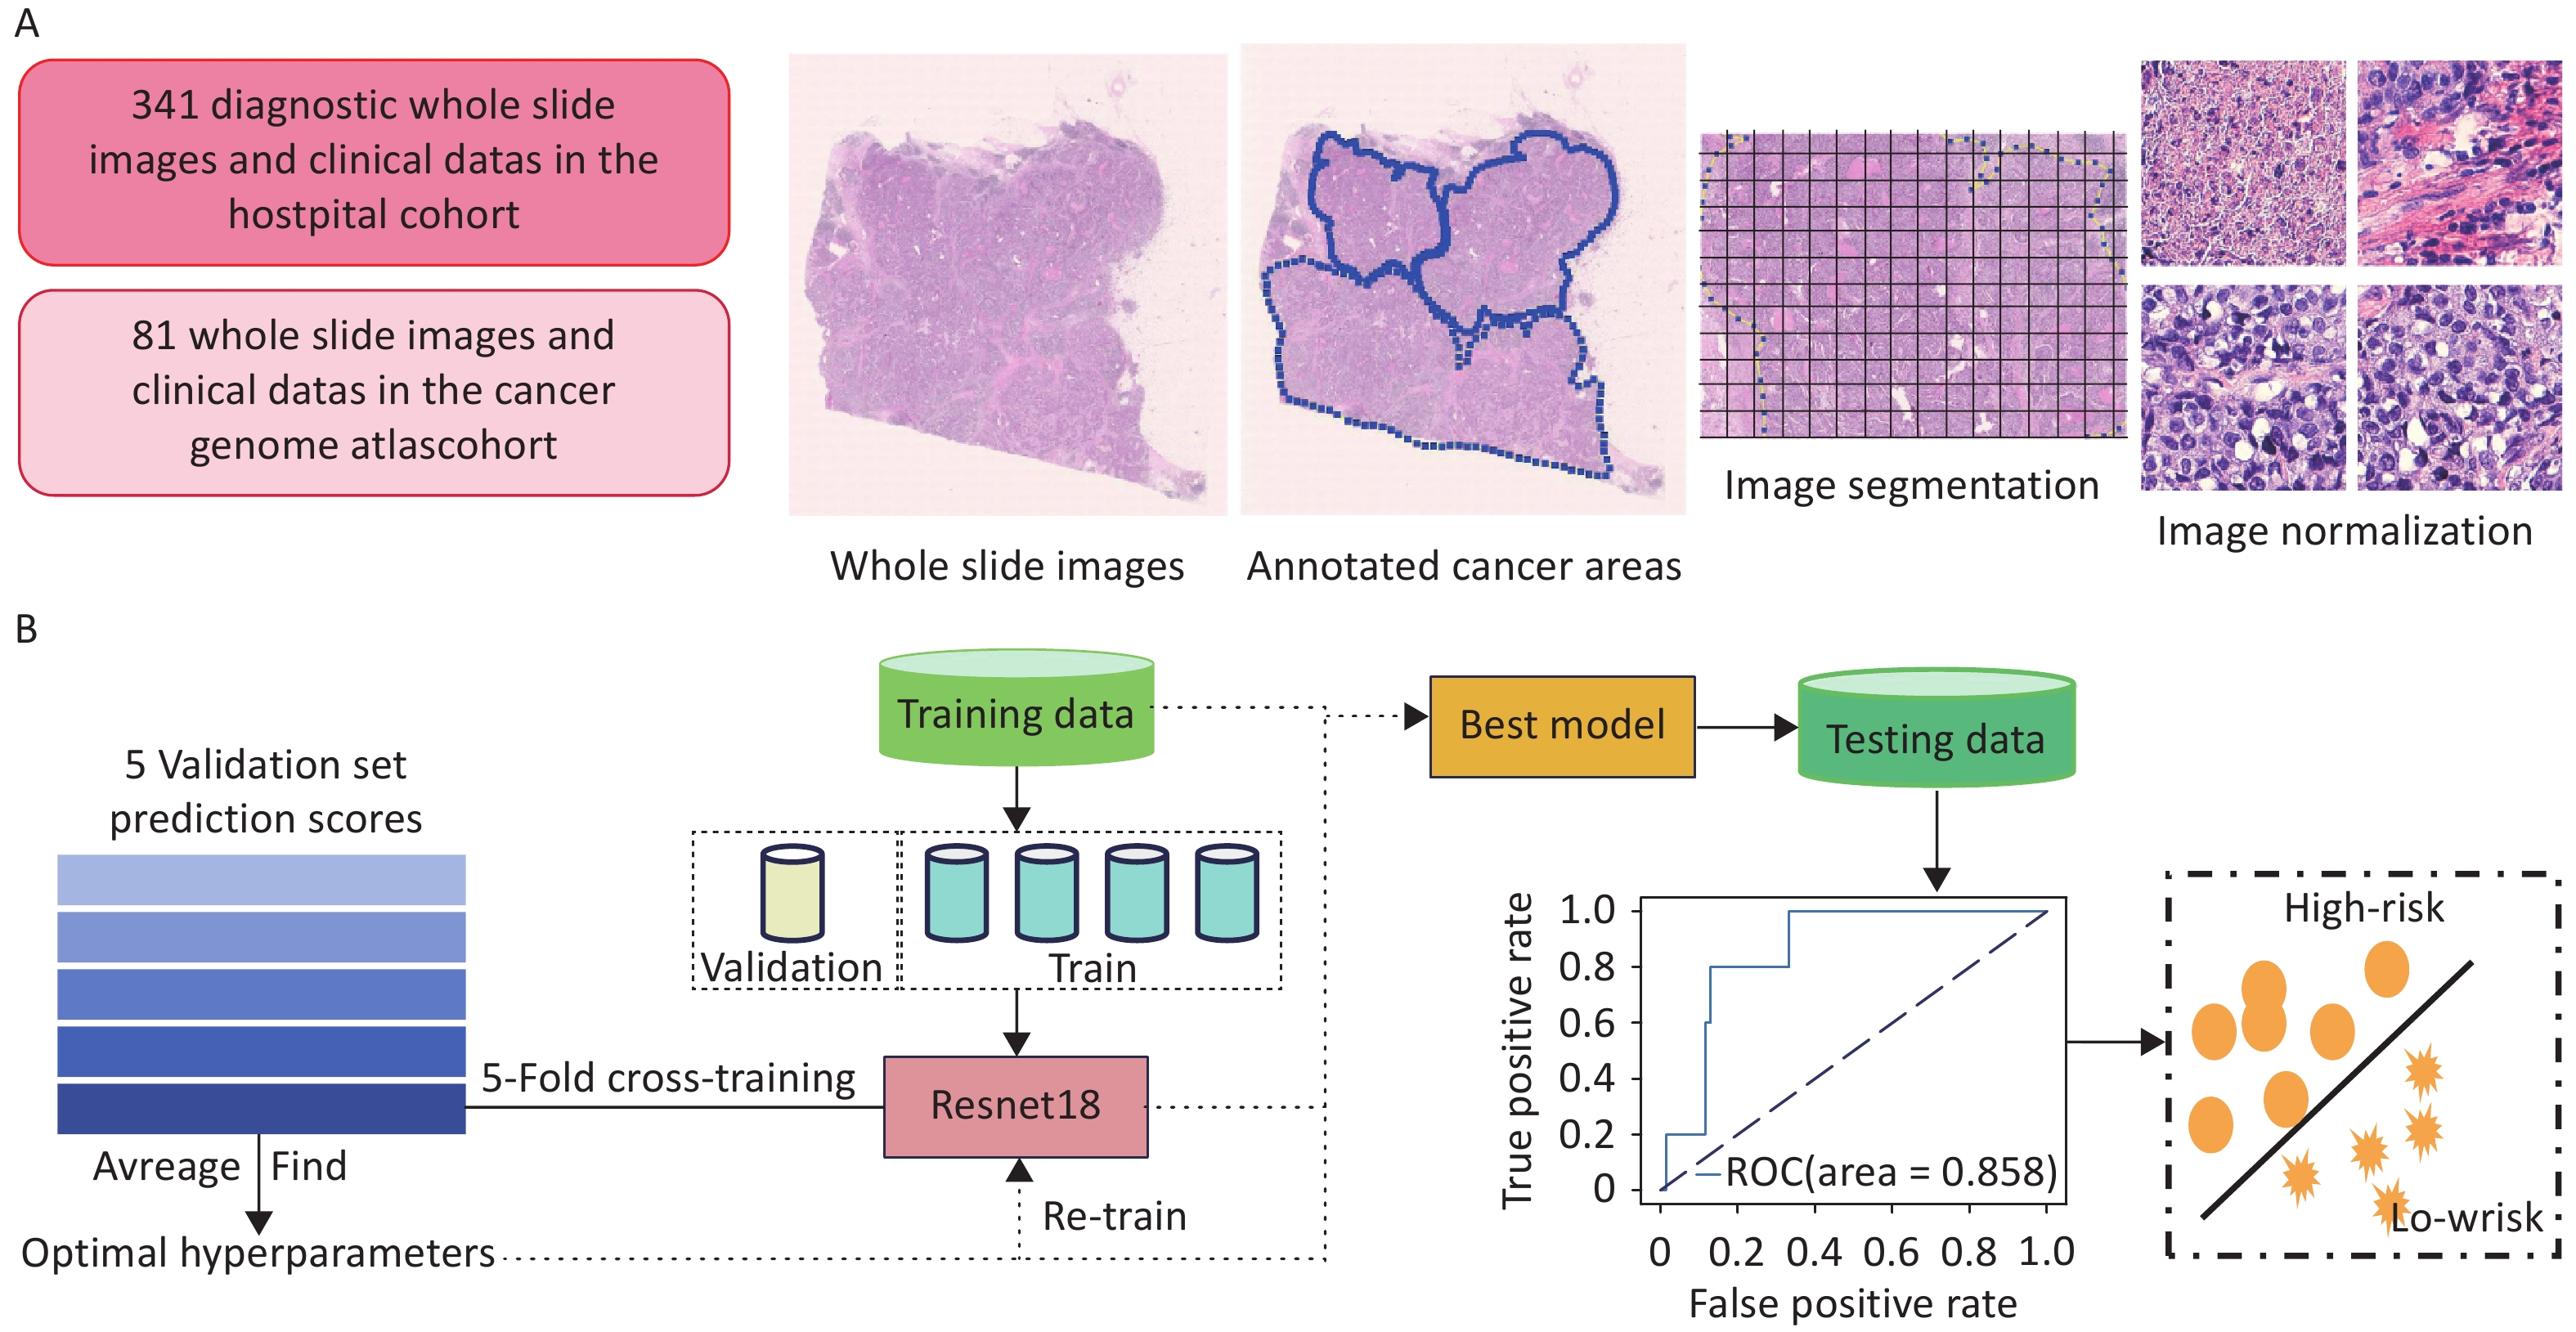
A standardized workflow was implemented for pathological image preprocessing. Two senior pathologists independently conducted quality control of WSIs, excluding slides with tissue overlap > 5% or tumor area < 10%. Tumor regions of interest (ROIs) were manually annotated under double-blind conditions using ASAP (v1.9), and all annotations were verified by a third expert pathologist. To assess inter-observer consistency, 20 WSIs were randomly selected, and the ROIs delineated by both pathologists (Supplementary Figure S1) were compared using a Python 3.8 script (libraries: shapely 2.0.1, scikit-image 0.22.0, numpy 1.24.4, lxml 4.9.3). Dice similarity coefficients, calculated from merged and rasterized annotations, ranged from 0.84 to 0.98 (Supplementary Table S1), demonstrating excellent annotation consistency. Given the ultra-high resolution of WSIs (averaging 240 ± 80 million pixels per slide), we developed a parallel image-processing pipeline using OpenSlide (v3.4.1), comprising the following steps: (1) Extraction of 512×512 pixel non-overlapping image patches at 20× magnification (256-pixel stride); (2) Application of Gaussian denoising and Canny edge detection using OpenCV (v4.6.0); (3) Automatic removal of image patches with > 25% blank areas (determined by HSV color-space thresholding). Finally, Macenko stain normalization (parameters α = 0.5, β = 0.15) was applied to standardize H&E staining characteristics and ensure uniformity across inputs for model training.
-
We adopted ResNet-18, a convolutional neural network (CNN) with residual modules, as the backbone of our prognostic prediction model. Traditional CNNs consist of convolutional filters, pooling layers, and fully connected layers. In contrast, ResNet-18 introduces skip connections that enable direct information flow across residual blocks, improving gradient propagation and mitigating the degradation and vanishing gradient issues commonly encountered with deeper networks. The model was implemented using the PyTorch library.
-
The network was initialized with pre-trained weights from the ImageNet dataset. Fine-tuning of all layers was performed via backpropagation, with the cross-entropy loss function defined between the predicted probabilities and ground-truth labels. Stochastic Gradient Descent (SGD) was used for optimization, with a learning rate of 0.001, momentum of 0.9, and learning rate decay applied every seven epochs using a decay factor (gamma) of 0.1. Training was conducted for 20 epochs.
-
Model training and internal validation were performed using five-fold cross-validation (Figure 2b). Each WSI was divided into non-overlapping image patches, which inherited patient-level labels (i.e., recurrence or metastasis). The patches were randomly split into five equally sized subsets with a balanced label distribution. In each fold, one subset was used for validation, and the remaining subsets were used for training. To address label imbalance, downsampling was applied to equalize the number of patches per class in the training set. The prediction scores for each patch in the validation set were obtained, and patient-level predictions were computed by averaging the scores of all patches from the same patient. One model was saved per fold, and the best-performing model was selected based on the validation accuracy.
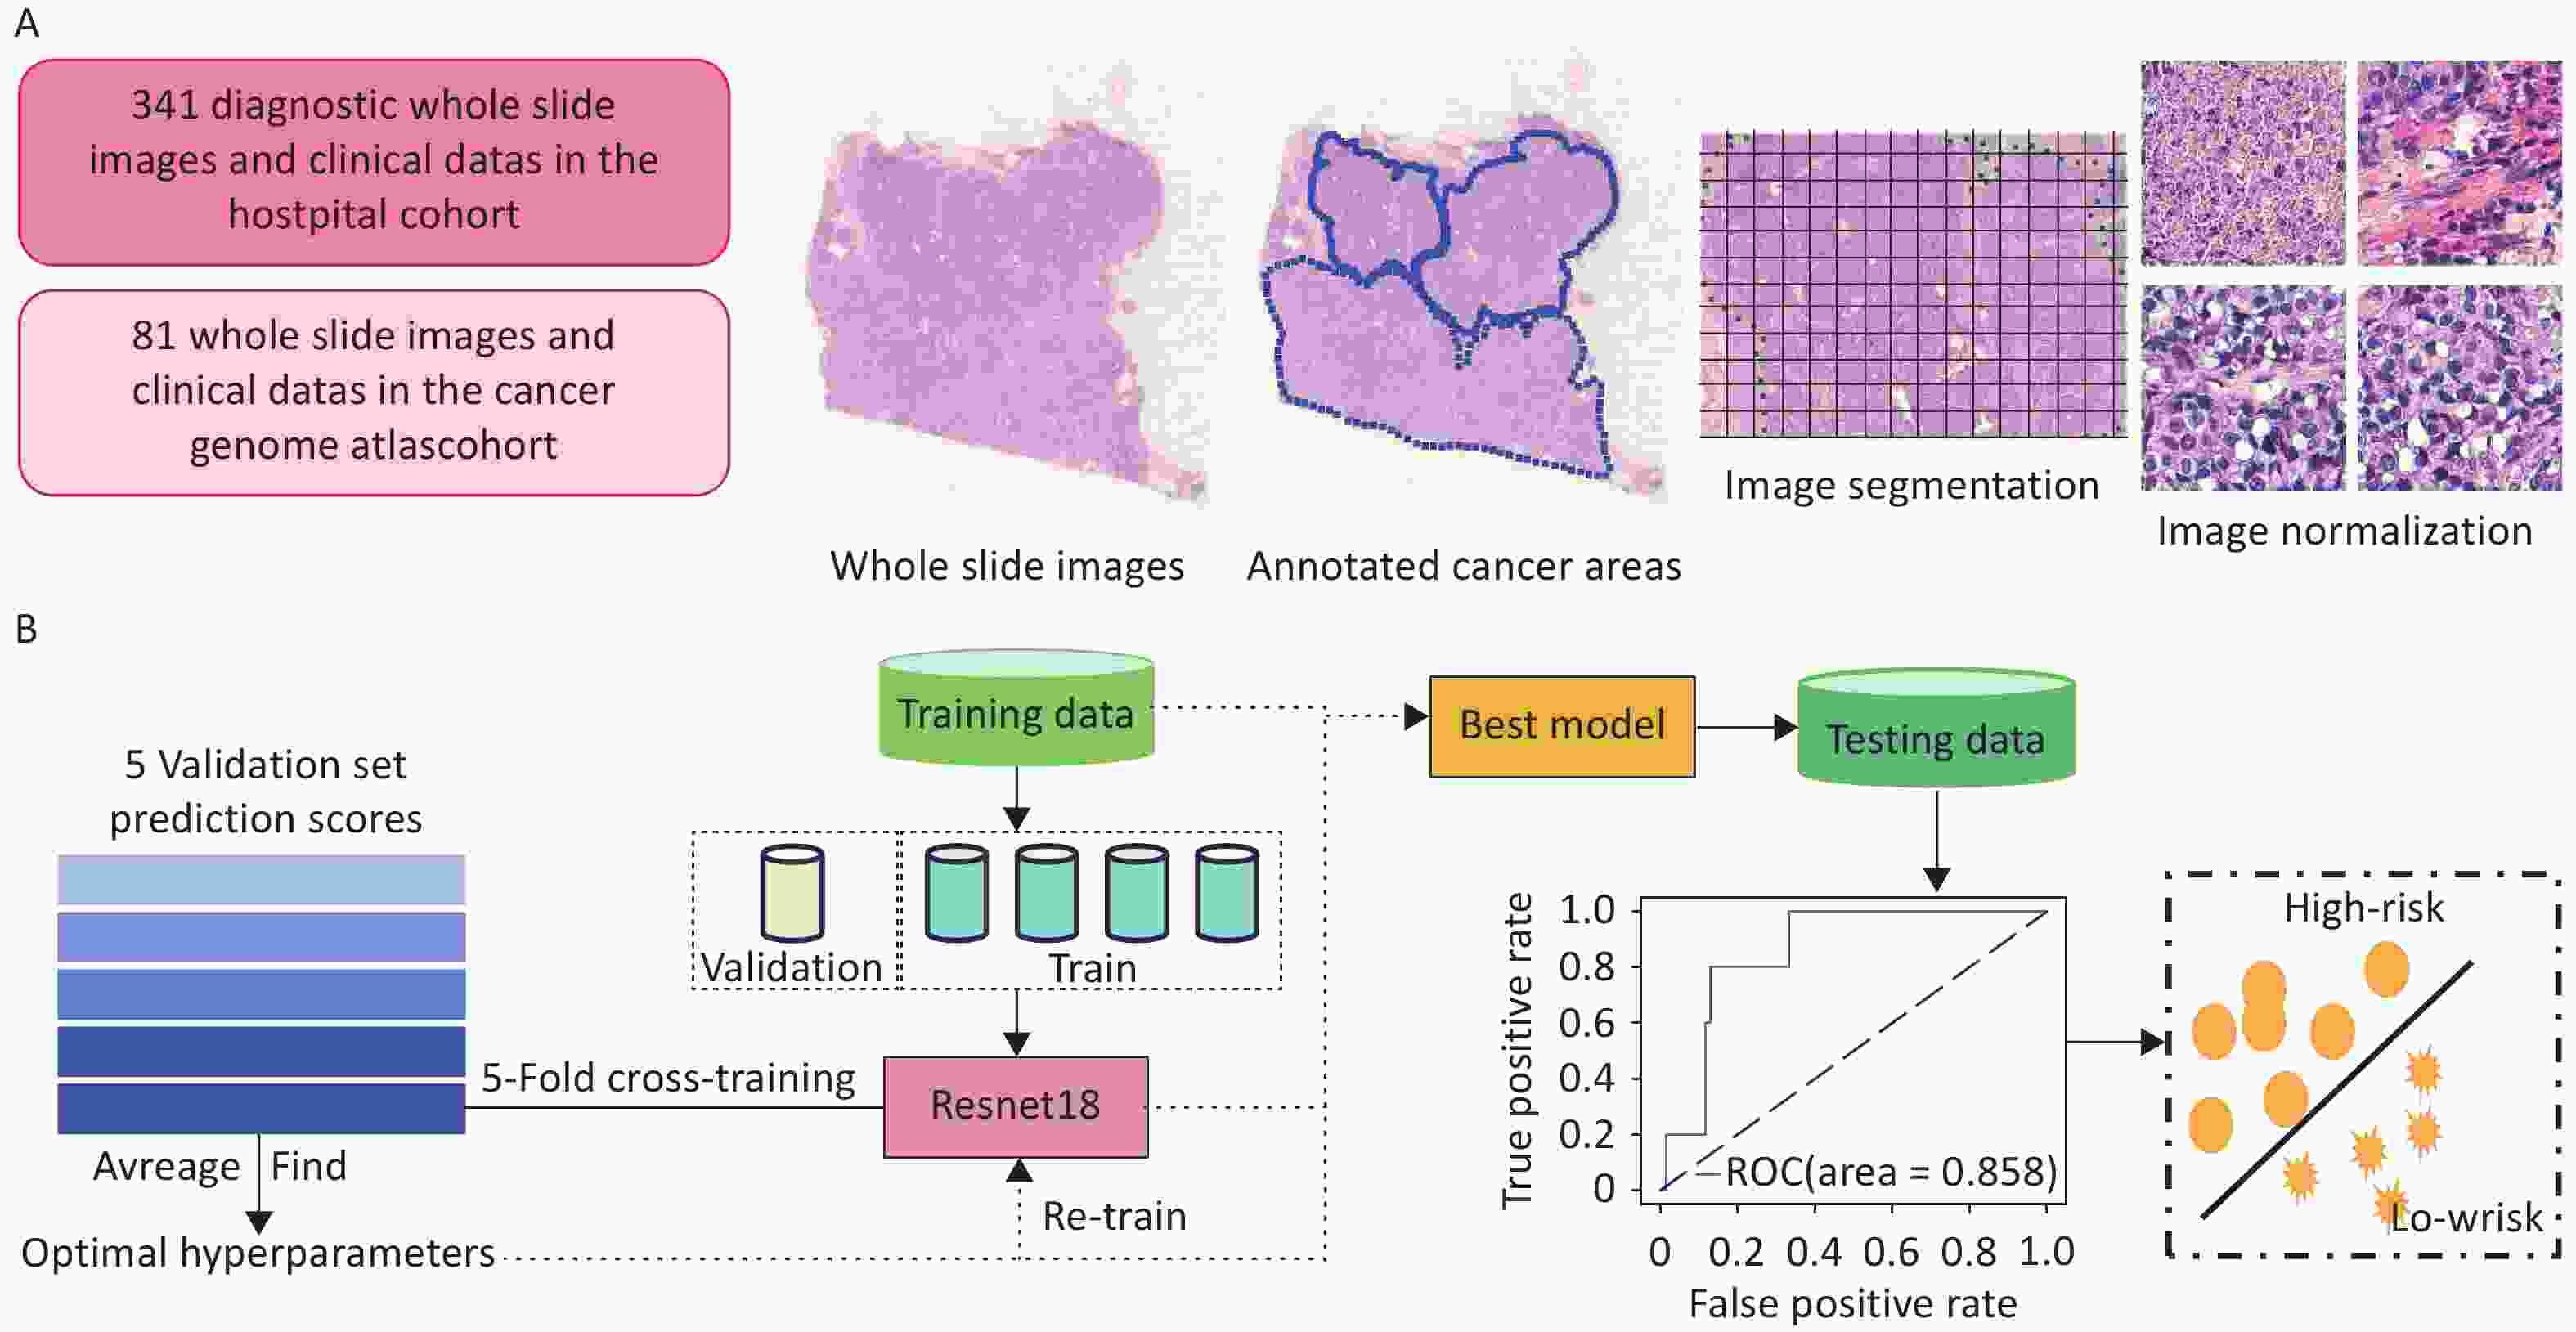
Figure 2. Flowchart of the prognostic prediction model construction based on a deep learning framework. (A) Image data collection and preprocessing; (B) Model training and prediction workflow.
-
The optimal hyperparameters identified during cross-validation were used to retrain the final model on the entire training cohort. This finalized model was then applied to the TCGA cohort for independent external validation.
-
Following the preprocessing of clinical data, a random forest (RF) algorithm was applied to compute the Gini importance of each feature in the training set. Features with importance scores greater than 0.01 were selected, resulting in 24 key clinicopathological variables, such as age, pathological stage, histological grade, adjuvant chemotherapy, and adjuvant radiotherapy. These variables were further evaluated using the Wilcoxon rank-sum test and T-test to determine significant differences between the recurrence/metastasis and non-recurrence/metastasis groups. Features showing statistically significant differences (P < 0.05) were retained for integration into the final prognostic model. For multimodal feature fusion, this study employed Multimodal Compact Bilinear Pooling (MCB). First, high-dimensional representations of image patches were extracted using a pretrained neural network, while clinical variables were encoded with a multilayer perceptron (MLP). The Count Sketch method was then used for approximation. After dimensionality reduction, both feature vectors were projected into a higher-dimensional space, where efficient fusion was achieved through element-wise multiplication in a Fast Fourier Transform (FFT) space. This specific approach involves transforming features into the frequency domain, computing inner products in this domain, and then returning the results to the temporal domain using inverse FFT. This method offers three main advantages: (1) Reduced computational complexity through implicit outer-product operations, resulting in faster computation; (2) Complete preservation of cross-modal feature interactions; and (3) An end-to-end architecture that supports gradient backpropagation optimization.
-
We applied two visualization approaches to interpret the neural network model. First, during model training, the network assigned a continuous risk score to each image patch, reflecting its contribution to the prognostic prediction. These scores were then mapped to color values using Gradient-weighted Class Activation Mapping (Grad-CAM), following a linear mapping protocol: prognostic relevance (ranging from 0 to 1) corresponded to RGB color gradients. Second, to explore cell-level features, we employed the HoVer-Net model[22] to segment and classify individual cells within the tumor regions. The nuclear segmentation process involved two key steps: (1) the pixel prediction branch identified nuclear pixels, and (2) the distance map prediction branch generated horizontal and vertical distance maps to precisely delineate adjacent or overlapping nuclear pixels. This integrated approach successfully classified five distinct nuclear cell types: epithelial cells, lymphocytes, tumor cells, stromal cells, and necrotic cells. By quantifying cellular composition and performing differential analysis, we revealed that intratumoral heterogeneity may be associated with patient prognosis.
-
For each preprocessed histopathological image patch, we applied a two-dimensional wavelet transform and wavelet packet transform (2D-WPT), resulting in four 256×256 pixel sub-images: the high-frequency noise sub-image (High–High, HH), the vertical detail sub-image (Low–High, LH), the horizontal detail sub-image (High–Low, HL), and the approximation sub-image (Low–Low, LL). We then computed the overall detail sub-image (LHL) and quantized both the approximation (LL) and detail (LHL) sub-images to 16 gray levels. Subsequently, we extracted 11 texture features based on the wavelet multi-sub-band co-occurrence matrix (WMCM)[23]. These features included: Small Gray-Level and Small Detail Advantage (SGSDA), Small Gray-Level and Big Detail Advantage (SGBDA), Gray Level Average (GLA), Detail Level Average (DLA), Gray Level Mean Square Error (GLMSE), Detail Level Mean Square Error (DLMSE), Correlation, Regulation, Contrast, Inverse Difference Moment (IDM), and Entropy.
-
Raw RNA-seq data (including FPKM and UQ-normalized expression values) and matched clinical annotation data were obtained from the TCGA official data portal (https://portal.gdc.cancer.gov/). Only patients with complete clinical staging and follow-up survival data were included.
-
This was performed using DESeq2 (v1.38.3) following this workflow: (1) Expression Normalization: Library size correction was conducted based on the negative binomial distribution model; and (2) Differentially Expressed Gene (DEG) Screening: The significance threshold was set at an FDR-adjusted P-value (padj) < 0.05, with an absolute log2 fold change (|log2 FC|) > 1. Multiple testing correction was applied using the Benjamini-Hochberg method.
-
This was performed on the identified DEGs using the following steps: (1) GO Enrichment: Conducted using the clusterProfiler package (v4.0); (2) Background Gene Set: Protein-coding genes annotated in the human genome (Ensembl GRCh38.p13); (3) Significance Threshold: A Benjamini-Hochberg-corrected q-value < 0.05 was used; and (4) Visualization: The top 10 significantly enriched pathways and their core regulatory gene networks were visualized using the enrichplot package via cnetplot.
-
This was performed using the CIBERSORTx platform (https://cibersortx.stanford.edu/) with the following analytical pipeline: (1) Reference Signature Matrix: The LM22 signature matrix (containing 22 immune cell subtypes) was employed as the reference profile; (2) Quality Control: The algorithm automatically screens and preprocesses the gene expression matrix based on data quality and characteristics, effectively removing noise and outliers that could compromise result accuracy. In addition, we implemented stringent quality control measures during preprocessing, including the removal of low-expression genes and correction for batch effects. Only high-confidence samples with deconvolution P-values < 0.01 were retained for downstream analyses, thereby minimizing the need for additional filtering; (3) Immune cell estimation: In this study, we employed the CIBERSORT algorithm with its default setting of 1,000 permutations to estimate the composition of tumor-infiltrating immune cells. This iteration number strikes a well-established balance between computational efficiency and result accuracy. (4) Inter-group Comparison: Statistical differences in immune cell infiltration proportions between subgroups were assessed using the non-parametric Wilcoxon rank-sum test. To validate the immune cell composition estimates, we also employed the xCell algorithm as an independent approach, enhancing the robustness and reliability of our findings. Immune cell enrichment analysis was performed using the xCell platform (http://xcell.ucsf.edu/). The analytical pipeline consisted of four key components: (1) Cell Type Signature Database: The reference signatures incorporated 10,808 curated gene markers from 64 human cell types, including 36 immune cell subtypes, 14 stromal cell types, and 14 hematopoietic progenitors. These signatures were integrated from the FANTOM5, ENCODE, and Blueprint Epigenome projects, with cross-validation via RNA-seq compendia; (2) Preprocessing and Quality Control: Gene expression matrices underwent Low-expression filtering: Genes with log2(CPM) < 1 in > 90% samples were excluded; (3) Enrichment Score Calculation: Cell type abundance was quantified using the ssGSEA implementation, with rank-normalized gene expression values transformed into enrichment scores; Spillover compensation: Built-in deconvolution correction was applied for lineage-similar cell types; Output normalization: Raw scores were converted to 0–1 scaled indices via platform-defined transformation. (4) Statistical Comparison: Differential enrichment between recurrence and non-recurrence groups was assessed using the Wilcoxon rank-sum test, with Benjamini-Hochberg FDR correction applied.
-
Statistical analyses were conducted using SPSS version 27.0 and R version 4.2.1. The distribution of continuous variables was assessed using the Shapiro–Wilk test. Variables with a normal distribution were expressed as mean ± standard deviation (SD), while non-normally distributed variables were reported as median (IQR). Categorical variables are summarized as frequencies and percentages. Between-group comparisons were performed based on data type and distribution. Normally distributed variables with homogeneous variances were compared using the independent samples t-test, whereas the Mann–Whitney U test was applied to non-normally distributed variables. The performance of the prediction model was evaluated by calculating the AUC. Pearson’s correlation analysis was used to assess linear relationships between variables. P-value < 0.05 was considered statistically significant.
-
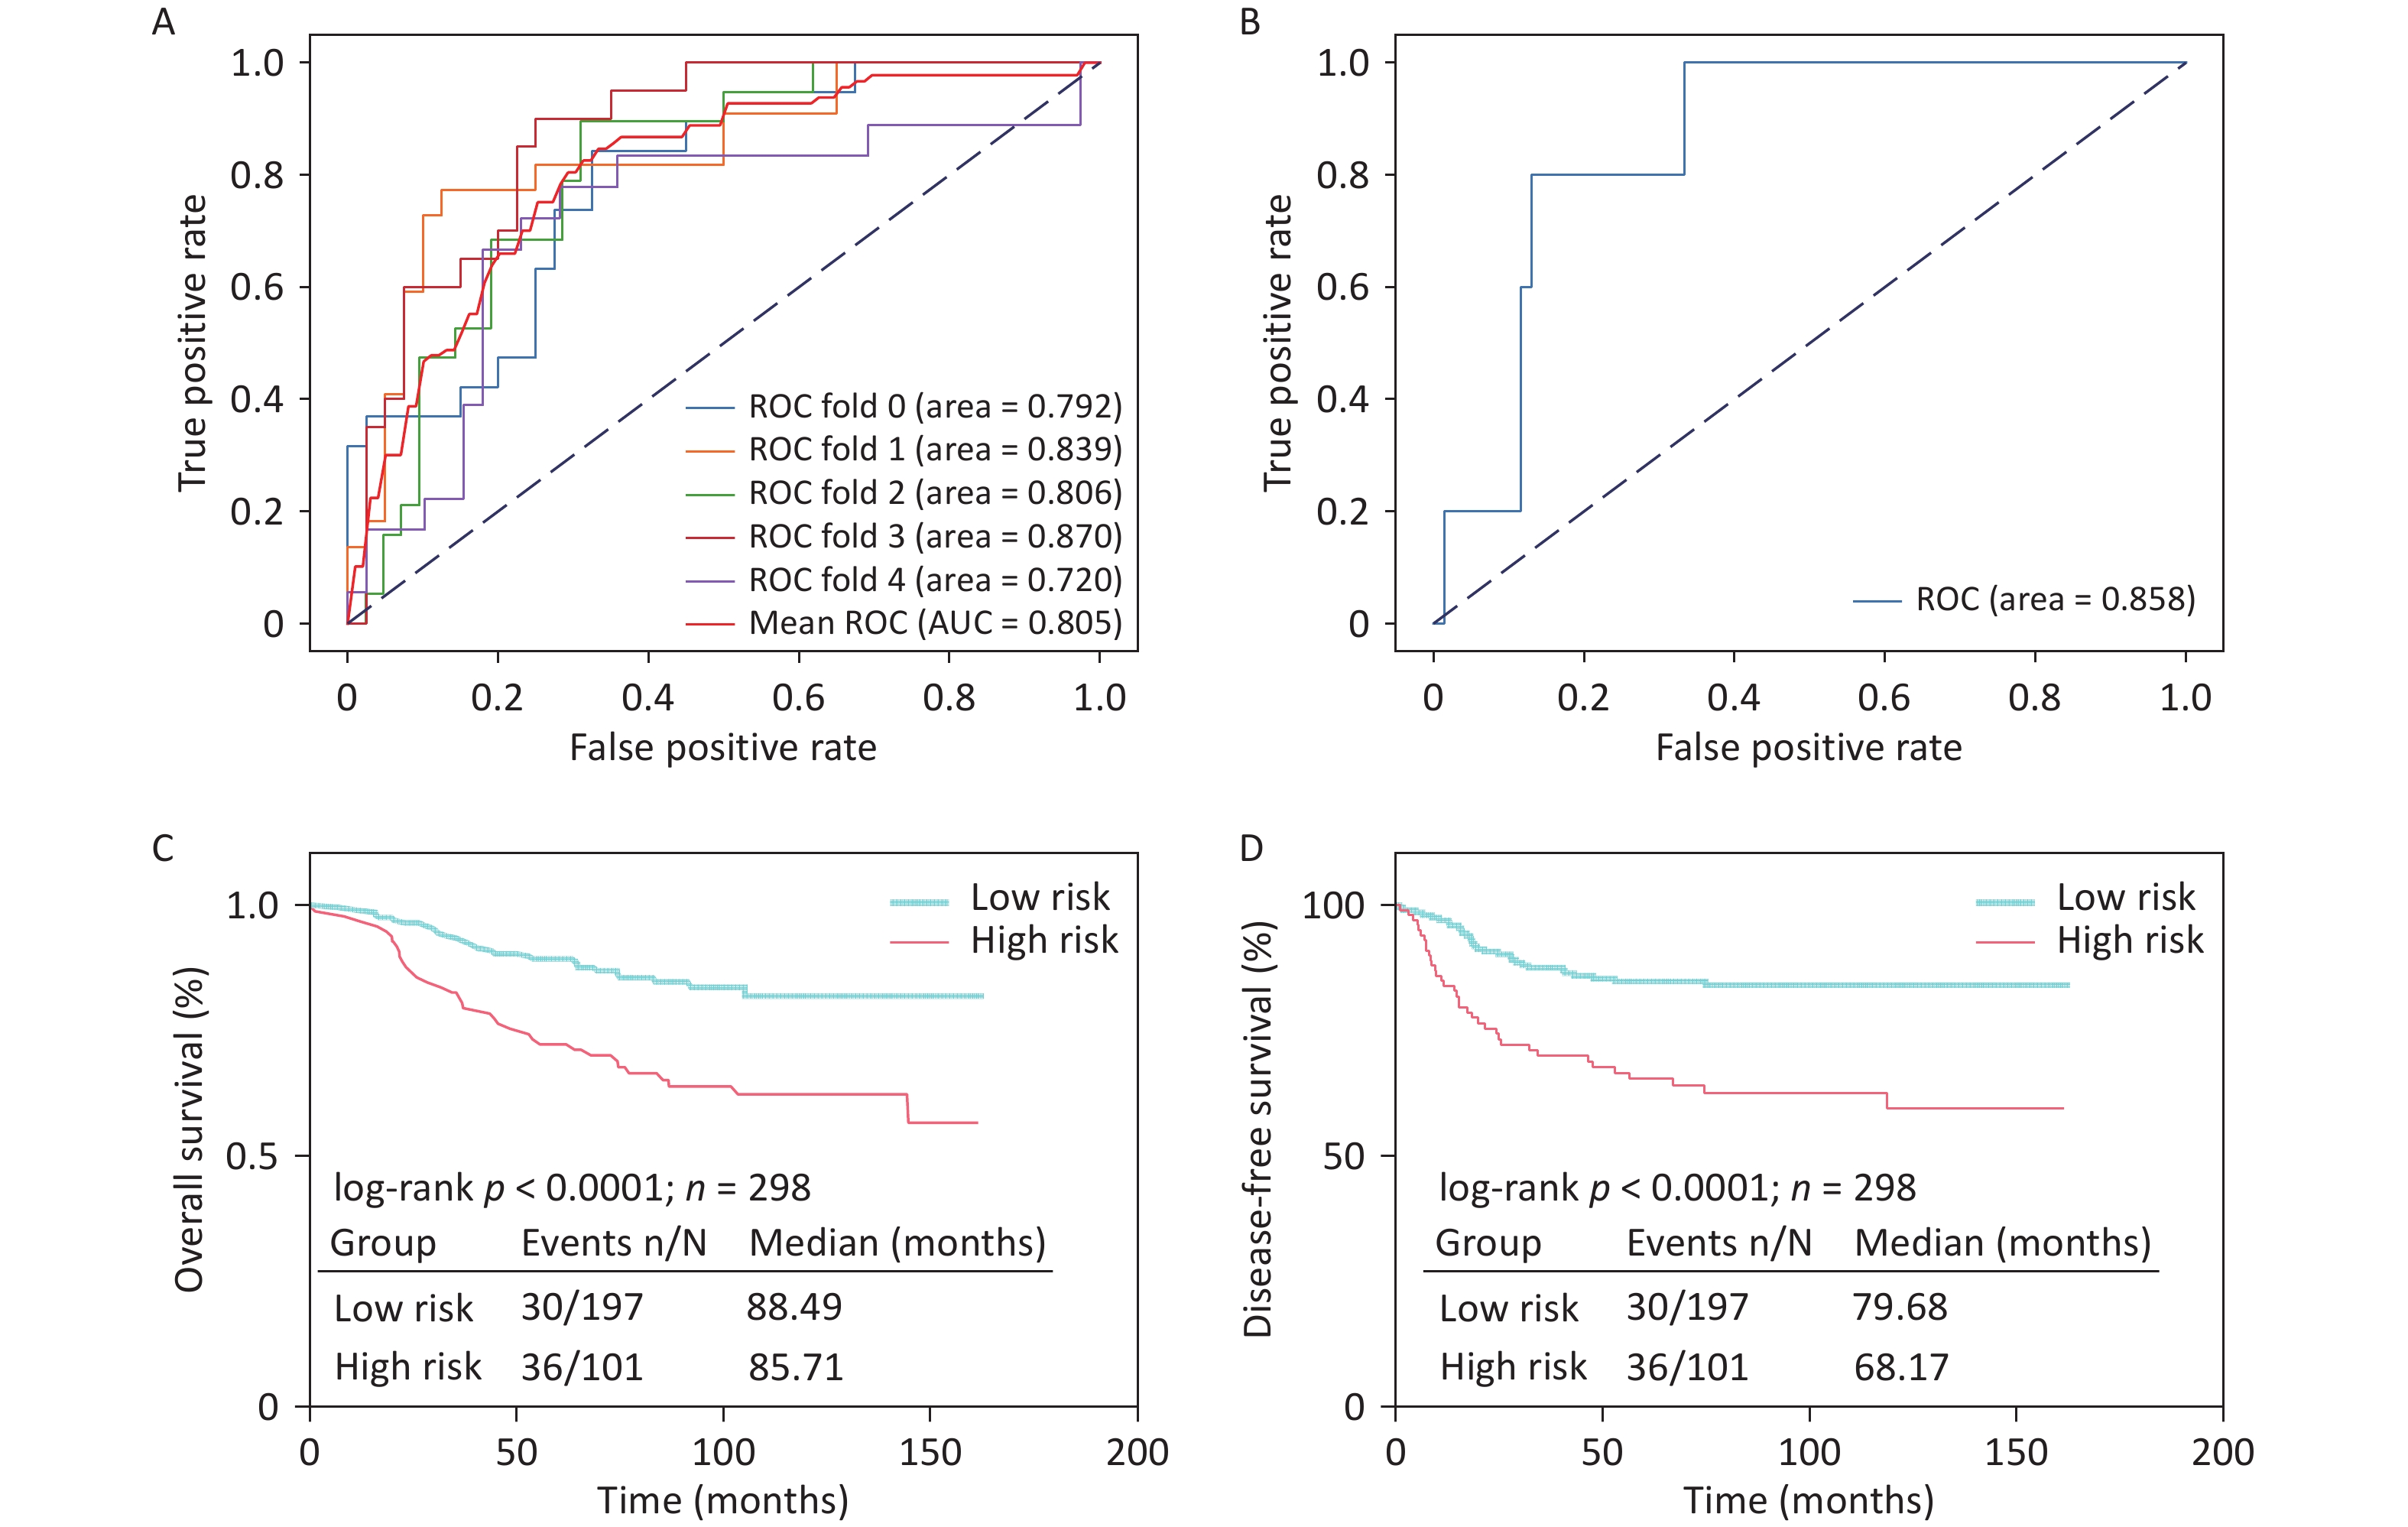
We used 340 WSIs from 318 patients with early-stage TNBC treated at the Cancer Hospital, Chinese Academy of Medical Sciences, as the training cohort. Among these, 118 WSIs were from patients with recurrence or metastasis, while 222 were from patients without recurrence or metastasis. To evaluate the model’s robustness, we performed independent external validation using 81 WSIs from the TCGA cohort, which included eight cases with recurrence or metastasis and 73 without. The deep learning-based CNN model achieved an AUC of 0.805 in the training cohort through five-fold cross-validation (Figure 3a). The model’s accuracy, precision, recall, and F1-score were 0.71, 0.56, 0.58, and 0.54, respectively. In the external TCGA validation cohort, the model achieved an AUC of 0.858 (Figure 3b), demonstrating strong generalization capability. HER2-positive breast cancer is associated with a higher risk of recurrence. To further validate our prognostic model, we applied it to 83 early-stage HER2-positive patients at the Cancer Hospital, Chinese Academy of Medical Sciences (19 with recurrence and 64 without recurrence). The inclusion criteria and WSI processing pipeline were consistent with those used for the TNBC cohort. Despite not performing subtype-specific parameter tuning, the model achieved an AUC of 0.73 (Supplementary Figure S2), highlighting its generalizability.
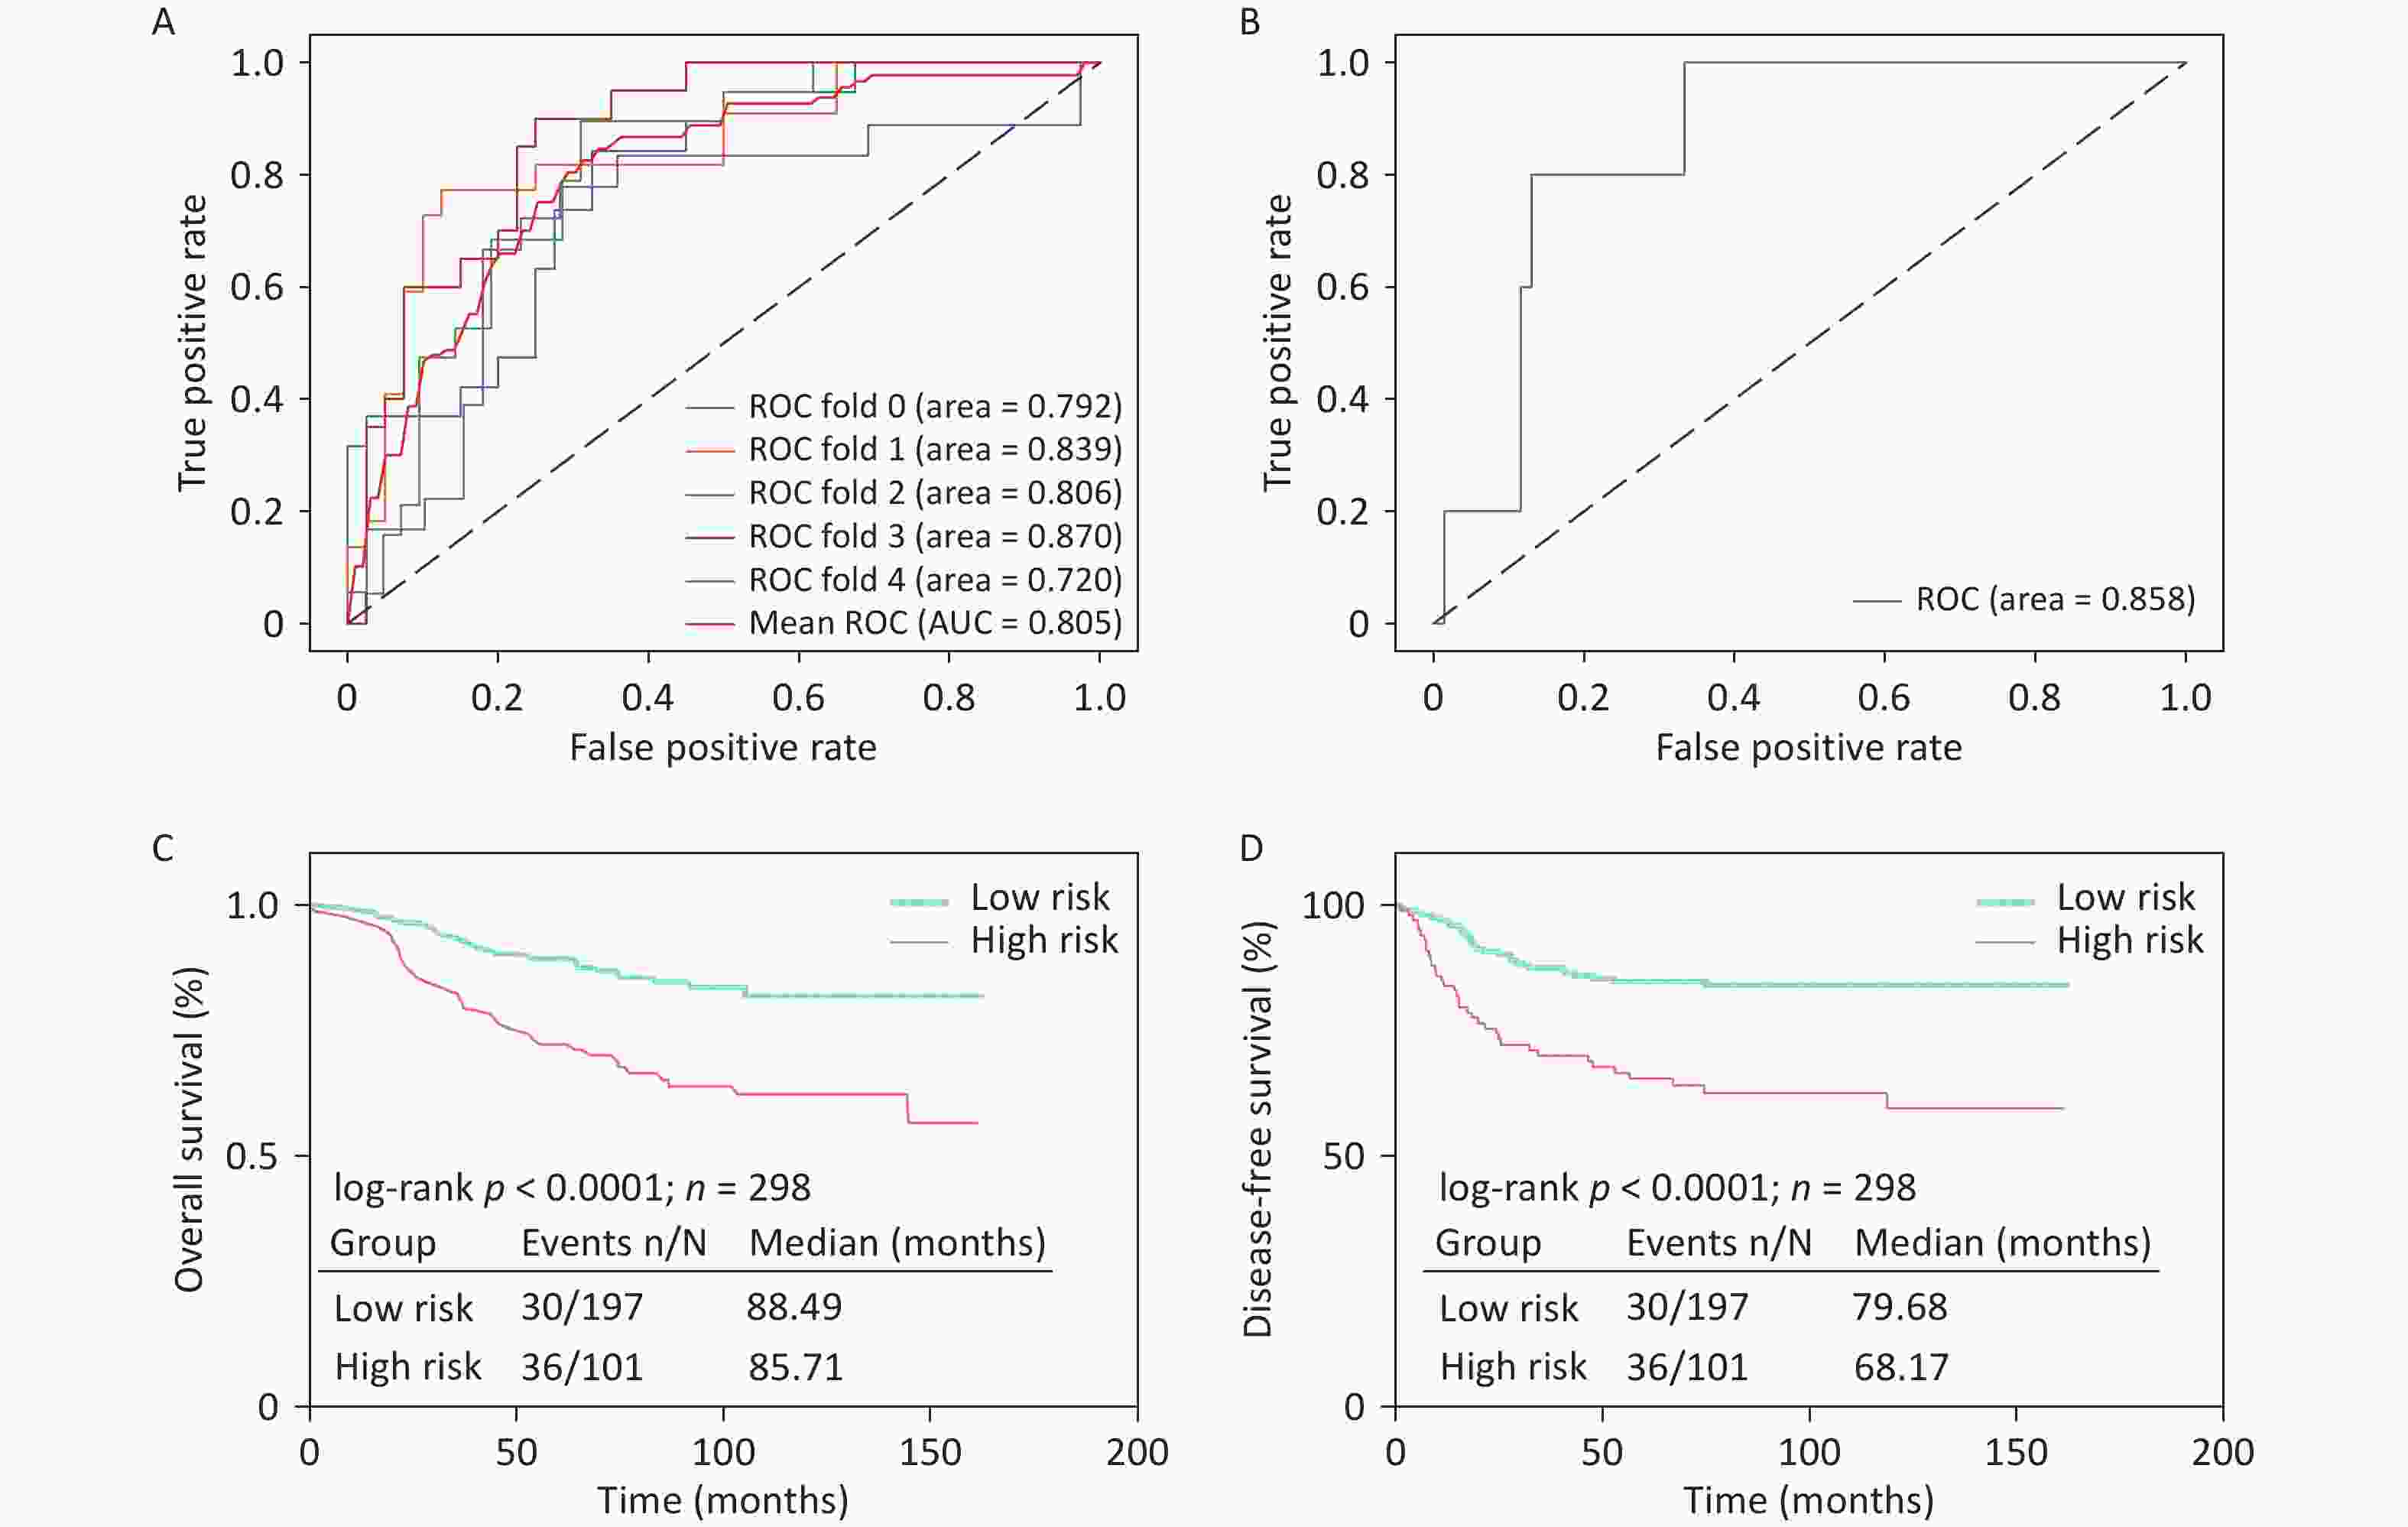
Figure 3. Prognostic prediction results based on pathological images.
Based on the model predictions, patients classified as having recurrence or metastasis were defined as the high-risk group, while those predicted to be non-recurrent were categorized as the low-risk group. Survival analyses were performed for overall survival (OS) and disease-free survival (DFS) according to the model-predicted risk categories (Figure 3C, D). The results showed statistically significant differences between the groups, with the model-predicted low-risk group demonstrating superior outcomes for both OS and DFS, further validating the predictive accuracy of the model.
-
The clinical data of the 318 patients were analyzed, and their baseline characteristics are summarized in Table 1. Five clinicopathological features (age, number of metastatic axillary lymph nodes (ALNs), pT stage, pN stage, and TNM stage) showed significant differences (P < 0.05) between the recurrence or metastasis (ROM) and non-recurrence or metastasis (nROM) groups. These features were used to construct a prognostic model based solely on clinicopathological data using logistic regression (LR), support vector machine (SVM), k-nearest neighbors (KNN), and other machine learning algorithms. The model achieved the highest AUCs of 0.669 and 0.699 in the training and external validation cohorts, respectively (Supplementary Figure S3), both of which were inferior to those of the deep learning-based model using H&E-stained WSIs.
Table 1. Baseline characteristics of enrolled patients
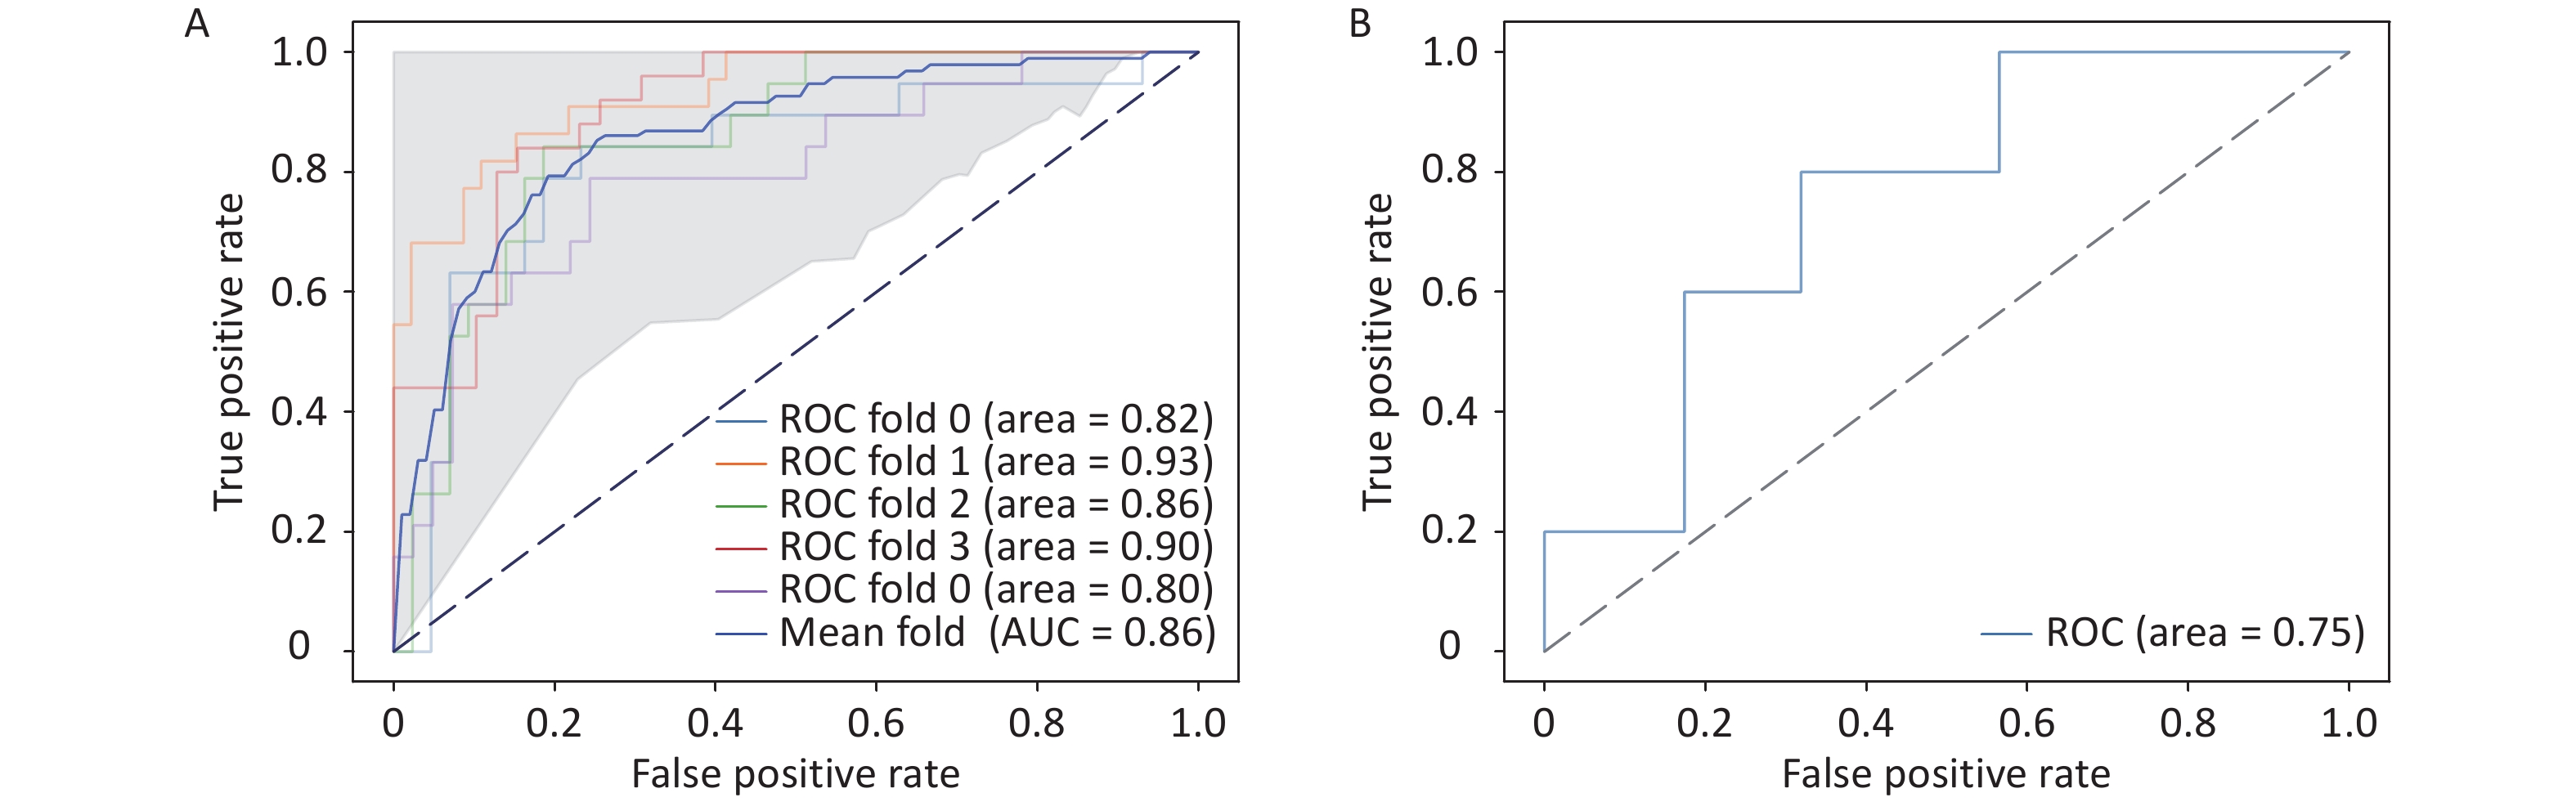
ROM (n = 106) % nROM (n = 212) % P Age (SD) 48.7 (10.3) 51.5 (9.8) 0.019 Menopausal status Pre- 61 57.5 98 46.2 0.057 Post- 45 42.5 114 53.8 TNM stage Stage I 21 19.8 91 42.9 < 0.001 Stage II 50 47.2 102 48.1 Stage III 35 33.0 19 9.0 pT stage < 0.001 T1 37 34.9 114 53.8 T2 64 60.4 96 45.3 T3 3 2.8 2 0.9 T4 2 1.9 0 0 pN stage < 0.001 N0 47 44.3 150 70.8 N1 25 23.6 43 20.3 N2 16 15.1 13 6.1 N3 18 17.0 6 2.8 ALN metastasis number (IQR) 1 (7) 0 (1) < 0.001 Surgery history 0.266 Radical surgery 52 49.1 118 55.7 Breast con- Serving 54 50.9 94 44.3 Tumor grade Grade 1 3 2.8 4 1.9 0.057 Grade 2 35 33.1 44 20.8 Grade 3 63 59.4 149 70.3 Unknown 5 4.7 15 7.0 Adjuvant chemotherapy 0.056 A 2 1.9 3 1.4 T 0 0.0 14 6.7 A + T 63 59.4 129 60.8 T + P 33 31.1 59 27.8 Others 8 7.6 7 3.3 Adjuvant radiation 0.341 Yes 57 53.8 102 48.1 No 49 46.2 110 51.9 Note. ROM, recurrence or metastasis; nROM, non-recurrence or metastasis; pT stage, pathological T stage; pN stage, pathological N stage; ALN, Axillary lymph nodes; A, Anthracyclines; T, Taxanes; P, Platinum drugs To further improve the performance and interpretability of the prediction model, we incorporated clinical data to enhance decision-making accuracy. We then used MCB to linearly fuse the deep learning features extracted from pathological images with the five selected clinicopathological features. The resulting model, trained with five-fold cross-validation, achieved an AUC of 0.86 (Figure 4A), demonstrating a significant improvement over the image-only model. Additionally, the accuracy, precision, recall, and F1-score were 0.806, 0.702, 0.690, and 0.693, respectively, substantially higher than those obtained without clinical data integration. These findings indicate that including clinicopathological information effectively enhances model performance and supports more accurate predictions. Furthermore, model interpretability was improved by incorporating clinical variables. External validation using the TCGA dataset yielded an AUC of 0.75 (Figure 4B), confirming the generalizability of the multimodal prediction model.
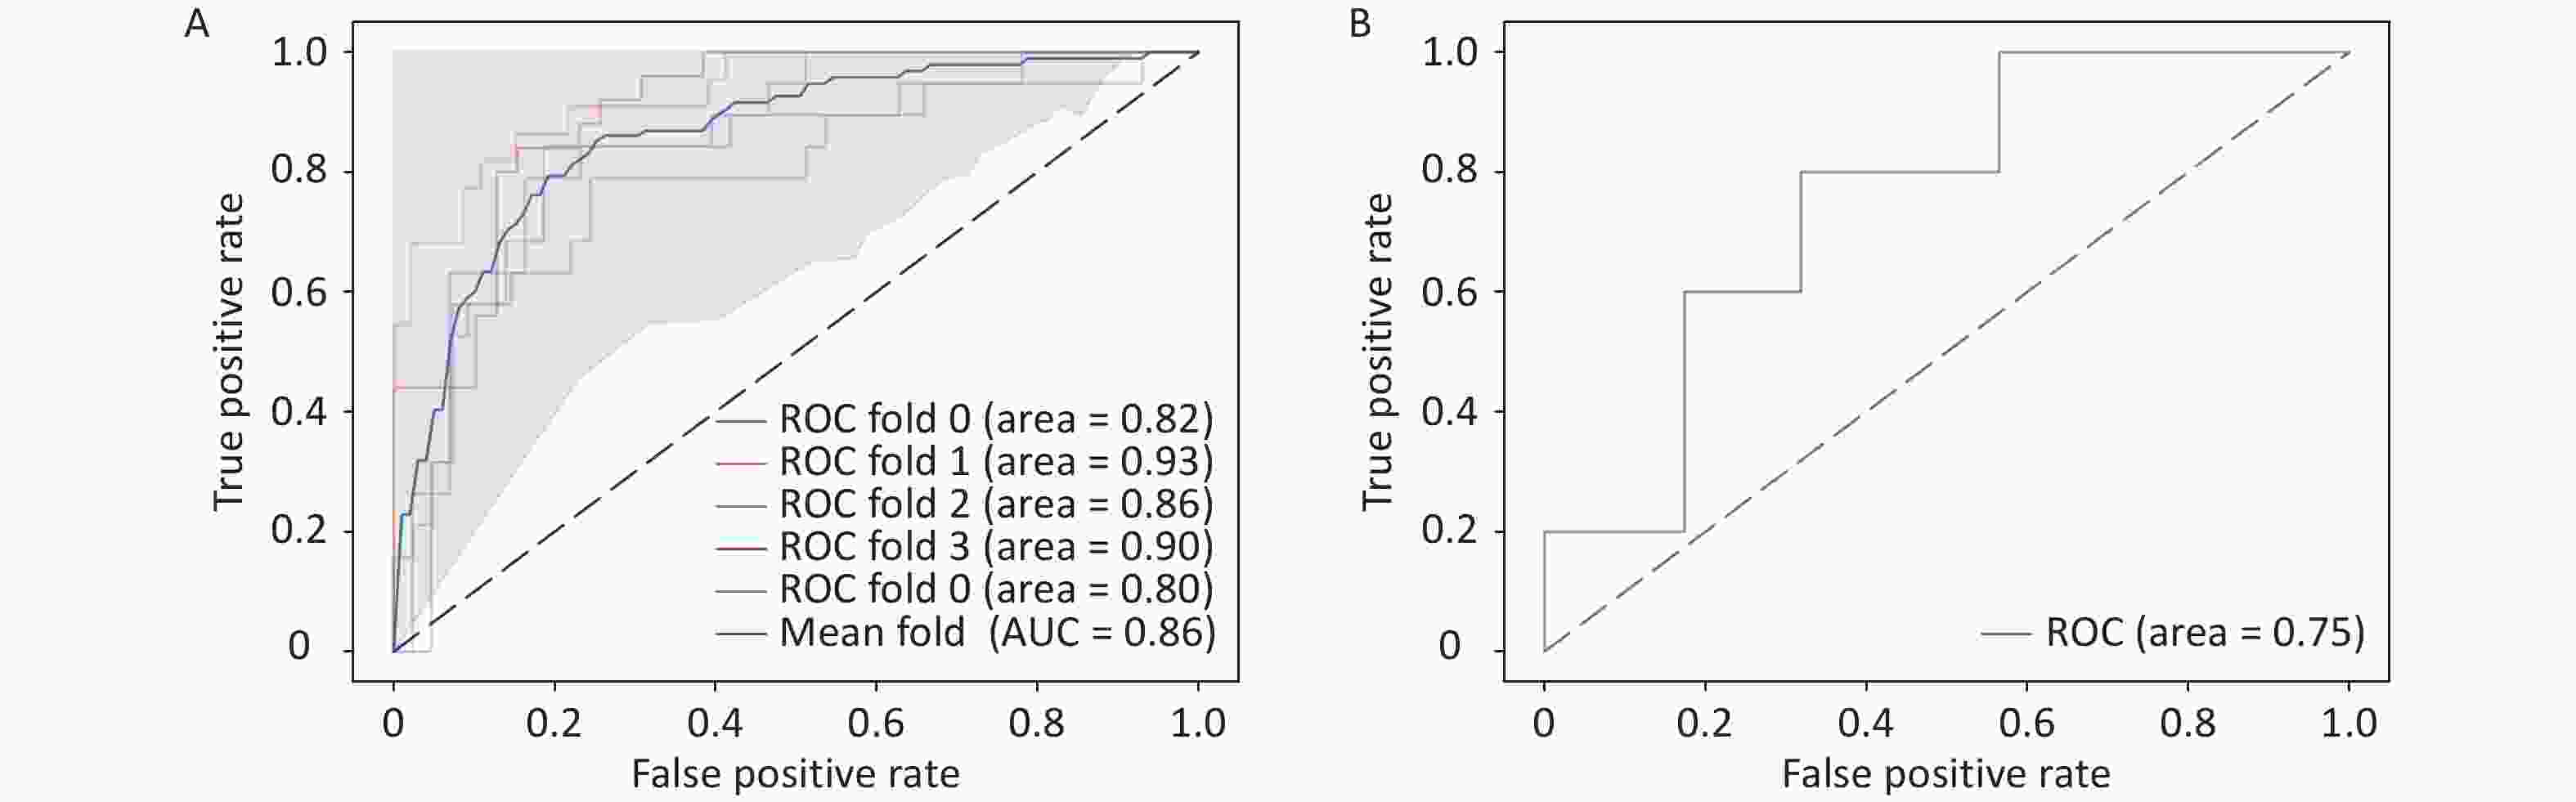
Figure 4. Prediction results of the multimodal model integrating pathological images and clinical features.
-
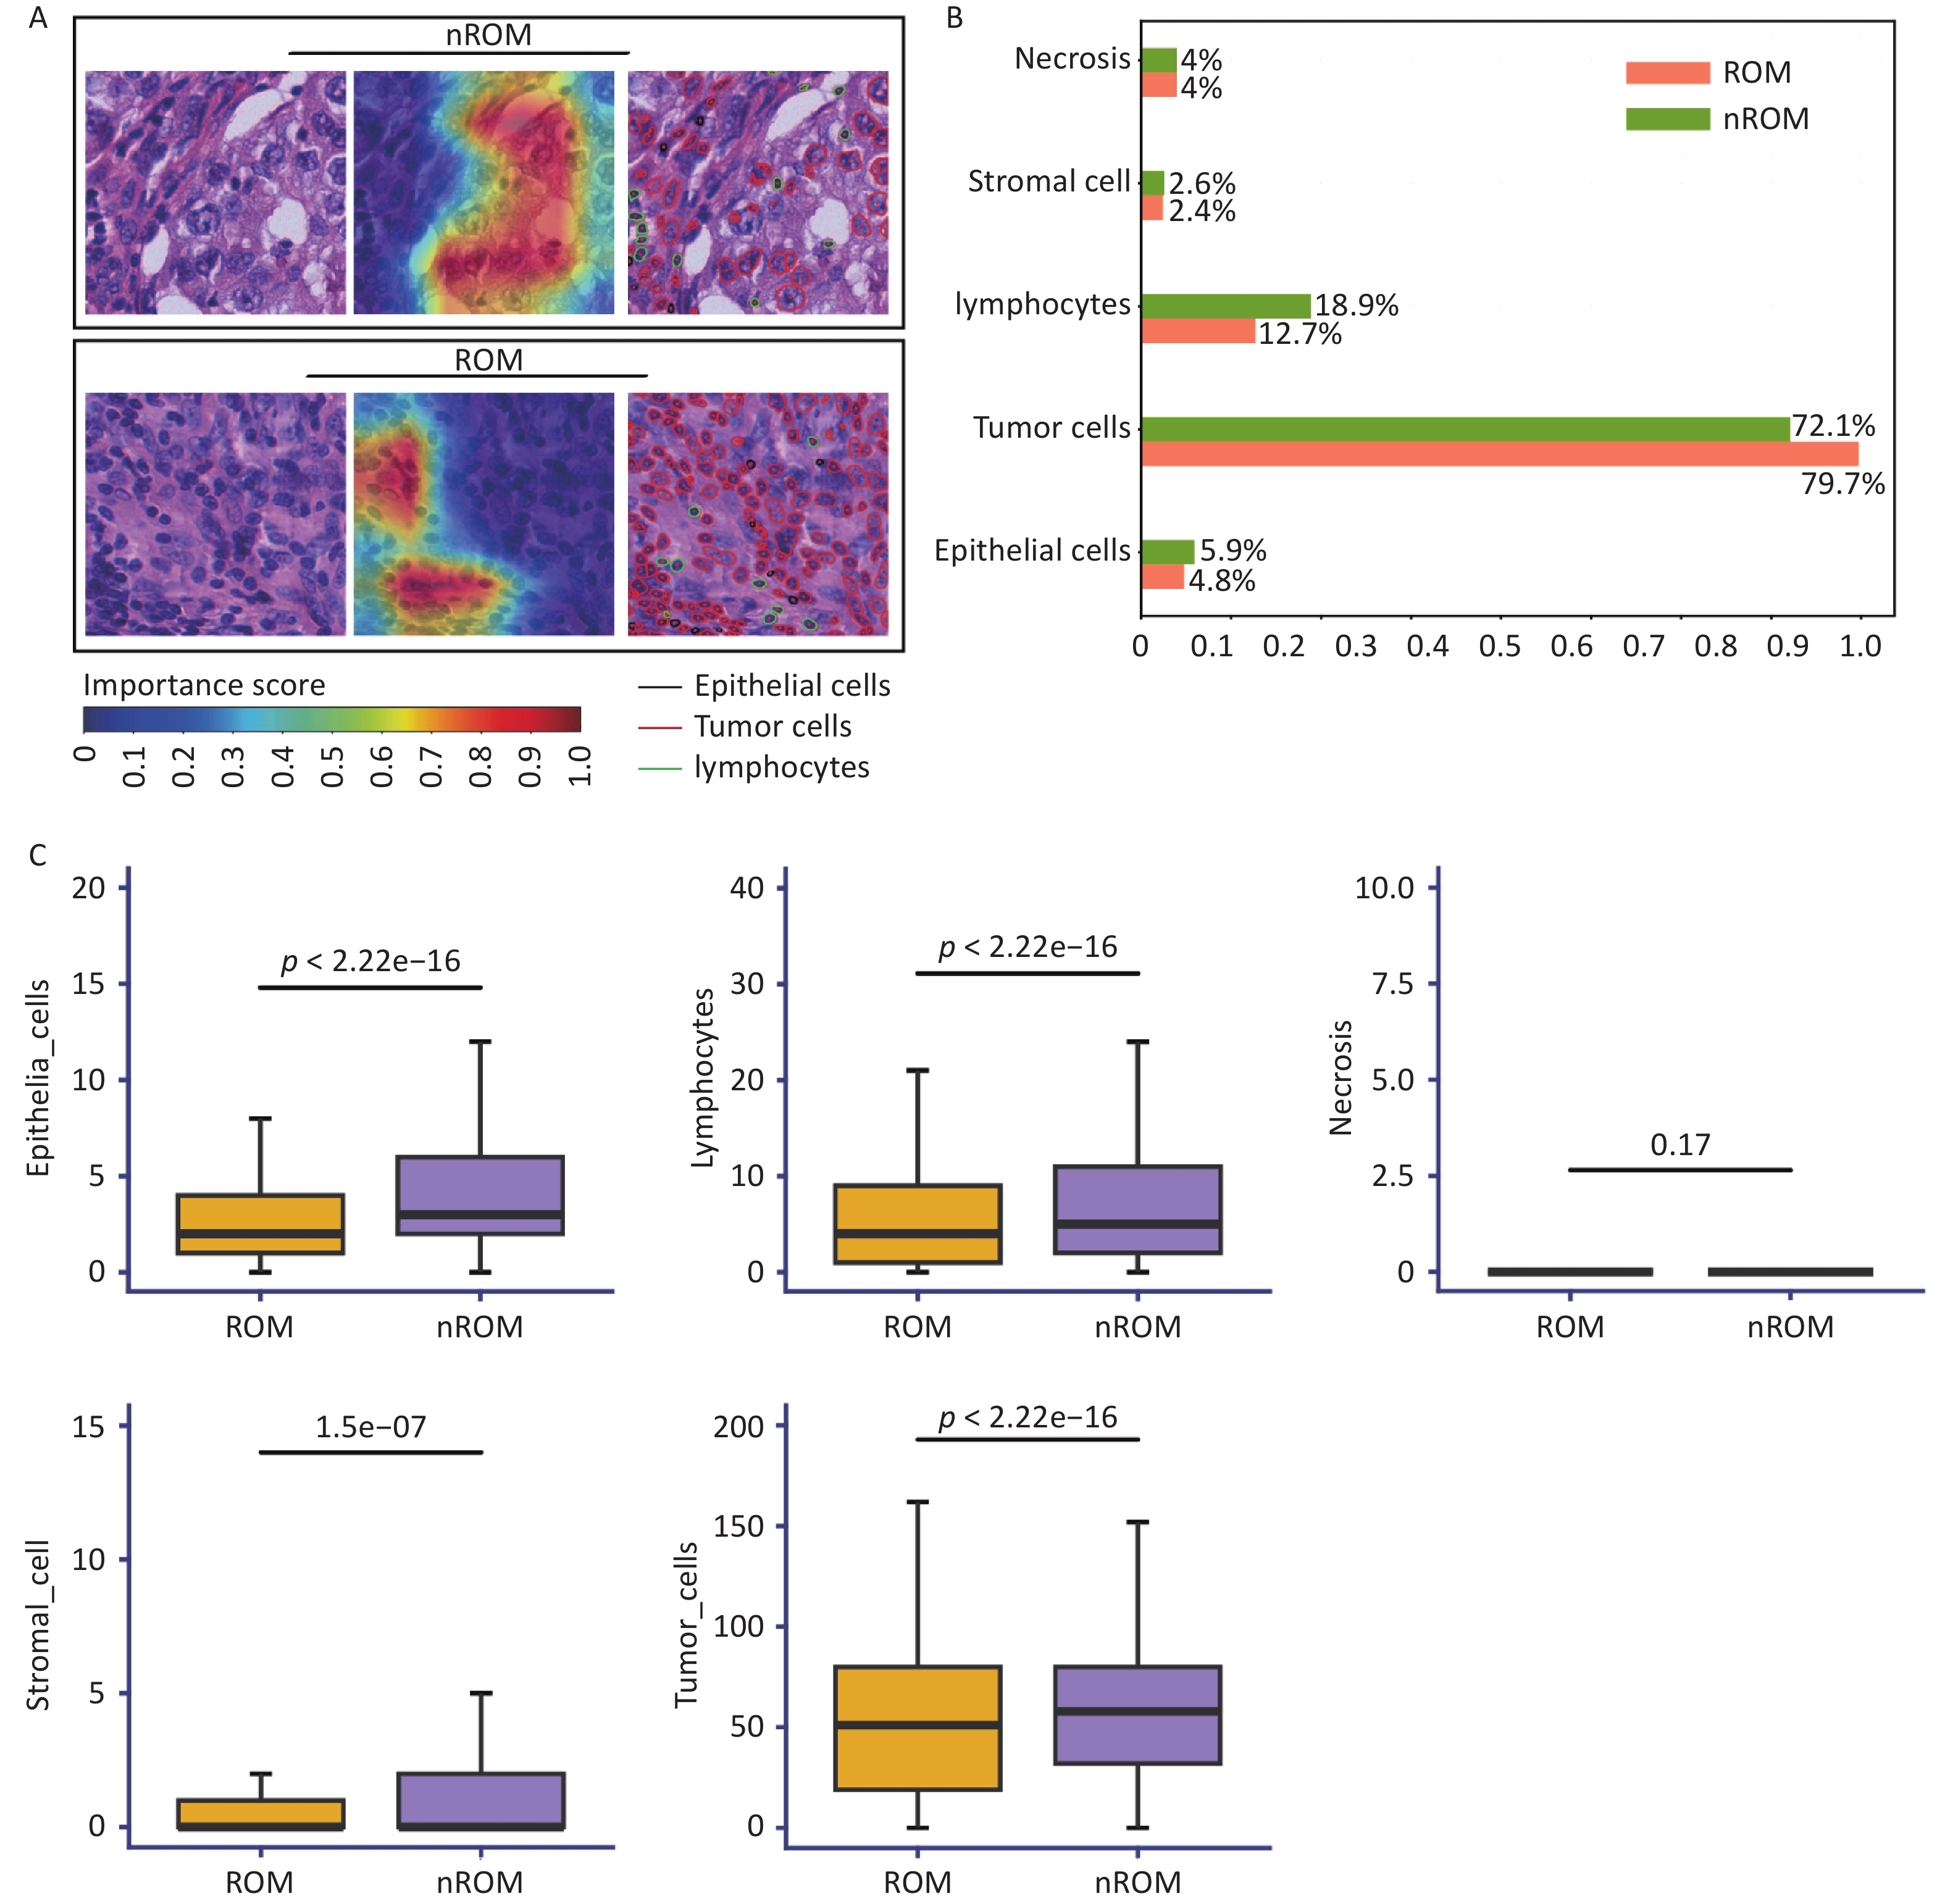
We applied Grad-CAM to visualize the WSIs from the training cohort and employed the HoVer-Net model to segment and quantify cells within the annotated regions of interest. As shown in the attention map (Figure 5A), red regions represented areas with stronger prognostic relevance, whereas blue regions indicated weaker relevance.

Figure 5. Visual analysis of pathological image features associated with prognosis in early-stage TNBC.
Using HoVer-Net, we further performed cell segmentation and classification (Figure 5a) and identified five major types of cells: tumor, lymphocytes, stromal, epithelial, and necrotic (Figure 5B). To examine the relationship between cellular composition and ROM, we conducted a Wilcoxon rank-sum test comparing patients with ROM and nROM (Figure 5C). The results revealed that ROM patients had significantly lower lymphocyte counts compared to nROM patients (P < 0.05). This difference was also visually evident in the HoVer-Net segmentation outputs (Figure 5a). Furthermore, we compared the relative abundance of lymphocytes with other cell types within prognostically relevant regions. The ratios of lymphocytes to tumor, stromal, epithelial, and necrotic cells were significantly higher in the nROM group than in the ROM group (all P < 0.05) (Supplementary Figure S4). Overall, these findings enhance the interpretability of our prediction model by linking histopathological morphology to biologically meaningful variations in the tumor immune microenvironment associated with recurrence and metastasis in early-stage TNBC.
-
To further investigate the biological interpretability of the pathological image-based prediction model for TNBC recurrence and metastasis, we conducted an exploratory analysis examining the relationship between image-derived texture features and the tumor immune microenvironment.
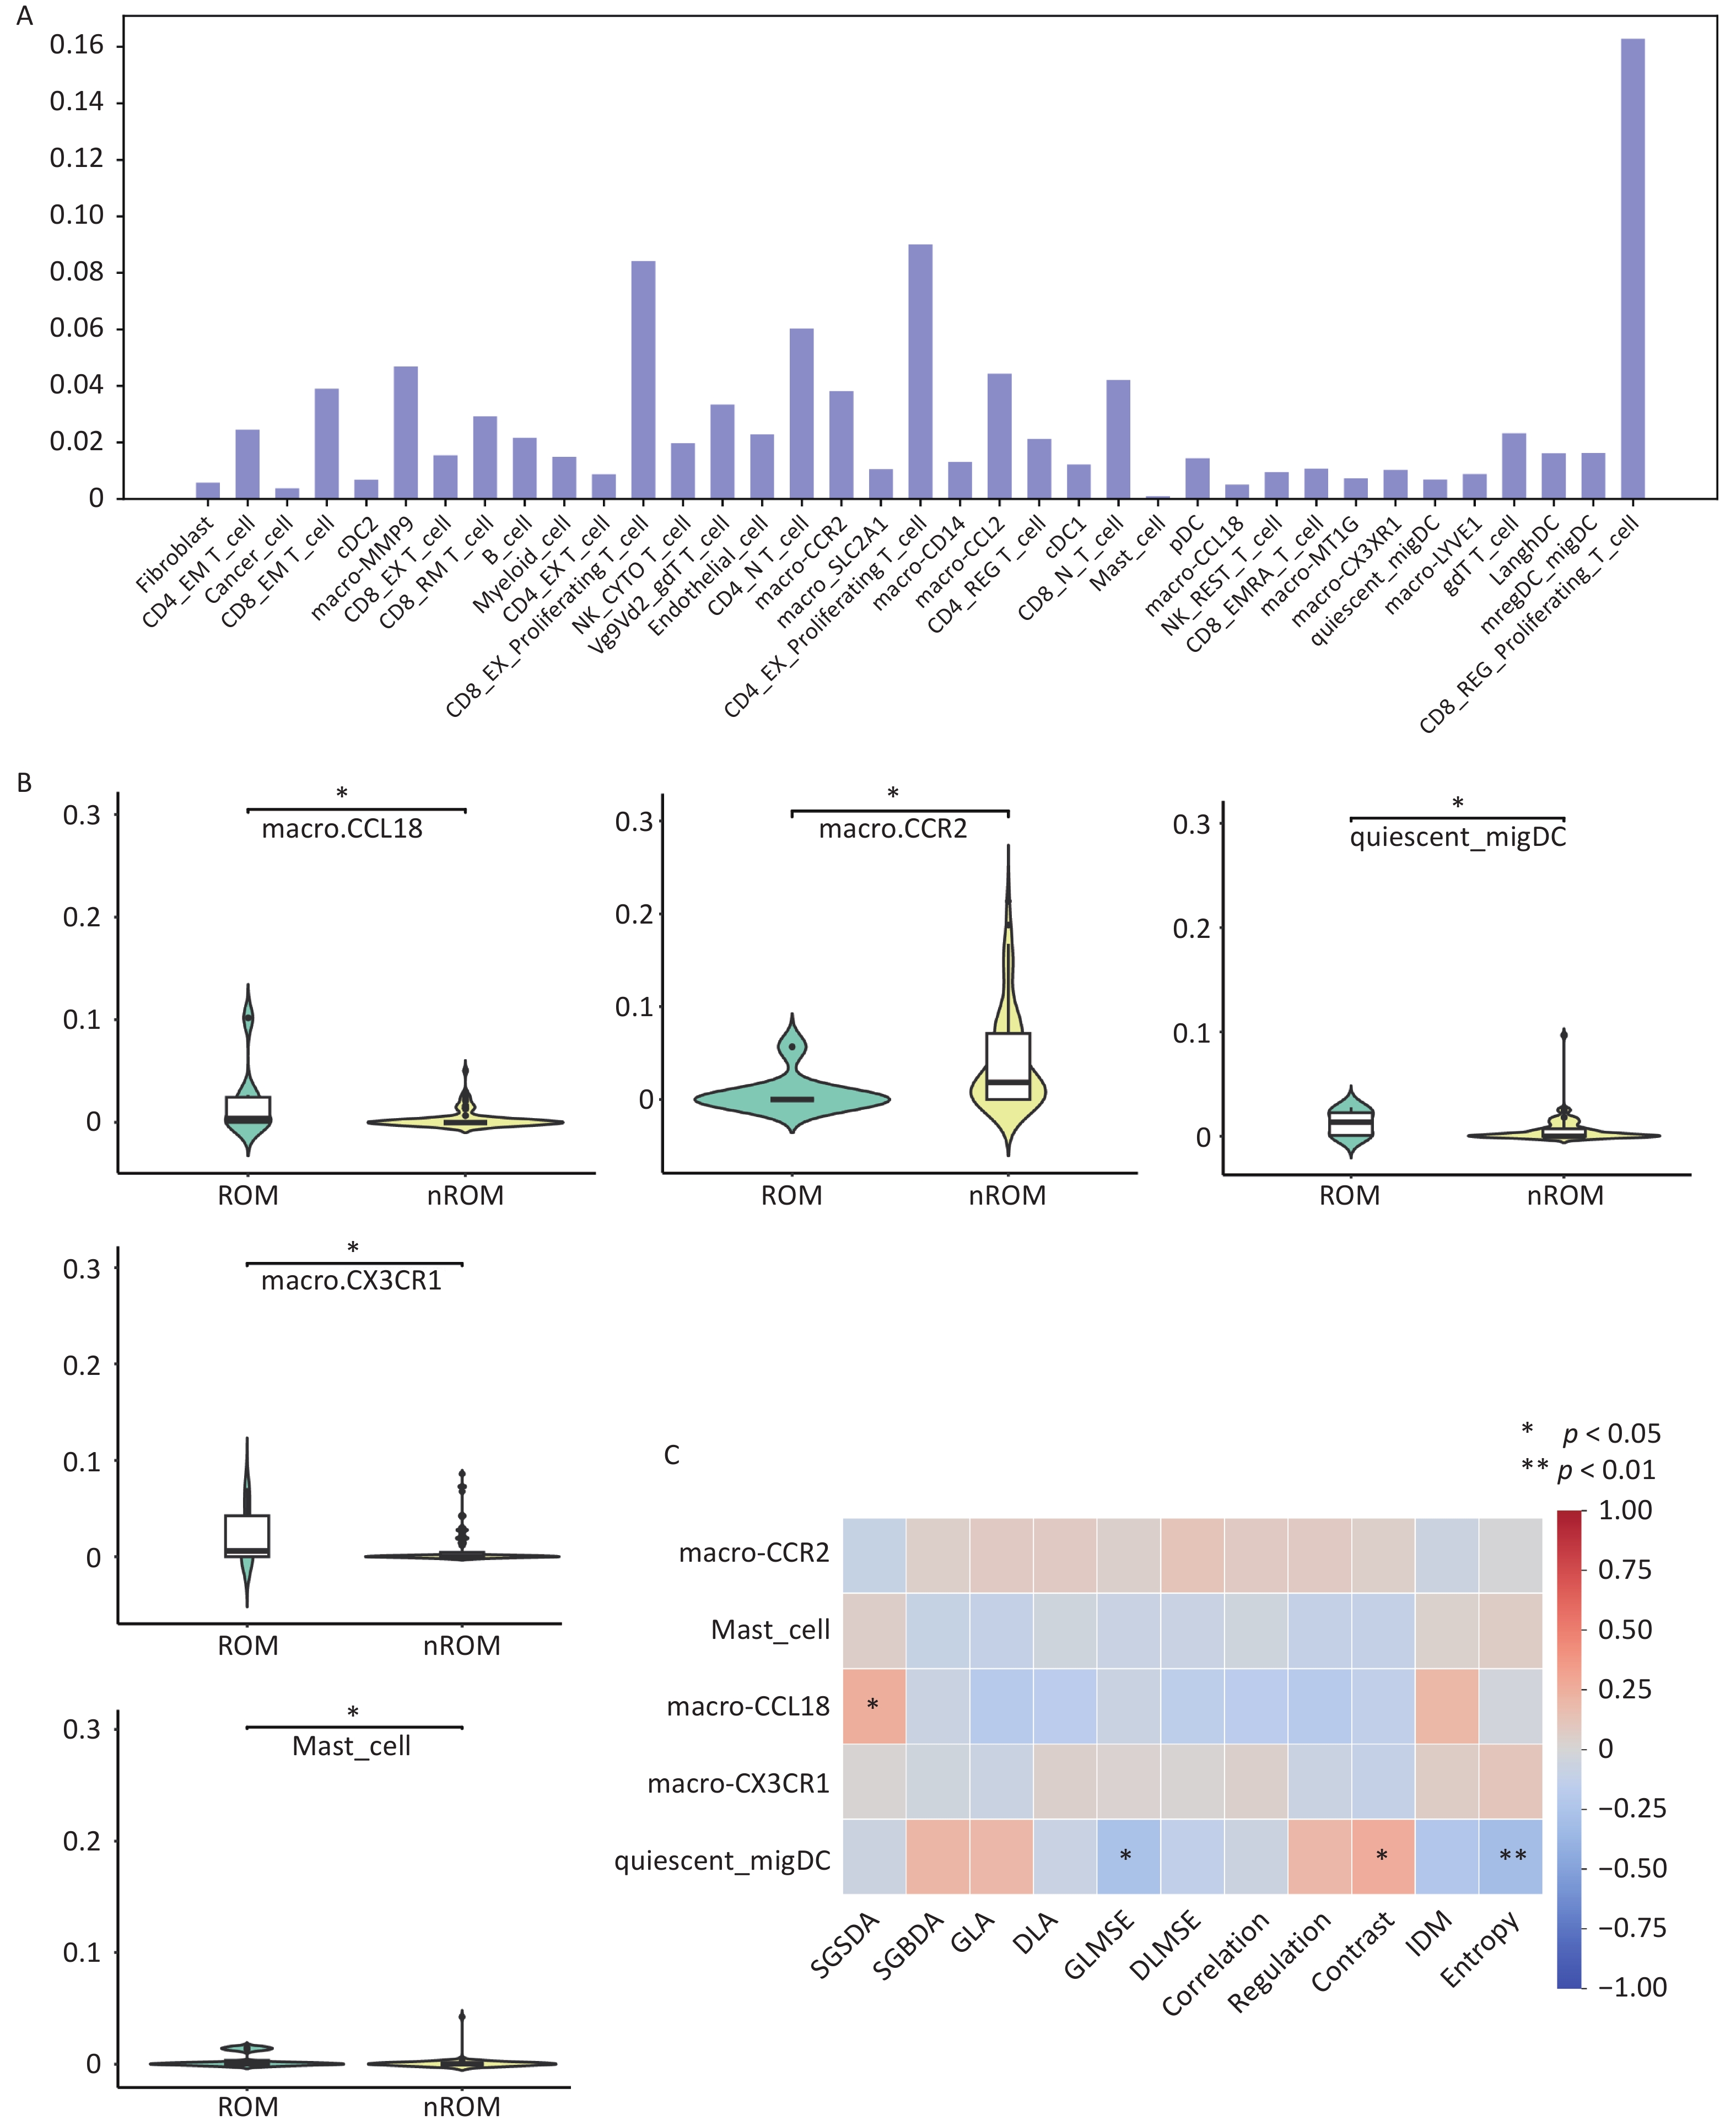
In the TCGA cohort, based on mRNA sequencing data, the CIBERSORT deconvolution algorithm was used to estimate the relative proportions of immune cell populations and subtypes within each sample, including T cells, B cells, macrophages, mast cells, and dendritic cells (DCs) (Figure 6A). Differential analysis identified significant differences (P < 0.05) in the proportions of three macrophage subtypes, one dendritic cell subtype, and mast cells between patients with ROM and those with nROM (Figure 6B). Specifically, the ROM group exhibited elevated levels of macro-CCL18 and quiescent_migDC cells, suggesting a potential role for these immune subsets in promoting poor prognosis. In addition, to ensure robustness, we performed complementary validation using the xCell algorithm. Owing to inherent differences in immune cell type definitions between CIBERSORT and xCell, the xCell-based results further supported our findings, revealing a significant increase in M2 macrophages and a decrease in M1 macrophages within the ROM group (Supplementary Figure S5). Notably, the macro-CCL18 population, identified in this study, corresponded to the M2 macrophage phenotype, thereby providing biological validation from an independent analytical perspective. Using the WMCM method, we extracted 11 texture features from the pathological images in the TCGA external validation cohort and examined their associations with patient prognosis. Significant differences (P < 0.05) were observed in several texture parameters, including SGSDA, SGBDA, GLA, Regulation, Contrast, IDM, and Entropy, between the ROM and nROM groups (Table S2).
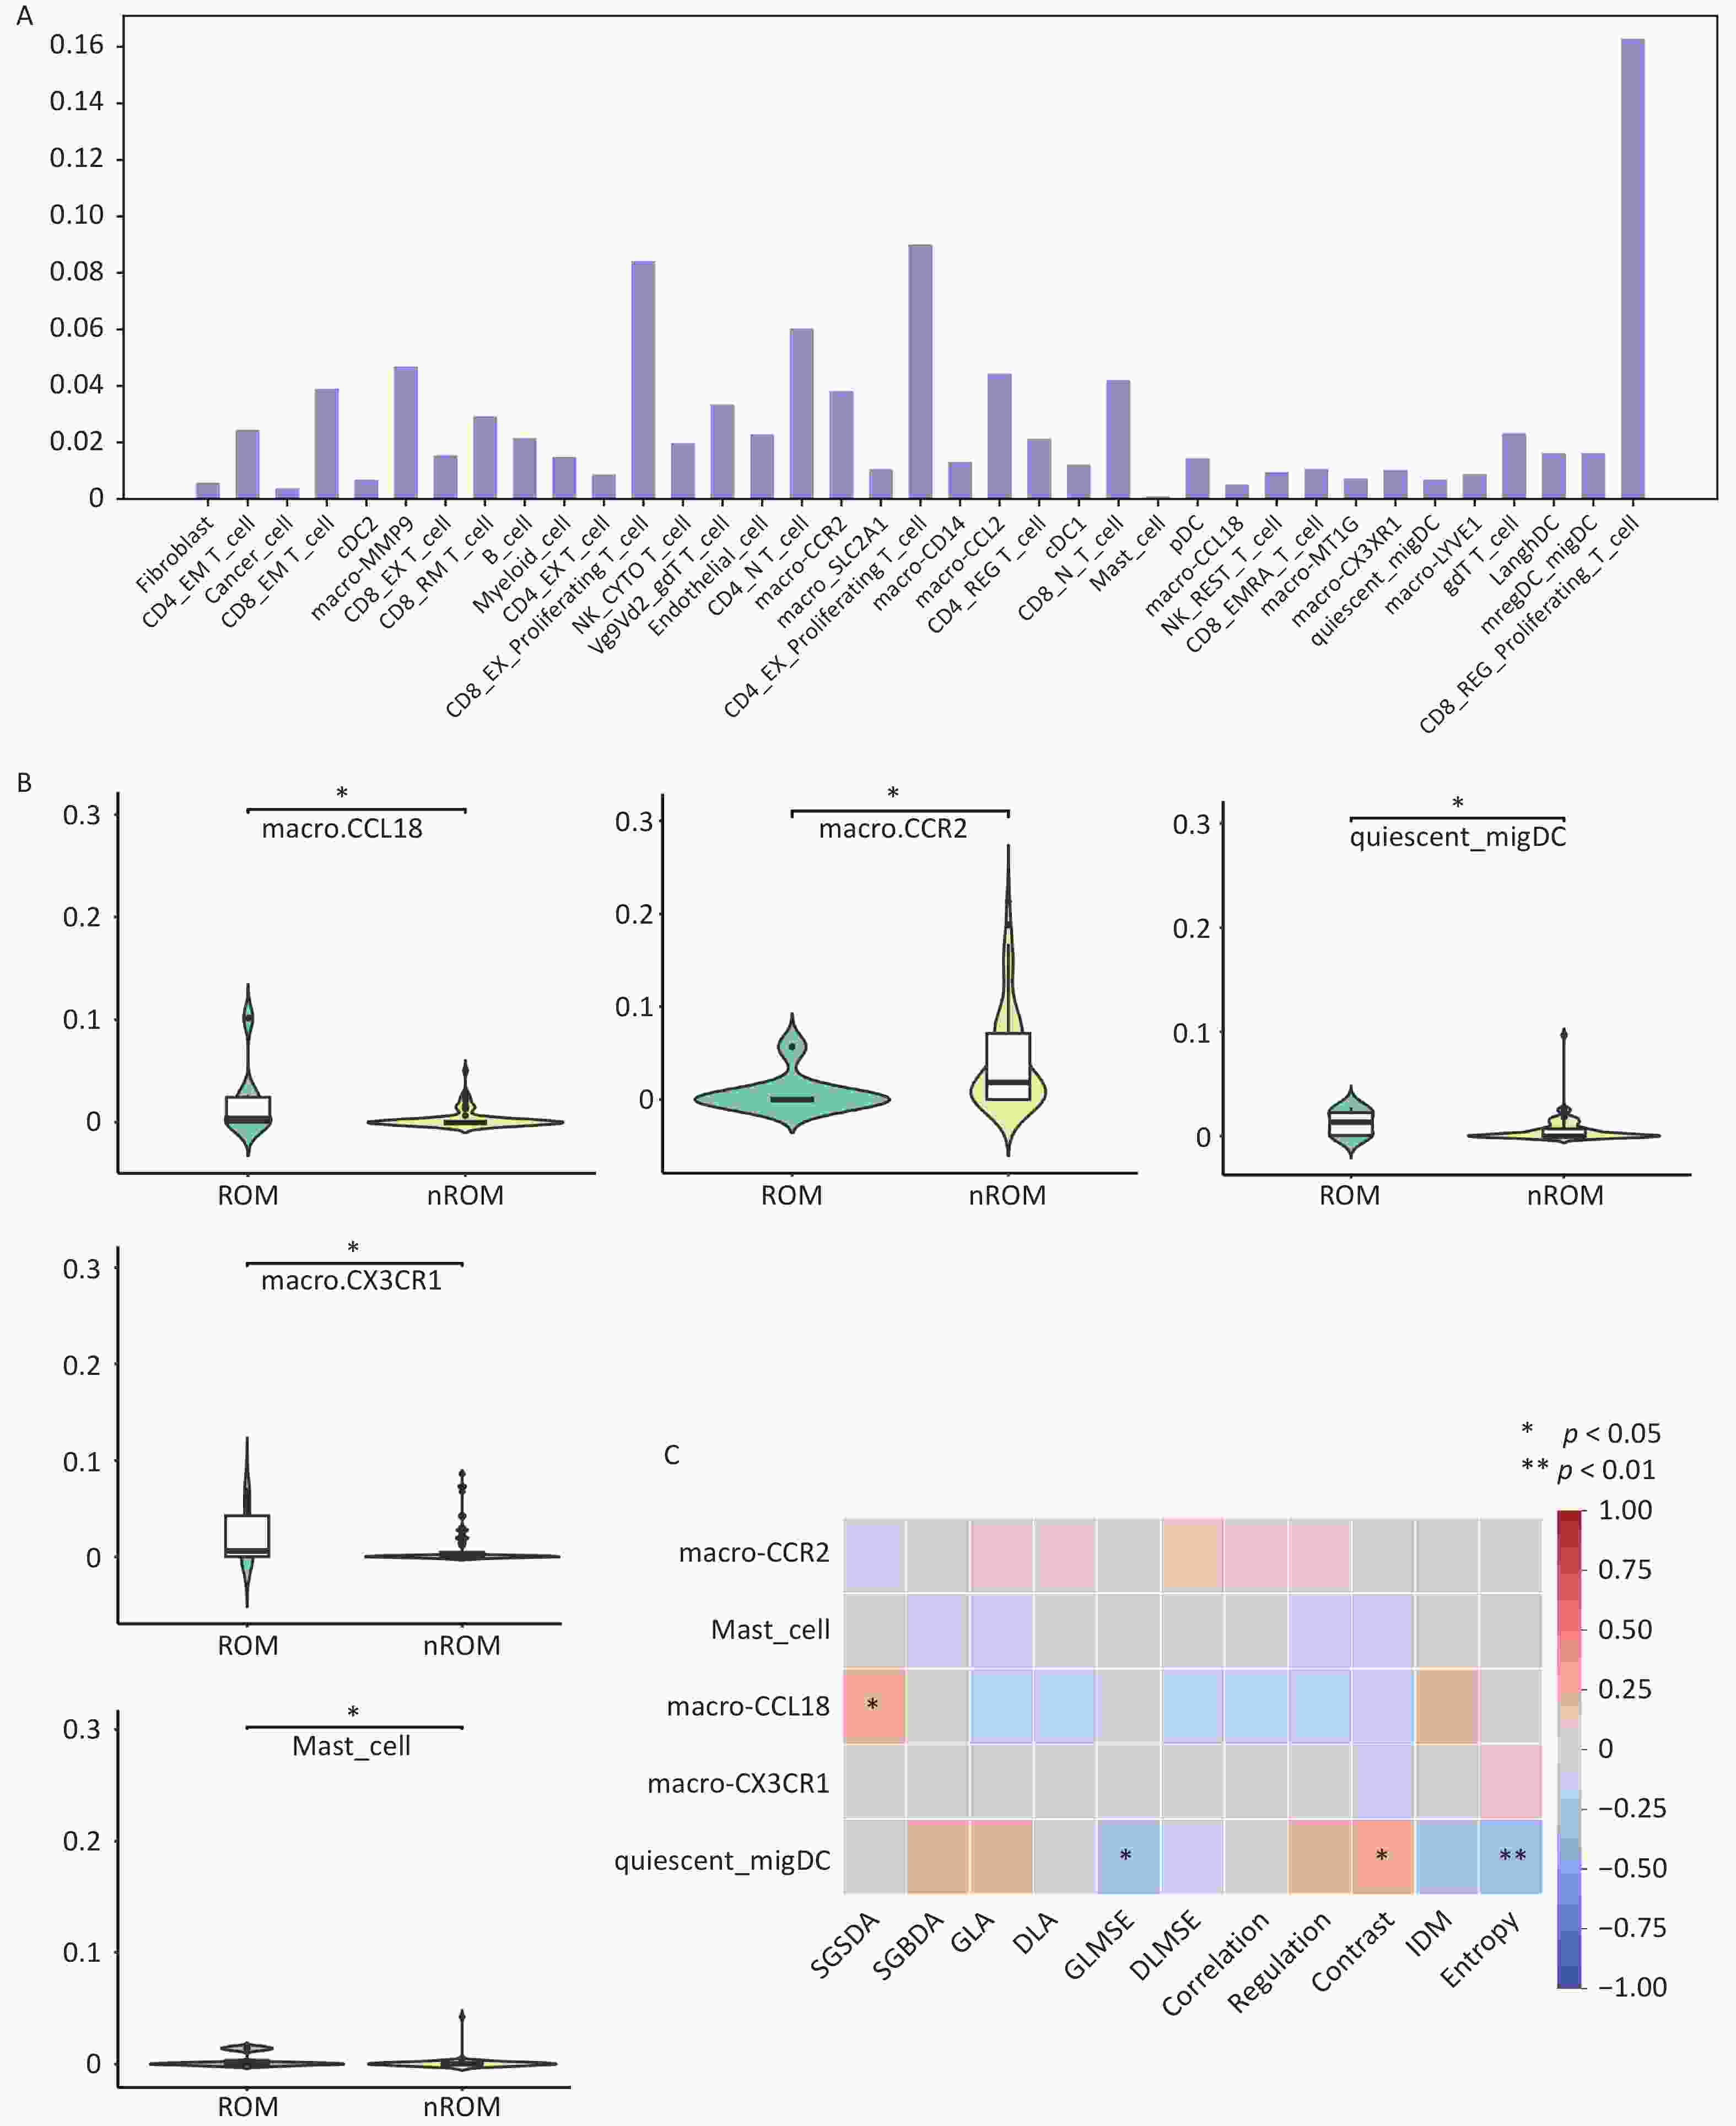
Figure 6. Interaction analysis between pathological image texture features and tumor immune cell composition.
Finally, Pearson correlation analysis was performed between immune cell types exhibiting significant group differences and the extracted image texture features. GLMSE, Contrast, and Entropy were significantly correlated with quiescent_migDC content, whereas SGSDA was significantly correlated with macro-CCL18 levels (Figure 6C). Collectively, these findings suggest that pathological image-based predictions of recurrence and metastasis in early-stage TNBC may partially reflect heterogeneity in the tumor immune microenvironment.
-
To further elucidate the biological interpretability of pathological image-based prognostic predictions for TNBC, we conducted an exploratory analysis examining the relationship between image-derived texture features and gene expression profiles. mRNA sequencing data were obtained from the TCGA database, and differential expression analysis was performed using the DESeq2 package in R (Figure 7A). A total of 1,587 differentially expressed genes (DEGs) were identified between patients with ROM and nROM (P < 0.05), comprising 763 upregulated and 824 downregulated genes.
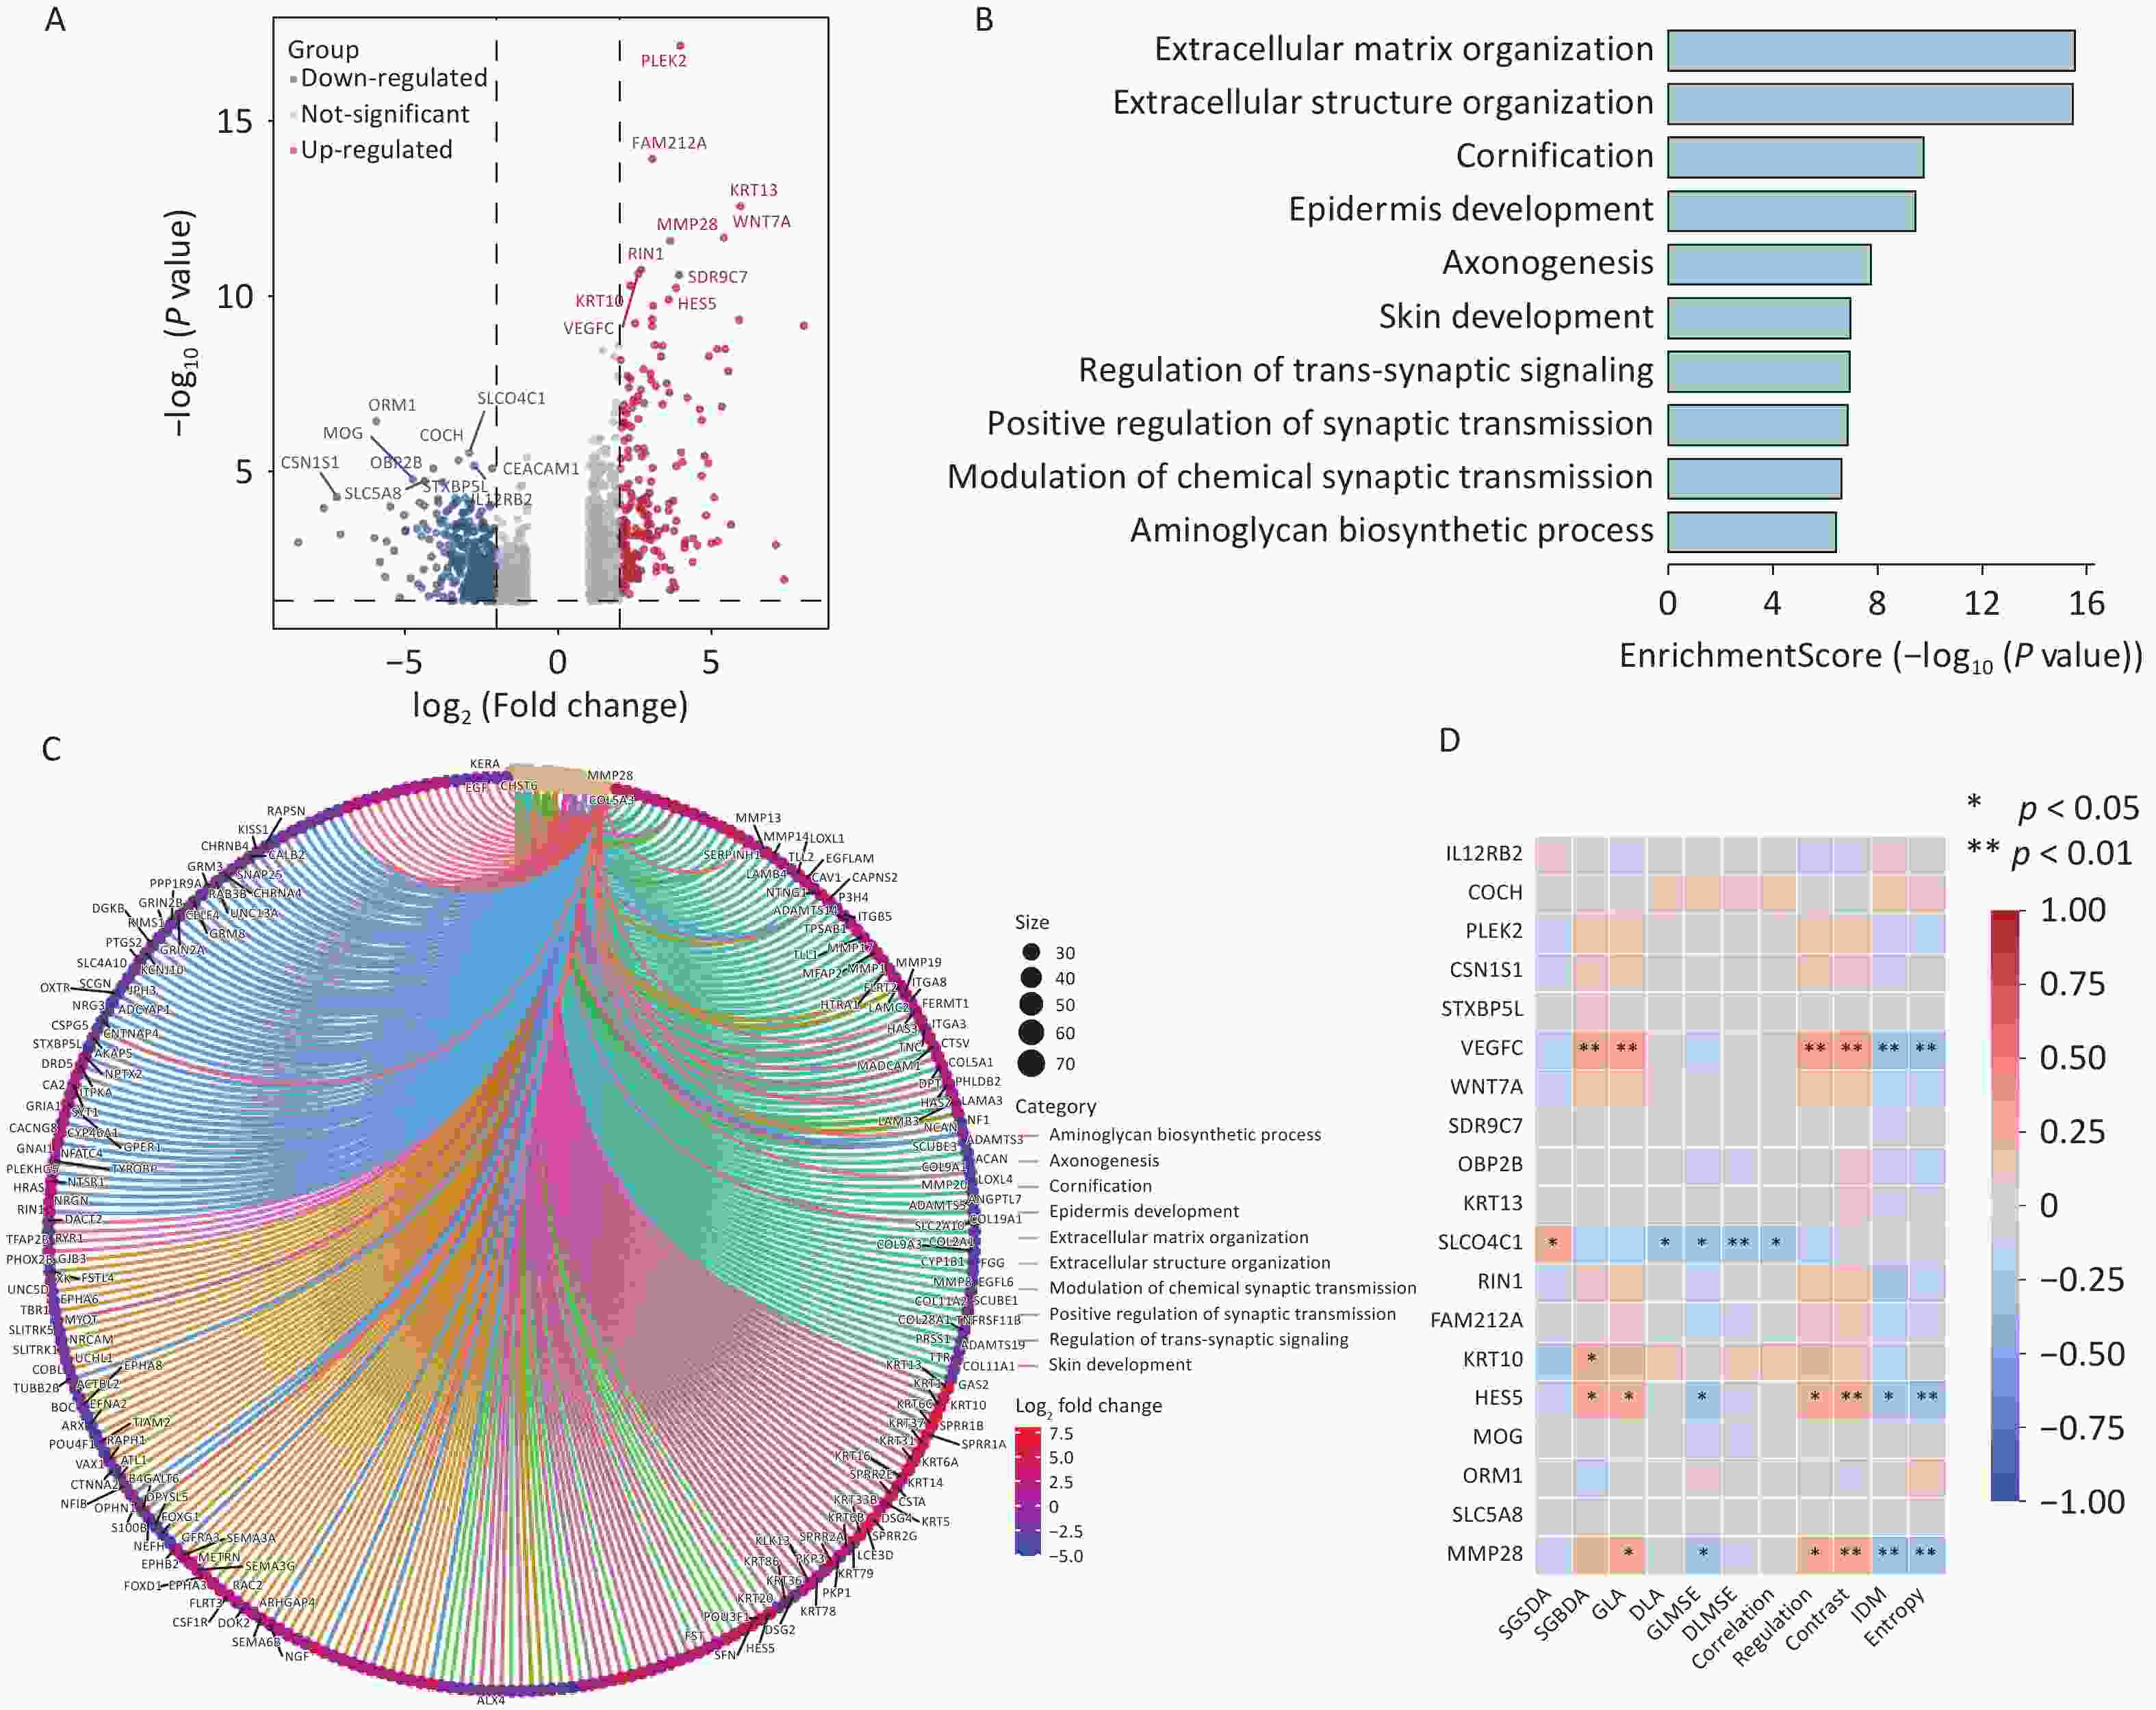
Figure 7. Interaction analysis between pathological image texture features and tumor immune cell composition.
Several genes associated with poor prognosis were significantly upregulated in the ROM group, including MMP28 (involved in aminoglycan biosynthesis) as well as VEGFC, KRT13, KRT10, and HES5 (markers of epidermal differentiation). Given the limited evidence regardingreports of HES5 in the TNBC literature, we performed external validation using two independent TNBC datasets from the GEO database, both of which confirmed a consistent trend of upregulation (Supplementary Figure S6). All identified DEGs were subjected to GO functional enrichment analysis, which revealed that genes upregulated in the ROM group were primarily enriched in pathways related to extracellular matrix organization, extracellular structure formation, epidermal differentiation, synaptic signaling, and aminoglycan biosynthesis (Figure 7B, C). We then examined the correlations between image-derived texture features and the expression of key upregulated genes. Notably, the expression levels of VEGFC, HES5, and MMP28 in ROM patients showed significant associations with specific texture features, including GLA, Regulation, Contrast, IDM, and Entropy (Figure 7D).
Collectively, these findings suggest that pathological image-based predictions of recurrence and metastasis in early-stage TNBC may reflect underlying transcriptomic alterations, particularly those related to extracellular remodeling and tumor progression.
-
TNBC is a highly aggressive subtype of breast cancer, characterized by the absence of well-defined biomarkers and effective targeted therapies[24]. Compared with other subtypes, TNBC exhibits earlier relapse and a poorer prognosis[3]. Consequently, accurate prognostic prediction is essential for guiding clinical decision-making and optimizing treatment strategies. H&E-stained pathological sections remain a cornerstone in routine clinical diagnostics due to their low cost and accessibility. With the rapid integration of deep learning into digital pathology, several studies have demonstrated its potential for predicting cancer prognosis using histopathological WSIs[7-8]. However, because of the relatively low incidence of TNBC, large-scale image-based prognostic modeling studies in this subtype remain limited.
In this study, we retrospectively analyzed 340 postoperative H&E stained WSIs from 318 patients with early-stage TNBC and well-documented recurrence/metastasis outcomes treated at the Cancer Hospital, Chinese Academy of Medical Sciences. A deep learning-based prognostic prediction model was developed using five-fold cross-validation, achieving an AUC of 0.805 in the training cohort. When validated on an independent external validation cohort from the TCGA database, the model achieved an AUC of 0.858, indicating strong generalizability. To further improve model performance and interpretability, we incorporated clinical variables into the framework. Differential analysis identified five clinicopathological features—age, number of axillary lymph node metastases, pT stage, pN stage, and TNM stage—that were significantly associated with recurrence/metastasis. These features are consistent with previously reported prognostic indicators in TNBC, thereby supporting the reliability of our dataset. The fusion of deep learning features from pathological images with clinicopathological features improved model performance, achieving an AUC of 0.86 in the training cohort. This confirms that multimodal integration reduces data noise and enhances prediction accuracy.
Deep learning offers a significant advantage by automatically learning abstract feature representations through multi-layer neural networks, often outperforming traditional omics-based methods such as radiomics or pathomics[25]. However, its complex architecture presents significant challenges to interpretability—a critical requirement in clinical applications. Despite recent advancements, few studies have systematically investigated the interpretability of deep learning models in TNBC. In this study, Grad-CAM was used to visualize attention regions within WSIs, revealing prognostically relevant areas marked in red and less relevant regions in blue. These maps demonstrated that the model appropriately weighted different tumor regions, regardless of recurrence status.
Using HoVer-Net, we further segmented five distinct cell types within tumor regions—tumor, lymphocytes, stromal, epithelial, and necrotic cells—and compared their proportions between the ROM and nROM groups. We found that non-recurrent patients exhibited significantly higher lymphocyte infiltration, which is consistent with meta-analyses showing that increased numbers of tumor-infiltrating lymphocytes are associated with improved survival in TNBC[26-28]. Furthermore, within the prognostically relevant tumor regions, we compared the lymphocyte content with that of the tumor, epithelial, stromal, and necrotic cells. The results showed that lymphocyte-to-other-cell ratios were significantly higher in patients without recurrence than in those with recurrence, regardless of the reference cell type (Supplementary Figure S4). In TNBC, tumor-infiltrating lymphocytes produce anti-tumor cytokines and cytotoxic molecules (e.g., IFN-γ, TNF-α, perforin, granzyme) that directly kill tumor cells and activate immune responses. Some of these lymphocytes differentiate into memory cells, enabling the rapid recognition of recurrent tumor cells through cytokines and chemokines such as IL-12 and CXCL9. These mechanisms foster a more immunoreactive tumor microenvironment and help prevent recurrence[29-31]. Our findings support this hypothesis. Collectively, these results support that cell composition within pathological images is associated with clinical outcomes in early-stage TNBC.
The tumor immune microenvironment plays a critical role in tumor progression, angiogenesis, immune evasion, and treatment resistance[32]. Cellular composition within the microenvironment is partially reflected in H&E-stained images, providing valuable prognostic information. We used mRNA sequencing data from the TCGA cohort and CIBERSORT algorithm to infer immune cell composition. Some of these results were further validated using the xCell algorithm (Supplementary Figure S5). Differential analysis revealed that macro-CCL18 and quiescent_migDC cells were significantly enriched in recurrent cases. Macro-CCL18, a subtype of M2-type tumor-associated macrophages (TAMs), secretes CCL18 chemokines that promote metastasis and angiogenesis by interacting with PITPNM3, contributing to poor prognosis in various cancers, including esophageal cancer[33-34]. IL-1α, through activation of downstream signaling via the IL-1R1/IRAK4 axis, can induce M2-like polarization of TAMs, resulting in significant enrichment of M2-like TAMs around tumor cells. This, in turn, activates three key downstream signaling pathways: ERK1/2-ZEB1-VIM, MKK4-JNK-c-Jun, and NF-κB, which collectively enhance TNBC cell survival, migration, and macrophage recruitment[35]. Moreover, studies have demonstrated that in TNBC, a subtype with poor prognosis, the non-coding RNA circ-0100519 is highly expressed and can be transferred into TAMs via exosomes. Upon internalization, circ-0100519 promotes M2 macrophage polarization through the circ-0100519/USP7/NRF2 axis, thereby facilitating the in vivo proliferation and metastasis of TNBC cells[36]. Although quiescent_ migDCs have been linked to T cell activation and anti-tumor immunity in head and neck cancers[37], our findings suggest a potential association with poor prognosis in TNBC, which warrants further functional validation. These immune-related findings provide mechanistic support for image-based prognostic modeling.
Previous studies have shown that image-derived texture features can predict the prognosis of various tumors, including non-small cell lung cancer, gastric cancer, and HER2-positive breast cancer[23,38-39]. Consistent with these findings, our study identified several texture features, such as SGSDA, Contrast, and Entropy, that were significantly associated with TNBC prognosis (Supplementary Table S2). This approach of converting image data into structured information not only facilitates prognostic modeling but also enhances the interpretability of deep learning model outputs. However, the biological mechanisms underlying these associations remain unknown.
In the present study, we aimed to interpret these correlations from the perspective of immune cell infiltration and its physical impact on the tumor microarchitecture. Previous research has demonstrated that texture-based image analysis can identify immune cell phenotypes and predict immune profiles (IP) and overall survival (OS) in patients with intrahepatic cholangiocarcinoma (ICC)[40]. Upon activation, macrophages and dendritic cells (DCs) undergo morphological changes, including alterations in cell borders, surface texture, intracellular content, and spatial distribution[41-43]. Activated macrophages, for instance, exhibit enlarged cell bodies with numerous pseudopodia and roughened surfaces, which enhance light scattering and appear with locally increased brightness under microscopy[41]. In H&E-stained slides, these cells contain abundant lysosomes and phagocytic vesicles, which stain more intensely due to increased eosinophilia, resulting in high-intensity pixel regions in grayscale images and, consequently, thicker textures captured by elevated SGSDA.
Similarly, when immune cells aggregate or infiltrate the periphery of tumor nests, the morphological and staining contrast between the immune and tumor cells generates sharper local boundaries[42]. This, in turn, increases the grayscale variation between adjacent regions, corresponding to higher Contrast values. Furthermore, mature DCs stimulated by tumor antigens adopt a spindle-shaped morphology with smooth surfaces, fewer cytoplasmic vacuoles, and more uniform distribution. In contrast, immature DCs exhibit irregular shapes and greater grayscale variability[43]. These morphological differences result in localized image homogenization and a reduction in overall grayscale complexity and dispersion, as reflected by the decreased GLMSE and Entropy values. Our findings support the plausibility of these associations.
Collectively, these specific texture features may sensitively capture the morphological changes induced by immune infiltration, including increased tissue heterogeneity, more frequent interfaces, and greater spatial complexity. Emphasizing that this hypothesis is based on correlation analysis and established biological knowledge is crucial. Texture patterns in H&E-stained images are indirect, integrative reflections of downstream morphological alterations caused by immune activity, rather than direct markers of immune cells. To further validate and elucidate the causality of these mechanisms, future studies, including spatial co-localization analysis using multiplex immunofluorescence, are warranted. These results further enhance the interpretability of our model by linking specific visual features to the composition of the immune microenvironment.
Gene expression profiles fundamentally govern cellular phenotypes and shape tissue-level morphological patterns. To elucidate the molecular basis underlying our image-based predictions, we performed differential gene expression analysis using the TCGA-TNBC cohort. DESeq2 identified 1,587 DEGs between patients with ROM and nROM. Among these, MMP28, VEGFC, and HES5 were significantly upregulated in the ROM group, suggesting their potential involvement in disease progression. VEGFC, the first lymphangiogenic member of the VEGF family, plays a central role in lymphatic endothelial cell proliferation, migration, and lymphatic sinus formation[44]. Its overexpression has been documented in multiple malignancies, including TNBC, and is strongly associated with lymphatic dissemination and adverse prognosis[45-47]. In TNBC, polarized M2-like TAMs secrete VEGF-C, which induces the expression of PCAT6, subsequently activating the Akt/mTOR signaling cascade and upregulating VEGFR2 expression. This axis promotes tumor cell proliferation, invasion, epithelial-mesenchymal transition (EMT), and angiogenesis, ultimately facilitating tumor progression and poor clinical outcomes[48]. Matrix metalloproteinases (MMPs) play a pivotal role in extracellular matrix remodeling and tumor progression. MMP28, in particular, has been implicated in enhancing the secretion of pro-tumorigenic cytokines such as IL-8 and VEGFA via MAPK/JNK pathway activation[49]. These cytokines function not only as chemotactic agents but also as key mediators of M2 TAM polarization, partly through the modulation of TAM amino acid metabolism. Furthermore, MMP28 interacts with ANXA2 to facilitate M2 TAM recruitment[49]. In TNBC, M2 TAMs further interact with the PI3K/AKT/IL-34/CSF1R signaling axis, which contributes to the establishment of an immunosuppressive tumor microenvironment that promotes tumor cell proliferation and metastatic dissemination[50]. Our study supports these mechanisms by identifying a marked elevation in the macro-CCL18-positive M2 TAM subset in patients with ROM, which further reinforces the reliability and clinical relevance of our findings. The HES5 transcription factor, which regulates cellular differentiation, has been primarily studied in gliomas, with limited investigation in breast cancer[51]. To further explore its role in TNBC, we conducted external validation using publicly available datasets from the GEO database (Supplementary Figure S6). In the GSE21653 cohort, HES5 expression was significantly upregulated in the ROM group, while a non-significant upward trend was observed in the GSE58812 cohort, suggesting a context-dependent relevance that warrants further functional investigation. Finally, correlation analysis between key DEGs and quantitative imaging features revealed that grayscale complexity, sharpness, depth, and brightness were positively associated with high expression levels of VEGFC, HES5, and MMP28. These findings suggest that image-derived texture patterns may reflect underlying transcriptomic alterations, thereby reinforcing the biological interpretability of our deep learning model.
Despite these encouraging results, this study has several limitations. First, as a retrospective analysis, selection bias may be a factor; therefore, future prospective studies with larger cohorts are necessary to validate our findings. Second, the biological interpretations in this study are primarily based on transcriptomic data, and further functional experiments are required to validate key genes and clarify the causal pathways. Additionally, texture features extracted from H&E-stained images likely reflect indirect morphological changes driven by immune activity, rather than directly identifying immune cell subtypes. The future integration of spatial transcriptomics or multiplex immunofluorescence will be crucial for confirming these associations and further uncovering the underlying mechanisms.
-
In this study, we developed and validated a deep learning–based prognostic prediction model for early-stage TNBC using H&E-stained pathological WSIs. The model demonstrated robust performance in both internal and external cohorts and was further strengthened by integrating clinicopathological features. To address the “black box” nature of deep learning, we conducted a multilevel interpretability analysis. Through visualization techniques, immune cell profiling, texture feature extraction, and transcriptomic correlation, we revealed that pathological images are biologically linked to specific cellular and molecular characteristics of the tumor microenvironment.
Our findings highlight that image-derived features reflect immune cell composition, particularly the macro-CCL18 and quiescent_migDC cell subsets, as well as the expression of poor prognostic genes, such as VEGFC, MMP28, and HES5. These insights provide a mechanistic explanation for the predictive capability of pathological images and establish a foundation for biologically interpretable AI models of TNBC. While further experimental validation is warranted, our study demonstrates the feasibility and clinical potential of using pathological images to predict the recurrence and metastasis of early-stage TNBC. This approach offers a cost-effective, scalable, and biologically meaningful tool to support personalized treatment planning and precision oncology.
doi: 10.3967/bes2025.119
An Exploratory Study on Prognostic Prediction and Interpretability Analysis in Early-stage Triple-negative Breast Cancer Using Pathological Images
-
Abstract:
Objective To develop a prognostic prediction model for early-stage triple-negative breast cancer (TNBC) using H&E-stained pathological images and to investigate its underlying biological interpretability. Methods A deep learning model was trained on 340 WSIs and externally validated using 81 TCGA cases. Image-derived features extracted through convolutional neural networks were integrated with clinicopathological variables. Model performance was assessed using ROC curve analysis, and interpretability was evaluated by correlating image features with mRNA-seq data and characteristics of the immune microenvironment. Results The model achieved AUCs of 0.86 and 0.75 in the training and validation cohorts, respectively. Analysis using HoVer-Net indicated that lymphocyte abundance was associated with recurrence risk. Texture-related features showed significant correlations with immune cell infiltration and prognostic gene expression profiles. Conclusion This study demonstrates that deep learning can enable accurate prognostic prediction in early-stage TNBC, with interpretable image features that reflect the tumor immune microenvironment and gene expression profiles. -
Key words:
- Triple-negative breast cancer /
- Prognostic prediction model /
- Deep learning /
- H&E-stained pathological images /
- Model interpretability
This study was approved by the Ethics Committee of the National Cancer Center/ Cancer Hospital, Chinese Academy of Medical Sciences, and Peking Union Medical College (Approval No:23/349-4901).
Study conception and supervision were performed by Peng Yuan; Raw data collection and collation were conducted by Zixuan Yang and Liuliu Quan; Algorithm development and optimization were carried out by Yaping Lv; Data processing and analysis were completed by Zixuan Yang and Shuyue Chen; Manuscript drafting and revision were undertaken by Zixuan Yang and Yaping Lv; Technical support and valuable feedback were provided by Jie Ju and Yuying Sun.
All data will be available upon reasonable request. The supplementary materials will be available in www.besjournal.com.
Written informed consent for the publication of this study was obtained from all participants.
&These authors contributed equally to this work.
注释:1) Competing Interests: 2) Ethics: 3) Authors’ Contributions: 4) Data Sharing: 5) Consent for Publication: -
Figure 1. Flowchart of patient selection for the training cohort and external validation cohort.
Figure 2. Flowchart of the prognostic prediction model construction based on a deep learning framework. (A) Image data collection and preprocessing; (B) Model training and prediction workflow.
Figure 3. Prognostic prediction results based on pathological images.
(A) Performance of the prediction model in the training cohort; (B) Performance of the prediction model in the external validation cohort; (C) Kaplan–Meier (KM) survival curves for OS in different risk groups; (D) Kaplan–Meier (KM) survival curves for DFS in different risk groups.
Figure 4. Prediction results of the multimodal model integrating pathological images and clinical features.
(A) Performance of the prediction model in the training cohort; (B) Performance of the prediction model in the external validation cohort.
Figure 5. Visual analysis of pathological image features associated with prognosis in early-stage TNBC.
(A) Attention maps generated by Grad-CAM and corresponding cell segmentation results using HoVer-Net; (B) Comparison of cellular composition in pathological images from patients with different prognostic outcomes; (C) Statistical analysis of differences in cell composition between ROM and nROM groups. ROM, recurrence or metastasis; nROM, non-recurrence or metastasis
Figure 6. Interaction analysis between pathological image texture features and tumor immune cell composition.
(A) Immune cell proportions inferred using the CIBERSORT deconvolution algorithm; (B) Differential analysis of immune cell composition between patients with different prognostic outcomes; (C) Pearson correlation analysis between image texture features and significantly altered immune cell types. ROM, recurrence or metastasis; nROM, non-recurrence or metastasis
Figure 7. Interaction analysis between pathological image texture features and tumor immune cell composition.
(A) Immune cell proportions inferred using the CIBERSORT deconvolution algorithm; (B) Differential analysis of immune cell composition between patients with different prognostic outcomes; (C) Pearson correlation analysis between image texture features and significantly altered immune cell types.
Table 1. Baseline characteristics of enrolled patients
ROM (n = 106) % nROM (n = 212) % P Age (SD) 48.7 (10.3) 51.5 (9.8) 0.019 Menopausal status Pre- 61 57.5 98 46.2 0.057 Post- 45 42.5 114 53.8 TNM stage Stage I 21 19.8 91 42.9 < 0.001 Stage II 50 47.2 102 48.1 Stage III 35 33.0 19 9.0 pT stage < 0.001 T1 37 34.9 114 53.8 T2 64 60.4 96 45.3 T3 3 2.8 2 0.9 T4 2 1.9 0 0 pN stage < 0.001 N0 47 44.3 150 70.8 N1 25 23.6 43 20.3 N2 16 15.1 13 6.1 N3 18 17.0 6 2.8 ALN metastasis number (IQR) 1 (7) 0 (1) < 0.001 Surgery history 0.266 Radical surgery 52 49.1 118 55.7 Breast con- Serving 54 50.9 94 44.3 Tumor grade Grade 1 3 2.8 4 1.9 0.057 Grade 2 35 33.1 44 20.8 Grade 3 63 59.4 149 70.3 Unknown 5 4.7 15 7.0 Adjuvant chemotherapy 0.056 A 2 1.9 3 1.4 T 0 0.0 14 6.7 A + T 63 59.4 129 60.8 T + P 33 31.1 59 27.8 Others 8 7.6 7 3.3 Adjuvant radiation 0.341 Yes 57 53.8 102 48.1 No 49 46.2 110 51.9 Note. ROM, recurrence or metastasis; nROM, non-recurrence or metastasis; pT stage, pathological T stage; pN stage, pathological N stage; ALN, Axillary lymph nodes; A, Anthracyclines; T, Taxanes; P, Platinum drugs  下载: 导出CSV
-
[1] Kim J, Harper A, Mccormack V, et al. Global patterns and trends in breast cancer incidence and mortality across 185 countries. Nat Med, 2025; 31, 1154−62. doi: 10.1038/s41591-025-03502-3 [2] Obidiro O, Battogtokh G, Akala EO. Triple negative breast cancer treatment options and limitations: future outlook. Pharmaceutics, 2023; 15, 1796. doi: 10.3390/pharmaceutics15071796 [3] Leon-Ferre RA, Goetz MP. Advances in systemic therapies for triple negative breast cancer. BMJ, 2023; 381, e071674. doi: 10.1136/bmj-2022-071674 [4] Agostinetto E, Losurdo A, Nader-Marta G, et al. Progress and pitfalls in the use of immunotherapy for patients with triple negative breast cancer. Expert Opin Investig Drugs, 2022; 31, 567−91. doi: 10.1080/13543784.2022.2049232 [5] Yang RN, Li YY, Wang H, et al. Therapeutic progress and challenges for triple negative breast cancer: targeted therapy and immunotherapy. Mol Biomed, 2022; 3, 8. doi: 10.1186/s43556-022-00071-6 [6] Albergaria A, Ricardo S, Milanezi F, et al. Nottingham prognostic index in triple-negative breast cancer: a reliable prognostic tool? BMC Cancer, 2011; 11, 299. [7] Li YX, Xiong J, Hu ZQ, et al. Denoised recurrence label-based deep learning for prediction of postoperative recurrence risk and sorafenib response in HCC. BMC Med, 2025; 23, 162. doi: 10.1186/s12916-025-03977-4 [8] Zhang YB, Yang ZJ, Chen RQ, et al. Histopathology images-based deep learning prediction of prognosis and therapeutic response in small cell lung cancer. npj Digit Med, 2024; 7, 15. doi: 10.1038/s41746-024-01003-0 [9] Fremond S, Andani S, Barkey Wolf J, et al. Interpretable deep learning model to predict the molecular classification of endometrial cancer from haematoxylin and eosin-stained whole-slide images: a combined analysis of the portec randomised trials and clinical cohorts. Lancet Digit Health, 2023; 5, e71−82. doi: 10.1016/S2589-7500(22)00210-2 [10] Saillard C, Schmauch B, Laifa O, et al. Predicting survival after hepatocellular carcinoma resection using deep learning on histological slides. Hepatology, 2020; 72, 2000−13. doi: 10.1002/hep.31207 [11] Nazir, S. , Dickson, D. M. , & Akram, M. U. Survey of explainable artificial intelligence techniques for biomedical imaging with deep neural networks. Comput Biol Med, 2023; 156, 106668. [12] Occhipinti A, Verma S, Doan LMT, et al. Mechanism-aware and multimodal AI: beyond model-agnostic interpretation. Trends Cell Biol, 2024; 34, 85−9. doi: 10.1016/j.tcb.2023.11.002 [13] Zhang YQ, Wang YC, Chen JX, et al. Enhancing short-term algal bloom forecasting through an anti-mimicking hybrid deep learning method. J Environ Manage, 2025; 379, 124832. doi: 10.1016/j.jenvman.2025.124832 [14] Salih A, Galazzo IB, Gkontra P, et al. Explainable artificial intelligence and cardiac imaging: toward more interpretable models. Circ Cardiovasc Imaging, 2023; 16, e014519. doi: 10.1161/circimaging.122.014519 [15] Lekadir K, Frangi AF, Porras AR, et al. Future-AI: international consensus guideline for trustworthy and deployable artificial intelligence in healthcare. BMJ, 2025; 388, e081554. doi: 10.1136/bmj-2024-081554 [16] Chen HM, Gomez C, Huang CM, et al. Explainable medical imaging AI needs human-centered design: guidelines and evidence from a systematic review. npj Digit Med, 2022; 5, 156. doi: 10.1038/s41746-022-00699-2 [17] Zhang HJ, Ogasawara K. Grad-CAM-based explainable artificial intelligence related to medical text processing. Bioengineering, 2023; 10, 1070. doi: 10.3390/bioengineering10091070 [18] Schuettfort VM, Pradere B, Rink M, et al. Pathomics in urology. Curr Opin Urol, 2020; 30, 823−31. doi: 10.1097/MOU.0000000000000813 [19] Lin H, Hua JJ, Gong ZZ, et al. Multimodal radiopathological integration for prognosis and prediction of adjuvant chemotherapy benefit in resectable lung adenocarcinoma: a multicentre study. Cancer Lett, 2025; 616, 217557. doi: 10.1016/j.canlet.2025.217557 [20] Brancato V, Garbino N, Aiello M, et al. Exploratory analysis of radiomics and pathomics in uterine corpus endometrial carcinoma. Sci Rep, 2024; 14, 30727. doi: 10.1038/s41598-024-78987-y [21] Verdicchio M, Brancato V, Cavaliere C, et al. A pathomic approach for tumor-infiltrating lymphocytes classification on breast cancer digital pathology images. Heliyon, 2023; 9, e14371. doi: 10.1016/j.heliyon.2023.e14371 [22] Graham S, Vu QD, Raza SEA, et al. Hover-net: simultaneous segmentation and classification of nuclei in multi-tissue histology images. Med Image Anal, 2019; 58, 101563. doi: 10.1016/j.media.2019.101563 [23] Liu XY, Yuan P, Li RL, et al. Predicting breast cancer recurrence and metastasis risk by integrating color and texture features of histopathological images and machine learning technologies. Comput Biol Med, 2022; 146, 105569. doi: 10.1016/j.compbiomed.2022.105569 [24] Bianchini G, De Angelis C, Licata L, et al. Treatment landscape of triple-negative breast cancer - expanded options, evolving needs. Nat Rev Clin Oncol, 2022; 19, 91−113. doi: 10.1038/s41571-021-00565-2 [25] Swanson K, Wu E, Zhang A, et al. From patterns to patients: advances in clinical machine learning for cancer diagnosis, prognosis, and treatment. Cell, 2023; 186, 1772−91. doi: 10.1016/j.cell.2023.01.035 [26] Wang K, Xu JJ, Zhang T, et al. Tumor-infiltrating lymphocytes in breast cancer predict the response to chemotherapy and survival outcome: a meta-analysis. Oncotarget, 2016; 7, 44288−98. doi: 10.18632/oncotarget.9988 [27] Leon-Ferre RA, Jonas SF, Salgado R, et al. Tumor-infiltrating lymphocytes in triple-negative breast cancer. JAMA, 2024; 331, 1135−44. doi: 10.1001/jama.2024.3056 [28] Mao Y, Qu Q, Zhang YZ, et al. The value of tumor infiltrating lymphocytes (tils) for predicting response to neoadjuvant chemotherapy in breast cancer: a systematic review and meta-analysis. PLoS One, 2014; 9, e115103. doi: 10.1371/journal.pone.0115103 [29] de Melo Gagliato D, Cortes J, Curigliano G, et al. Tumor-infiltrating lymphocytes in breast cancer and implications for clinical practice. Biochim Biophys Acta Rev Cancer, 2017; 1868, 527−37. doi: 10.1016/j.bbcan.2017.10.003 [30] Helal C, Djerroudi L, Ramtohul T, et al. Clinico-pathological factors predicting pathological response in early triple-negative breast cancer. npj Breast Cancer, 2025; 11, 15. doi: 10.1038/s41523-025-00729-8 [31] Gao GX, Wang ZH, Qu X, et al. Prognostic value of tumor-infiltrating lymphocytes in patients with triple-negative breast cancer: a systematic review and meta-analysis. BMC Cancer, 2020; 20, 179. doi: 10.1186/s12885-020-6668-z [32] Deepak KGK, Vempati R, Nagaraju GP, et al. Tumor microenvironment: challenges and opportunities in targeting metastasis of triple negative breast cancer. Pharmacol Res, 2020; 153, 104683. doi: 10.1016/j.phrs.2020.104683 [33] Guo J, Sun X, Pan GW, et al. Pan-cancer immunogenic death analysis identifies key roles of CXCR3 and CCL18 in hepatocellular carcinoma. Genes Dis, 2024; 11, 568−70. doi: 10.1016/j.gendis.2023.04.007 [34] Sui X, Chen CX, Zhou XM, et al. Integrative analysis of bulk and single-cell gene expression profiles to identify tumor-associated macrophage-derived CCL18 as a therapeutic target of esophageal squamous cell carcinoma. J Exp Clin Cancer Res, 2023; 42, 51. doi: 10.1186/s13046-023-02612-5 [35] Hao M, Huang B, Wu RF, et al. The interaction between macrophages and triple-negative breast cancer cells induces ROS-mediated interleukin 1α expression to enhance tumorigenesis and metastasis. Adv Sci, 2023; 10, 2302857. doi: 10.1002/advs.202302857 [36] Zhuang MY, Zhang XQ, Ji J, et al. Exosomal circ-0100519 promotes breast cancer progression via inducing M2 macrophage polarisation by USP7/NRF2 axis. Clin Transl Med, 2024; 14, e1763. doi: 10.1002/ctm2.1763 [37] Franken A, Bila M, Mechels A, et al. CD4+ T cell activation distinguishes response to anti-PD-L1+anti-CTLA4 therapy from anti-PD-L1 monotherapy. Immunity, 2024; 57, 541-58. e7. [38] Yu KH, Zhang C, Berry GJ, et al. Predicting non-small cell lung cancer prognosis by fully automated microscopic pathology image features. Nat Commun, 2016; 7, 12474. doi: 10.1038/ncomms12474 [39] Chen DX, Fu MT, Chi LJ, et al. Prognostic and predictive value of a pathomics signature in gastric cancer. Nat Commun, 2022; 13, 6903. doi: 10.1038/s41467-022-34703-w [40] Zhang J, Wu ZR, Zhao J, et al. Intrahepatic cholangiocarcinoma: MRI texture signature as predictive biomarkers of immunophenotyping and survival. Eur Radiol, 2021; 31, 3661−72. doi: 10.1007/s00330-020-07524-y [41] Xie N, Zhang LC, Fu BM, et al. Effect of different concentrations of GM-CSF on biological behavior of dendritic cells cultured in vitro. World Chin J Digestol, 2016; 24, 2038−44. (In Chinese) doi: 10.11569/wcjd.v24.i13.2038 [42] Ma D, Dai LJ, Wu XR, et al. Spatial determinants of antibody-drug conjugate SHR-A1811 efficacy in neoadjuvant treatment for HER2-positive breast cancer. Cancer Cell, 2025; 43, 1061-75. e7. [43] Liu Y, Liu S, Wang WD, et al. Determination of volume change of LPS-stimulated mouse peritoneal macrophages by flow cytometry. Basic Clin Med, 2014; 34, 767−70. (In Chinese) [44] Carmeliet P. VEGF as a key mediator of angiogenesis in cancer. Oncology, 2005; 69, 4−10. doi: 10.1159/000088478 [45] Sharma P, Chida K, Wu RR, et al. VEGFA gene expression in breast cancer is associated with worse prognosis, but better response to chemotherapy and immunotherapy. World J Oncol, 2025; 16, 120−30. doi: 10.14740/wjon1993 [46] Schoenleber SJ, Kurtz DM, Talwalkar JA, et al. Prognostic role of vascular endothelial growth factor in hepatocellular carcinoma: systematic review and meta-analysis. Br J Cancer, 2009; 100, 1385−92. doi: 10.1038/sj.bjc.6605017 [47] Liu G, Chen XT, Zhang H, et al. Expression analysis of cytokines IL-5, IL-6, IL-8, IL-17 and VEGF in breast cancer patients. Front Oncol, 2022; 12, 1019247. doi: 10.3389/fonc.2022.1019247 [48] Dong F, Ruan SN, Wang JL, et al. M2 macrophage-induced LncRNA PCAT6 facilitates tumorigenesis and angiogenesis of triple-negative breast cancer through modulation of vegfr2. Cell Death Dis, 2020; 11, 728. doi: 10.1038/s41419-020-02926-8 [49] Luan H, Jian LG, Huang YY, et al. Identification of novel therapeutic target and prognostic biomarker in matrix metalloproteinase gene family in pancreatic cancer. Sci Rep, 2023; 13, 17211. doi: 10.1038/s41598-023-44506-8 [50] Liu ZK, Hu SY, Zhao XL, et al. AKAP12 positive fibroblast determines immunosuppressive contexture and immunotherapy response in patients with TNBC by promoting macrophage M2 polarization. J Immunother Cancer, 2024; 12, e009877. doi: 10.1136/jitc-2024-009877 [51] Kondo T. [Common mechanism underlying oligodendrocyte development and oligodendrogliomagenesis]. Brain Nerve, 2009; 61, 741−51. -

 点击查看大图
计量
- 文章访问数: 18
- HTML全文浏览量: 9
- PDF下载量: 0
- 被引次数: 0

 Quick Links