

 下载:
下载:

-
Clean air is fundamental to human health. Approximately 99% of the global population has been exposed to concentrations higher than the World Health Organization’s recommendations. Moreover, adverse health effects have been observed at much lower pollution levels than previously studied. China has experienced periods of severe air pollution over the past few decades. To improve air quality and safeguard public health, the government has implemented several progressively tightened policies. Emission control policies were first proposed in 2005. China then issued the Air Pollution Prevention and Control Action Plan from 2013 to 2017, followed by the Three-Year Action Plan for Winning the Blue Sky Defense Battle from 2018 to 2020. The Air Quality Continuous Improvement Action Plan was launched in 2023. With continuous and deepening efforts over the past two decades, the air quality in China has significantly improved. The integrated population-weighted exposure to PM2.5 decreased by 47% from 2005 (180 μg/m3) to 2015 (96 μg/m3)[1]. Additionally, the annual Air Quality Index showed a decline in its average value from 94 in 2014 to 67 in 2020[2]. However, new epidemiological studies in high-income countries (Canada, the United States, and Europe) with relatively clean air have indicated that even low-level air pollution exposure has several adverse health effects. Children may face greater exposure to air pollution because they have higher respiratory rates and breathe more air per unit of body mass than adults. Heavy metals and other materials attached to air pollution particles enter the alveoli via the respiratory tract and then enter the cells through the bloodstream. These substances may disrupt time-dependent programming during the early developmental stages, potentially increasing children’s disease risk. Children are particularly vulnerable to the adverse effects of air pollution owing to their developing bodies and underdeveloped immunological and respiratory systems. Consequently, children are at an elevated risk of pollution-related diseases because even extremely low-dose exposures to pollutants during critical windows of vulnerability can lead to health issues in childhood and throughout their lifespan.
Dyslipidemia, which refers to an abnormal blood lipid profile, can lead to cardiovascular diseases. It begins in childhood and progresses gradually into adulthood. Previous epidemiological studies have revealed that the prevalence rates of hypercholesterolemia, hypertriglyceridemia, hypoalphalipoproteinemia, and hyperbetalipoproteinemia in Chinese children and adolescents are 5.0%, 4.6%, 15.4%, and 5.9%, respectively[3]. Emerging epidemiological evidence suggests that exposure to air pollution disrupts blood lipid homeostasis, leading to dyslipidemia. Given the high incidence of dyslipidemia in China, identifying potential risk factors and implementing measures to prevent or reduce its incidence are urgently needed. Therefore, it is necessary to evaluate the joint effects of air pollution exposure on dyslipidemia and identify the most hazardous constituents.
The present study examined data from the Environmental Exposure and Children’s Health Study, which was initiated and organized by the National Institute of Environmental Health, Chinese Center for Disease Control and Prevention. Between April and July 2024, we implemented a multistage random sampling strategy to recruit participants from three cities (Tianjin, Fuyang, and Ma’anshan). Six primary schools were selected by computer and stratified by school district and school size. All students from the selected grades were invited to participate. In all, 614 participants were included (Supplementary Figure S1). This work was approved by the Ethical Review Committee of the National Institute of Environmental Health, Chinese Center for Disease Control and Prevention on March 24, 2024. All participants provided written informed consent.
The annual average concentrations of air pollutants (PM2.5, PM10, O3, NO2, and SO2) in 2023 were estimated based on each participant’s geocoded residential address. High-quality and high-resolution air pollutant data were sourced from the China High Air Pollutants database (https://weijing-rs.github.io/product.html). Total cholesterol (TC), triglycerides (TG), high-density lipoprotein cholesterol (HDL-C), and low-density lipoprotein cholesterol (LDL-C) were quantified at the ShangHai DIAN Medical Laboratory using the Hitachi LABOSPECT 008α automatic analyzer (Hitachi High-Tech Corporation, Tokyo, Japan) with a standard procedure. According to the Expert Consensus on the Prevention and Treatment of Dyslipidemia in Children and Adolescents[3], hypercholesterolemia was defined as TC ≥ 5.20 mmol/L; hypertriglyceridemia was defined as TG ≥ 1.76 mmol/L; hypoalphalipoproteinemia was defined as HDL-C ≤ 1.04 mmol/L; and hyperbetalipoproteinemia was defined as LDL-C ≥ 3.38 mmol/L. Dyslipidemia is considered when any single indicator is at an abnormal level.
Logistic regression models were used to fit the association between exposure to air pollutants and dyslipidemia. The joint effect of the five air pollutants was evaluated using a quantile-based g-computation (qg-computation) approach, which is a generalization and extension of the weighted quantile sum (WQS) regression. All the main analyses were adjusted for potential confounding factors according to a directed acyclic graph (Supplementary Figure S2). All analyses were performed with IBM SPSS (version 23.0) and R statistical software (version 3.5.1, package ‘qgcomp’). A two-tailed value of P < 0.05 was considered statistically significant.
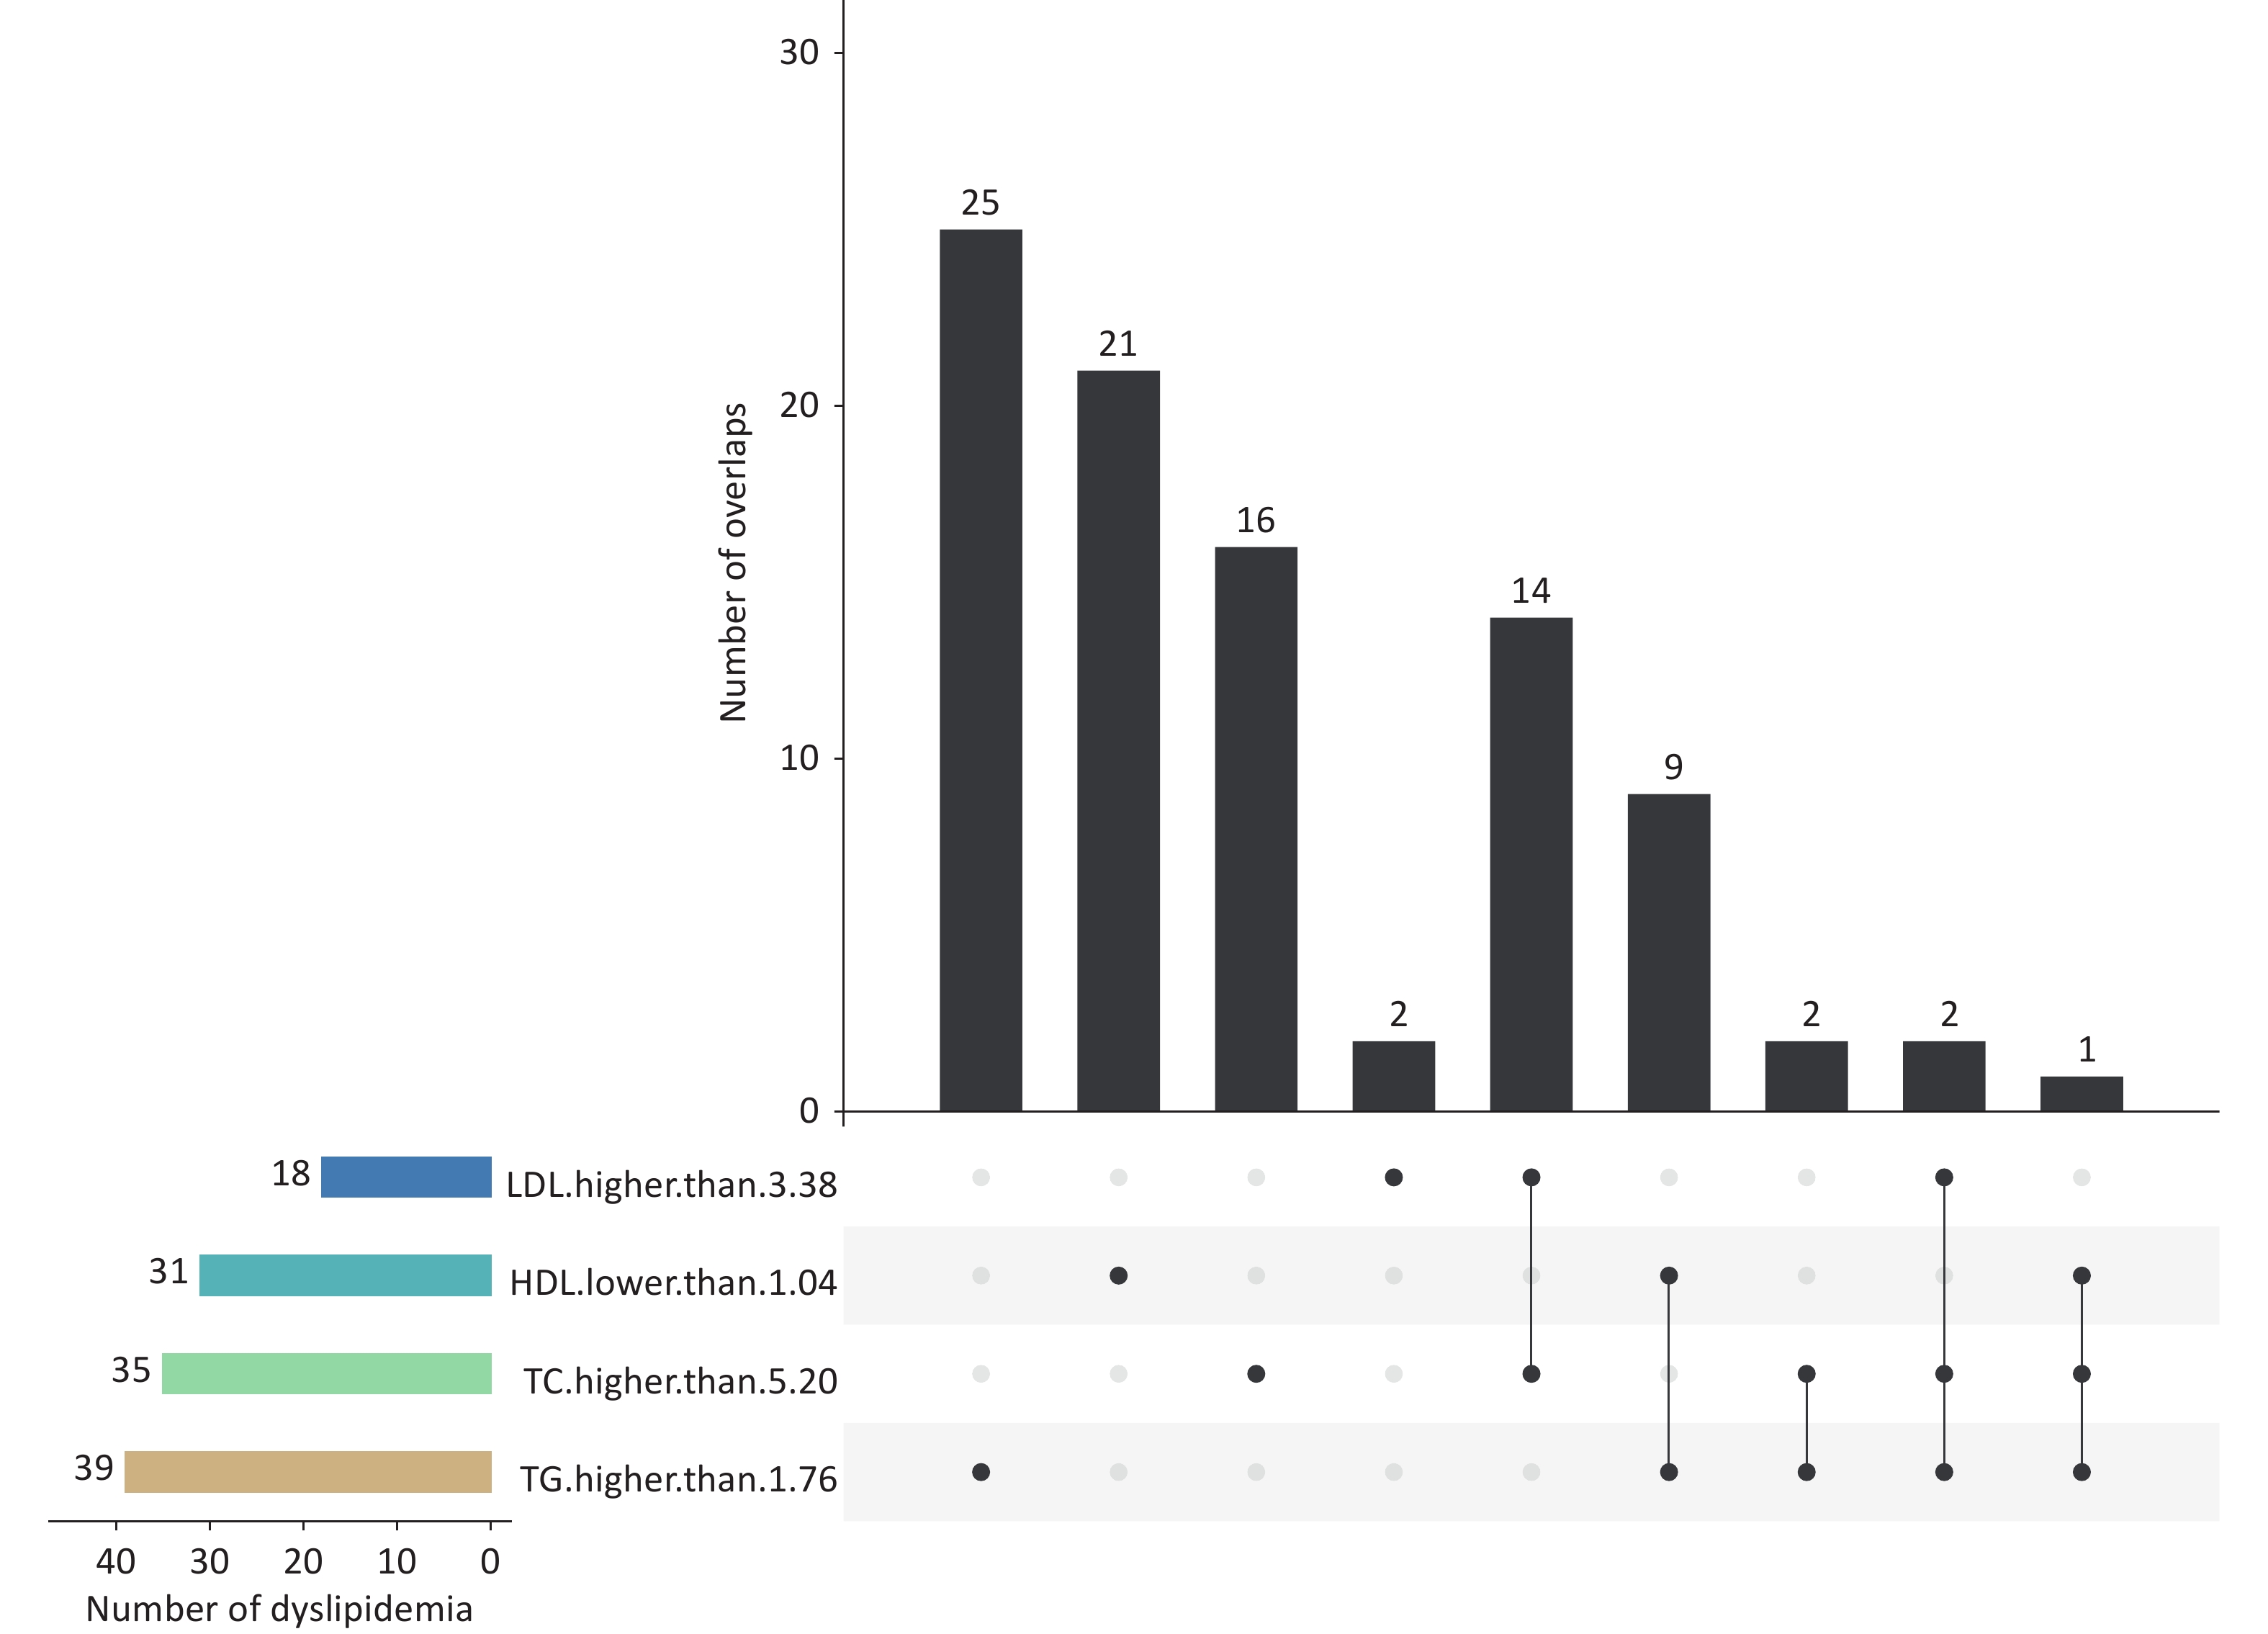
Supplementary Table S1 shows the participants’ demographic characteristics. Their mean (standard deviation) age and body mass index were 11.22 (1.55) years and 19.20 (4.02) kg/m2, respectively. Approximately 14.98% (92/614) children were diagnosed with dyslipidemia; 10.59% (65/614), 4.07% (25/614) and 0.49% (3/614) of the participants had one, two, or three abnormal blood lipid indicators, respectively (Figure 1). The results revealed that 4.56% of these individuals exhibited two or three abnormal blood lipid indicators. The overall prevalence of dyslipidemia is consistent with a previous cross-sectional study in China, which reported a prevalence of 15.4% for hypoalphalipoproteinemia[3]. However, this prevalence was lower than that reported in the US (19.2%)[4]. The incidence rates of dyslipidemia vary across these limited studies, which could be partially explained by the differences in the survey year, genetic background, sample size, inclusion criteria, and dietary structure. These findings suggest that the prevention and control of dyslipidemia in children in China present a crucial challenge. However, the necessity of the preventive screening of children’s lipid levels remains controversial. The National Heart, Lung, and Blood Institute advises universal lipid screening for children aged 9–11 years and adolescents aged 17–21 years, and the American Heart Association recommends selective screening[5]. By contrast, the US Preventive Services Task Force maintains that no direct evidence has been identified for the benefits of pediatric lipid screening[4]. Therefore, a large-scale randomized clinical intervention trial may be required to determine whether widespread screening and treatment for early childhood lipid disorders should be implemented.
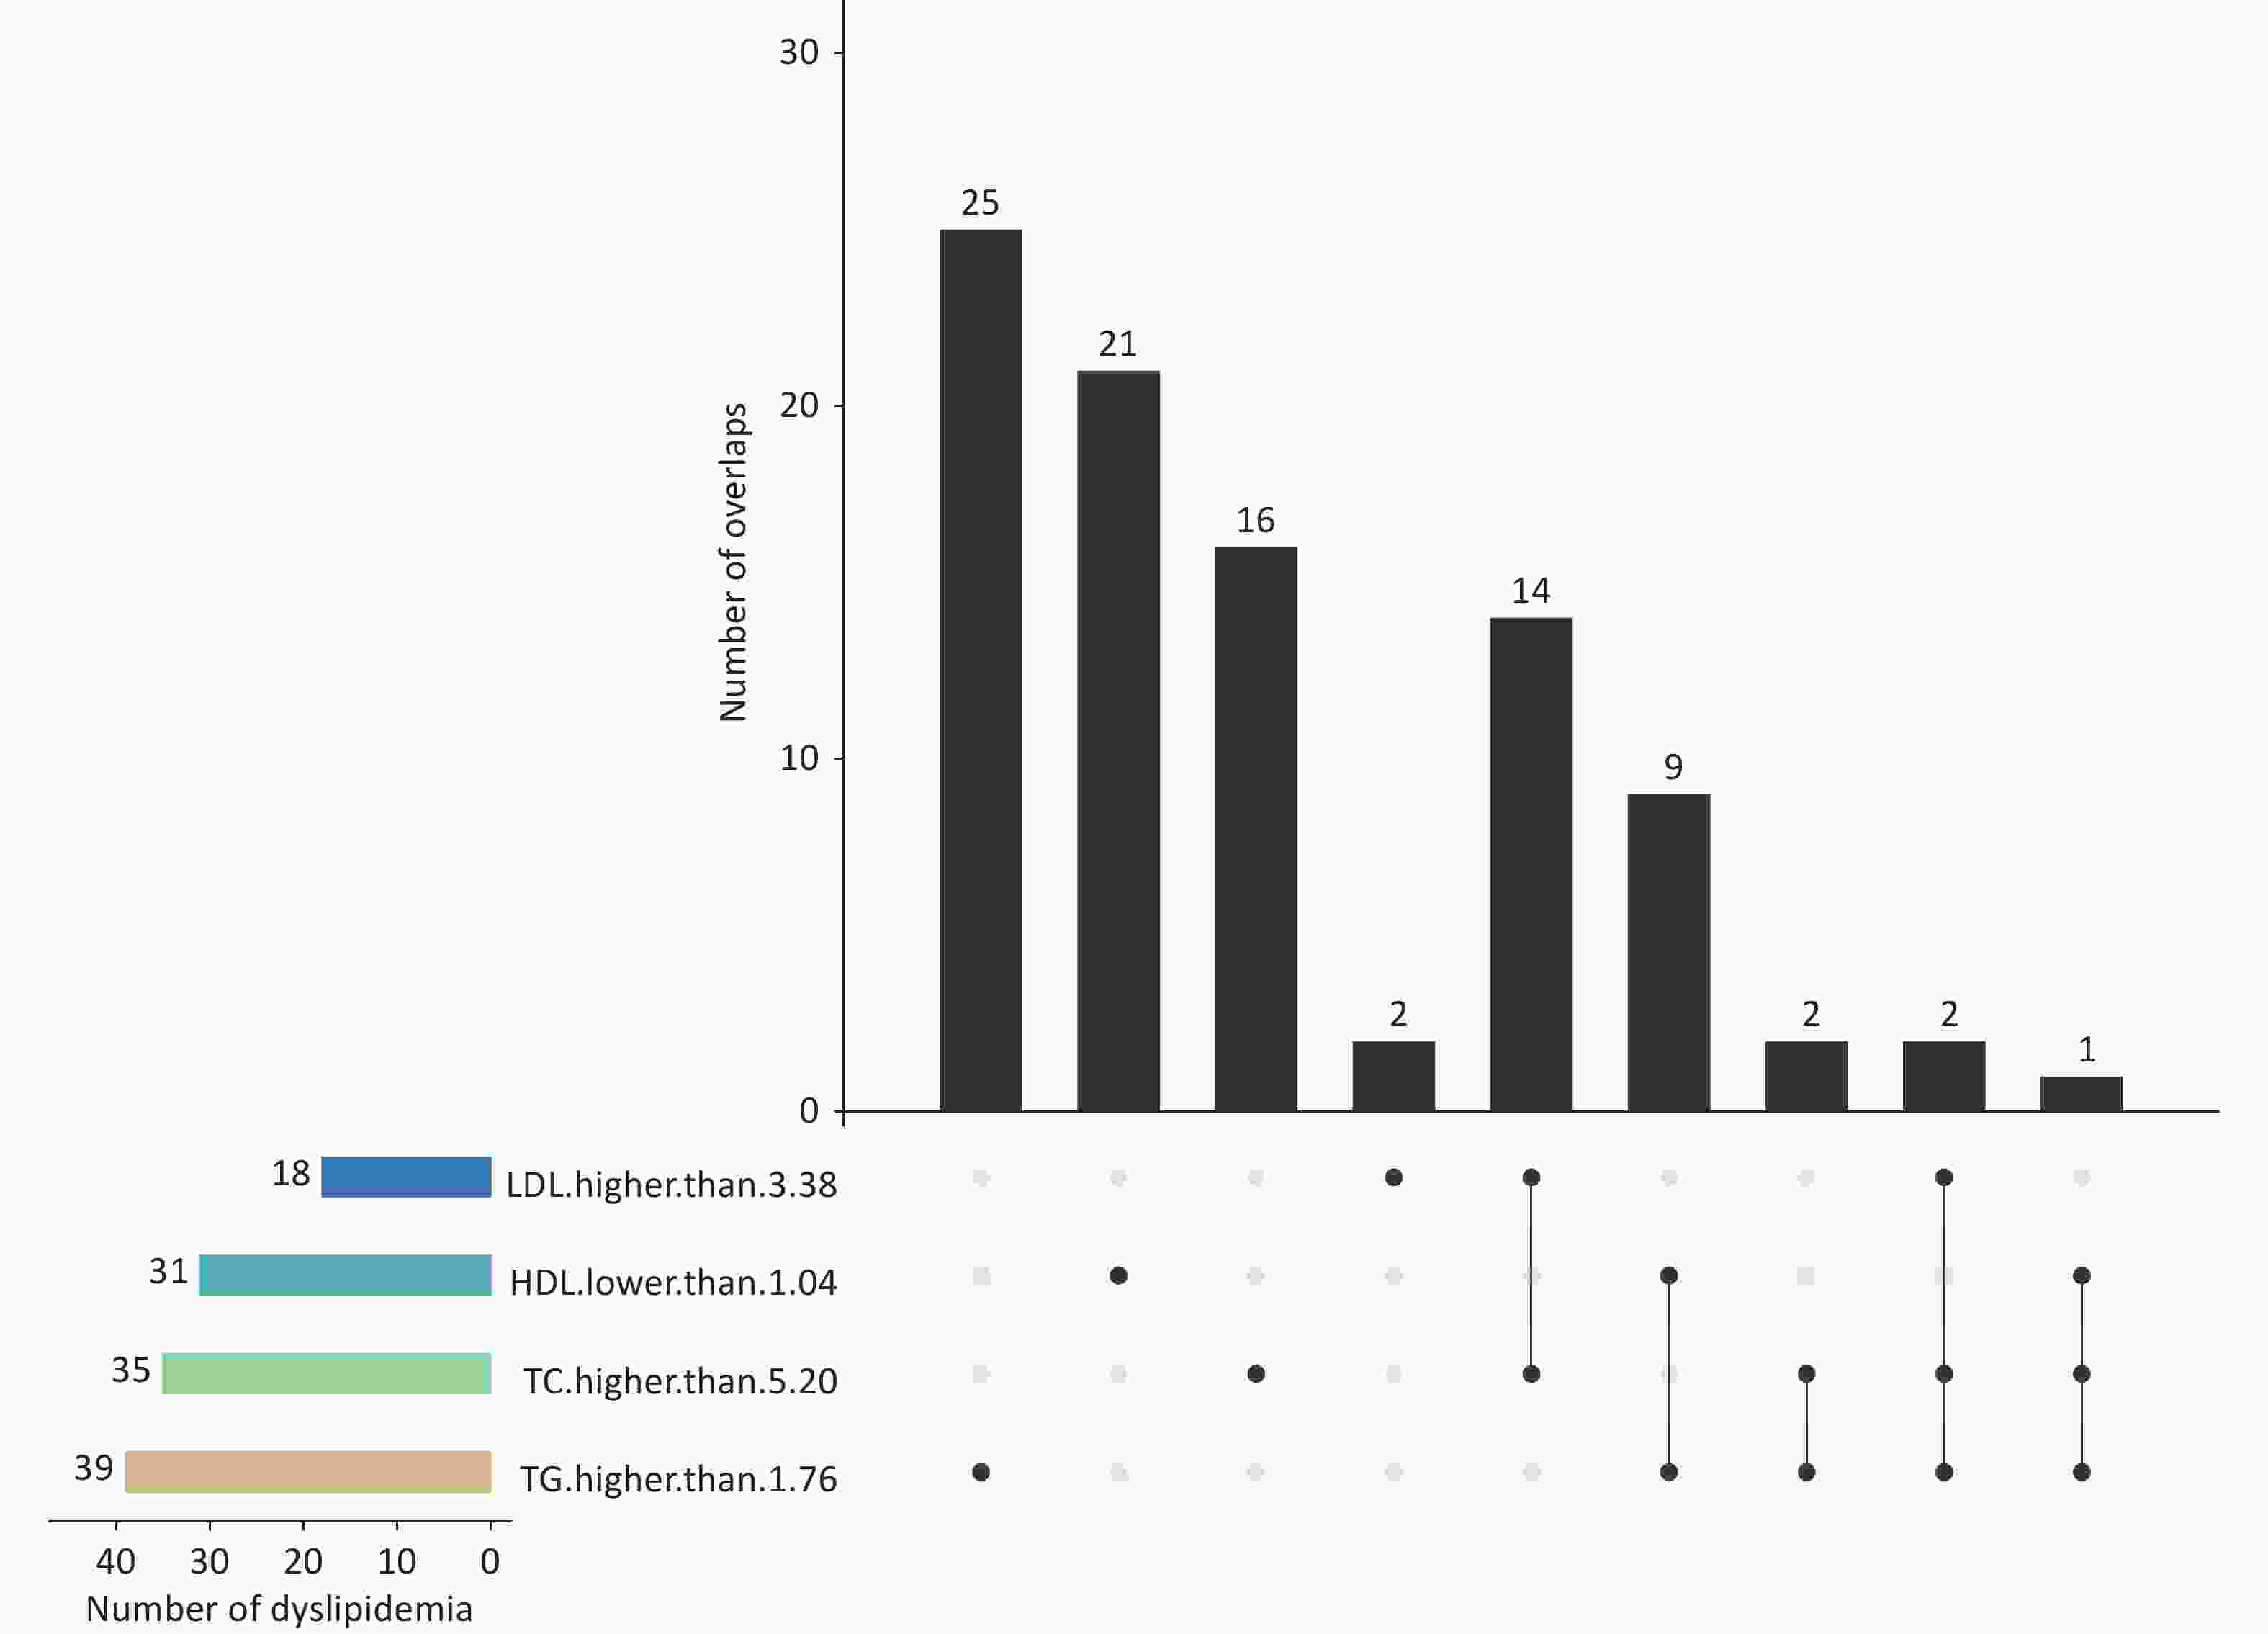
Figure 1. Dyslipidemia distribution illustrated by Venn diagram.
Supplementary Table S2 presents the air pollutant concentrations of 2023. Spearman’s correlation indicated that the air pollutants were highly positively correlated (r = 0.463–0.967). Air pollutant exposure during early life has often been examined in previous studies as a potential contributor to the etiology of dyslipidemia. We found that each 1 μg/m3 increase in PM2.5, PM10, and SO2 was associated with elevated odds of dyslipidemia, with adjusted odds ratios of 1.08 (95% confidence interval [CI]: 1.02 to 1.14), 1.03 (95% CI: 1.00 to 1.05), and 1.31 (95% CI: 1.04 to 1.58), respectively. Similarly, exposure to these pollutants and NO2 was significantly associated with an increased risk of hypoalphalipoproteinemia. Specifically, per 1 μg/m3 increment, PM2.5, PM10, NO2, and SO2 increased the risk of hypoalphalipoproteinemia 1.19-fold (95% CI: 1.07 to 1.30), 1.06-fold (95% CI: 1.02 to 1.10), 1.09-fold (95% CI: 1.04 to 1.14), and 2.07-fold (95% CI: 1.61 to 2.52), respectively. However, no significant associations were observed between these air pollutants and other lipid abnormalities, including hypercholesterolemia, hypertriglyceridemia, and hyperbetalipoproteinemia (Table 1). A panel study in Guangzhou, China, found that exposure to different PM size fractions was associated with decreased HDL-C and ApoA1 levels and increased ApoB[6]. Among middle-aged American women, the annual average PM2.5 levels were associated with lower HDL-C but not with TC, TG, and LDL-C levels[7]. Numerous studies have investigated the relationship between air pollution and blood lipid profiles; however, the findings remain inconsistent. A cross-sectional survey in 2013 with 12,814 children aged 7–18 years showed positive associations of PM1, PM2.5, PM10, and NO2 with TC levels and the risk of hypercholesterolemia; however, no associations were found for air pollution and other blood lipids[3]. This finding is consistent with the results that reported higher PM1 and PM2.5 concentrations with higher odds for hypercholesterolemia, hypoalphalipoproteinemia, and hyperbetalipoproteinemia[8]. The potential sources of this heterogeneity included variations in study design, differential exposure levels to air pollution, population genetic backgrounds, distinct statistical approaches and analytical models, and differences in exposure duration. Furthermore, residual confounding factors, which are an inherent limitation of observational studies, likely contributed to these variations. Additional influential factors may include population demographic and clinical characteristics (particularly age, racial or ethnic composition, and baseline health status), fundamental differences in study design (cross-sectional or longitudinal), unmeasured confounders such as physical activity patterns and indoor environmental exposures, geographical variations in pollutant mixtures, and methodological differences in exposure assessment techniques. Furthermore, variations in pollutant compositions across regions and differences in detection methodologies may play a role.
Table 1. Associations of air pollution exposure in 2023 with dyslipidaemia in primary students
Exposure increment
(μg/m3)Hypercholesterolemia
(n=35)Hypertriglyceridemia
(n=39)Hypoalphalipoproteinemia
(n=31)Hyperbetalipoproteinemia
(n=18)Dyslipidaemia
(n=92)OR (95%CI) OR (95%CI) OR (95%CI) OR (95%CI) OR (95%CI) Crude model PM2.5 (μg/m3) 1.00 1.04 (0.96,1.12) 1.08 (1.00,1.16) 1.14 (1.04,1.24) 1.08 (0.96,1.20) 1.08 (1.03,1.14) PM10 (μg/m3) 1.00 1.02 (0.99,1.05) 1.03 (1.00,1.05) 1.05 (1.01,1.09) 1.03 (0.99,1.08) 1.03 (1.01,1.05) O3 (μg/m3) 1.00 1.26 (0.94,1.59) 1.07 (0.76,1.38) 1.37 (1.02,1.71) 1.35 (0.90,1.80) 1.25 (1.04,1.47) NO2 (μg/m3) 1.00 1.03 (0.99,1.07) 0.97 (0.93,1.01) 1.08 (1.03,1.12) 1.05 (0.99,1.10) 1.02 (1.00,1.05) SO2 (μg/m3) 1.00 1.36 (0.98,1.73) 0.87 (0.48,1.25) 1.93 (1.53,2.34) 1.54 (1.02,2.05) 1.34 (1.09,1.58) Adjusted model PM2.5 (μg/m3) 1.00 1.04 (0.95,1.13) 1.06 (0.97,1.15) 1.19 (1.07,1.30) 1.06 (0.94,1.18) 1.08 (1.02,1.14) PM10 (μg/m3) 1.00 1.02 (0.99,1.05) 1.02 (0.99,1.05) 1.06 (1.02,1.10) 1.03 (0.98,1.07) 1.03 (1.01,1.05) O3 (μg/m3) 1.00 1.28 (0.93,1.63) 0.98 (0.65,1.32) 1.48 (1.10,1.86) 1.31 (0.82,1.80) 1.24 (1.01,1.47) NO2 (μg/m3) 1.00 1.03 (0.99,1.07) 0.96 (0.92,1.01) 1.09 (1.04,1.14) 1.03 (0.97,1.09) 1.03 (1.00,1.06) SO2 (μg/m3) 1.00 1.32 (0.93,1.71) 0.78 (0.36,1.19) 2.07 (1.61,2.52) 1.31 (0.75,1.87) 1.31 (1.04,1.58) Note. The crude Logistic regression model was unadjusted. The Logistic regression model was adjusted for BMI, race, gender, income, only child, physical activity, passive smoking, healthy diet, blood glucose, depressive disorder. O3 is one of the most toxic and ubiquitous air pollutants. Few studies have investigated the association between O3 and blood lipid concentrations, and the results have been heterogeneous. Our study reported that a 1 μg/m3 increase in O3 was associated with an odds ratio of 1.24 (95% CI: 1.01 to 1.47) for developing dyslipidemia. Exposure to O3 increased the risk of hyperbetalipoproteinemia 1.48-fold (95% CI: 1.10 to 1.86) (Table 1). Among Korean soldiers, O3 led to lower HDL-C and higher TC levels only among individuals with a body mass index ≥ 25.0 kg/m2[9]. Another cross-sectional study from the 33 Communities Chinese Health Study reported that higher O3 concentrations were significantly associated with elevated TG and HDL-C levels and reduced TC and LDL-C levels[8]. This study also found that increased O3 exposure was associated with higher odds of hypertriglyceridemia. The specific reasons for the inconsistent results across studies on O3 exposure, blood lipid profiles, and dyslipidemia remain unclear.
This study is one of the first studies to utilize a qg-computation approach to explore the joint effect of air pollutants and dyslipidemia in primary school children. In the present study, each quintile increase in the mixture exposure was associated with an increased hazard ratio (HR) of 1.29 (95% CI: 1.00 to 1.67) in individuals with dyslipidemia in the main model (Table 2). Moreover, the large weight indices of 0.57 and 0.43 for PM10 and SO2, respectively, indicated their positive contributions to the adverse effect of mixture exposure. Conversely, the negative indices of PM2.5, O3, and NO2 suggested that they influenced the overall association by diminishing the contribution of other toxic components (Supplementary Figure S3). Each quintile increase in the mixture exposure was associated with an increased HR of 2.19 (95% CI: 1.39 to 3.43) in individuals with hypoalphalipoproteinemia in the main model. Specifically, SO2, PM2.5 and PM10 showed a positive direction, with weight indices of 0.49, 0.35, and 0.16, respectively. By contrast, O3 and NO2 demonstrated a negative direction, with weight indices of 0.56 and 0.44, respectively (Table 2). The weight indices indicated that PM10 and SO2 positively contributed to the adverse effect of mixture exposure. A multi-city study in southwestern China with 67,015 participants used a WQS regression model to evaluate the joint effects of long-term exposure to PM2.5 constituent exposures (black carbon, sea salt, sulfate, ammonium, nitrate, soil particles, and organic matter) on dyslipidemia[10]. The study found that long-term exposure to ambient PM2.5 constituents was positively associated with an increased risk of dyslipidemia in adults aged 30–79 years, with nitrate being the most crucial constituent (weighted at 0.387). The WQS models identified nitrate, sulfate, soil particles, and organic matter as the constituents with the largest weights. Additionally, the qg-computation estimates showed that nitrate was the constituent with the largest weight and positively contributed to the adverse effect. Although the components of air pollution examined in the abovementioned study differed, the findings on the joint effects of mixture exposure broadly support existing research linking air pollutants with dyslipidemia. They indicate that reducing exposure to air pollutants, especially those with the highest contributions, could help alleviate the disease burden attributed to air pollutant-related dyslipidemia.
This study had several notable strengths. For the first time, we evaluated the joint effects of co-exposure to multiple highly correlated air pollutants on dyslipidemia in children, identifying PM10 and SO2 as the most critical components. The findings provide crucial insights into the health impact on primary school students in a developing country. Moreover, we assessed the joint effects of mixed exposure and compared these results with those from single-pollutant models. The consistent results demonstrated the robustness and reliability of our data. Furthermore, this study reported a high prevalence of dyslipidemia in Chinese children, offering recommendations for screening and intervention strategies to mitigate possible harm in later life.
However, our study had some limitations. First, the cross-sectional design was less effective than longitudinal studies in establishing causal relationships, and further longitudinal investigations are required to confirm these associations. Second, certain potential confounders, such as a family history of dyslipidemia, medication use, temperature, and humidity, were not controlled in this study, which might have influenced the results. Third, the exposure levels were assigned using data based on the participants’ home addresses, omitting the contribution of exposure in the indoor environments at home and school where the participants lived and studied. This approach may underestimate the exposure for some individuals and overestimate the exposure for others. More sophisticated methods for accurate exposure assessment are warranted in future studies.
In conclusion, our findings suggested that high exposure to PM2.5, PM10, O3, NO2, and SO2 was associated with an increased risk of dyslipidemia in Chinese children. Notably, this effect persisted even when the joint effects of mixed air pollutant exposure were considered. Moreover, PM10 and SO2 were the most critical constituents increasing the risk of dyslipidemia. Further studies are required to provide more definitive evidence regarding the joint effects of air pollution and their relationship with dyslipidemia in children.
doi: 10.3967/bes2025.130
Joint Effect of Multiple Air Pollutant Exposure on Dyslipidemia in Chinese Primary School Children
-
Yuan-duo Zhu conceptualized and supervised this work and contributed to the writing, reviewing, and editing. Ying-ying Han visualized the data and revised the manuscript. Dan-dan Li conducted the investigation and performed the statistical analyses. Yan-long Xu conducted the investigation and acquired the baseline data.
The authors declare no competing financial interest.
The study has been approved by the relevant institutional review board and has obtained informed consent from all participants.
注释:1) Authors’ Contributions: 2) Competing Interests: 3) Ethics: -
Table 1. Associations of air pollution exposure in 2023 with dyslipidaemia in primary students
Exposure increment
(μg/m3)Hypercholesterolemia
(n=35)Hypertriglyceridemia
(n=39)Hypoalphalipoproteinemia
(n=31)Hyperbetalipoproteinemia
(n=18)Dyslipidaemia
(n=92)OR (95%CI) OR (95%CI) OR (95%CI) OR (95%CI) OR (95%CI) Crude model PM2.5 (μg/m3) 1.00 1.04 (0.96,1.12) 1.08 (1.00,1.16) 1.14 (1.04,1.24) 1.08 (0.96,1.20) 1.08 (1.03,1.14) PM10 (μg/m3) 1.00 1.02 (0.99,1.05) 1.03 (1.00,1.05) 1.05 (1.01,1.09) 1.03 (0.99,1.08) 1.03 (1.01,1.05) O3 (μg/m3) 1.00 1.26 (0.94,1.59) 1.07 (0.76,1.38) 1.37 (1.02,1.71) 1.35 (0.90,1.80) 1.25 (1.04,1.47) NO2 (μg/m3) 1.00 1.03 (0.99,1.07) 0.97 (0.93,1.01) 1.08 (1.03,1.12) 1.05 (0.99,1.10) 1.02 (1.00,1.05) SO2 (μg/m3) 1.00 1.36 (0.98,1.73) 0.87 (0.48,1.25) 1.93 (1.53,2.34) 1.54 (1.02,2.05) 1.34 (1.09,1.58) Adjusted model PM2.5 (μg/m3) 1.00 1.04 (0.95,1.13) 1.06 (0.97,1.15) 1.19 (1.07,1.30) 1.06 (0.94,1.18) 1.08 (1.02,1.14) PM10 (μg/m3) 1.00 1.02 (0.99,1.05) 1.02 (0.99,1.05) 1.06 (1.02,1.10) 1.03 (0.98,1.07) 1.03 (1.01,1.05) O3 (μg/m3) 1.00 1.28 (0.93,1.63) 0.98 (0.65,1.32) 1.48 (1.10,1.86) 1.31 (0.82,1.80) 1.24 (1.01,1.47) NO2 (μg/m3) 1.00 1.03 (0.99,1.07) 0.96 (0.92,1.01) 1.09 (1.04,1.14) 1.03 (0.97,1.09) 1.03 (1.00,1.06) SO2 (μg/m3) 1.00 1.32 (0.93,1.71) 0.78 (0.36,1.19) 2.07 (1.61,2.52) 1.31 (0.75,1.87) 1.31 (1.04,1.58) Note. The crude Logistic regression model was unadjusted. The Logistic regression model was adjusted for BMI, race, gender, income, only child, physical activity, passive smoking, healthy diet, blood glucose, depressive disorder.  下载: 导出CSV
-
[1] Zhao B, Zheng HT, Wang SX, et al. Change in household fuels dominates the decrease in PM2.5 exposure and premature mortality in China in 2005-2015. Proc Natl Acad Sci USA, 2018; 115, 12401−6. doi: 10.1073/pnas.1812955115 [2] Cheng JH, Li FY, Liu LL, et al. Spatiotemporal variation air quality index characteristics in China's major cities during 2014-2020. Water Air Soil Pollut, 2023; 234, 292. doi: 10.1007/s11270-023-06304-w [3] Gui ZH, Yang BY, Zou ZY, et al. Exposure to ambient air pollution and blood lipids in children and adolescents: a national population based study in China. Environ Pollut, 2020; 266, 115422. doi: 10.1016/j.envpol.2020.115422 [4] US Preventive Services Task Force. Screening for lipid disorders in children and adolescents: US preventive services task force recommendation statement. JAMA, 2023; 330, 253−60. doi: 10.1001/jama.2023.11330 [5] Vinci SR, Rifas-Shiman SL, Cheng JK, et al. Cholesterol testing among children and adolescents during health visits. JAMA, 2014; 311, 1804−7. doi: 10.1001/jama.2014.2410 [6] He ZZ, Guo PY, Xu SL, et al. Associations of particulate matter sizes and chemical constituents with blood lipids: a panel study in Guangzhou, China. Environ Sci Technol, 2021; 55, 5065−75. doi: 10.1021/acs.est.0c06974 [7] Wu XM, Broadwin R, Basu R, et al. Associations between fine particulate matter and changes in lipids/lipoproteins among midlife women. Sci Total Environ, 2019; 654, 1179−86. doi: 10.1016/j.scitotenv.2018.11.149 [8] Yang BY, Bloom MS, Markevych I, et al. Exposure to ambient air pollution and blood lipids in adults: the 33 communities Chinese health study. Environ Int, 2018; 119, 485−92. doi: 10.1016/j.envint.2018.07.016 [9] Kim KN, Ha B, Seog W, et al. Long-term exposure to air pollution and the blood lipid levels of healthy young men. Environ Int, 2022; 161, 107119. doi: 10.1016/j.envint.2022.107119 [10] Pan XM, Hong F, Li SC, et al. Long-term exposure to ambient PM2.5 constituents is associated with dyslipidemia in Chinese adults. Ecotoxicol Environ Saf, 2023; 263, 115384. doi: 10.1016/j.ecoenv.2023.115384 -

 点击查看大图
图(1) / 表ll (1)
计量
- 文章访问数: 16
- HTML全文浏览量: 6
- PDF下载量: 0
- 被引次数: 0

 Quick Links