

 下载:
下载:


-
The global burden of overweight and obesity has escalated markedly in recent decades, emerging as a major public health challenge worldwide[1]. Although body mass index (BMI) remains widely used for obesity classification, its limitations in accurately assessing adiposity and associated health risks are increasingly recognized[2]. Waist circumference (WC) has emerged as a superior anthropometric measure, providing a more precise estimation of abdominal adiposity and a stronger predictor of obesity-related morbidity and mortality[3]. Numerous population-based studies have demonstrated that within each BMI category, individuals with higher WC have significantly greater risks of morbidity and mortality[4]. Central obesity, in particular, is strongly associated with type 2 diabetes[5,6], metabolic syndrome[7], cardiovascular disease[8,9], and all-cause mortality[10]. Recent evidence has also highlighted the predictive ability of WC-related indices for cardiometabolic risk factor clustering, particularly among Chinese children and adolescents[11].
The global prevalence of central obesity has shown alarming growth, rising from 31.3% (1985–1999) to 48.3% (2010–2014) among individuals aged ≥ 15 years, with current estimates at 41.5%[12]. In China, data from the China Nutrition and Health Surveillance[13] and the China Health and Nutrition Survey (CHNS) revealed a marked increase in central obesity among young adults (aged 18–35 years) between 1993 and 2018. During this period, prevalence increased from 4.40% to 35.49% in males and from 6.33% to 18.31% in females[14].
Overweight and obesity during childhood and adolescence often persist into adulthood and are strongly associated with increased risks of adult-onset chronic diseases, including cardiovascular disease, type 2 diabetes, hypertension, dyslipidemia, and certain cancers[15-17], as well as environmental chemical exposures such as phthalates and bisphenols[18]. Children and adolescents with obesity are approximately five times more likely to have obesity in adulthood. Longitudinal evidence indicates that 55% of children with obesity remain obese during adolescence, 80% of adolescents with obesity remain obese in early adulthood, and 70% remain obese after age 30[19]. These findings underscore childhood and adolescence as critical periods for the early prevention of chronic metabolic diseases. Existing BMI-based studies suggested that young adulthood is the most sensitive period for obesity onset, whereas childhood and adolescence represent the most favorable periods for obesity resolution[20]. However, longitudinal studies examining the long-term impact of central overweight and obesity during childhood and adolescence remain limited, and life-course patterns of onset, persistence, and potential reversal of central obesity have yet not been fully elucidated.
Using a life-course epidemiologic framework[21], this study leverages data from the CHNS to examine dynamic changes in WC status across developmental stages and identify critical periods for the emergence, persistence, and reversal of central overweight and obesity.
-
The CHNS is an ongoing, large-scale longitudinal cohort study. Since its initiation in 1989, CHNS has conducted 12 waves of data collection in 1991, 1993, 1997, 2000, 2004, 2006, 2009, 2011, 2015, 2018, and 2022, across 16 provinces in China. The survey covers regions with diverse economic development levels, public resources, geographic characteristics, and health profiles. Detailed information regarding the cohort design and methodology has been published elsewhere[22] (https://chns.cpc.unc.edu/). For this analysis, participants aged 6–17 years at baseline who had complete data on age, height, and WC and who participated in at least one follow-up survey between 1993 and 2022 were included. Supplementary Figure S1 illustrates the flowchart of the participant selection process. Of the eligible individuals, 2,440 participants (1,311 boys and 1,129 girls) met the inclusion criteria and were included in the final analysis. The median follow-up duration was 9 years, with a median of two visits per participant; the maximum follow-up period extended to 29 years. Owinig to increased attrition and reduced sample sizes in later waves, some analyses were limited to the first 20 years of follow-up or to the maximum follow-up duration available for each sub-cohort.
The survey protocols, instruments, and informed consent procedures were approved by the Institutional Review Boards of the University of North Carolina at Chapel Hill and the National Institute for Nutrition and Health, Chinese Center for Disease Control and Prevention. Written informed consent was obtained from all participants or their guardians.
-
All investigators received standardized training before data collection. In each survey wave, WC and height were measured by trained personnel following standardized protocols and using calibrated equipment to ensure consistency across rounds. WC was assessed using a non-elastic measuring tape at the midpoint between the lowest rib and the iliac crest, with participants standing upright and arms relaxed at their sides. Measurements were taken directly on the skin or over light clothing after removal of bulky garments. Height was measured without shoes using a portable stadiometer with an accuracy of 0.1 cm. Given the long-term follow-up, WC status was treated as a time-varying categorical variable. For children and adolescents aged 6–18 years, central overweight and obesity were defined as WC at or above the 75th and 90th sex- and age-specific percentile cutoffs, respectively, based on nationally representative reference data[23,24]. For adults older than 18 years, central overweight was defined as WC ≥ 85 cm and ≥ 80 cm and central obesity as WC ≥ 90 cm in males and ≥ 85 cm in females, respectively[25].
-
To examine transitions in WC status across life stages, participants were categorized into three subcohorts according to baseline age: 6–11 (children), 12–14 (young adolescents), and 15–17 (older adolescents) years[26]. A generalized linear mixed-effects model (GLMM) with a logit link function was applied to estimate age-specific proportions of WC categories and the probabilities of maintaining or transitioning among normal WC, central overweight, and central obesity during follow-up. The models accounted for repeated and unequally spaced measurements and allowed for individual-level variations in intercepts and time trends. In the GLMM framework, fixed effects represent population-level trends across the life course through regression coefficients of observed variables, whereas random effects capture within- and between-individual variabilities over time through variance components[27]. The models were adjusted for fixed-effects covariates, including sex, urban/rural residence, and household income. Follow-up duration was included as a fixed effect, and subject-specific intercepts were specified as random effects to capture intra-individual correlation across repeated measurements. Model construction was guided by the statistical significance (P < 0.05) of polynomial terms for the independent variable (follow-up duration or age), enabling the identification of nonlinear trends. Data management and preprocessing were conducted using SAS version 9.4, and all statistical analyses were performed using R version 4.4.2.
No patients or members of the public were involved in the design, conduct, reporting, or dissemination plans of this research. The study analyzed secondary data from the CHNS, a population-based longitudinal cohort study.
-
Participants were enrolled at their respective baselines across nine survey waves conducted between 1993 and 2018. The largest baseline cohorts were established in the early 1990s and after 2011 (Supplementary Table S1). A total of 2,440 participants provided valid baseline WC measurements and were followed up for up to 29 years (through 2022). Although baseline age and household income differed significantly between the analytical and excluded samples, WC values at most age stages showed no significant differences, suggesting that attrition was unlikely to introduce substantial bias to our main findings (Supplementary Table S2).
The study population comprised 2,440 participants stratified by developmental stage into children (6–11 years, n = 1,275), young adolescents (12–14 years, n = 706), and older adolescents (15–17 years, n = 459). Boys consistently exhibited higher mean baseline WC values across all age groups (59.4–70.0 cm) than girls (56.7–67.6 cm). Despite having lower mean WC values, girls demonstrated a slightly higher prevalence of central overweight and obesity than boys within the corresponding age groups. The proportion of participants with normal WC was similar across all groups, ranging from 72.8% to 77.8%. The median follow-up duration varied by age group and sex, ranging from 7 to 15 years (Table 1).
Table 1. Characteristics of the study participants
Total 6–17 years Baseline age group (years) 6–11 12–14 15–17 N 2,440 1,275 706 459 Baseline WC (cm), mean ± SD 62.3 (10.0) 58.1 (9.1) 65.7 (8.6) 69.0 (8.5) Baseline WC status, N (%) Normal 1,838 (75.32) 955 (74.90) 538 (76.21) 345 (75.16) Central overweight 331 (13.57) 183 (14.35) 87 (12.32) 61 (13.29) Central obesity 271 (11.11) 137 (10.75) 81 (11.47) 53 (11.55) Follow-up length (year), median (IQR: P25, P75) 7 (4, 16) 7 (4, 13) 9 (4, 18) 11 (4, 21) Boys N 1,311 654 383 274 Baseline WC (cm), mean ± SD 63.5 (10.0) 59.4 (8.9) 66.0 (9.2) 70.0 (8.8) Baseline WC status, N (%) Normal 1,011 (77.12) 503 (76.91) 298 (77.81) 210 (76.64) Central overweight 160 (12.20) 82 (12.54) 44 (11.49) 34 (12.41) Central obesity 140 (10.68) 69 (10.55) 41 (10.70) 30 (10.95) Follow-up length (year), median (IQR: P25, P75) 11 (5, 18) 7 (4, 14) 13 (6, 21) 15 (7, 22) Girls N 1,129 621 323 185 Baseline WC (cm), mean ± SD 61.0 (9.8) 56.7 (9.1) 65.3 (7.9) 67.6 (7.7) Baseline WC status, N (%) Normal 827 (73.25) 452 (72.79) 240 (74.31) 135 (72.98) Central overweight 171 (15.15) 101 (16.26) 43 (13.31) 27 (14.59) Central obesity 131 (11.60) 68 (10.95) 40 (12.38) 23 (12.43) Follow-up length (year), median (IQR: P25, P75) 7 (4, 11) 7 (3, 12) 7 (4, 11) 7 (3, 12) Note. IQR, interquartile range; SD, standard deviation; WC, waist circumference. Percentages in this table are presented to two decimal places. Minor discrepancies due to rounding were adjusted by ± 0.01% in the category with the largest proportion to ensure that the total equals 100.00%. All values were calculated based on the original exact data, and these adjustments do not affect the substantive meaning or interpretation of the results. -
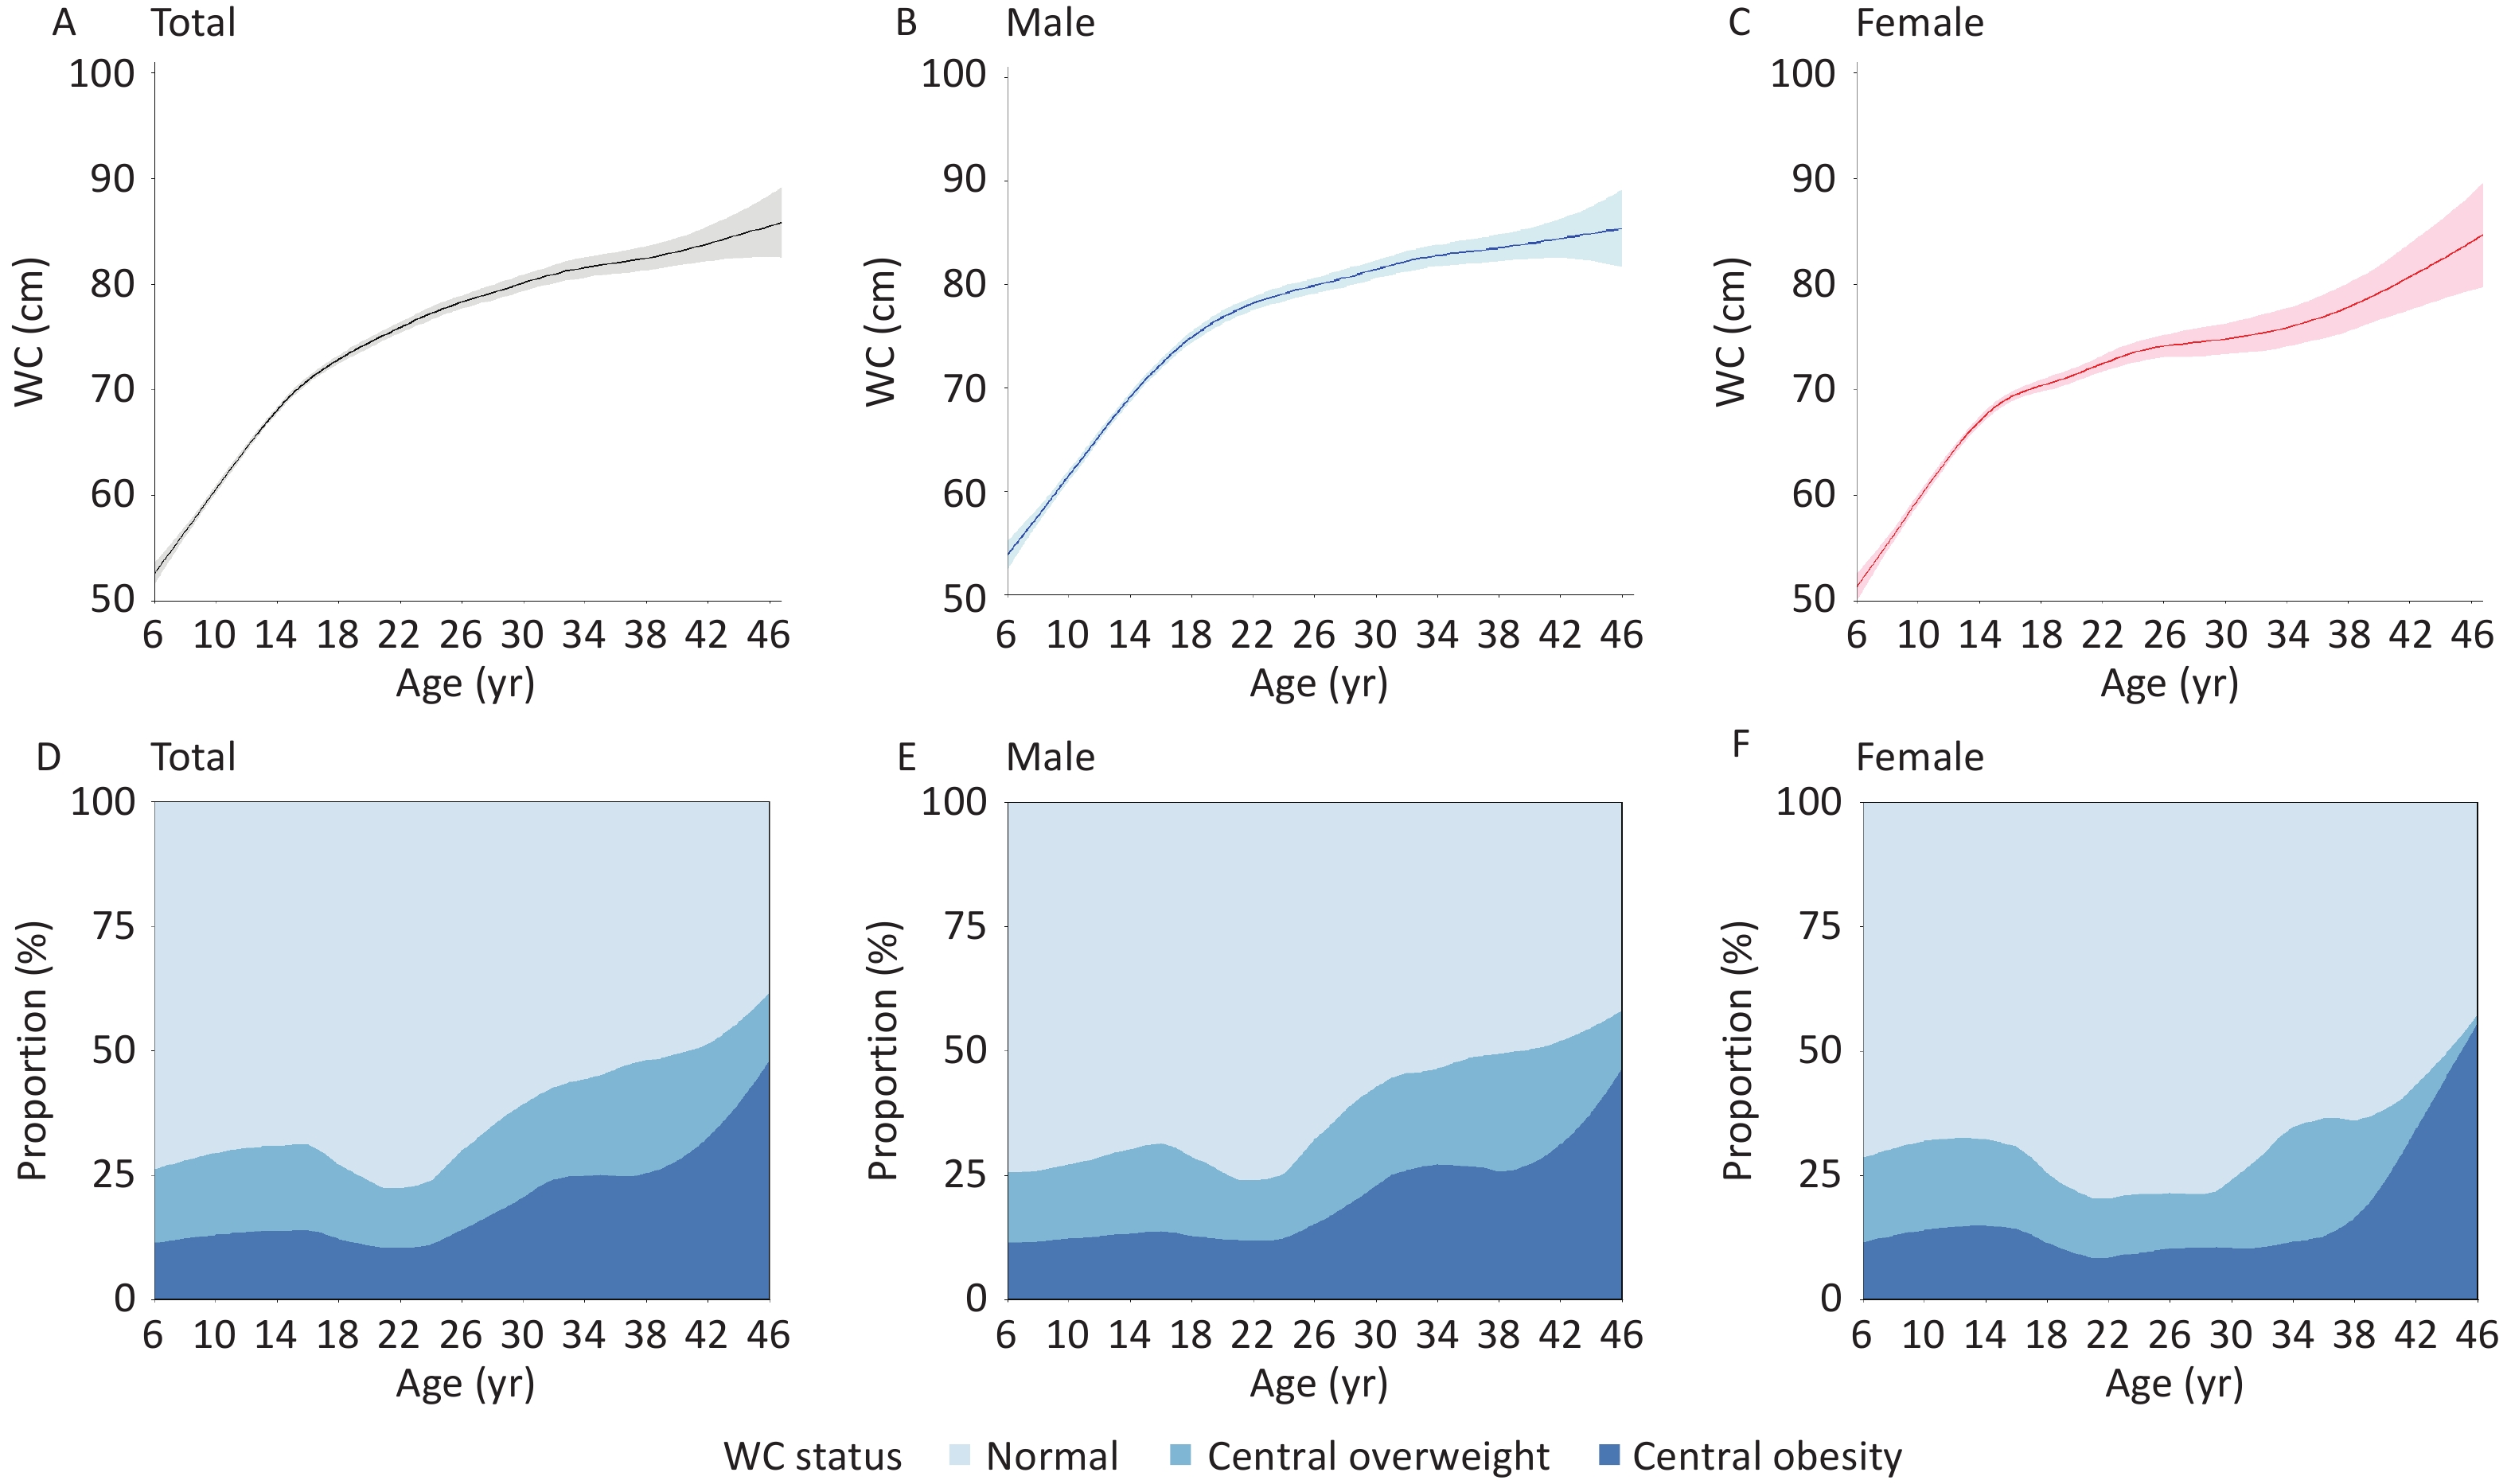
Both WC levels and the prevalence of central overweight and obesity demonstrated dynamic life-course patterns. The mean WC showed an increasing trend from age 6. Among males, the increase decelerated after age 20 (76.76 ± 6.87 cm), whereas in females, WC rose gradually between ages 20 (74.54 ± 6.75 cm) and 35, followed by a more pronounced acceleration beyond age 35 (81.82 ± 8.00 cm).
The prevalence of central overweight and obesity began to decline at approximately 16 years of age (31.2%), reached its lowest point at approximately 22 years of age (22.4%), and subsequently showed a marked upward trend. Among females, the prevalence remained relatively stable between ages 18 (25.5%) and 30 (24.2%) but increased sharply thereafter. Notably, after age 38, a substantial proportion of females with central overweight transitioned to central obesity, leading to a steep rise in central obesity prevalence from 16.4% at age 38 to 55.6% at age 46 (Figure 1).
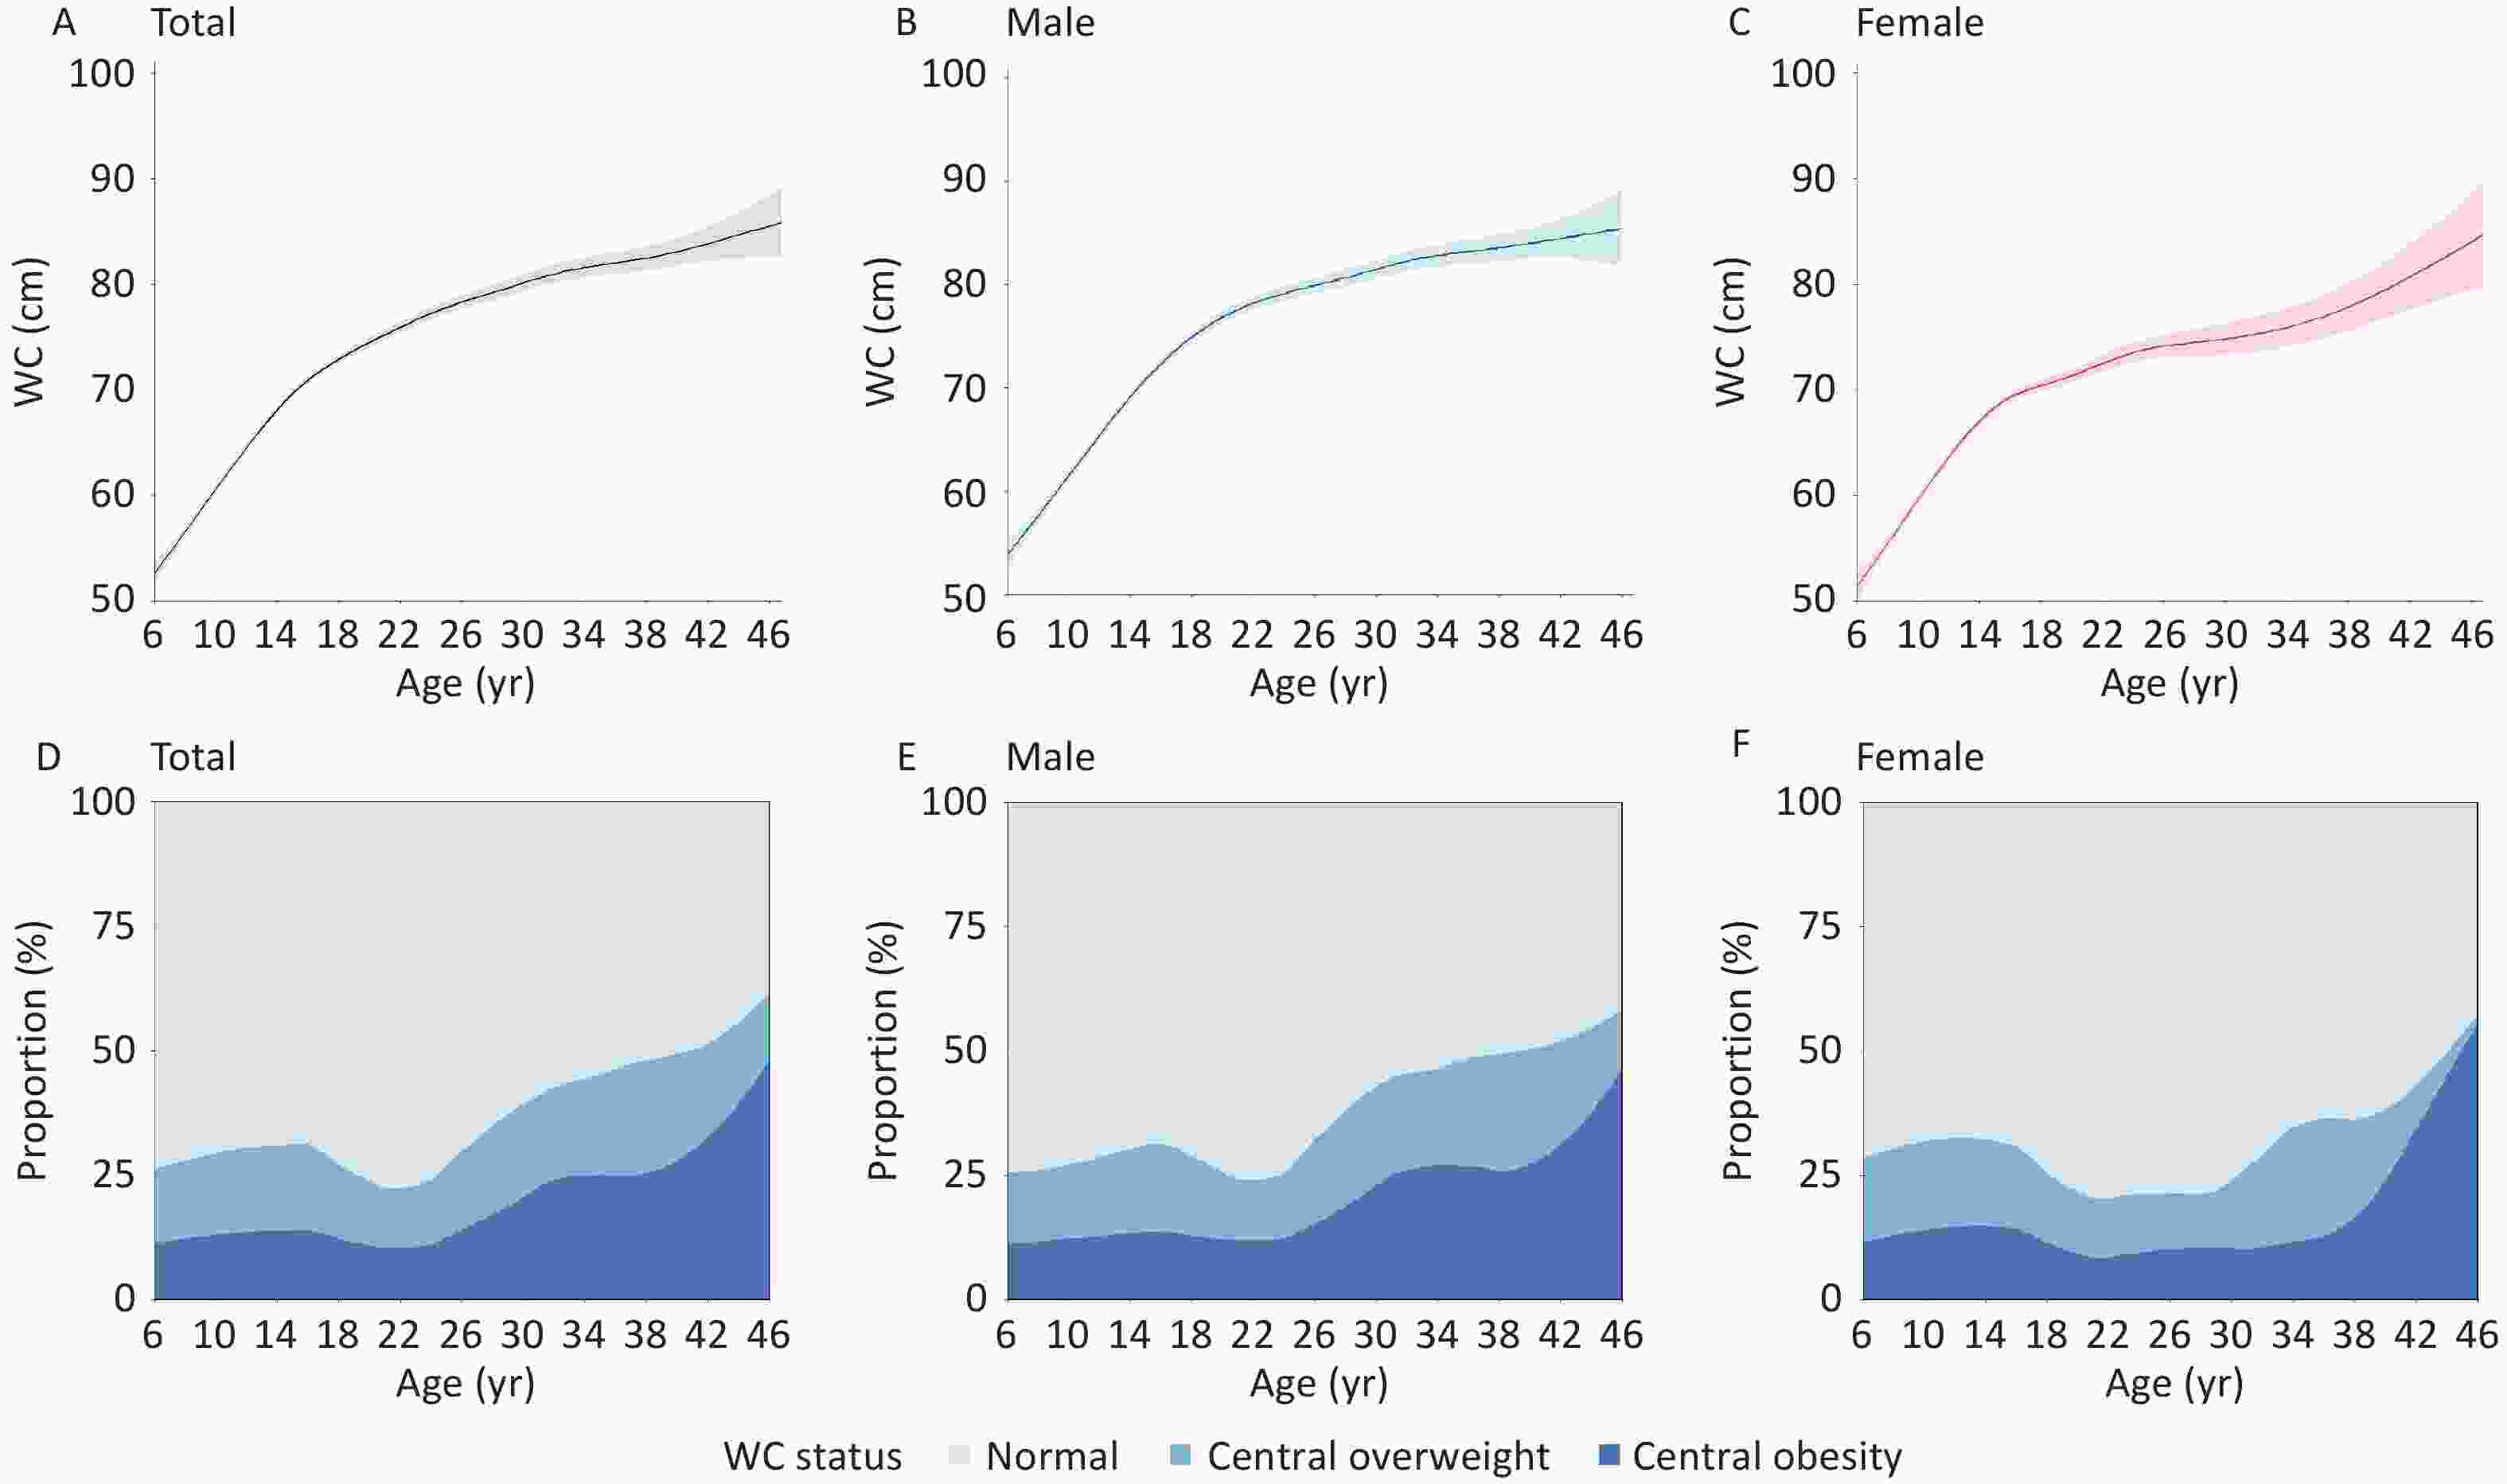
Figure 1. Changes in waist circumference (WC) and central adiposity across the life course (A–F). The modeled curves were based on 2,440 participants aged 6–17 years at baseline who were followed for up to 29 years (through 2022), extending into their 40 s.
-
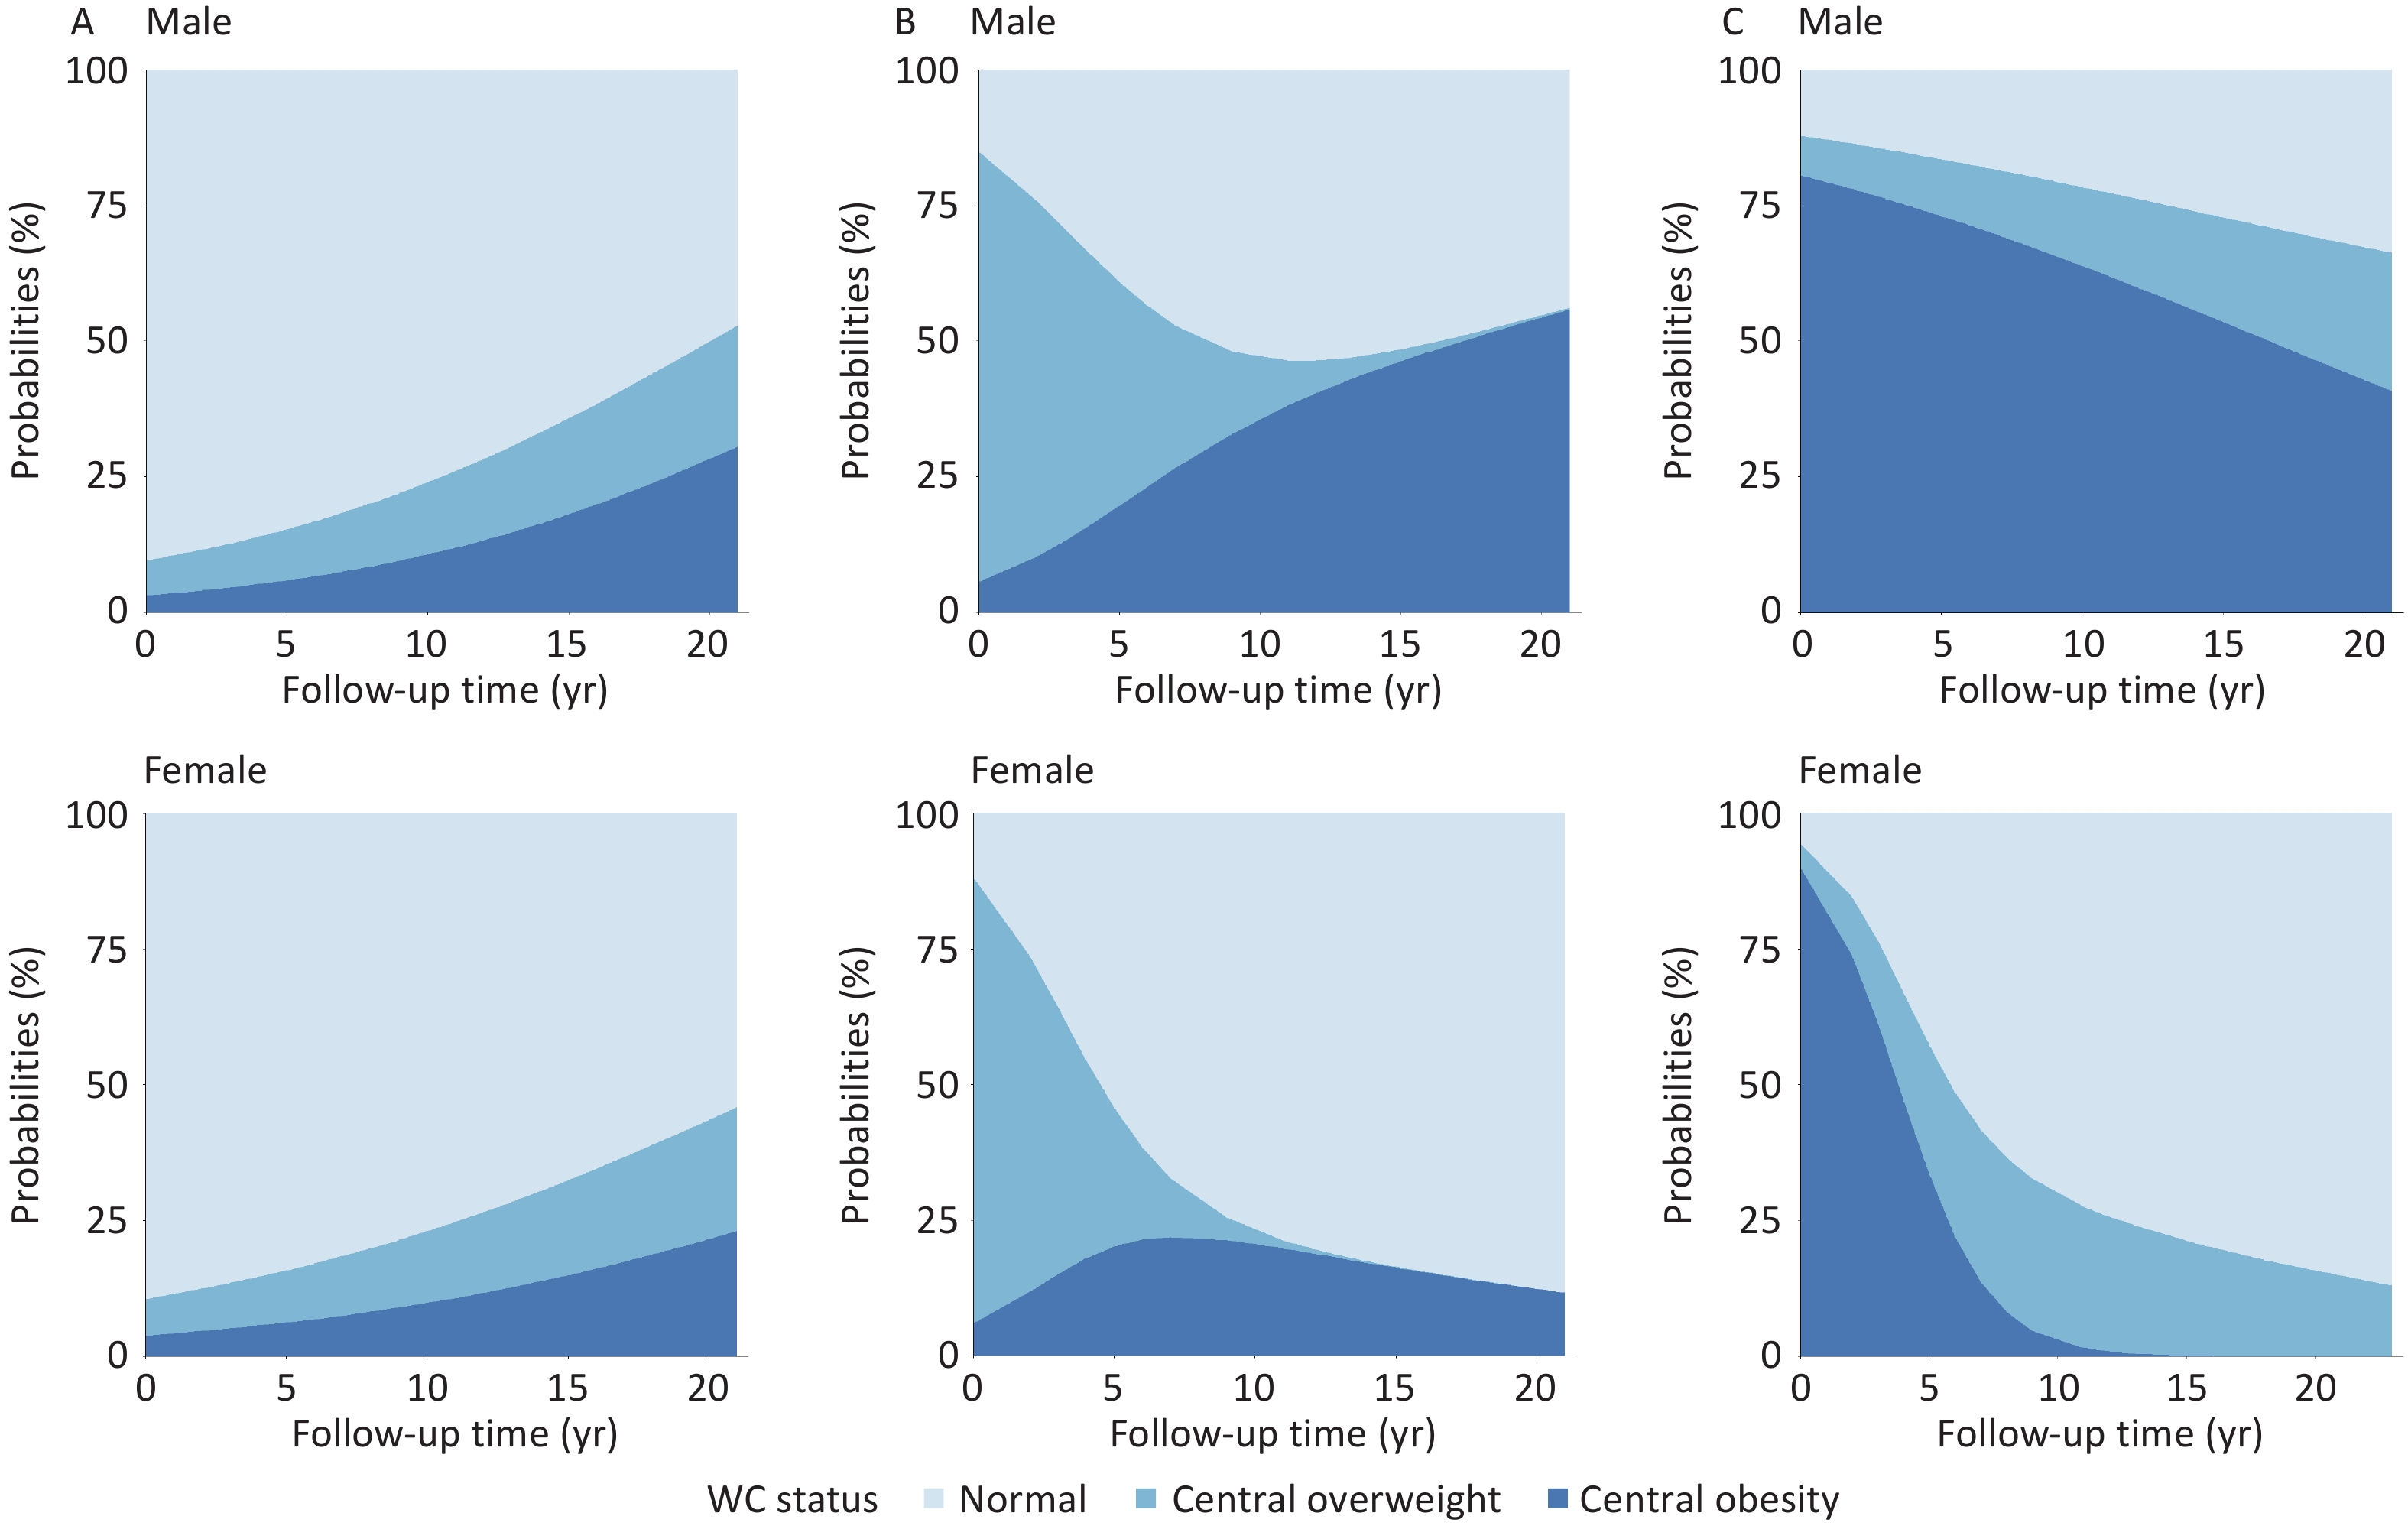
Among children and adolescents with normal WC at baseline, the probabilities of transitioning to central overweight and obesity increased with age, with obesity becoming more prevalent than overweight over time. Boys demonstrated higher combined probabilities of central overweight and obesity than girls. For participants with central overweight or obesity at baseline, reversion to normal WC was more likely during the first 10 years of follow-up, after which WC status tended to stabilize. Notably, boys were more likely than girls to transition from normal WC or central overweight to central obesity, whereas girls were more likely to revert from central overweight or obesity to normal WC (Figure 2).
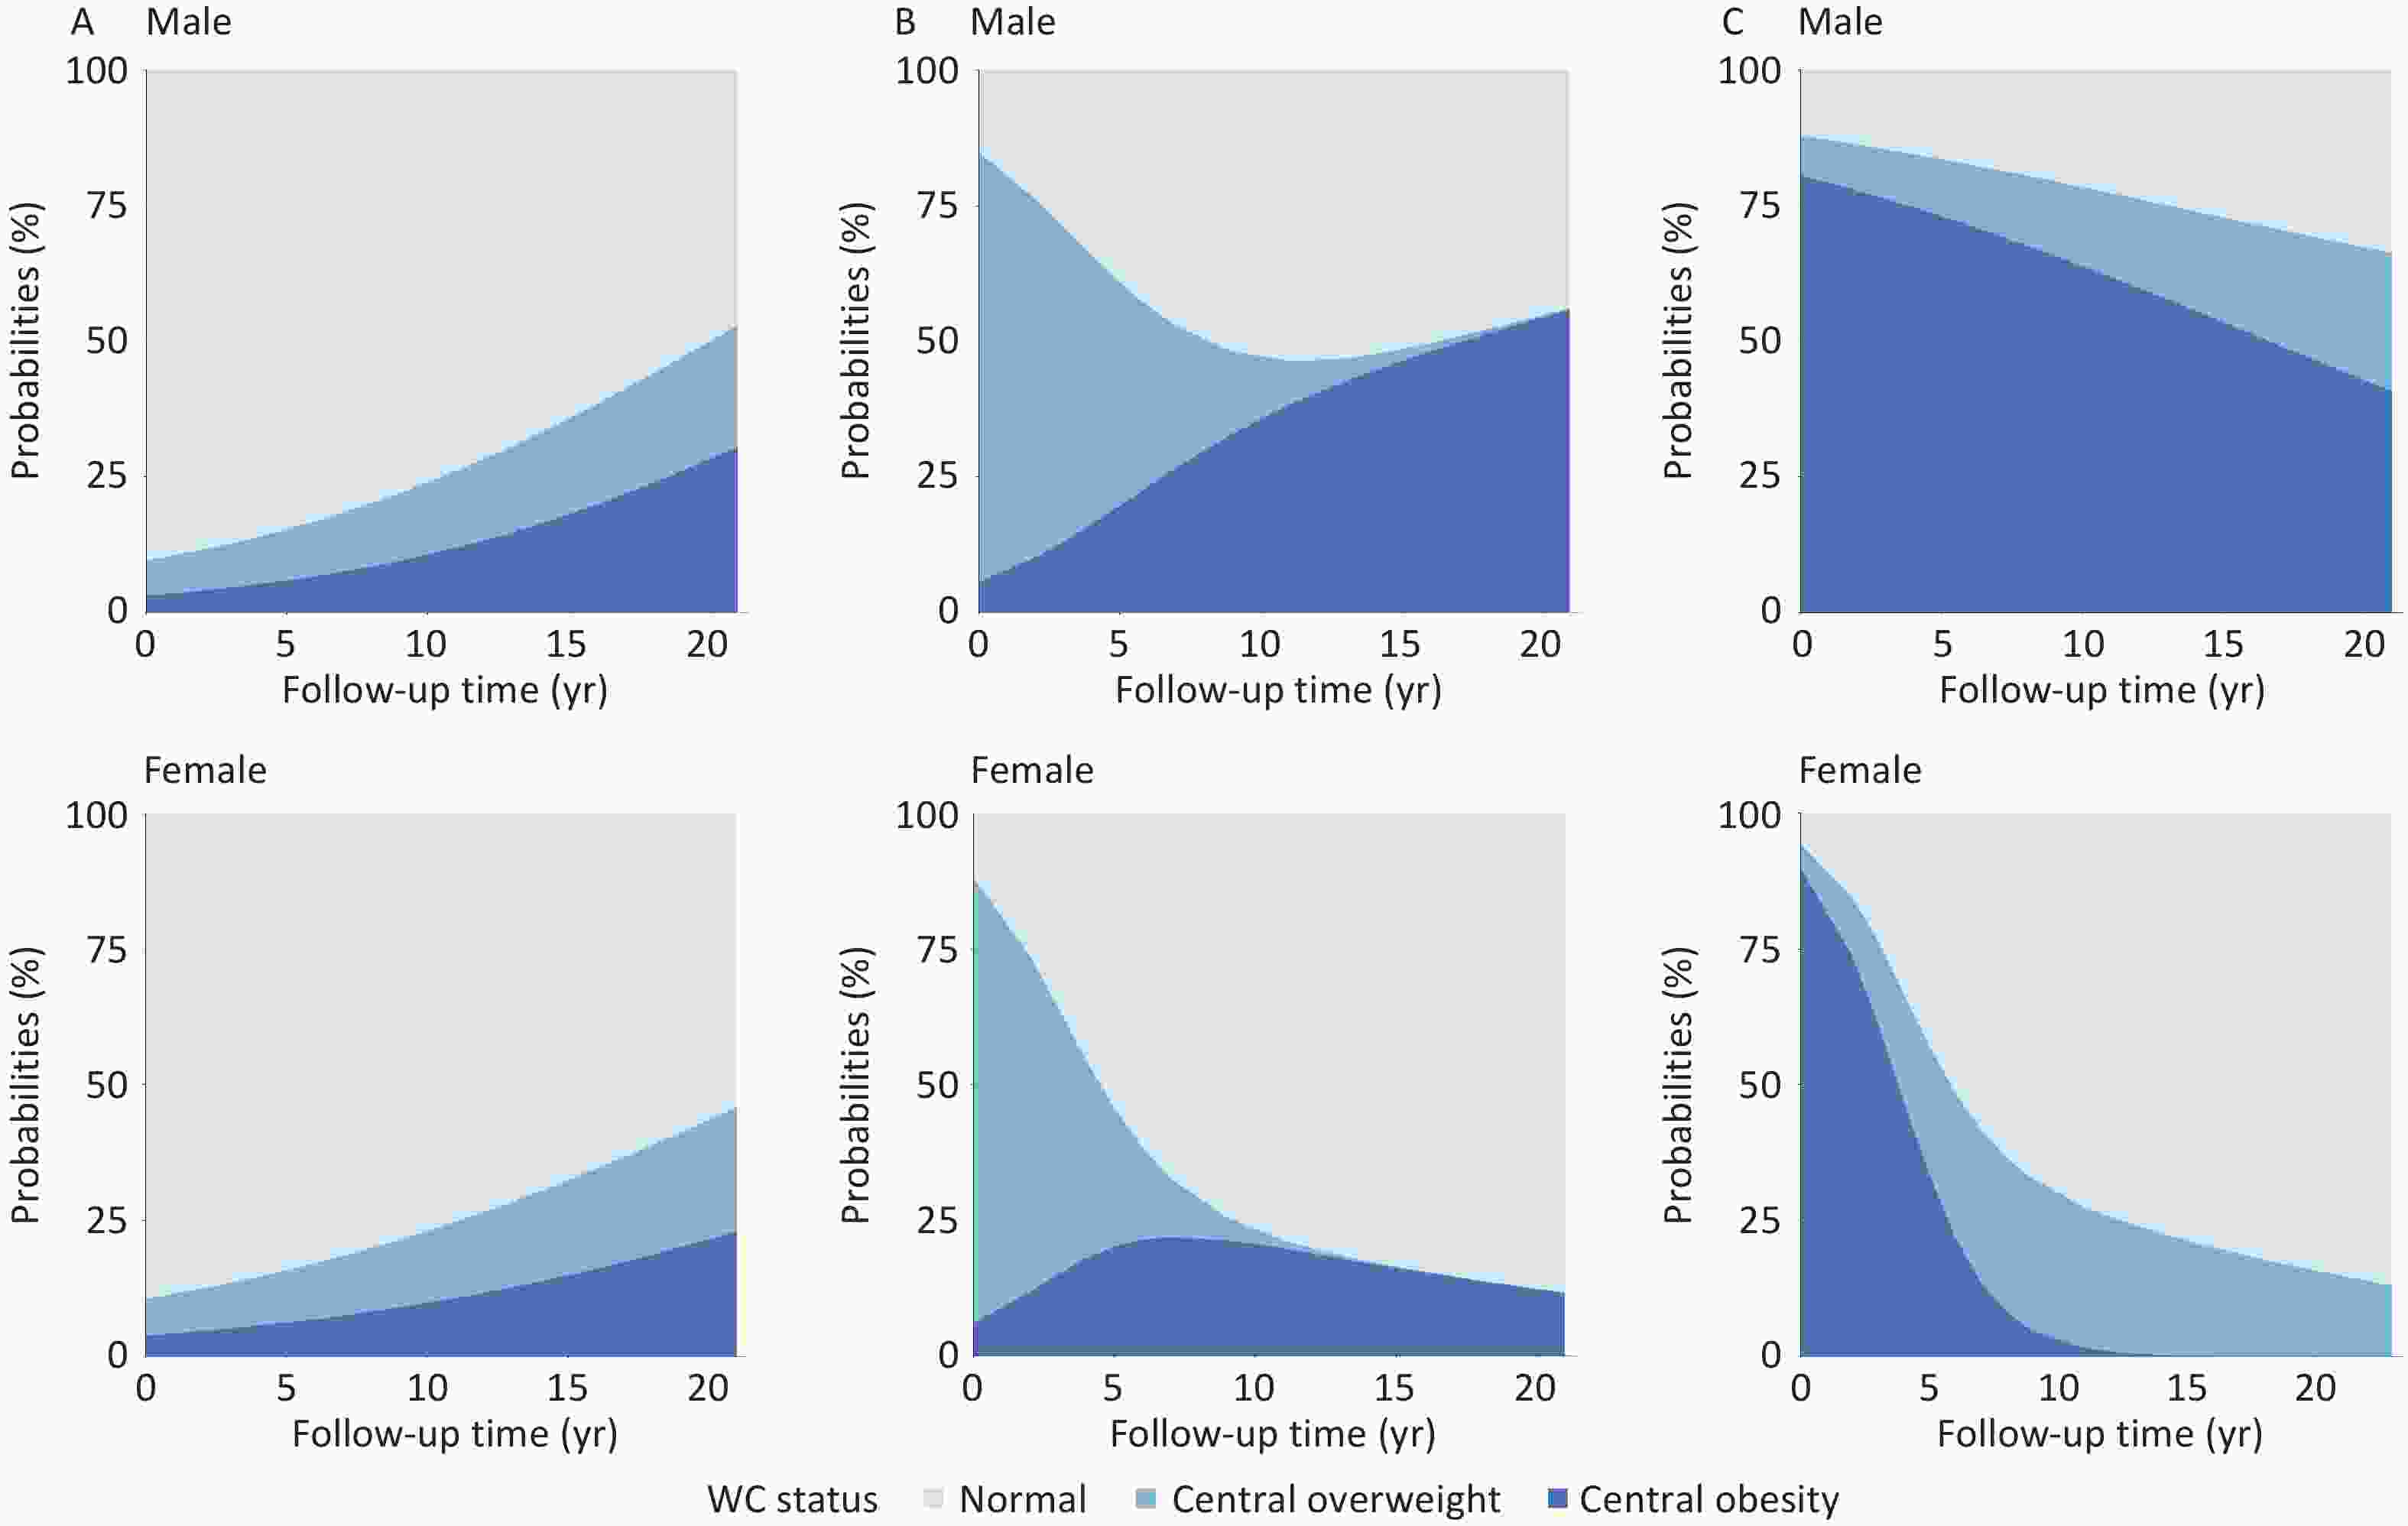
Figure 2. Probabilities of maintenance and transition by baseline waist circumference (WC) status. (A) Normal WC at baseline. (B) Central overweight at baseline. (C) Central obesity at baseline.
-
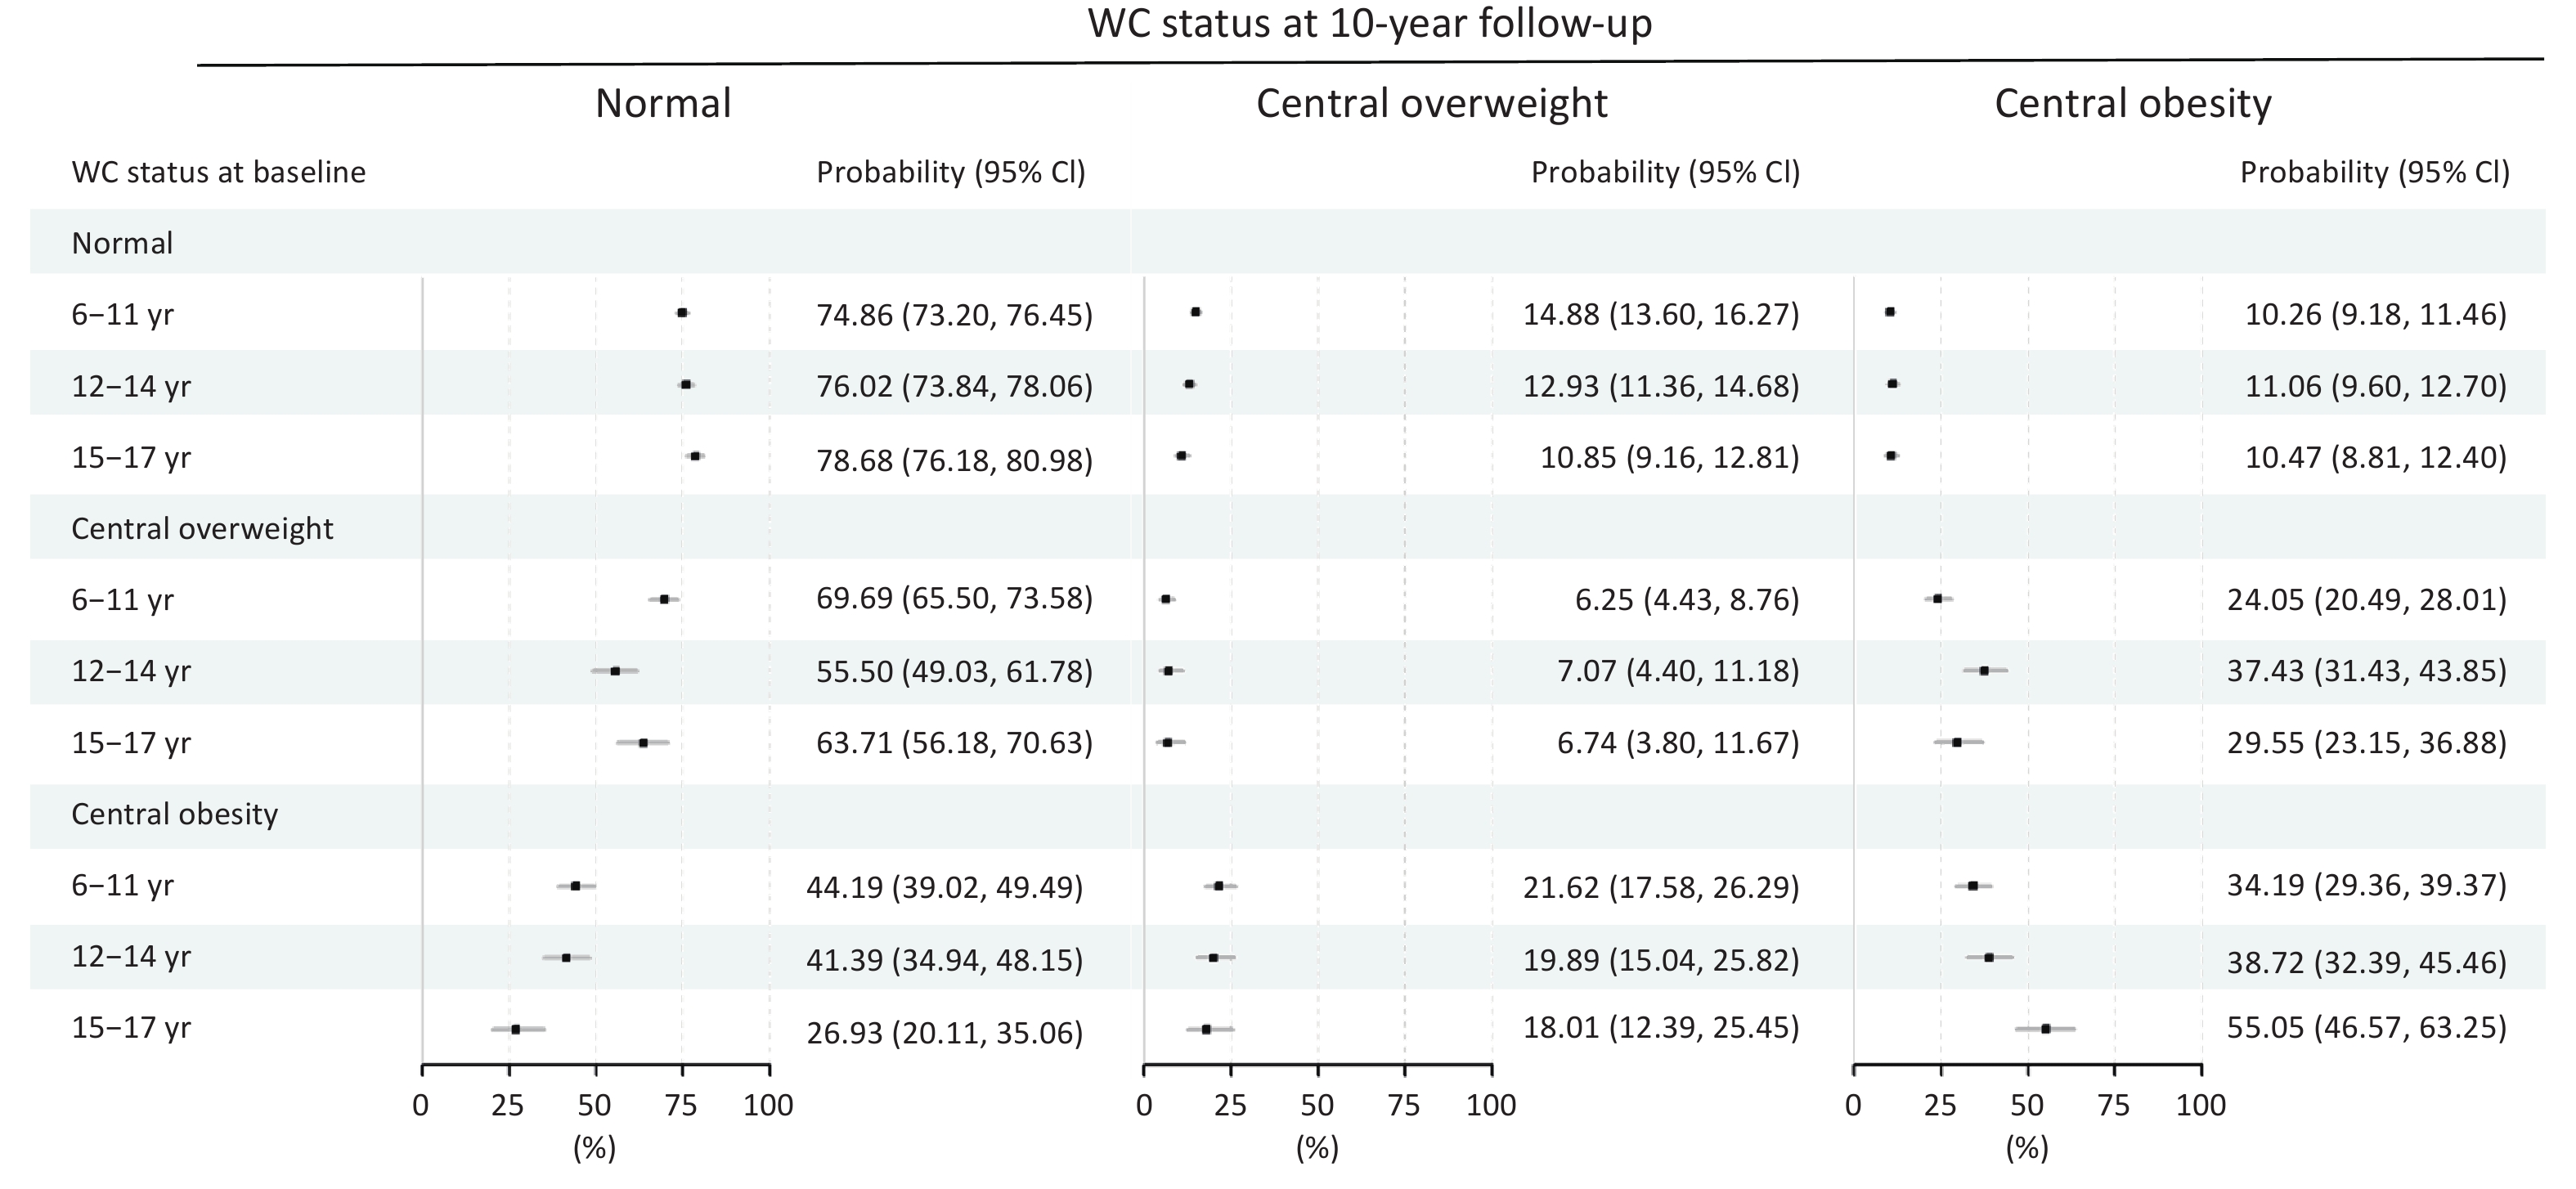
Longitudinal analysis revealed distinct age-specific patterns in WC transition trajectories. Among participants with normal WC at baseline, children aged 6–11 years had the highest 10-year incidence of central overweight (14.88%), whereas those aged 12–14 years exhibited the highest progression rate to central obesity (11.06%). Among individuals with baseline central overweight, the group aged 12–14 years had the highest risk of developing central obesity (37.43%), whereas approximately 70% of children aged 6–11 years reverted to normal WC. Notably, among participants with baseline central obesity, children (6–11 years) had the highest probability of normalization (44.19%), followed by those aged 12–14 years (41.39%). In contrast, older adolescents (15–17 years) showed a substantially lower probability of normalization (26.93%), with over 70% remaining in a state of central overweight or obesity throughout the 10-year follow-up (Figure 3).
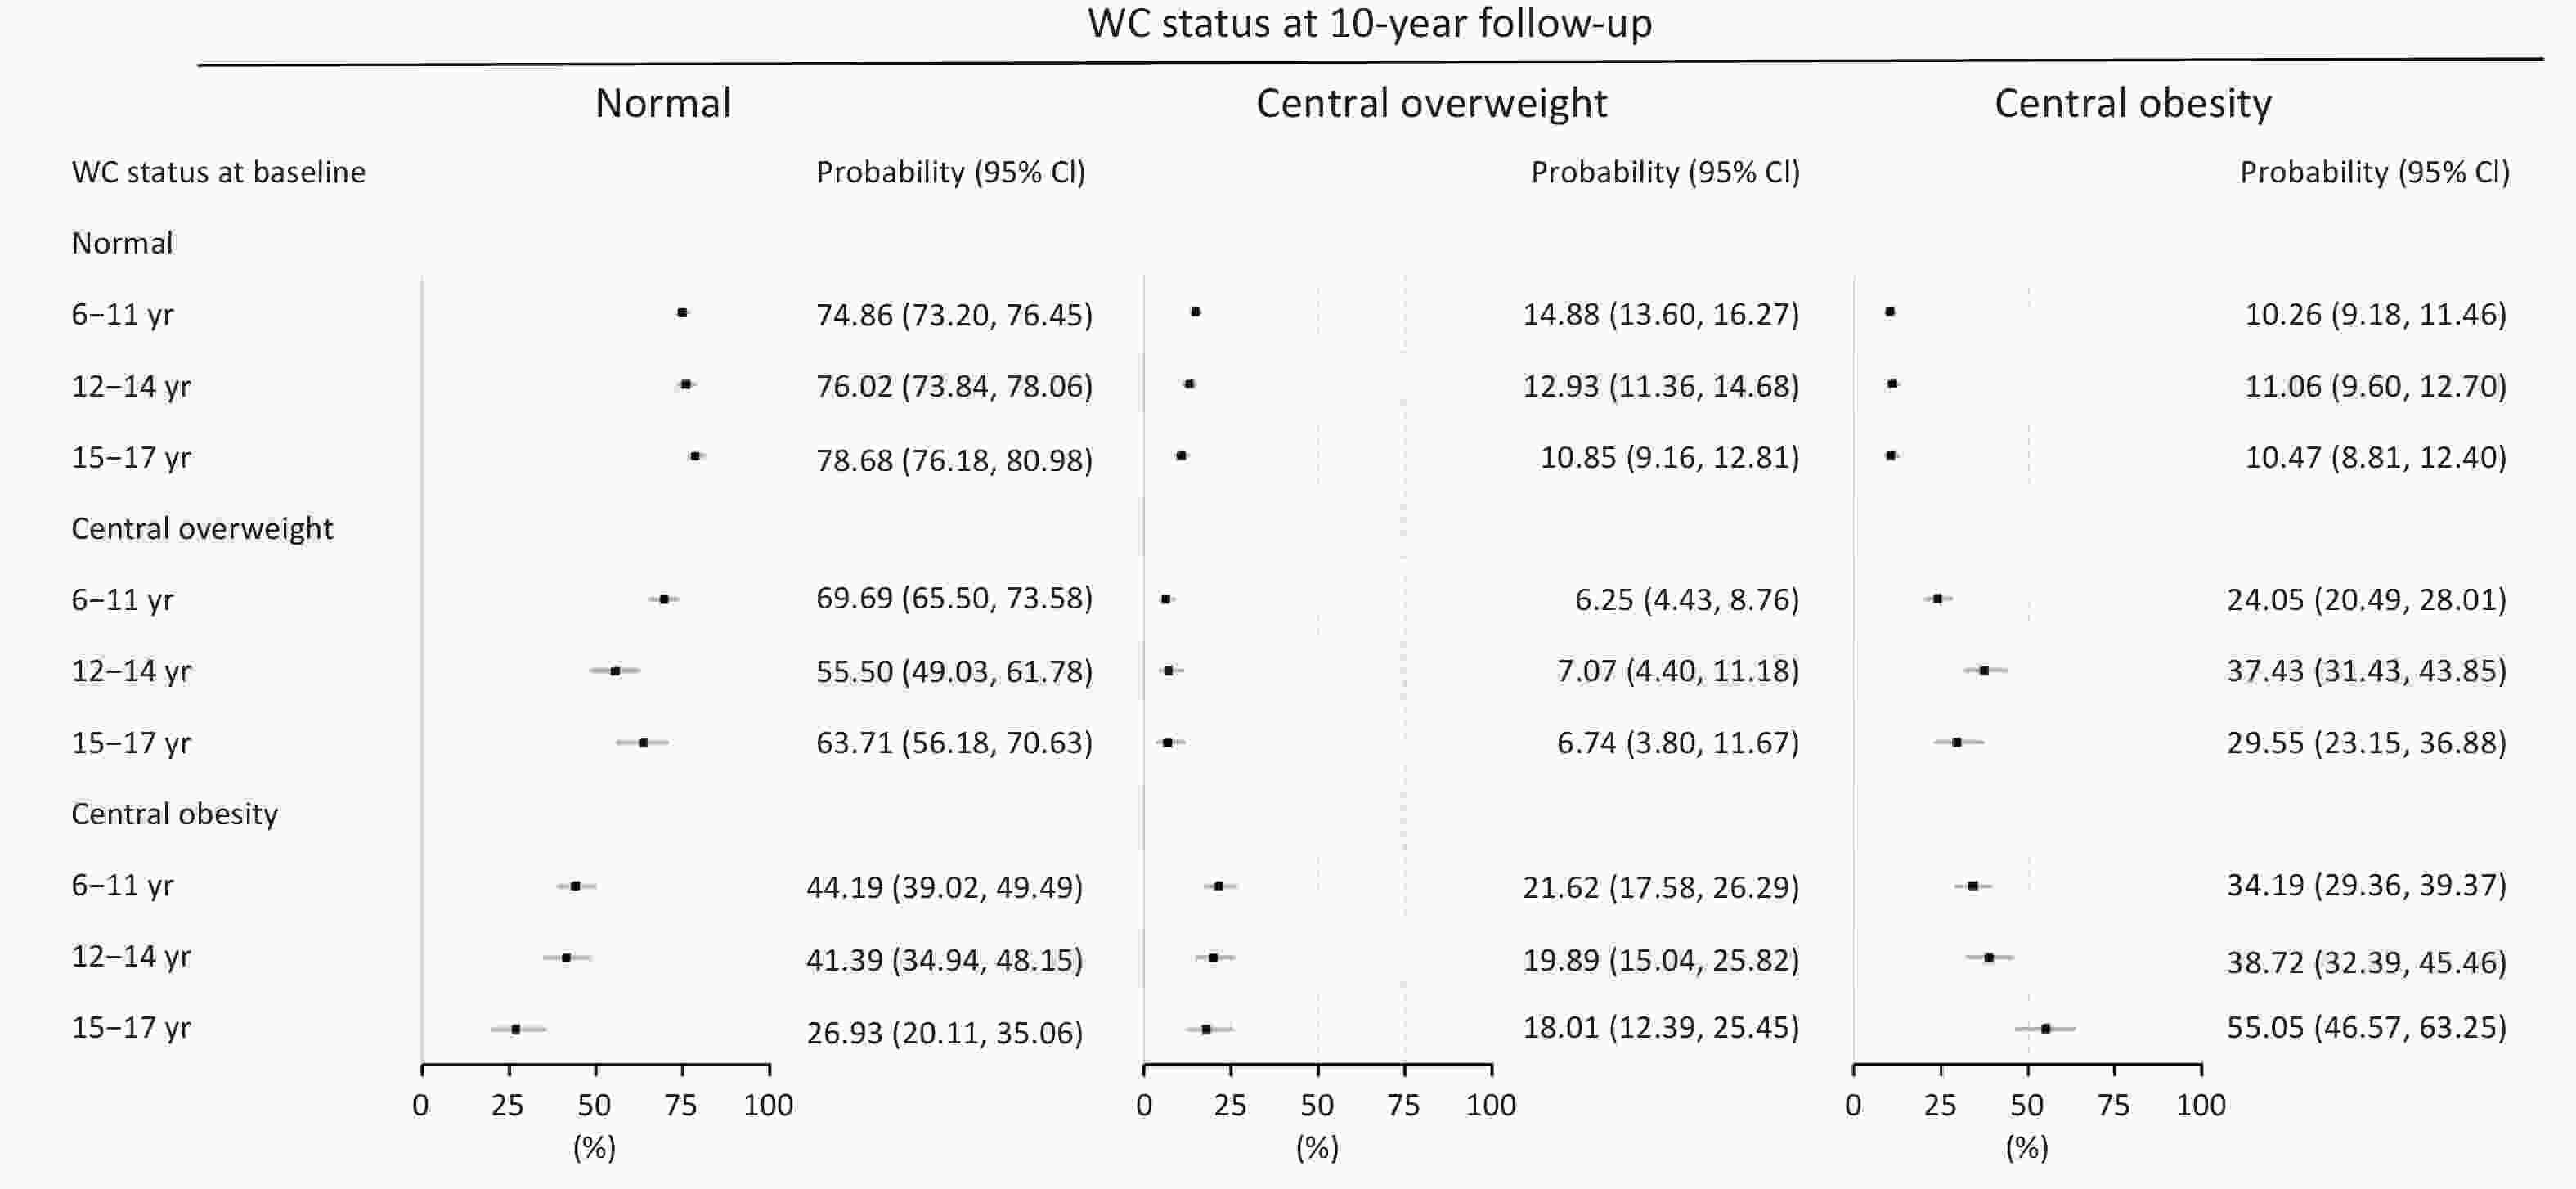
Figure 3. Waist circumference (WC) status transitions over 10 years of follow-up.
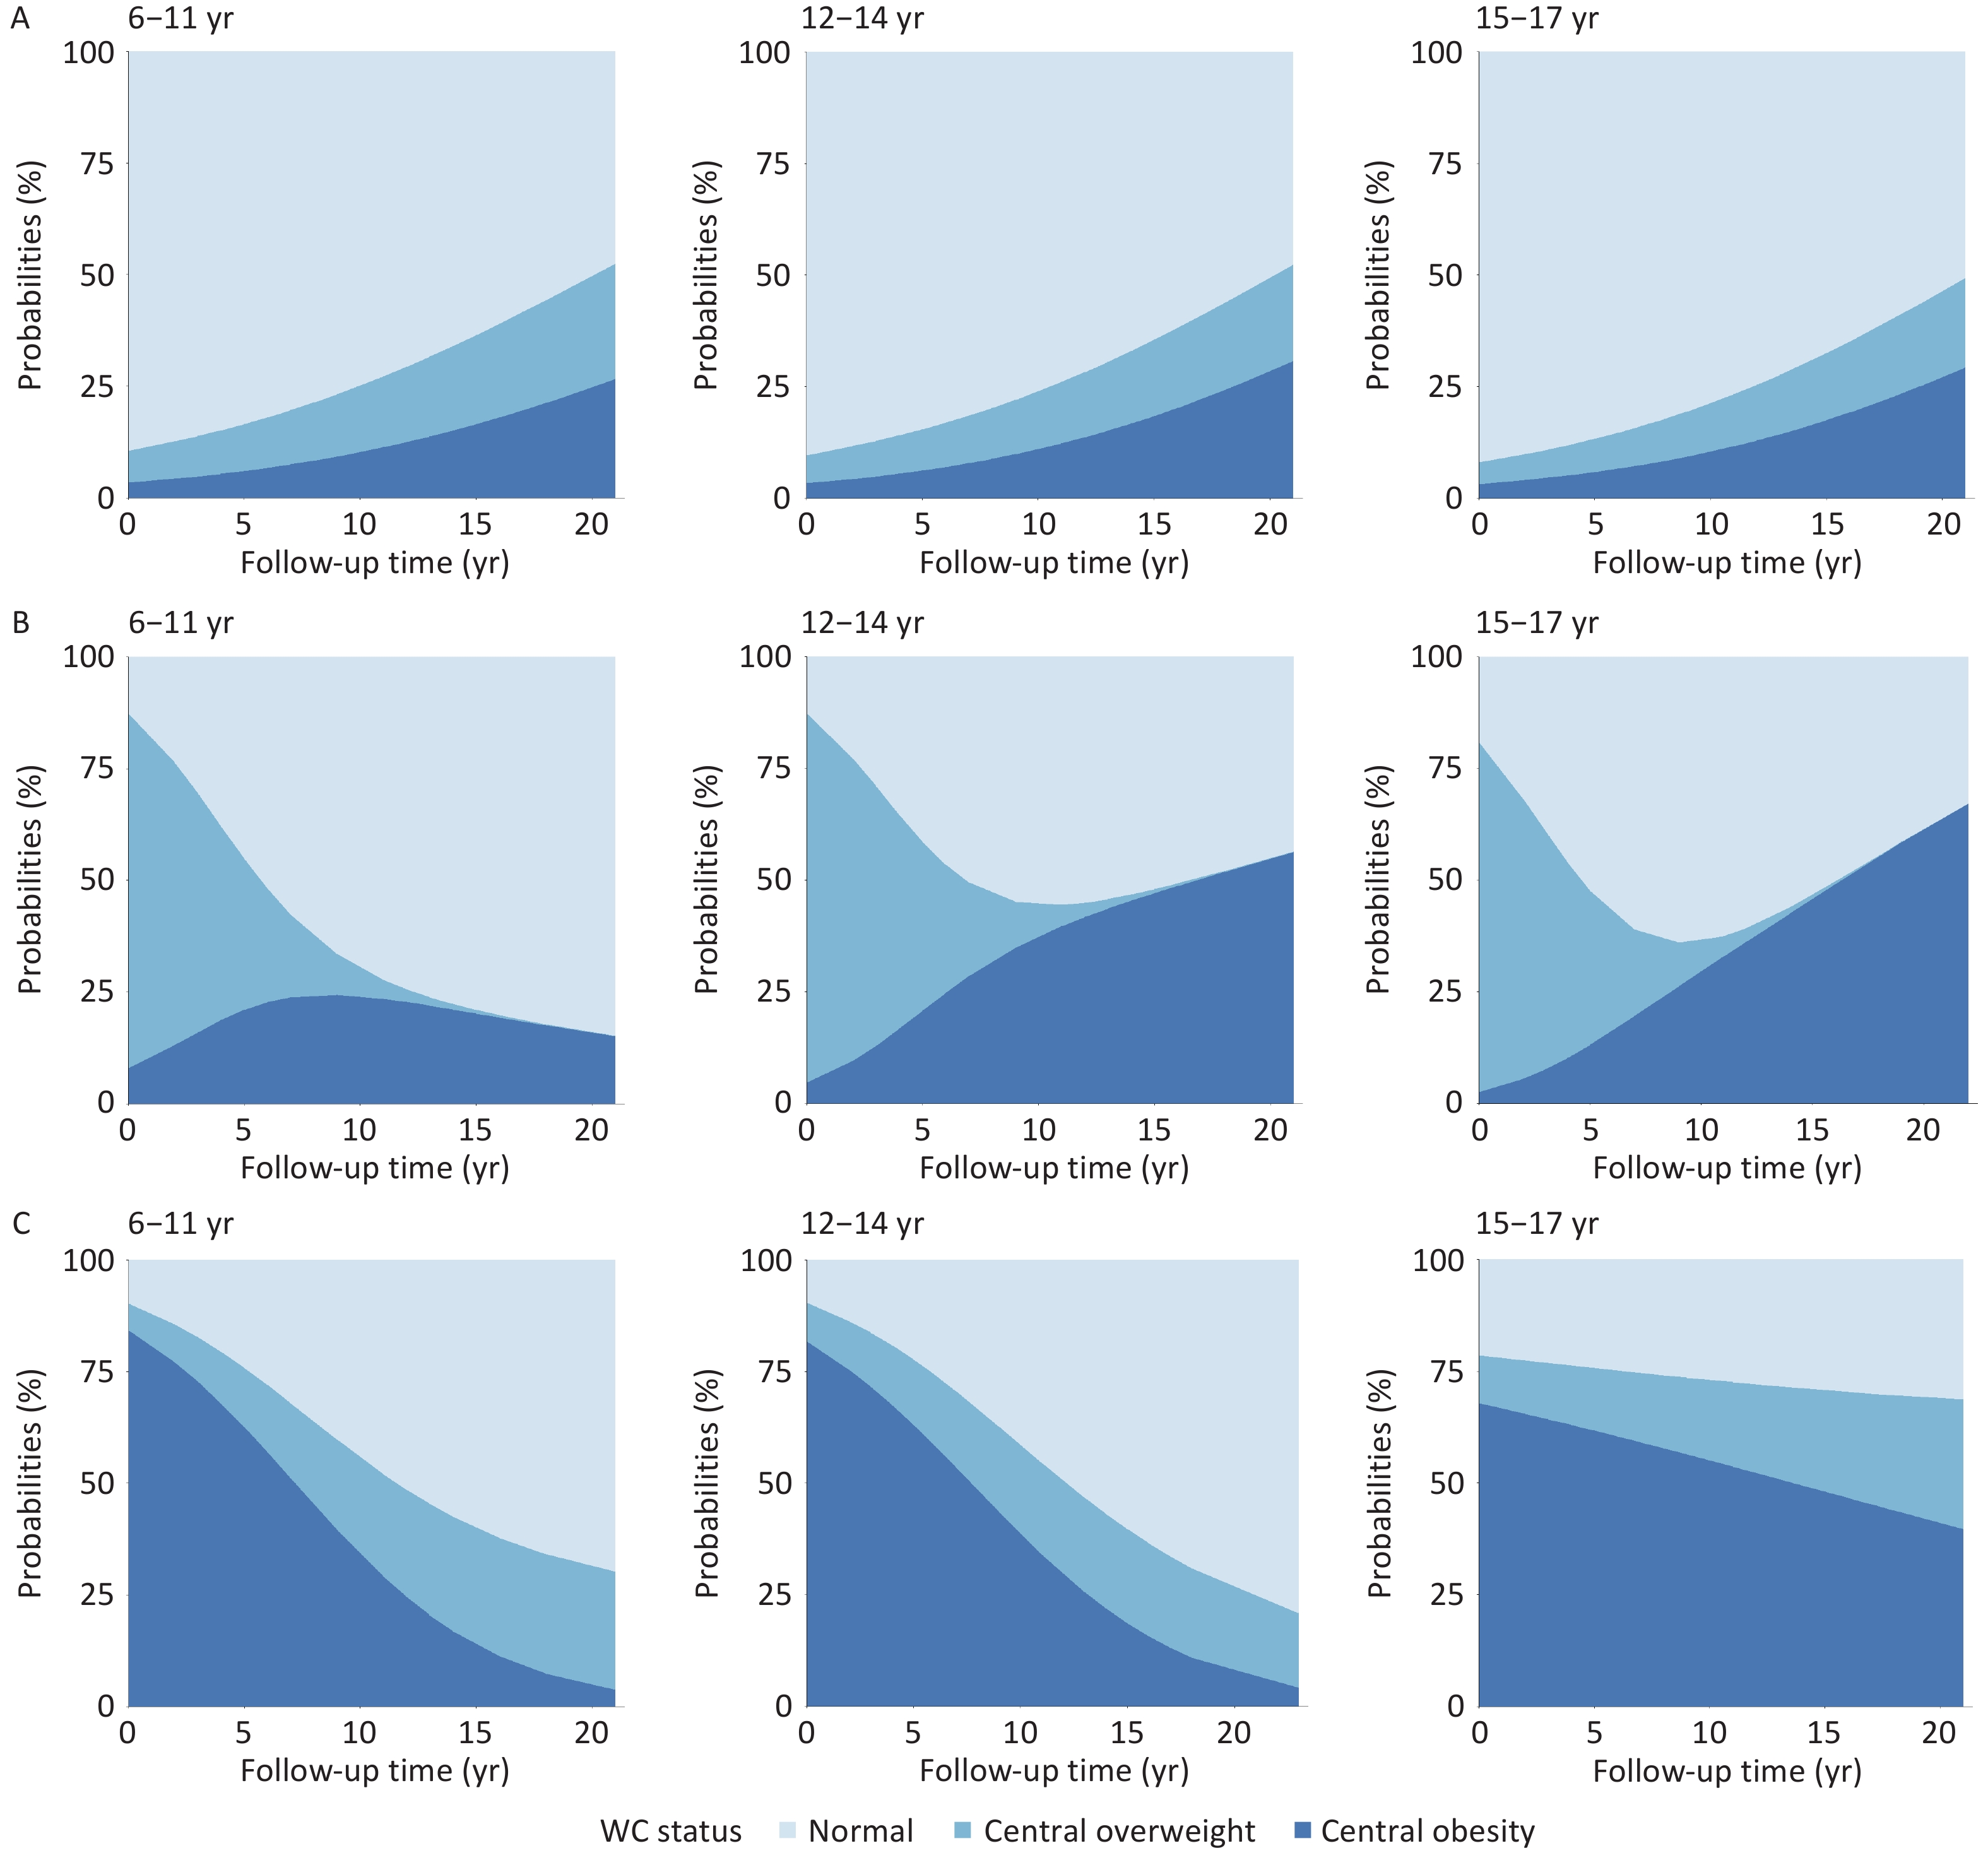
Across sub-cohorts, the group aged 6–11 years demonstrated the highest probability of maintaining normal WC status. Among participants with baseline central overweight, 69.69% reverted to normal WC within 10 years, whereas 24.05% progressed to central obesity. Among participants with baseline central obesity, more than 50% achieved WC normalization within 15 years, with sustained improvement observed throughout follow-up.
In the group aged 12–14 years, 55.50% of individuals with baseline central overweight returned to normal WC within the first 10 years, followed by an increasing likelihood of transitioning to central obesity. Transition patterns among participants with baseline central obesity were similar to those observed in the group aged 6–11.
In the group aged 15–17 years, 63.71% of the participants with baseline central overweight reverted to normal WC during the first 10 years. However, the risk of progression to central obesity increased markedly thereafter, with over 60% transitioning by year 20. Notably, more than 70% of participants with baseline central obesity remained centrally overweight or obese after 20 years of follow-up (Figure 4).
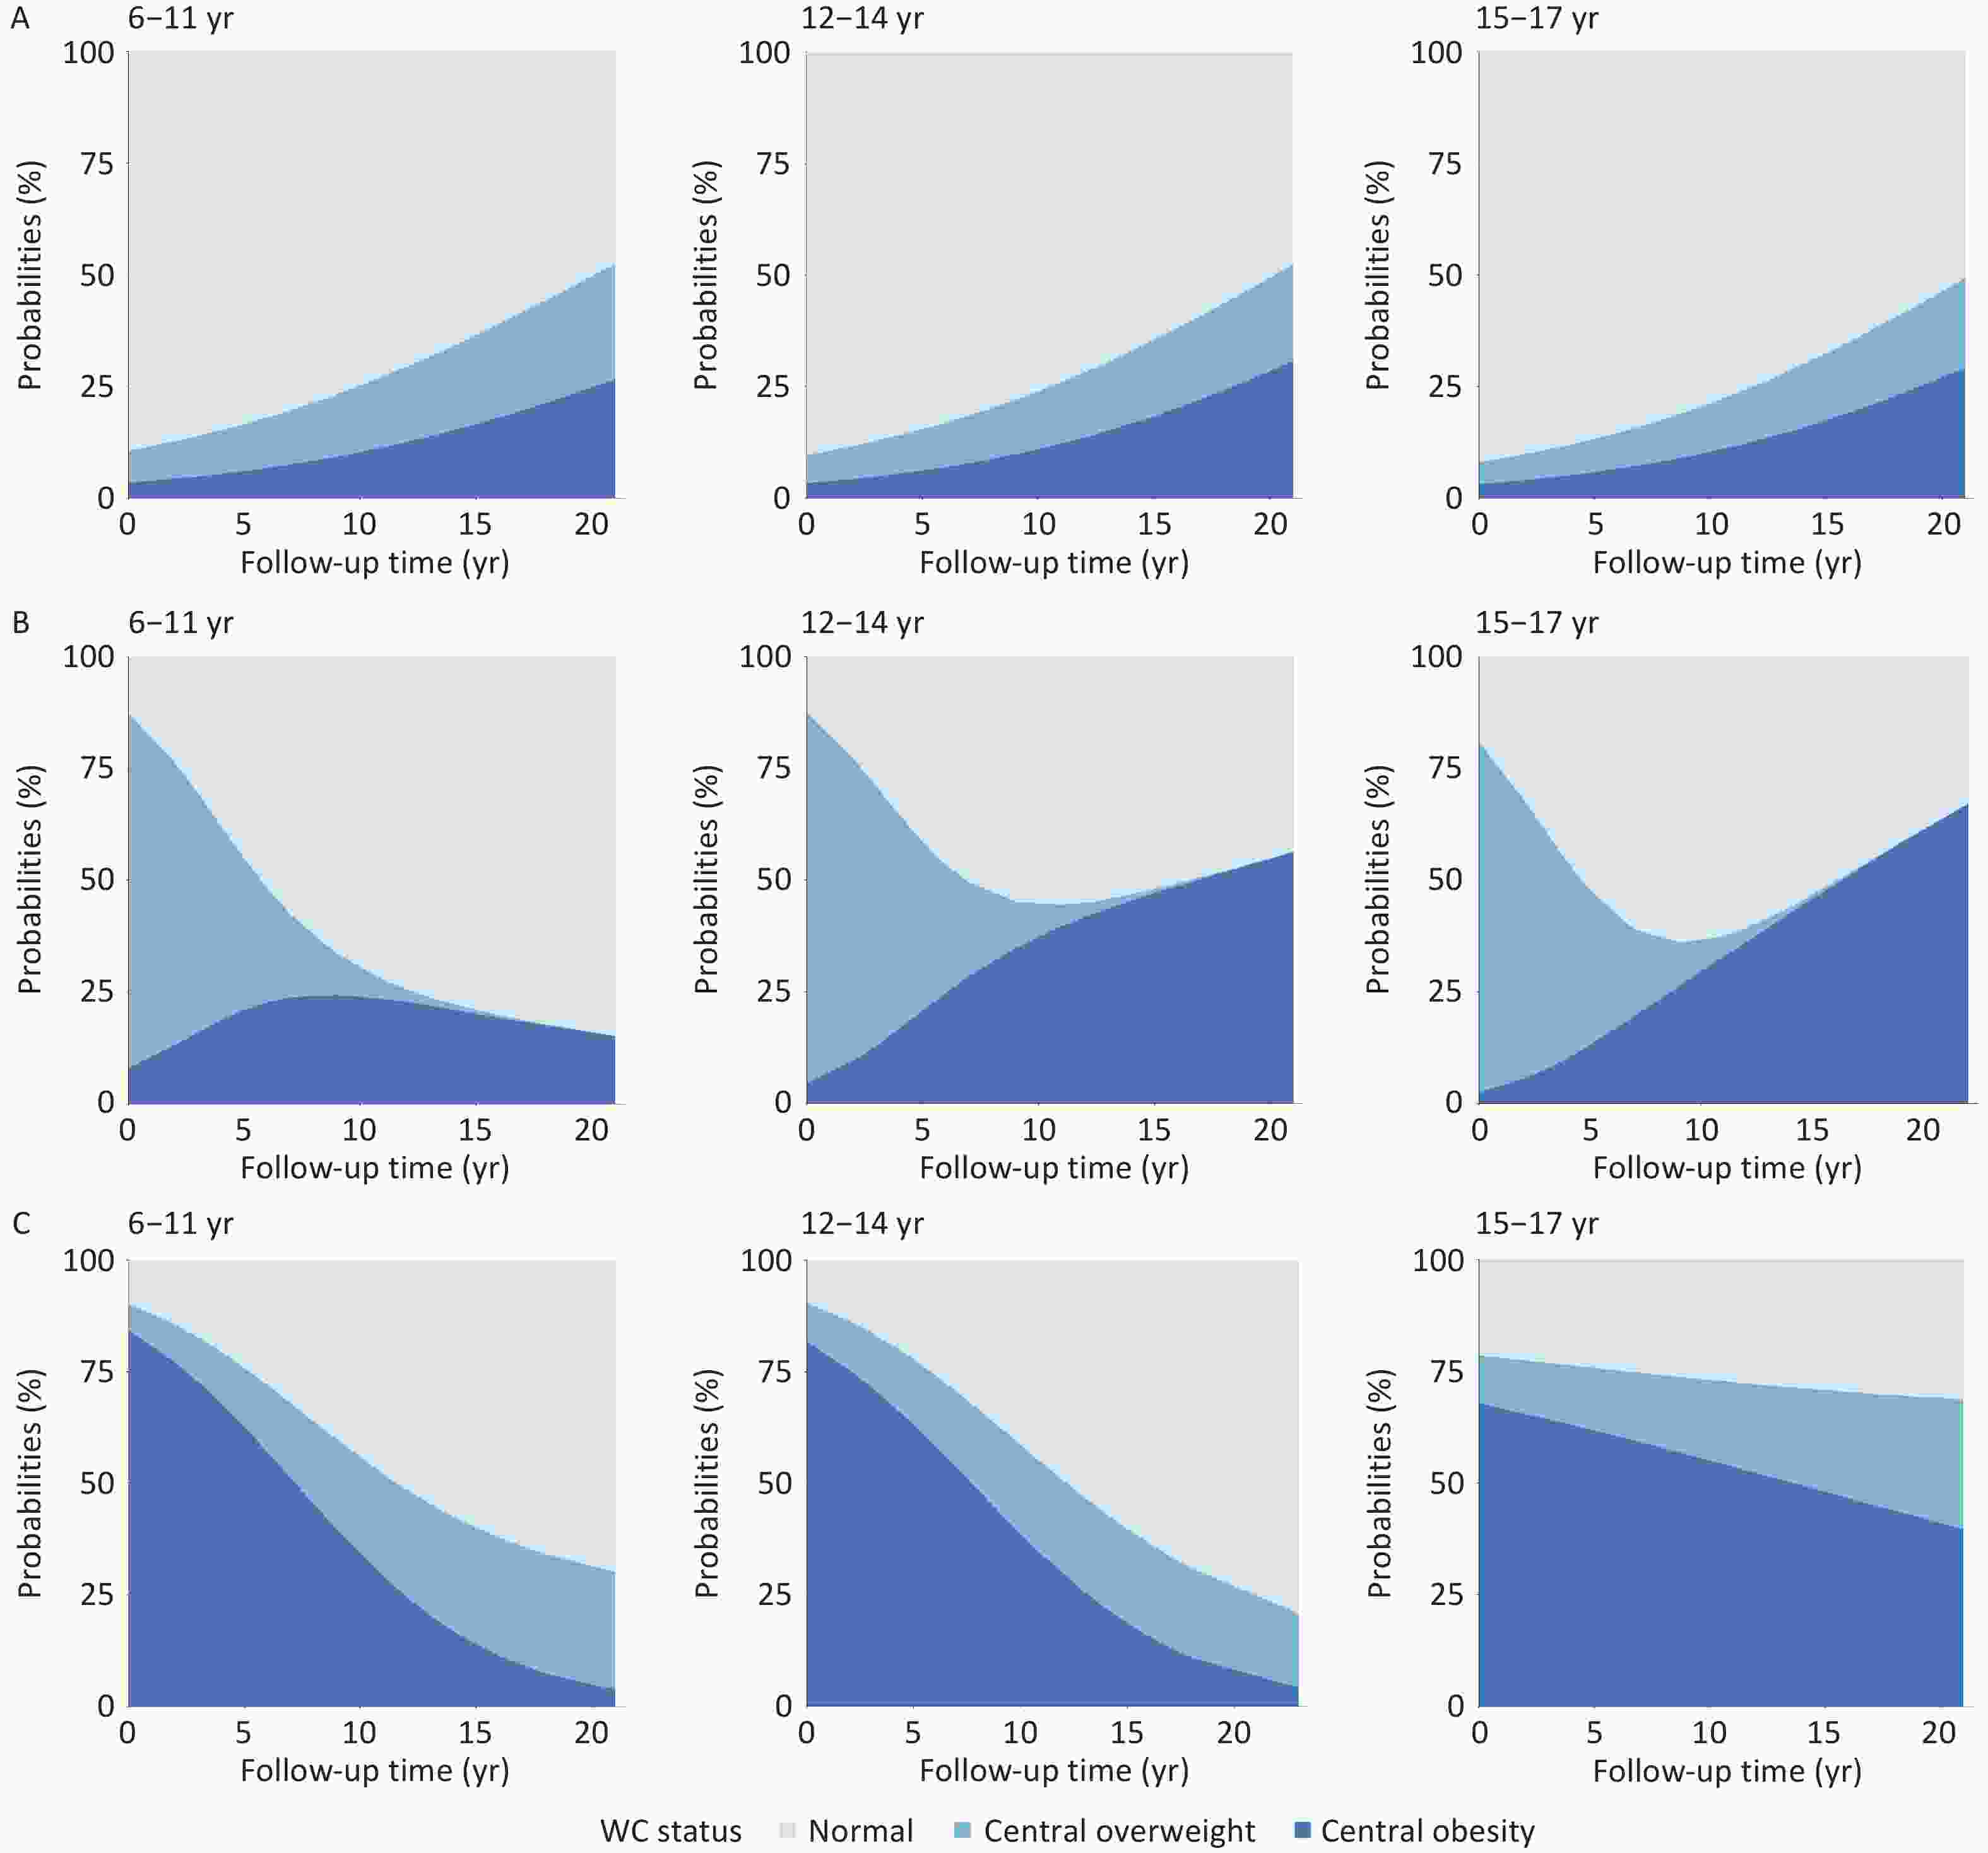
Figure 4. Age-specific probabilities of waist circumference (WC) status transitions during follow-up. (A) Normal WC at baseline. (B) Central overweight at baseline. (C) Central obesity at baseline.
-
Among participants with normal WC at baseline, boys aged 12–14 years exhibited the highest probability of transitioning to central overweight or obesity during follow-up. In contrast, girls in the same age group had the lowest risk of such transitions. Specifically, girls aged 6–11 years were most likely to develop central overweight, whereas those aged 15–17 had the highest probability of progressing to central obesity. Among participants with baseline central overweight, boys aged 6–11 years had the greatest likelihood of reverting to normal WC. In the group aged 12–14 and 15–17 years, normalization was more likely within the first 10 years, followed by an increased risk of transition to central obesity. A similar pattern was observed among girls: those aged 6–11 years had the highest likelihood of WC normalization, whereas girls aged 12–14 showed favorable transitions within the first decade, followed by a subsequent rise in obesity risk. Among participants with baseline central obesity, boys aged 12–14 years had the highest probability of transitioning to normal WC. Notably, more than 80% of boys aged 15–17 years remained centrally overweight or obese after 20 years of follow-up, representing the highest persistence of central obesity observed across all groups. Among girls, a substantial proportion transitioned to central overweight or normal WC within the first 10 years of follow-up, indicating greater transition flexibility than that observed in boys during late adolescence (Figure 5).
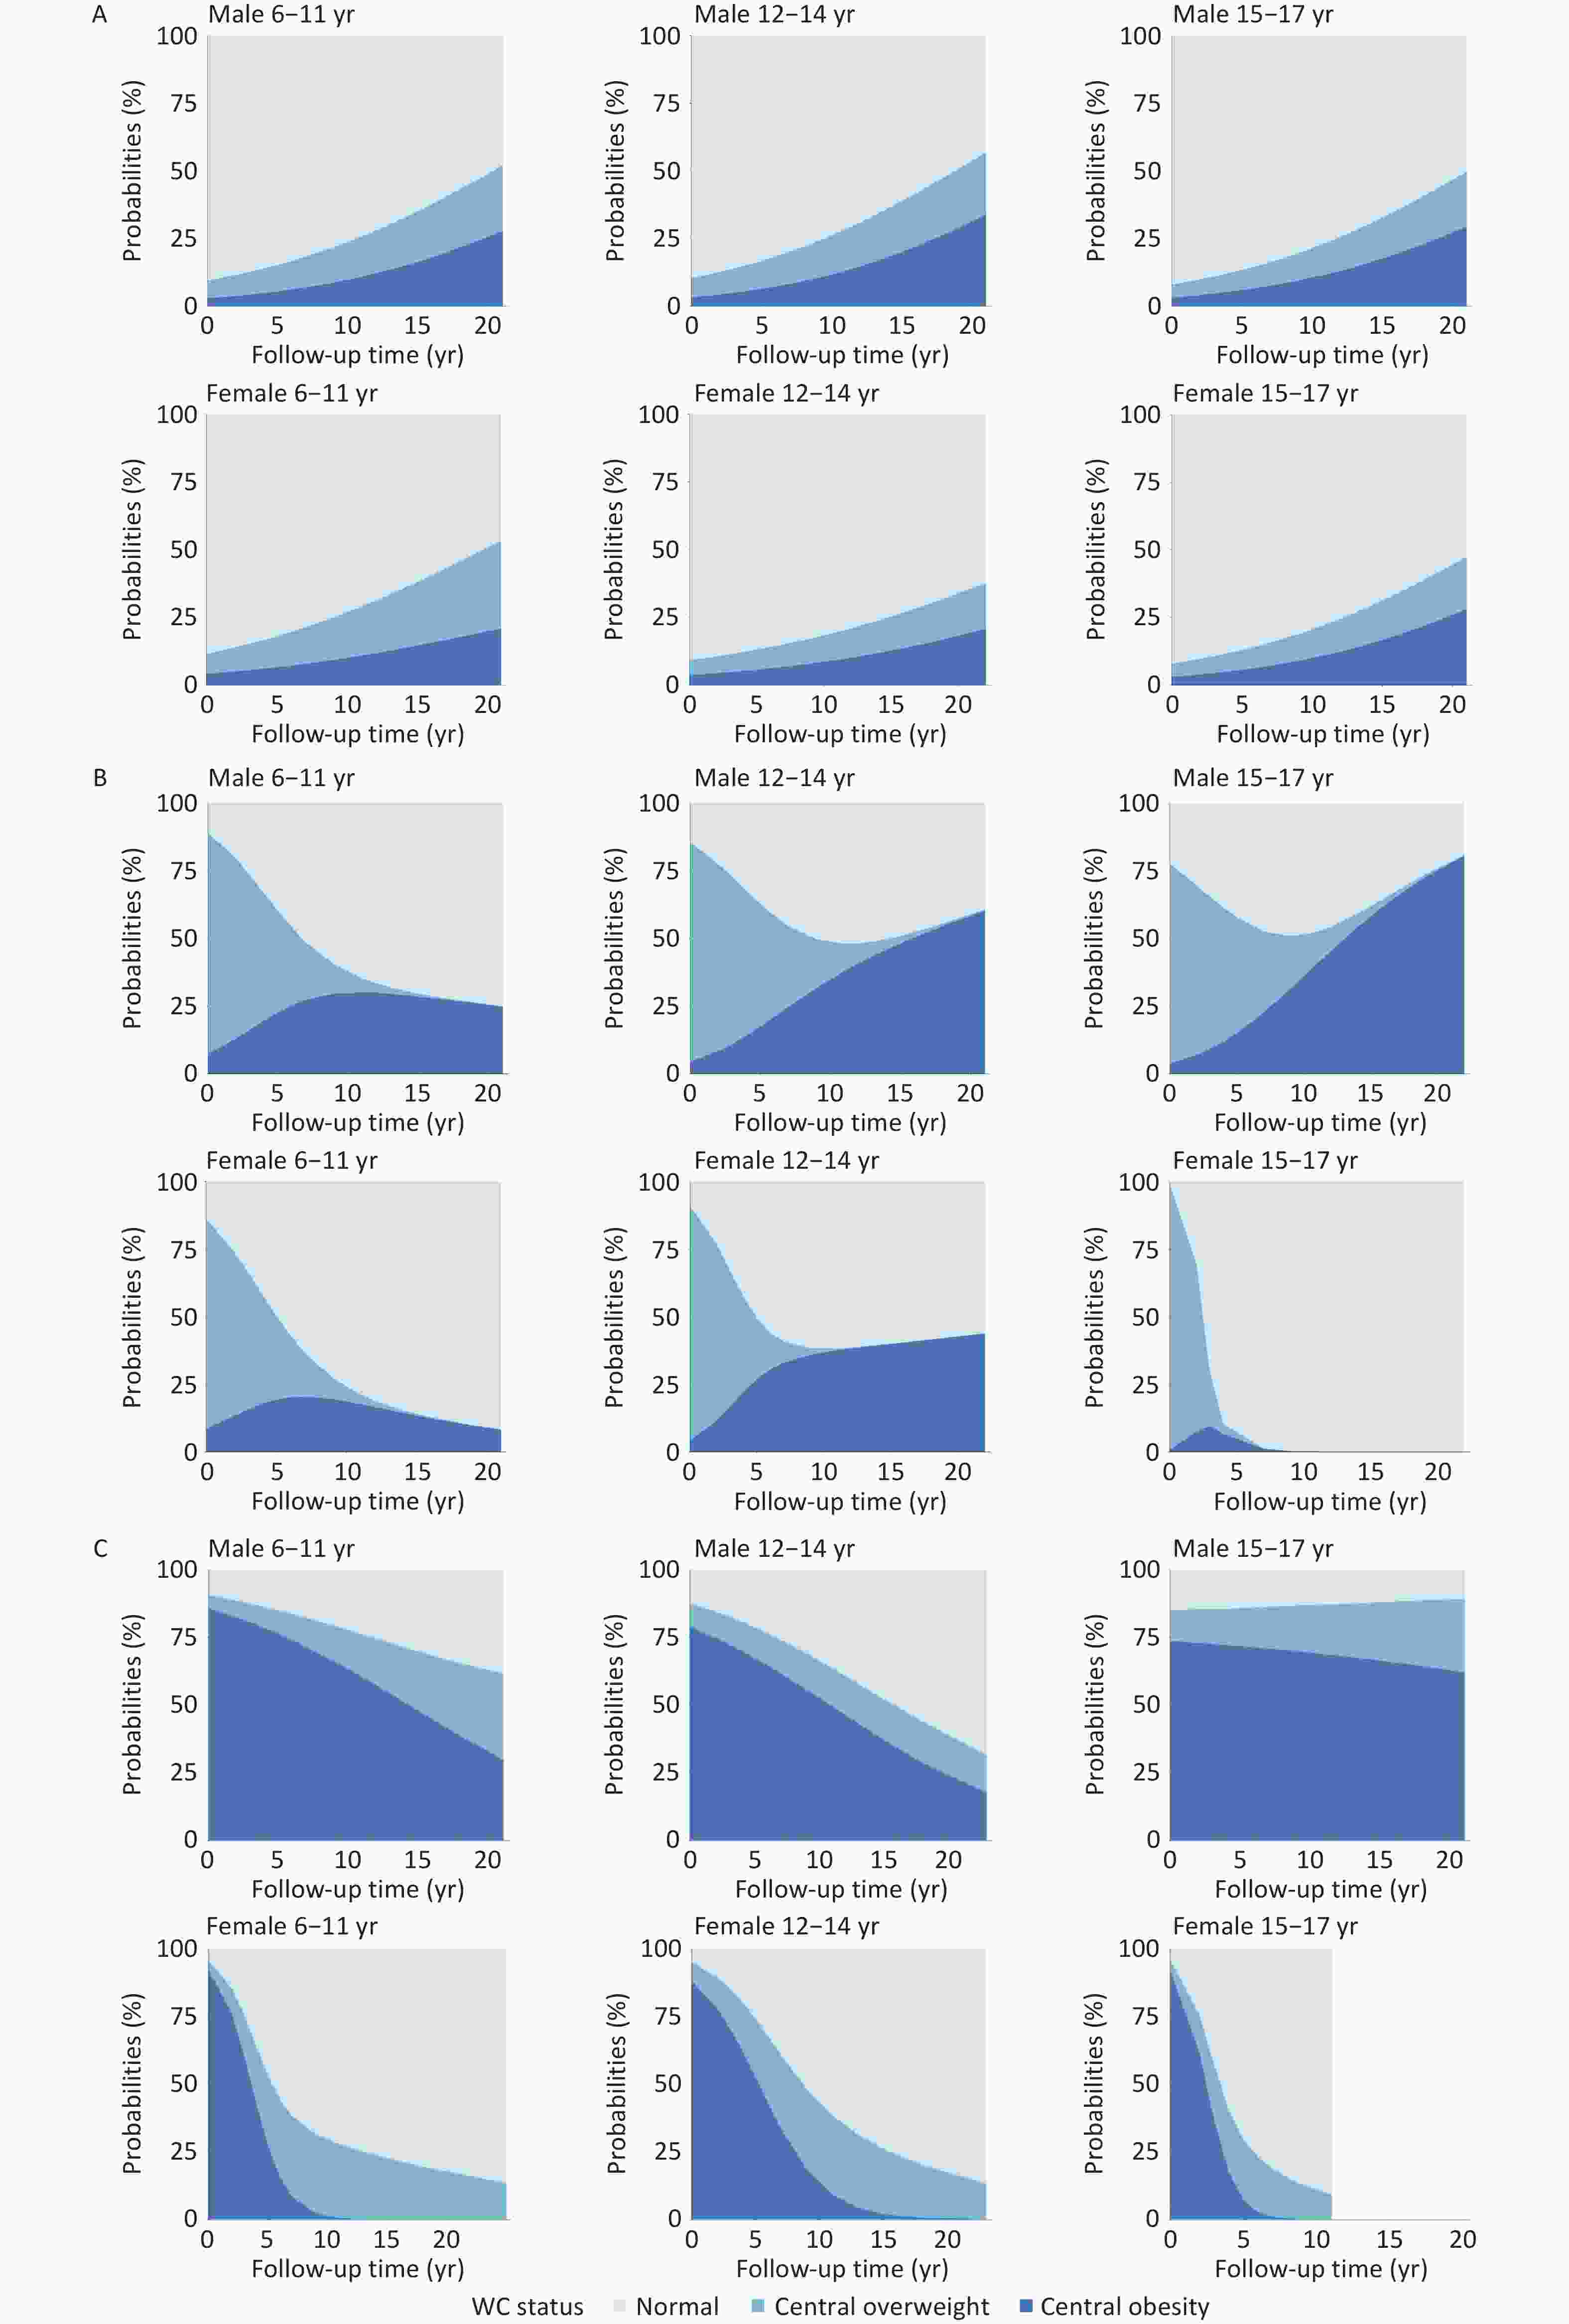
Figure 5. Age- and sex-specific probabilities of waist circumference (WC) status transitions during follow-up. (A) Normal WC at baseline. (B) Central overweight at baseline. (C) Central obesity at baseline.
-
This long-term longitudinal study of a natural cohort of children and adolescents yielded four major findings. First, the prevalence of central overweight and obesity followed a distinct life-course pattern, decreasing during adolescence, reaching its lowest level in early adulthood, and progressively increasing with age. These stage-specific fluctuations highlight the dynamic nature of central adiposity across developmental phases. Second, significant sex-based differences were observed in the trajectories of central obesity. Boys were more likely than girls to transition from normal WC or central overweight to central obesity, whereas girls exhibited a greater tendency toward reversion to normal WC. Third, early childhood and adolescence (ages 6–14 years) represent a critical “window of plasticity” characterized by the highest 10-year probabilities of normalization from central obesity (44.19% for ages 6–11 and 41.39% for ages 12–14). Fourth, in the absence of intervention, central obesity became significantly more persistent after 15 years of age. Over 70% of boys aged 15–17 years still had high WC after 20 years of follow-up, with their 10-year reversal probability decreasing to 26.93%. Collectively, these findings underscore the need for life course–oriented prevention strategies for central obesity, emphasizing age- and sex-specific interventions. Early identification and targeted intervention, particularly during the critical developmental period before age 15, are essential to prevent early onset and reduce the long-term persistence of central obesity.
-
The multi-level Life Course Health Development framework posits that health trajectories evolve dynamically over time, shaped by temporal, environmental, and individual-level factors, and require balance across multiple levels of health functioning[28]. Obesity is widely recognized as a life course–dependent condition[29]. Evidence indicates that children of parents with obesity tend to become overweight at earlier ages and are more likely to experience persistent obesity into adulthood[30]. Additionally, maternal pre-pregnancy obesity and excessive gestational weight gain significantly heighten the risk of obesity in offspring[31]. In this study, WC increased progressively from early childhood onward and continued to rise throughout the life course. Although the prevalence of central overweight and obesity declined temporarily during young adulthood, it subsequently exhibited a steady upward trend. These findings align with existing evidence from cohort studies conducted in Japan and South Korea, which similarly reported increasing trends in overweight and obesity among children and adolescents[32,33]. Importantly, early development of obesity is a strong predictor of adult obesity, particularly among children with severe obesity[34]. Furthermore, the accumulation of metabolic health conditions such as obesity and hypertension during childhood and adolescence may have a profound impact on health outcomes in adulthood[35].
A pivotal finding of this study is the identification of a “bidirectional” transition pattern that characterizes the pre-adolescent years. Children aged 6–14 years demonstrated remarkable plasticity in their WC status. Specifically, the 10-year probability of reversion from central obesity to normal WC was 44.19% among those aged 6–11 years at baseline and remained high at 41.39% among those aged 12–14 years. These results indicate that the window from early childhood through early adolescence represents a critical “reversal period” during which normalization of central obesity is highly attainable.
In contrast, the potential for reversal diminished markedly after age 15. Among participants aged 15–17 years at baseline, the 10-year probability of transitioning from central obesity to normal WC declined to 26.93%, indicating substantially greater persistence during late adolescence. These findings reinforce a critical public health implication: although the 6–14-year period offers a high-probability opportunity for reversing central obesity, this “window of opportunity” narrows significantly by mid-adolescence. Therefore, to maximize intervention effectiveness and prevent the persistence of central obesity into adulthood, intensive public health strategies should be prioritized and implemented before age 15.
-
Globally, women have a higher overall risk of obesity[36]. However, in China, boys exhibit a higher prevalence of obesity during childhood and adolescence[37], and adult males also demonstrate higher rates of central obesity than females[38]. Consistent with these patterns, this study identified pronounced sex differences in the life-course trajectory of central obesity. Males had higher incidence rates during childhood, adolescence, and young adulthood and were more likely to progress from normal WC to central obesity. In contrast, females showed greater potential for reversing central obesity during childhood and adolescence but experienced a marked increase in incidence after reproductive age (around 35 years).
Sex differences in obesity are underpinned by both physiological and sociocultural mechanisms. Males are more prone to metabolic complications, whereas females are more vulnerable to psychological consequences associated with obesity[39]. Body composition and fat distribution also differ by sex. At the same BMI, females tend to have approximately 10% higher total body fat than males[40,41], primarily stored in subcutaneous adipose tissue, whereas males preferentially accumulate visceral adipose tissue[42,43], which is more metabolically active and associated with greater cardiometabolic risk[44]. These patterns are influenced by sex hormones, particularly during puberty and aging[45].
Sociocultural factors may also contribute. Females are more frequently exposed to body image pressure from peers, family, and social media, leading to higher levels of body dissatisfaction and increased risk of disordered eating behaviors[46,47]. In contrast, obesity in males is often underrecognized and undertreated until more advanced stages[48].
-
Childhood obesity is associated with increased risks of type 2 diabetes, cardiovascular disease, autoimmune disorders, and premature mortality. However, early intervention—particularly before puberty—can significantly reduce these risks, with evidence suggesting that reversal of childhood obesity before adulthood normalizes cardiometabolic profiles[49,50]. This study identified key high-risk and high-impact groups for targeted prevention and intervention of central obesity, including children aged 6–11 years with normal WC, boys aged 6–11 with obesity, boys aged 12–14 with central overweight, and adolescents aged 15–17 with central obesity. Central obesity does not follow a linear life-course trajectory but demonstrates distinct age- and sex-specific patterns of progression and resolution. These findings underscore the need for a continuous life-course approach to obesity prevention that begins in early childhood, extends through adolescence, and is tailored to developmental stage and sex.
Although early obesity prevention programs in the United States have primarily targeted high-risk populations (e.g., low-income children), few have addressed broader structural barriers within physical, sociocultural, or healthcare environments, underscoring the need for precision-based strategies[29]. In China, Yuan et al.[51] advocated for longitudinal, government-led interventions that include urban–rural, ethnic, and socioeconomic diversity. Similarly, Dong et al.[37] proposed the problem–evidence-based practice–determinants–actions–long-term scalability framework to guide policy development and recommended age- and region-specific strategies to be implemented in schools or primary care settings to enhance cost-effectiveness and scalability.
-
This study utilized a population-based longitudinal cohort comprising 2,440 children and adolescents with a total of 7,007 WC measurements and a maximum follow-up period of 29 years. A major strength of the study was the application of a GLMM, which effectively accounted for the intra-individual correlation across repeated measurements and accommodated unequally spaced observations over nearly three decades of follow-up. This extensive community-based cohort enabled a comprehensive assessment of age-specific trajectories and transitions among normal WC, central overweight, and central obesity across the life course. The large number of repeated measurements facilitated the identification of critical developmental windows for both the onset and remission of central obesity. However, several limitations should be acknowledged. First, the study sample was drawn from selected provinces in China, which may limit the generalizability of the findings to other racial, ethnic, or geographic populations without further validation in larger and more diverse cohorts. Second, the extended follow-up period was associated with a considerable attrition rate. Although comparison between the analytical and excluded samples (Supplementary Table S2) showed that the two groups were well balanced in terms of baseline WC status and urbanization level (P > 0.05), differences were observed in other baseline characteristics. This attrition may have introduced potential selection bias; therefore, caution is warranted when generalizing the estimated transition probabilities. Third, due to the long-term nature of the CHNS data, several time-varying lifestyle factors—such as detailed dietary intake, physical activity, and parental obesity history—were not consistently available across all survey waves and were thus not included as covariates. Future studies incorporating these factors may further elucidate the mechanisms underlying WC status transition.
-
This long-term, population-based cohort study provides strong evidence that the development and resolution of central obesity vary significantly by age and sex. Childhood and early adolescence, particularly between ages 6 and 14 years, represent critical periods during which central overweight and obesity are most likely to emerge and most responsive to reversal. Notably, the potential for reversing central obesity to a normal WC status is highest before age 14 but diminishes sharply during late adolescence (15–17 years), when obesity exhibits significantly greater persistence. Boys were more likely than girls to transition from normal WC to central obesity and less likely to recover once obese. These findings underscore the need for sex-specific, life-course prevention strategies, with particular focus on the 6–14-year “window of opportunity” to maximize the effectiveness of reversal interventions. Currently, BMI is the only obesity-related indicator included in China’s National Student Physical Fitness Standards. We recommend incorporating WC monitoring into national child health surveillance systems and developing sex-specific intervention programs to more effectively address the growing burden of central obesity.
-
Patients and/or members of the public were not involved in the design, conduct, reporting, or dissemination plans of this research.
doi: 10.3967/bes2026.027
Identification of Critical Intervention Windows for Central Obesity from Childhood to Early Adulthood: A 30-Year Longitudinal Study in China
-
Abstract:
Objective To characterize long-term transition probabilities in waist circumference (WC) status from childhood into early adulthood and identify critical age windows for the development, persistence, and reversal of central obesity. Methods Using the China Health and Nutrition Survey data (1993–2022), 7,007 WC measurements from 2,440 participants aged 6–17 years at baseline were analyzed. Participants were grouped by baseline age: 6–11, 12–14, and 15–17 years. Generalized linear mixed-effects models were used to estimate WC transition probabilities, adjusting for sociodemographic factors. Results Central obesity prevalence increased from age 6, declined in early adulthood (approximately 22 years), and subsequently increased again. The 6–14-year age window exhibited dynamic, bidirectional transitions; specifically, the 10-year reversal probabilities from central obesity to normal WC were 44.19% (ages 6–11) and 41.39% (ages 12–14), decreasing to 26.93% for ages 15–17. Among those aged 15–17 years with central obesity, boys had a > 80% probability of maintaining increased WC for 20 years. Conclusion Ages 6–14 years represent a critical “reversal period” for central obesity. Interventions should prioritize this window using age- and sex-specific strategies to maximize normalization and curb long-term obesity risk. -
Key words:
- Children and adolescents /
- Central obesity /
- Waist circumference /
- Life course epidemiology
The authors declare that they have no competing interests.
The China Health and Nutrition Survey (CHNS) was approved by the Institutional Review Board of the University of North Carolina at Chapel Hill (No. 07-1963) and the National Institute for Nutrition and Health, Chinese Center for Disease Control and Prevention (Nos. 201524, 2018-004, and 2022-024). Written informed consent was obtained from all participants or their legal guardians before data collection. This analysis was additionally approved by the Ethics Committee of the National Institute for Nutrition and Health, Chinese Center for Disease Control and Prevention (Approval No. 2024-012), and was conducted in accordance with the principles of the Declaration of Helsinki.
Conceptualization: Wenwen Du, Huijun Wang, and Aidong Liu; Data Curation: Weiwei Zhou, Hanyi Li, Feifei Huang, Jiguo Zhang, Chang Su, Xiaofang Jia, and Xianglin Qin; Formal Analysis: Weiwei Zhou; Methodology: Wenwen Du, Huijun Wang, and Aidong Liu; Project Administration: Wenwen Du, Huijun Wang, and Aidong Liu; Supervision: Wenwen Du, Huijun Wang, and Aidong Liu; Writing—original draft: Weiwei Zhou; Writing—review & editing: Weiwei Zhou, Hanyi Li, Feifei Huang, Jiguo Zhang, Chang Su, Xiaofang Jia, Xianglin Qin, Wenwen Du, Huijun Wang, and Aidong Liu.
The China Health and Nutrition Survey (CHNS) data from 1989 to 2015 are openly accessible and can be downloaded from the official CHNS website (https://chns.cpc.unc.edu/). Data collected after 2015 are held by the National Institute for Nutrition and Health, Chinese Center for Disease Control and Prevention, and are not publicly available due to data ownership and access restrictions. The supplementary materials will be available in www.besjournal.com.
注释:1) Funding: 2) Competing Interests: 3) Ethics: 4) Authors’ Contributions: 5) Date Sharing: -
Figure 1. Changes in waist circumference (WC) and central adiposity across the life course (A–F). The modeled curves were based on 2,440 participants aged 6–17 years at baseline who were followed for up to 29 years (through 2022), extending into their 40 s.
Figure 2. Probabilities of maintenance and transition by baseline waist circumference (WC) status. (A) Normal WC at baseline. (B) Central overweight at baseline. (C) Central obesity at baseline.
Figure 4. Age-specific probabilities of waist circumference (WC) status transitions during follow-up. (A) Normal WC at baseline. (B) Central overweight at baseline. (C) Central obesity at baseline.
Figure 5. Age- and sex-specific probabilities of waist circumference (WC) status transitions during follow-up. (A) Normal WC at baseline. (B) Central overweight at baseline. (C) Central obesity at baseline.
Table 1. Characteristics of the study participants
Total 6–17 years Baseline age group (years) 6–11 12–14 15–17 N 2,440 1,275 706 459 Baseline WC (cm), mean ± SD 62.3 (10.0) 58.1 (9.1) 65.7 (8.6) 69.0 (8.5) Baseline WC status, N (%) Normal 1,838 (75.32) 955 (74.90) 538 (76.21) 345 (75.16) Central overweight 331 (13.57) 183 (14.35) 87 (12.32) 61 (13.29) Central obesity 271 (11.11) 137 (10.75) 81 (11.47) 53 (11.55) Follow-up length (year), median (IQR: P25, P75) 7 (4, 16) 7 (4, 13) 9 (4, 18) 11 (4, 21) Boys N 1,311 654 383 274 Baseline WC (cm), mean ± SD 63.5 (10.0) 59.4 (8.9) 66.0 (9.2) 70.0 (8.8) Baseline WC status, N (%) Normal 1,011 (77.12) 503 (76.91) 298 (77.81) 210 (76.64) Central overweight 160 (12.20) 82 (12.54) 44 (11.49) 34 (12.41) Central obesity 140 (10.68) 69 (10.55) 41 (10.70) 30 (10.95) Follow-up length (year), median (IQR: P25, P75) 11 (5, 18) 7 (4, 14) 13 (6, 21) 15 (7, 22) Girls N 1,129 621 323 185 Baseline WC (cm), mean ± SD 61.0 (9.8) 56.7 (9.1) 65.3 (7.9) 67.6 (7.7) Baseline WC status, N (%) Normal 827 (73.25) 452 (72.79) 240 (74.31) 135 (72.98) Central overweight 171 (15.15) 101 (16.26) 43 (13.31) 27 (14.59) Central obesity 131 (11.60) 68 (10.95) 40 (12.38) 23 (12.43) Follow-up length (year), median (IQR: P25, P75) 7 (4, 11) 7 (3, 12) 7 (4, 11) 7 (3, 12) Note. IQR, interquartile range; SD, standard deviation; WC, waist circumference. Percentages in this table are presented to two decimal places. Minor discrepancies due to rounding were adjusted by ± 0.01% in the category with the largest proportion to ensure that the total equals 100.00%. All values were calculated based on the original exact data, and these adjustments do not affect the substantive meaning or interpretation of the results.  下载: 导出CSV
-
[1] GBD 2021 Adolescent BMI Collaborators. Global, regional, and national prevalence of child and adolescent overweight and obesity, 1990-2021, with forecasts to 2050: a forecasting study for the Global Burden of Disease Study 2021. Lancet, 2025; 405, 785−812. doi: 10.1016/S0140-6736(25)00397-6 [2] Rubino F, Cummings DE, Eckel RH, et al. Definition and diagnostic criteria of clinical obesity. Lancet Diabetes Endocrinol, 2025; 13, 221−62. doi: 10.1016/S2213-8587(24)00316-4 [3] Wildman RP, Muntner P, Reynolds K, et al. The obese without cardiometabolic risk factor clustering and the normal weight with cardiometabolic risk factor clustering: prevalence and correlates of 2 phenotypes among the US population (NHANES 1999-2004). Arch Intern Med, 2008; 168, 1617−24. [4] Ross R, Neeland IJ, Yamashita S, et al. Waist circumference as a vital sign in clinical practice: a Consensus Statement from the IAS and ICCR Working Group on Visceral Obesity. Nat Rev Endocrinol, 2020; 16, 177−89. doi: 10.1038/s41574-019-0310-7 [5] Zhang ST, Li WY, Jia XF, et al. Association of obesity profiles with type 2 diabetes in Chinese adults: findings from the China health and nutrition survey. Front Nutr, 2022; 9, 922824. doi: 10.3389/fnut.2022.922824 [6] Klein S, Gastaldelli A, Yki-Järvinen H, et al. Why does obesity cause diabetes? Cell Metab, 2022; 34, 11-20. [7] Ndumele CE, Neeland IJ, Tuttle KR, et al. A synopsis of the evidence for the science and clinical management of Cardiovascular-Kidney-Metabolic (CKM) syndrome: a scientific statement from the American Heart Association. Circulation, 2023; 148, 1636−64. doi: 10.1161/CIR.0000000000001186 [8] Powell-Wiley TM, Poirier P, Burke LE, et al. Obesity and cardiovascular disease: a scientific statement from the American Heart Association. Circulation, 2021; 143, e984−1010. [9] Yang M, Liu J, Shen Q, et al. Body roundness index trajectories and the incidence of cardiovascular disease: evidence from the China health and retirement longitudinal study. J Am Heart Assoc, 2024; 13, e034768. doi: 10.1161/JAHA.124.034768 [10] Jayedi A, Soltani S, Zargar MS, et al. Central fatness and risk of all cause mortality: systematic review and dose-response meta-analysis of 72 prospective cohort studies. BMJ, 2020; 370, m3324. [11] Xiao TL, Yuan SQ, Gao JY, et al. Predictive ability of Hypertriglyceridemic waist, Hypertriglyceridemic waist-to-height ratio, and waist-to-hip ratio for cardiometabolic risk factors clustering screening among Chinese children and adolescents. Biomed Environ Sci, 2024; 37, 233−41. [12] Wong MCS, Huang JJ, Wang JX, et al. Global, regional and time-trend prevalence of central obesity: a systematic review and meta-analysis of 13.2 million subjects. Eur J Epidemiol, 2020; 35, 673−83. [13] Nan J, Chen ML, Yuan HT, et al. Waist circumference status and distribution in Chinese adults: China nutrition and health surveillance (2015-2017). Biomed Environ Sci, 2025; 38, 757−62. [14] Zhang ST, Zhang JG, Jia XF, et al. Secular trends in central obesity prevalence and demographic and socioeconomic factors of adults aged 18-35 years in 15 provinces (autonomous regions and municipalities) of China from 1993 to 2018. J Environ Occup Med, 2022; 39, 323−30. (In Chinese) [15] Xiong Y, Tang YJ, Zhou J, et al. Childhood adiposity and risk of major clinical heart diseases in adulthood: a mendelian randomization study. J Am Heart Assoc, 2024; 13, e035365. doi: 10.1161/JAHA.124.035365 [16] Dong YH, Ma J, Song Y, et al. Secular trends in blood pressure and overweight and obesity in Chinese boys and girls aged 7 to 17 years from 1995 to 2014. Hypertension, 2018; 72, 298−305. doi: 10.1161/HYPERTENSIONAHA.118.11291 [17] Feng L, Nian SY, Tong ZW, et al. Age-related trends in lipid levels: a large-scale cross-sectional study of the general Chinese population. BMJ Open, 2020; 10, e034226. doi: 10.1136/bmjopen-2019-034226 [18] Peng X, Zhang BS, Chen ZX, et al. Association between urinary phthalate and bisphenol exposures and obesity based on body mass index and waist circumference. Biomed Environ Sci, 2025; 38, 1155−60. [19] Simmonds M, Llewellyn A, Owen CG, et al. Predicting adult obesity from childhood obesity: a systematic review and meta-analysis. Obes Rev, 2016; 17, 95−107. doi: 10.1111/obr.12334 [20] Gao CN, Meng X, Liu W, et al. Identification of sensitive periods of weight status transition over the lifespan in Chinese population. BMC Med, 2024; 22, 507. doi: 10.1186/s12916-024-03721-4 [21] Wagner C, Carmeli C, Jackisch J, et al. Life course epidemiology and public health. Lancet Public Health, 2024; 9, e261−9. doi: 10.1016/S2468-2667(24)00018-5 [22] Zhang B, Zhai FY, Du SF, et al. The China health and nutrition survey, 1989-2011. Obes Rev, 2014; 15 Suppl 1, 2-7. [23] Zong XN, Li H, Zhang YQ, et al. Percentile reference value of waist circumference for Chinese children aged 3-7 years. Chin J Epidemiol, 2020; 41, 1286−90. (In Chinese) [24] Ma GS, Ji CY, Ma J, et al. Waist circumference reference values for screening cardiovascular risk factors in Chinese children and adolescents aged 7-18 years. Chin J Epidemiol, 2010; 31, 609−15. (In Chinese) [25] National Health and Family Planning Commission of the People's Republic of China. (2013). WS/T 428-2013 Criteria of weight for adults. (In Chinese)https://www.nhc.gov.cn/wjw/yingyang/201308/a233d450fdbc47c5ad4f08b7e394d1e8.shtml [26] World Health Organization. Global accelerated action for the health of adolescents (AA-HA!): guidance to support country implementation. 2nd ed. World Health Organization. 2023. [27] Casals M, Girabent-Farrés M, Carrasco JL. Methodological quality and reporting of generalized linear mixed models in clinical medicine (2000-2012): a systematic review. PLoS One, 2014; 9, e112653. doi: 10.1371/journal.pone.0112653 [28] Halfon N, Forrest CB. The emerging theoretical framework of life course health development. In: Halfon N, Forrest CB, Lerner RM, et al. Handbook of Life Course Health Development. Springer. 2018, 19-43. [29] Volger S, Rigassio Radler D, Rothpletz-Puglia P. Early childhood obesity prevention efforts through a life course health development perspective: a scoping review. PLoS One, 2018; 13, e0209787. doi: 10.1371/journal.pone.0209787 [30] Nielsen J, Hulman A, Narayan KMV, et al. Body mass index trajectories from childhood to adulthood and age at onset of overweight and obesity: the influence of parents' weight status. Am J Epidemiol, 2022; 191, 1877−85. doi: 10.1093/aje/kwac124 [31] Ziauddeen N, Roderick PJ, Macklon NS, et al. Predicting childhood overweight and obesity using maternal and early life risk factors: a systematic review. Obes Rev, 2018; 19, 302−12. doi: 10.1111/obr.12640 [32] Matsumoto N, Kubo T, Nakamura K, et al. Trajectory of body mass index and height changes from childhood to adolescence: a nationwide birth cohort in Japan. Sci Rep, 2021; 11, 23004. doi: 10.1038/s41598-021-02464-z [33] Suh J, Jeon YW, Lee JH, et al. Annual incidence and prevalence of obesity in childhood and young adulthood based on a 30-year longitudinal population-based cohort study in Korea: the Kangwha study. Ann Epidemiol, 2021; 62, 1−6. [34] Ward ZJ, Long MW, Resch SC, et al. Simulation of growth trajectories of childhood obesity into adulthood. N Engl J Med, 2017; 377, 2145−53. doi: 10.1056/NEJMoa1703860 [35] Song XL, Zhou B, Baird S, et al. Trends and predictions to 2030 in demographic structures and metabolic health for children and adolescents in China: analysis of national school health surveys from 2000 to 2019. Lancet Child Adolesc Health, 2025; 9, 530−43. doi: 10.1016/S2352-4642(25)00140-3 [36] World Obesity Federation. World obesity atlas 2025. World Obesity Federation. 2025. [37] Dong YH, Yuan CZ, Dang JJ, et al. Control of childhood obesity and implications for policy in China. Lancet Public Health, 2024; 9, e1125−35. doi: 10.1016/S2468-2667(24)00263-9 [38] Pan XF, Wang LM, Pan A. Epidemiology and determinants of obesity in China. Lancet Diabetes Endocrinol, 2021; 9, 373−92. doi: 10.1016/S2213-8587(21)00045-0 [39] Koceva A, Herman R, Janez A, et al. Sex- and gender-related differences in obesity: from pathophysiological mechanisms to clinical implications. Int J Mol Sci, 2024; 25, 7342. doi: 10.3390/ijms25137342 [40] Karastergiou K, Smith SR, Greenberg AS, et al. Sex differences in human adipose tissues - the biology of pear shape. Biol Sex Differ, 2012; 3, 13. doi: 10.1186/2042-6410-3-13 [41] Jackson AS, Stanforth PR, Gagnon J, et al. The effect of sex, age and race on estimating percentage body fat from body mass index: the Heritage Family Study. Int J Obes, 2002; 26, 789−96. [42] Christen T, Trompet S, Noordam R, et al. Sex differences in body fat distribution are related to sex differences in serum leptin and adiponectin. Peptides, 2018; 107, 25−31. doi: 10.1016/j.peptides.2018.07.008 [43] Mauvais-Jarvis F. Sex differences in energy metabolism: natural selection, mechanisms and consequences. Nat Rev Nephrol, 2024; 20, 56−69. doi: 10.1038/s41581-023-00781-2 [44] Palmer BF, Clegg DJ. The sexual dimorphism of obesity. Mol Cell Endocrinol, 2015; 402, 113−9. doi: 10.1016/j.mce.2014.11.029 [45] Gavin KM, Bessesen DH. Sex differences in adipose tissue function. Endocrinol Metab Clin North Am, 2020; 49, 215−28. [46] He J, Xie YX. The sociocultural mechanism of obesity: the influence of gender role attitudes on obesity and the gender gap. Soc Sci Med, 2022; 293, 114655. doi: 10.1016/j.socscimed.2021.114655 [47] Ata RN, Ludden AB, Lally MM. The effects of gender and family, friend, and media influences on eating behaviors and body image during adolescence. J Youth Adolesc, 2007; 36, 1024−37. doi: 10.1007/s10964-006-9159-x [48] Dougherty EN, Goldschmidt AB, Johnson NK, et al. Gender differences in the relation between interpersonal stress and momentary shape and weight concerns in youth with overweight/obesity. Body Image, 2022; 40, 249−55. doi: 10.1016/j.bodyim.2022.01.006 [49] Marcus C, Danielsson P, Hagman E. Pediatric obesity-long-term consequences and effect of weight loss. J Intern Med, 2022; 292, 870−91. doi: 10.1111/joim.13547 [50] Yan YK, Hou DQ, Liang YJ, et al. Tracking body mass index from childhood to adulthood for subclinical cardiovascular diseases at adulthood. J Am Coll Cardiol, 2016; 67, 1006−7. doi: 10.1016/j.jacc.2015.12.013 [51] Yuan CZ, Dong YH, Chen H, et al. Public health interventions against childhood obesity in China. Lancet Public Health, 2024; 9, e1115−24. doi: 10.1016/S2468-2667(24)00245-7 -

 点击查看大图
计量
- 文章访问数: 0
- HTML全文浏览量: 0
- PDF下载量: 0
- 被引次数: 0

 Quick Links