

 下载:
下载:

-
Frailty has emerged as a prevalent issue among older adults, with epidemiological studies indicating that its prevalence may be as high as 26%. It is a nonspecific, age-related condition marked by increased vulnerability owing to the accumulation of various deficits[1]. With the largest elderly population globally, China is projected to experience a further increase in its population in the coming years, which may pose significant challenges[2]. The prevalence of frailty among older adults in China is notably elevated[3], leading to considerable economic and healthcare burdens on society.
Fine particulate matter (PM2.5) adversely affects human health, particularly in older adults. It is a complex mixture that often includes sulfate (SO42-), nitrate (NO3-), ammonium (NH4+), organic components, and heavy metals. Short- and long-term exposure to these pollutants can impair physical function and cause various health problems. Several studies have linked ambient air pollutants, particularly PM2.5 to frailty[4]. Although some studies have examined the association between PM2.5 and frailty, evidence in rural populations remains limited. Rural residents often have poorer health because of limited access to healthcare and socioeconomic disadvantages[5]. In rural areas of China, PM2.5 levels may be elevated and differ in composition because of fuel combustion, agricultural activities, and industrial emissions. However, no studies have directly examined the relationship between PM2.5 components and frailty. Therefore, this study investigated the associations between PM2.5 and its components and frailty in rural populations to identify harmful components and develop targeted prevention strategies.
The participants in this study were selected from the second-wave survey of the Henan Rural Cohort Study conducted between 2018 and 2022. Further details regarding the cohort have been reported in prior publications[6]. A total of 23,937 participants aged ≥ 45 years were included in the study. The detailed selection process is shown in Supplementary Figure S1. The concentrations of PM2.5 and its five components (black carbon [BC], nitrate [NO3-], ammonium [NH4+], sulfate [SO42-], and organic matter [OM]) were obtained from the Tracking Air Pollution in China (TAP) dataset (https://tapdata.org.cn/). The TAP dataset provides 10-km resolution concentration data of atmospheric fine particulate matter components in China from 2000 to the present[7]. In this study, the Baidu Map API was used for geocoding based on each participant’s residential address to generate precise latitude and longitude coordinates. These coordinates were matched with the TAP dataset to assign daily average concentrations of PM2.5 and its components to each participant’s location. The average concentrations of PM2.5 and its components during the three years preceding the baseline survey were calculated for each participant and used as surrogate measures of exposure.
Frailty was evaluated using the Frailty Index (FI), which was calculated by aggregating multiple age-related health deficits. Based on previous research[8], 29 items were selected to construct the FI (Supplementary Table S1). Items were scored as 1 (presence of a deficit) or 0 (absence of a deficit). For each participant, the FI was computed as the sum of the item scores divided by the total number of items. A higher FI indicates a greater degree of frailty. Participants were categorized as robust (FI ≤ 0.10), prefrail (0.10 < FI < 0.25), or frail (FI ≥ 0.25), consistent with prior studies[9].
Participant characteristics were described as numbers (percentages) for categorical variables and as means ± SD for continuous variables. One-way ANOVA and chi-square tests were used to compare differences among the robust, prefrail, and frail groups. Spearman’s correlation was used to assess pairwise associations between PM2.5 and its chemical constituents. Generalized linear models were used to examine the associations between PM2.5, its components, and prefrailty and frailty. Single-component models assessed each pollutant individually. Component-PM2.5 models were further adjusted for total PM2.5 to evaluate the contribution of each component independent of overall PM2.5. To address multicollinearity, component–residual models replaced each component with its residual obtained by regressing that component on total PM2.5, thereby providing an approximate estimate of its independent effect. Restricted cubic splines (three degrees of freedom) were fitted to model exposure–response associations between air pollutants and prefrailty and frailty prevalence. The cumulative mixed effect of PM2.5 components on the outcome was evaluated using weighted quantile sum (WQS) regression. Stratified analyses were conducted across subgroups defined by age, sex, marital status, educational level, per capita monthly income, smoking status, high-fat diet, and adequate vegetable and fruit intakes. Effect modification was evaluated using multiplicative interaction terms. Several sensitivity analyses were performed to assess robustness. Because the cutoff value for FI remains debated, two alternative definitions were applied. For cutoff value 1, robust, prefrailty, and frailty were defined as FI ≤ 0.10, 0.10 < FI ≤ 0.21, and FI > 0.21. For cutoff value 2, robust, prefrailty, and frailty were defined as FI ≤ 0.08, 0.08 < FI < 0.25, and FI ≥ 0.25[9]. All statistical analyses were conducted using IBM SPSS (version21.0; Armonk, NY, USA) and R software (version 4.1.2; R Core Team). Statistical significance was defined as a two-tailed P < 0.05.
To provide biological context, a network toxicology analysis was conducted. Potential targets of PM2.5 and its components were identified using public databases. Targets for PM2.5, BC, and polycyclic aromatic hydrocarbons (PAHs) were retrieved from the Comparative Toxicogenomics Database, whereas targets for inorganic ions (SO42-, NO3-, and NH4+) were obtained by querying GeneCards using SMILES identifiers retrieved from PubChem. Gene symbols were standardized using UniProt and filtered using a GeneCards score > 0.5. Frailty-related genes were collected from GeneCards and the Therapeutic Target Database using the terms “frailty” and “prefrailty.” Overlapping genes were identified and subjected to protein–protein interaction analysis using STRING (confidence score ≥ 0.700), with network visualization and hub gene identification performed in Cytoscape. Functional roles and pathways were explored using Gene Ontology (GO) and Kyoto Encyclopedia of Genes and Genomes (KEGG) enrichment analyses, with significance defined as FDR < 0.05.
The FI showed a right-skewed distribution with age (Supplementary Figure S2). The mean FI across all participants was 0.12 (SD 0.07) (Supplementary Table S2). Baseline characteristics of the study population are summarized in Supplementary Table S3. In total, 12,483 (51.96%) and 1,341 (5.6%) participants were classified as prefrail and frail, respectively. Supplementary Figure S3 illustrates the correlation between 3-year mean concentrations of ambient PM2.5 and its components. Table 1 shows that each SD (9.17 μg/m3) increase in PM2.5 was associated with a higher risk of frailty (OR = 1.394, 95% CI: 1.311–1.482). Each SD increase in PM2.5 concentration was associated with significantly increased odds of frailty. Specifically, the odds ratios ranged from 1.370 to 1.404, suggesting a positive association between higher pollutant exposure and increased risk of frailty. PM2.5 is a fine particulate matter that can be easily inhaled and enters the body, causing various health issues. These particles enter the bloodstream and circulate throughout the body, leading to significant health threats. Studies have suggested that air pollution and prolonged exposure to PM2.5 can increase oxidative stress by inducing chronic systemic changes that damage cellular and molecular structures[10]. Reactive oxygen species (ROS), acting as second messengers, activate the NF-κB signaling pathway and induce the transcription of pro-inflammatory cytokines such as TNF-α and IL-6. This process may contribute to disrupting physiological homeostasis, accelerating age-related functional decline, ultimately increasing the risk of frailty, and exerting widespread adverse effects on health across multiple physiological systems.
Table 1. Associations of 3-year averaged PM2.5 and its components (each SD increment) with prefrailty and frailty
Pollution Single-pollutant modela
OR (95% CI)Component-PM2.5 modelb
OR (95% CI)Component-residual modelc
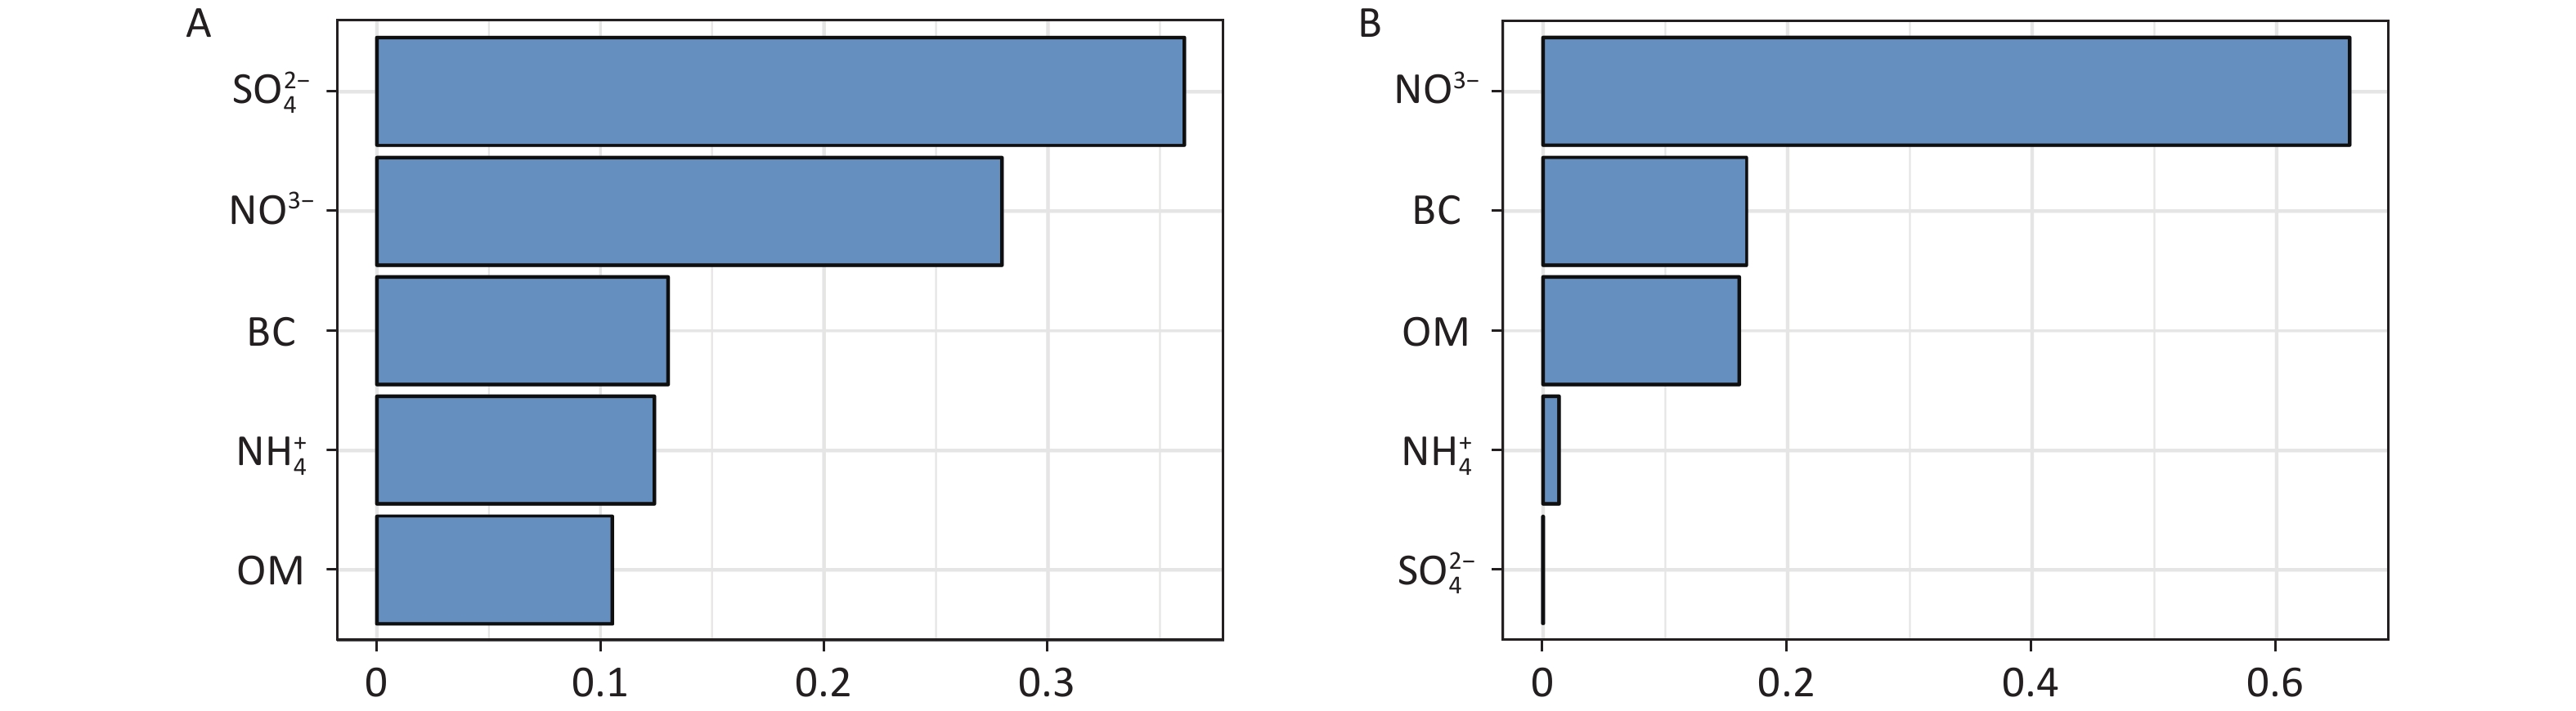
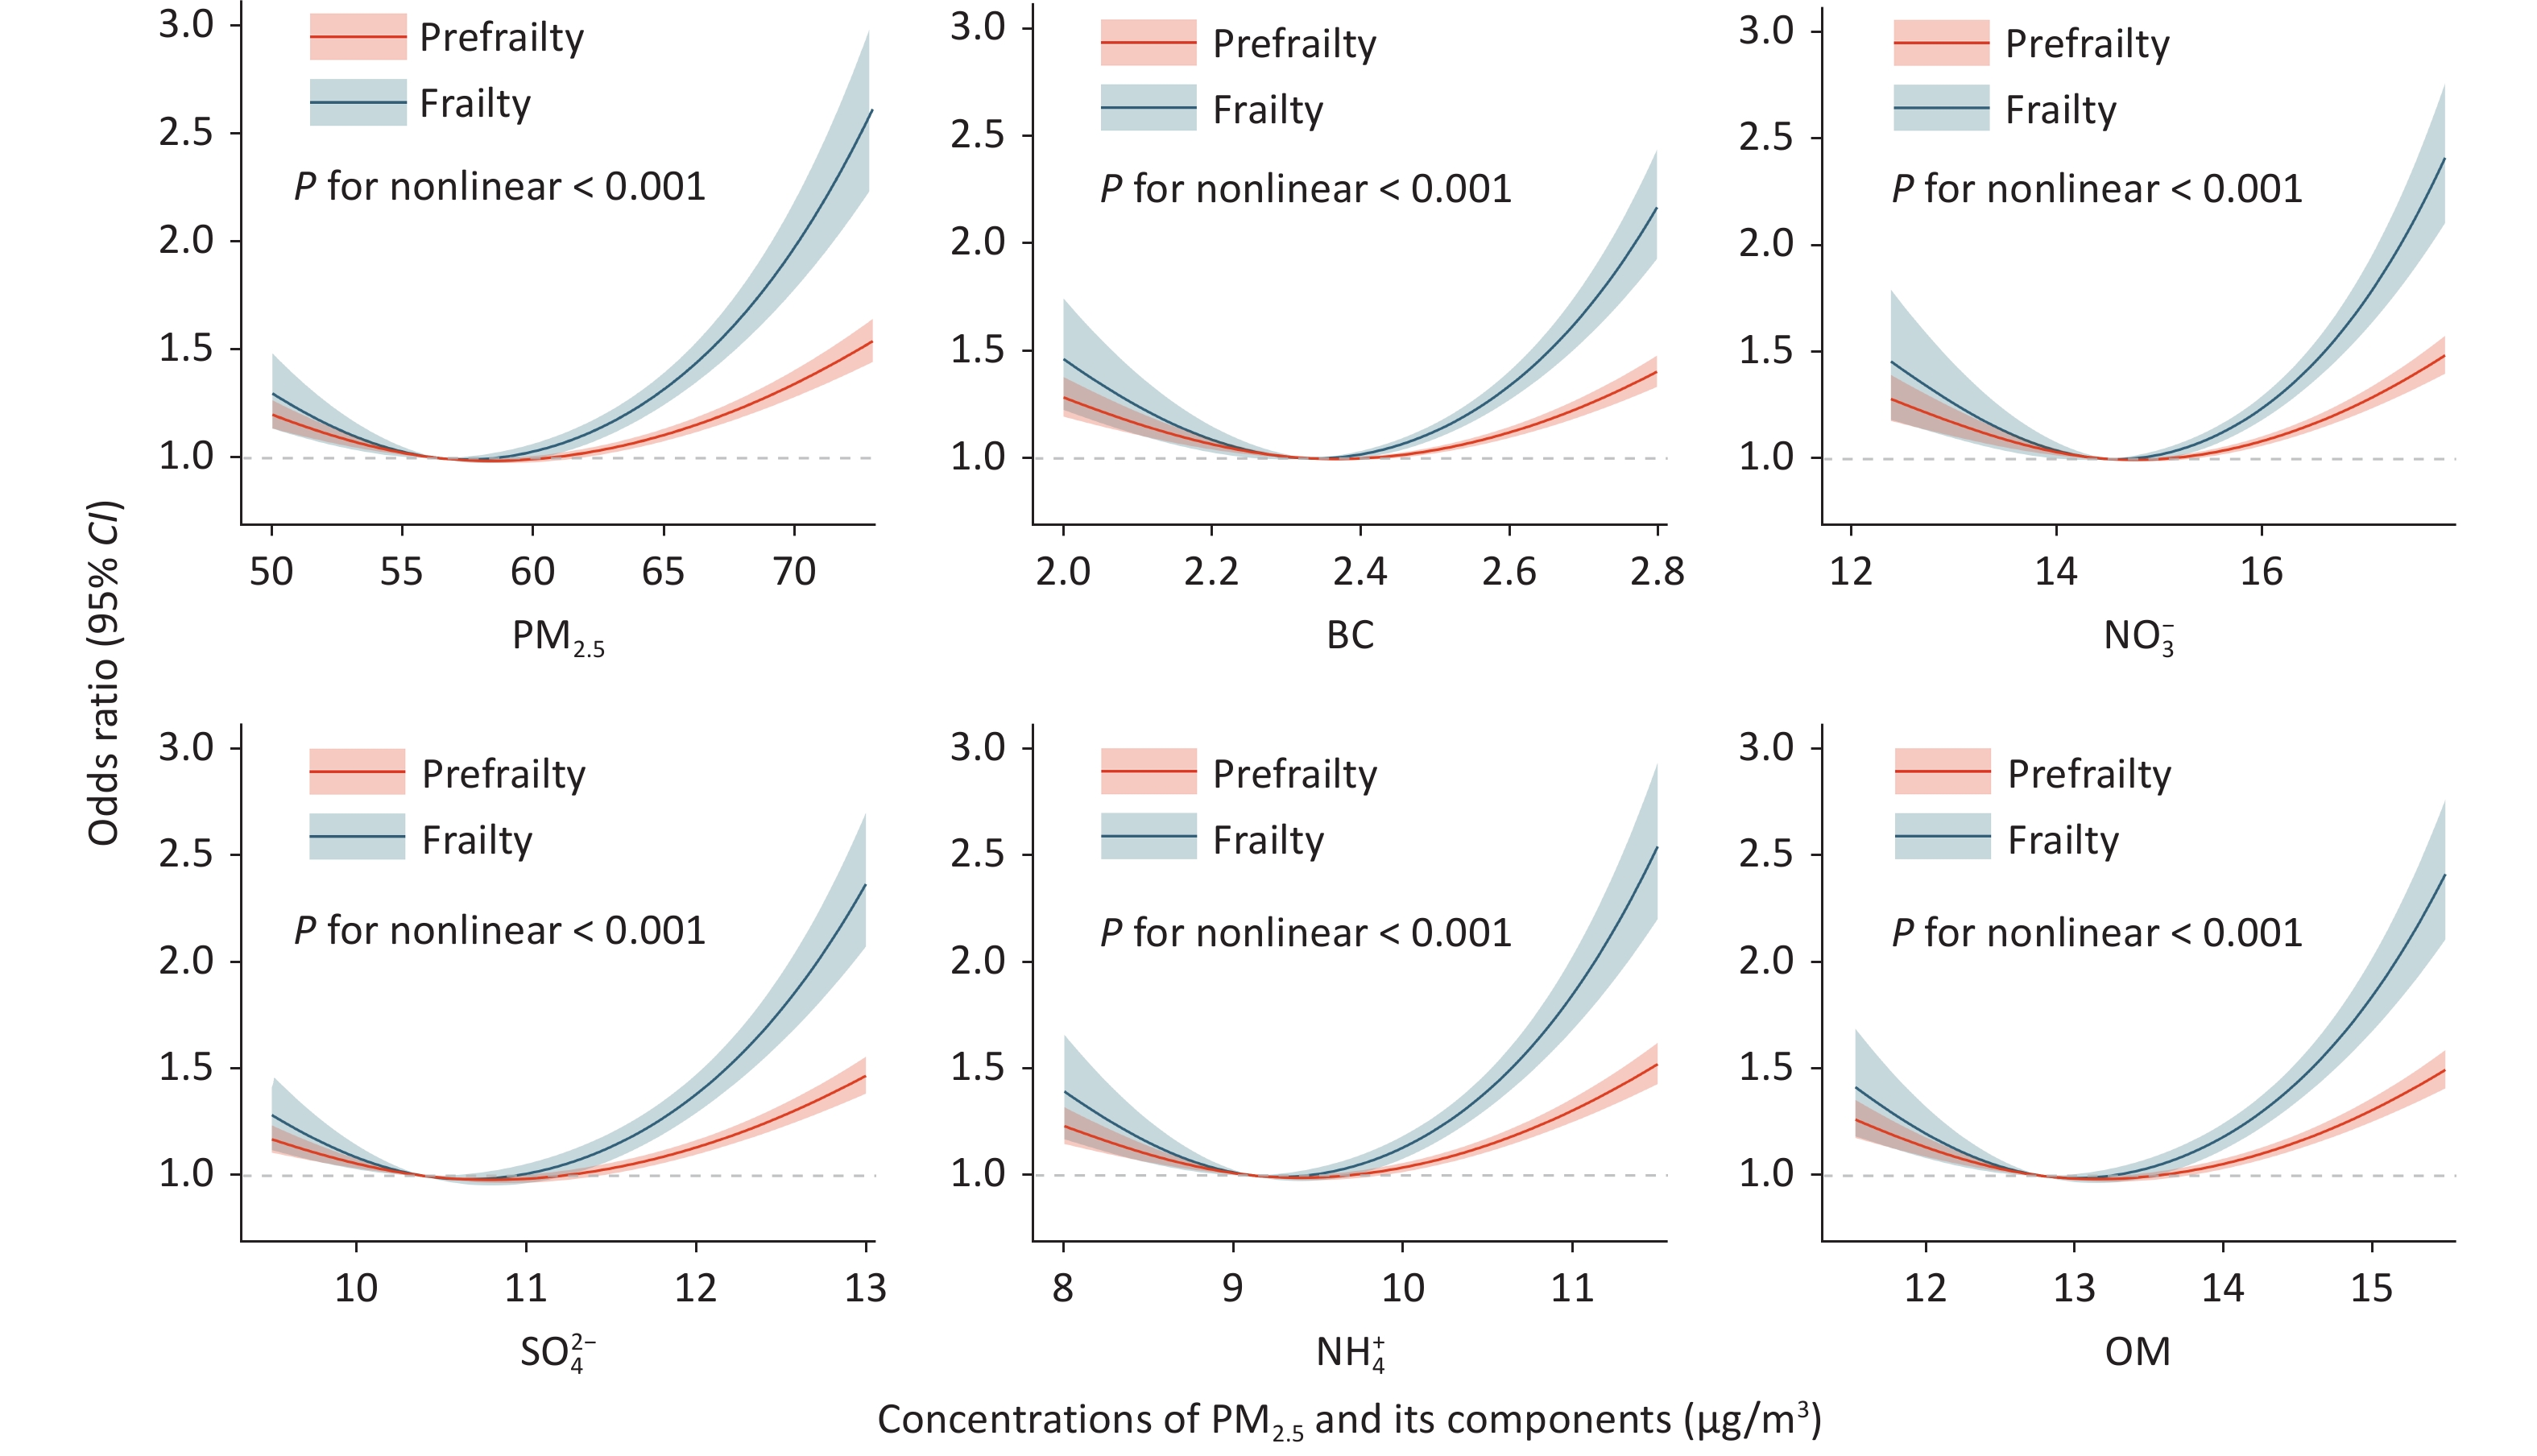
OR (95% CI)Prefrailty PM2.5 1.131 (1.100, 1.163) − − BC 1.117 (1.086, 1.149) 0.231 (0.170, 0.314)† 0.011 (0.004, 0.027)† NO3− 1.137 (1.106, 1.169) 1.525 (1.226, 1.895) 1.256 (1.130, 1.397) SO42- 1.143 (1.112, 1.175) 1.554 (1.327, 1.819) 1.371 (1.235, 1.521) NH4+ 1.140 (1.108, 1.172) 1.440 (1.222, 1.698) 1.339 (1.188, 1.509) OM 1.138 (1.107, 1.170) 1.274 (1.111, 1.460) 1.180 (1.085, 1.284) Frailty PM2.5 1.394 (1.311, 1.482) − − BC 1.370 (1.288, 1.459) 0.084 (0.041, 0.170)† 0.000 (0.000, 0.004)† NO3− 1.400 (1.316, 1.488) 1.726 (1.027, 2.902) 1.359 (1.060, 1.742) SO42- 1.404 (1.321, 1.492) 1.822 (1.244, 2.669) 1.627 (1.267, 2.090) NH4+ 1.400 (1.317, 1.488) 1.576 (1.063, 2.336) 1.521 (1.146, 2.018) OM 1.398 (1.316, 1.486) 1.415 (1.021, 1.961) 1.320 (1.083, 1.608) Note. OR, odds ratio; 95% CI, 95% confidence interval; PM2.5, particulate matter with an aerodynamic diameter ≤ 2.5 μm; BC, Black carbon; NO3−, nitrate; SO42-, Sulfate; NH4+, ammonium; OM, organic matter. Model was adjusted for age, sex, marital status, educational level, per capita monthly income, smoking status, drinking status, high-fat, and vegetable and fruit intake. a PM2.5 and its components were included by origin value to assess the associations with outcomes. b additionally adjust for PM2.5 mass based on single-pollutant model. c The original value was replaced with the residual of each component of PM2.5, based on the single-pollutant model. † The extremely low odds ratios for BC likely reflect high multicollinearity and residualization, indicating limited independent information beyond other PM2.5. Nonlinear exposure–response analyses revealed that the risk of prefrailty and frailty increased with increasing pollutant concentrations (P for nonlinear < 0.05) (Figure 1). The relative contributions (weights) of the individual PM2.5 components to prefrailty and frailty using weighted quantile sum (WQS) regression are shown in Figure 2. Panel A indicates that SO42- and NO3- had the highest weights, suggesting that they are the main contributors to prefrailty risk. Panel B suggests that NO3- and BC had the highest weights, indicating their potential role in frailty progression. Supplementary Figures S4–S5 show the results of stratified analyses. The associations between PM2.5, its components, and prefrailty and frailty vary across different subgroups, indicating that factors such as age, sex, marital status, educational level, per capita monthly income, smoking status, drinking status, high-fat diet, and adequate vegetable and fruit intake may modify the relationship between PM2.5, prefrailty, and frailty. Participants who were older (over 60 years), female, had lower educational level, lower monthly income, never smoked, and drank appeared more susceptible to the effects of PM2.5 mass and its components. The associations between PM2.5 components and frailty were robust in the sensitivity analyses (Supplementary Tables S6–S7). These findings may be explained by differences in biological susceptibility, lifestyle, and socioeconomic conditions across subgroups. Older adults and women may be more vulnerable due to age-related functional decline, hormonal differences, and reduced physiological reserves. Lower educational and income levels are often associated with poorer baseline health, limited access to healthcare, and higher cumulative environmental exposure, which may amplify the adverse effects of air pollution. Never-smokers and drinkers may show stronger associations because the main effects of smoking and drinking on health may mask the relative contribution of PM2.5. In addition, a healthy survival effect may occur among smokers and drinkers.
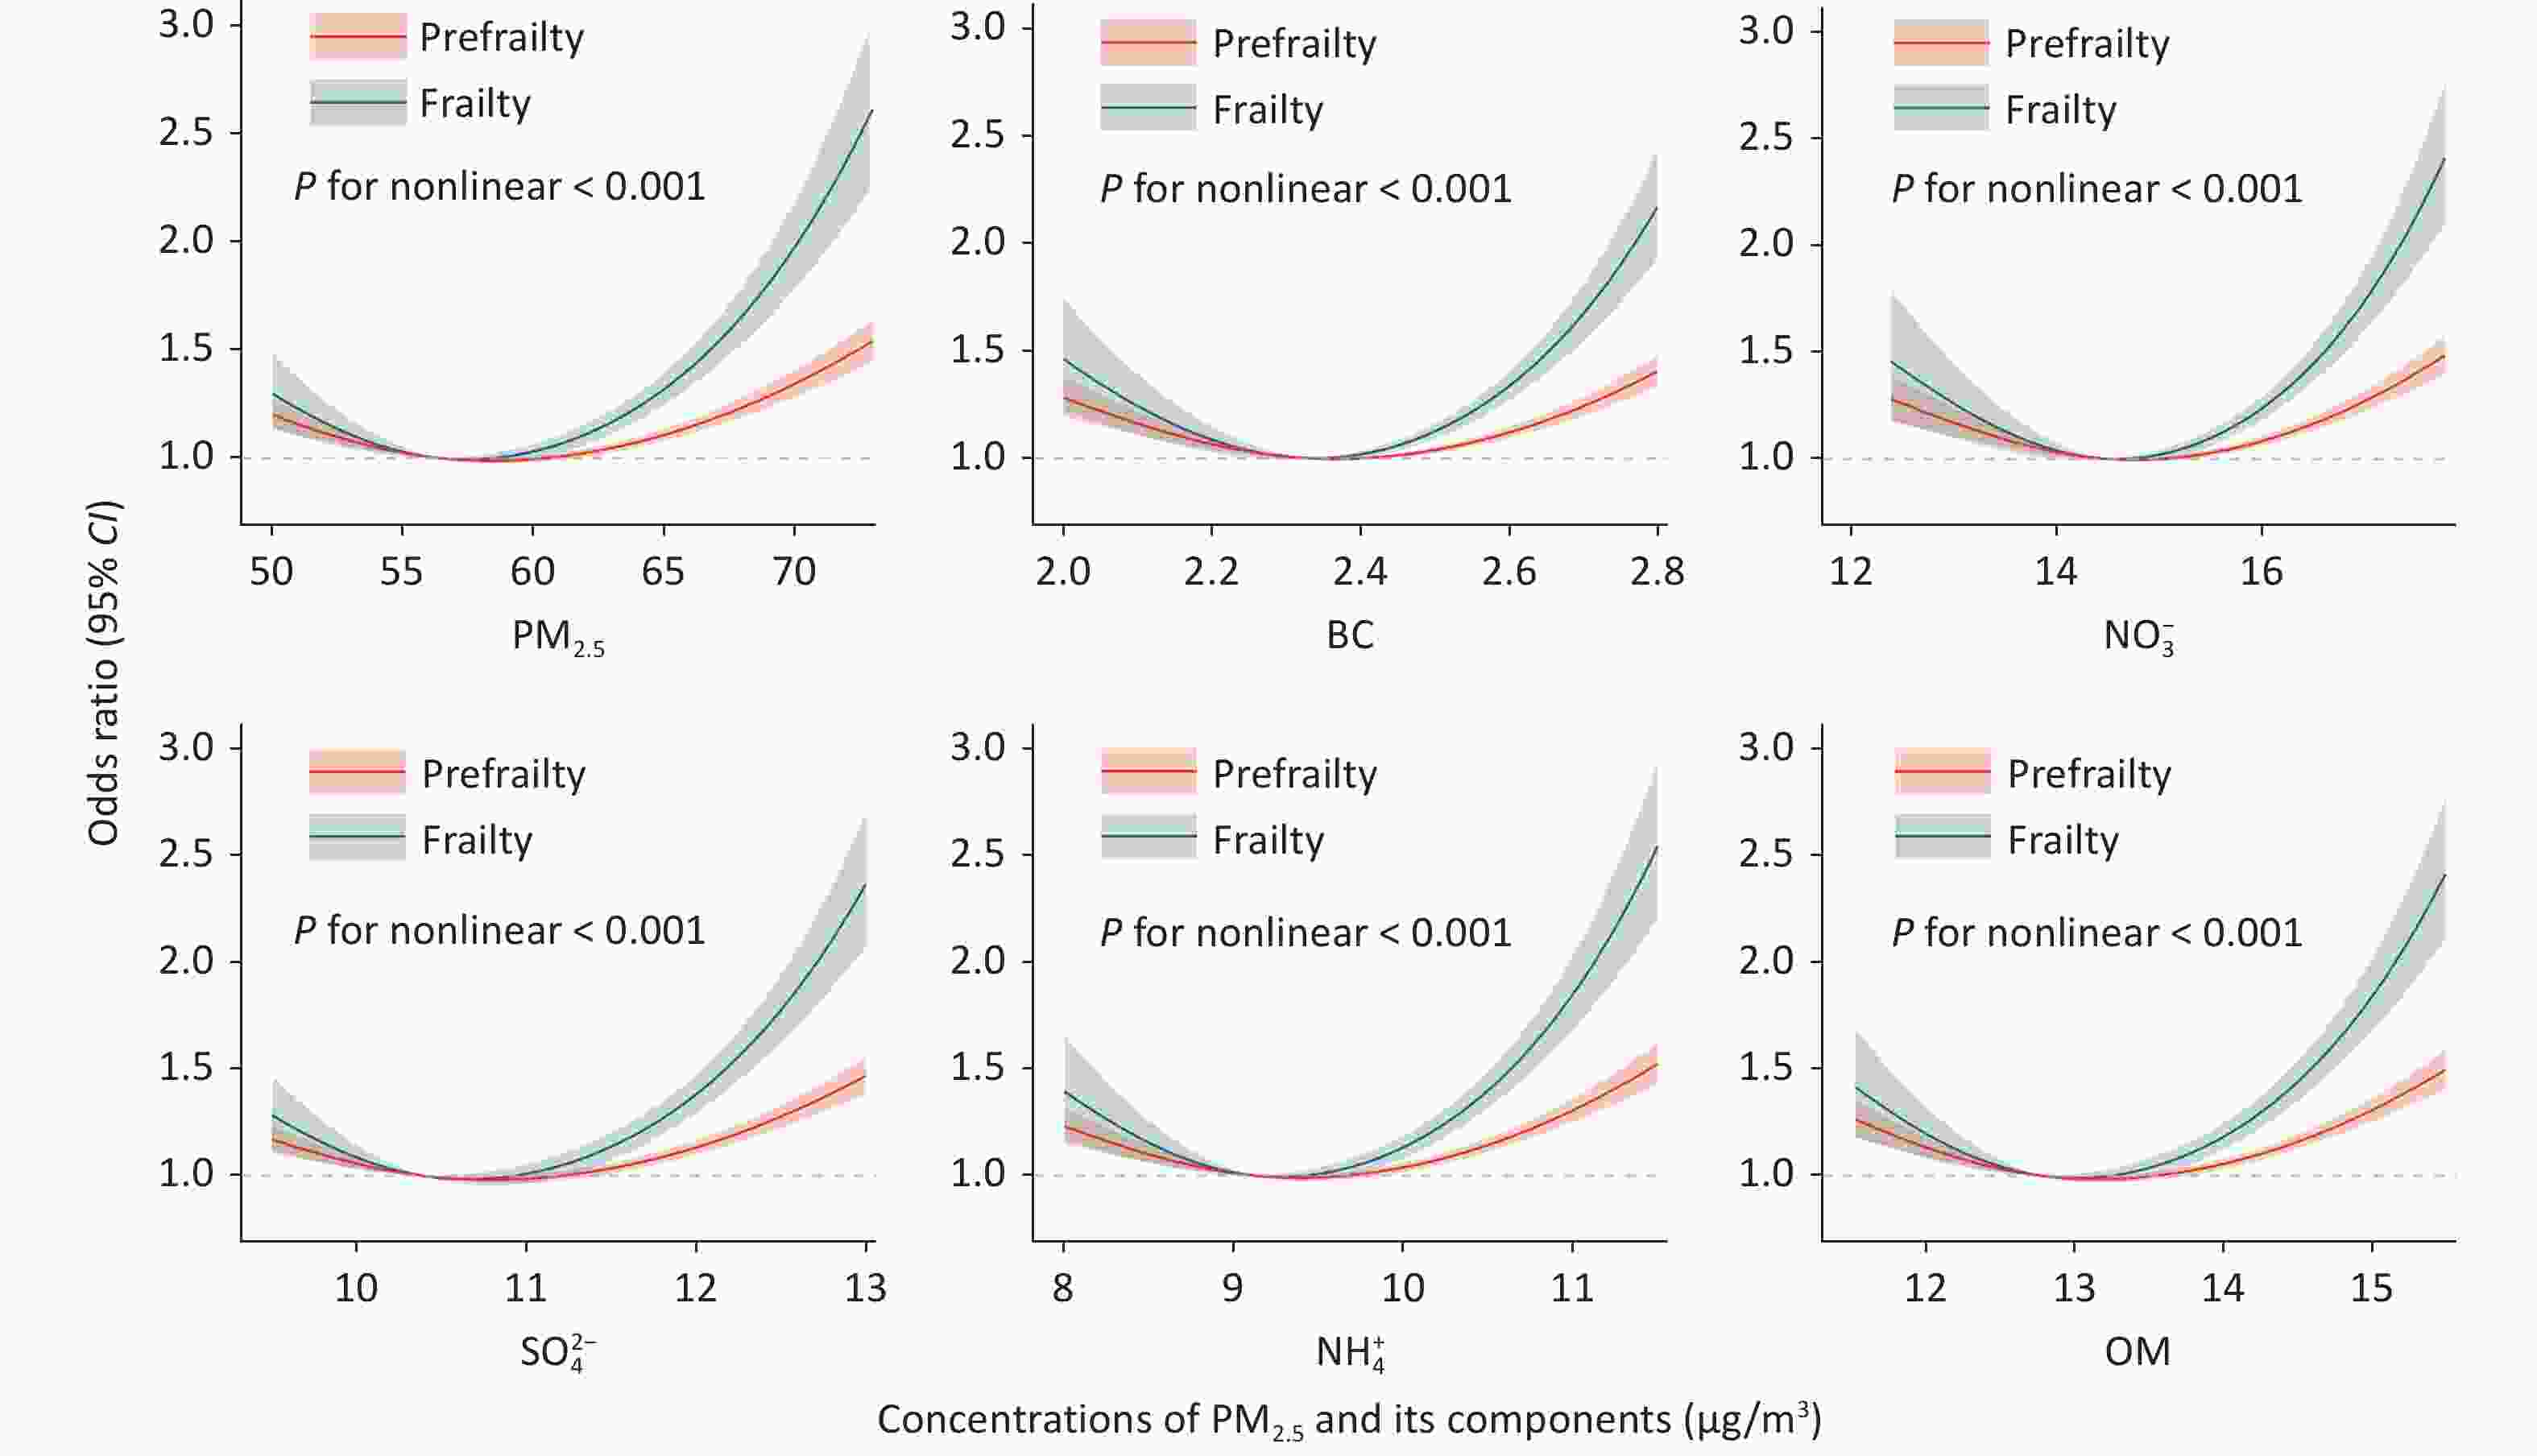
Figure 1. Concentration-response curve of ambient air pollutants and risk of prefrailty and frailty (natural cubic spline smoothing, df = 3). The solid lines with shaded bands in nonlinear curves indicate the changes in risk of prefrailty and 95 % confidence intervals, respectively. Model was adjusted for age, sex, marital status, educational level, per capita monthly income, smoking status, drinking status, high-fat diet and adequate vegetables and fruits intake. PM2.5, particulate matter with an aerodynamic diameter ≤ 2.5 μm; BC, Black carbon; NO3-, nitrate; SO42-, Sulfate; NH4+, ammonium; OM, organic matter.
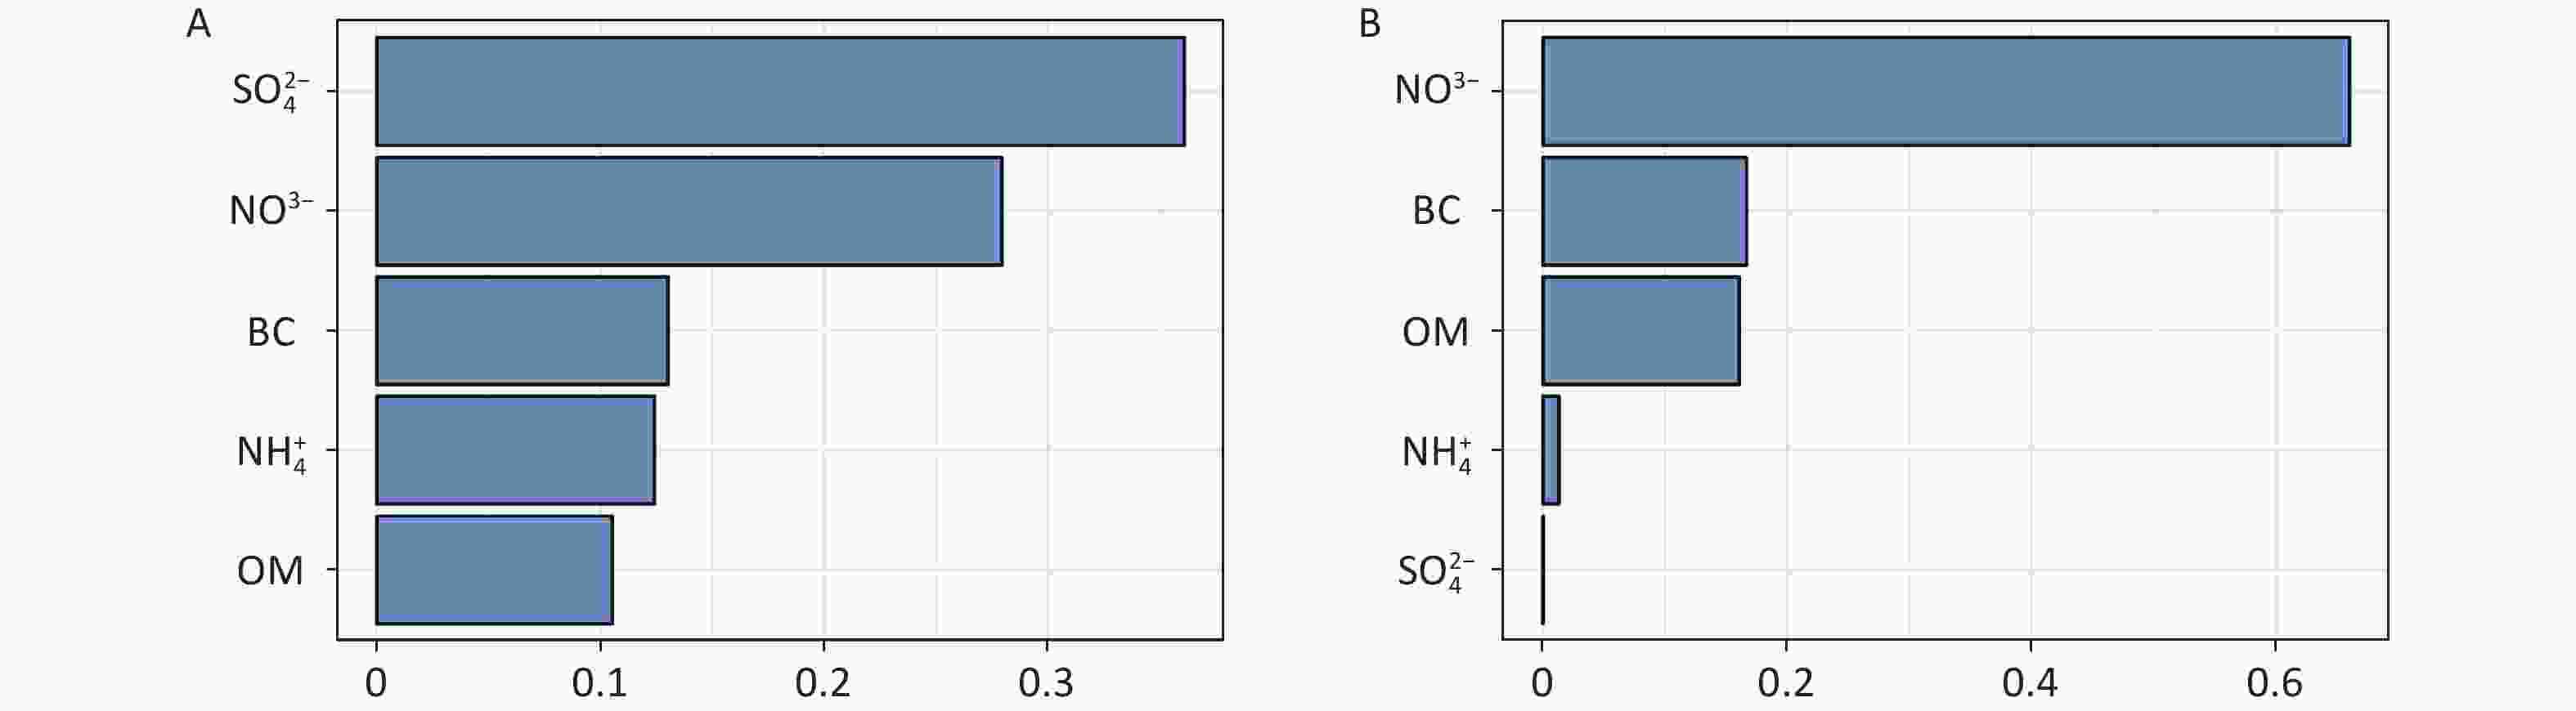
Figure 2. Weight of each constituent in the association between PM2.5 joint exposure with prefrailty (A) and frailty (B) by weighted quantile sum regression. Model was adjusted for age, sex, marital status, educational level, per capita monthly income, smoking status, drinking status, high-fat, and vegetable and fruit intake.PM2.5, particulate matter with an aerodynamic diameter ≤ 2.5 μm; BC, Black carbon; NO3-, nitrate; SO42-, Sulfate; NH4+, ammonium; OM, organic matter.
In the network toxicology analysis, a total of 689 air pollutant–related genes and 260 frailty-related genes were identified from public databases, of which 54 overlapping genes were considered potential mediators linking PM2.5 and its components to frailty (Supplementary Figure S6). A protein–protein interaction network constructed using STRING (confidence score ≥ 0.700) included 51 nodes and 293 edges, and topological analysis identified 10 hub genes (IL6, TP53, IL1B, TNF, IL10, EGFR, AKT1, IFNG, TLR2, and NF-κB). Module analysis revealed that these genes are mainly involved in inflammatory and immune responses, cellular stress, apoptosis, and PI3K-Akt–related signaling pathways. GO and KEGG enrichment analyses further showed significant enrichment in biological processes related to inflammation, immune regulation, signal transduction, apoptosis, and cancer-related pathways, including cytokine–cytokine receptor interactions, PI3K-Akt, MAPK, and Toll-like receptor signaling, suggesting that PM2.5 may contribute to frailty through inflammation- and stress-related molecular mechanisms. Cluster analysis of core genes showed similar results (Supplementary Figure S7).
This study had several limitations. First, community-level exposure estimates were derived from modeling approaches and assigned to individuals based on residential location, which may result in exposure misclassification due to factors such as wind speed, humidity, personal activity patterns, model uncertainty, and residence duration. Second, our study focused on a rural population, and the results may not be applicable to other populations such as urban populations or those from different geographical regions with different demographic characteristics. Third, the definition of FI, one of the several approaches for measuring frailty, remains to be validated. However, the FI constructed in the present study exhibited several common characteristics, including a positive association with age, a right-skewed distribution, higher mean FI scores in women than in men, and at least 99% of values below 0.7. These features are characteristic of robust FI. Although numerous potential confounders were adjusted for in the analysis, residual confounding cannot be completely ruled out. In addition, toxicogenomic analyses are exploratory and hypothesis-generating in nature and require validation in future experimental or longitudinal omics studies; therefore, definitive causal inferences should be avoided. Finally, the reliance on self-reported demographic information may have introduced recall bias.
In summary, this study identified a positive association between long-term exposure to PM2.5 and its components, and the risk of prefrailty and frailty among older adults in rural areas. Integrated network toxicological analyses suggested that this association may involve dysregulated inflammatory responses, apoptosis, and cancer-related pathways, with key genes such as IL6 and TP53 implicated. These findings underscore the importance of controlling air pollution in promoting healthy aging. Accordingly, targeted mitigation strategies may be warranted for combustion-related components, such as BC and OM, transitioning to clean energy, and enhancing the control of biomass and coal combustion. For secondary inorganic components, such as NO3- and SO42-, reducing precursor emissions through stricter industrial regulation and cleaner transportation systems is equally vital.
doi: 10.3967/bes2026.040
Evaluating the Roles of PM2.5 and Its Components in Frailty: An Integration of Epidemiological and Network Toxicological Evidence
-
This work was supported by the Noncommunicable Chronic Diseases-National Science and Technology Major Project (Grant No: 2024ZD0531600), the Key Project of Hunan Provincial Natural Science Foundation (Grant No: 2025JJ30049), and the Foundation of the National Key Program of Research and Development of China (Grant No: 2016YFC0900803). The funders had no role in study design, data collection and analysis, decision to publish, or manuscript preparation.
The authors have no conflicts of interest to declare.
This study was approved by the Zhengzhou University Life Science Ethics Committee. Written informed consent was obtained from all participants or their legal representatives before enrollment in the study.
Investigation, formal analysis, validation, visualization, writing – original draft, writing – review & editing: Jia Qiu and Parastou Abbasian. Investigation, formal analysis, visualization, writing – review & editing: Yinghao Yuchi, Jian Zhang, Ziyuan Zhang, and Huanxiang Zhang. Investigation, writing – review & editing: Chunwei Luo, Jian Hou, and Xiaotian Liu. Conceptualization, data curation, methodology, writing – review & editing: Mu Wang and Chongjian Wang. All authors critically revised the manuscript and approved the final version for publication.
&These authors contributed equally to this work.
注释:1) Funding: 2) Competing Interests: 3) Ethics: 4) Authors’ Contributions: -
Figure 1. Concentration-response curve of ambient air pollutants and risk of prefrailty and frailty (natural cubic spline smoothing, df = 3). The solid lines with shaded bands in nonlinear curves indicate the changes in risk of prefrailty and 95 % confidence intervals, respectively. Model was adjusted for age, sex, marital status, educational level, per capita monthly income, smoking status, drinking status, high-fat diet and adequate vegetables and fruits intake. PM2.5, particulate matter with an aerodynamic diameter ≤ 2.5 μm; BC, Black carbon; NO3-, nitrate; SO42-, Sulfate; NH4+, ammonium; OM, organic matter.
Figure 2. Weight of each constituent in the association between PM2.5 joint exposure with prefrailty (A) and frailty (B) by weighted quantile sum regression. Model was adjusted for age, sex, marital status, educational level, per capita monthly income, smoking status, drinking status, high-fat, and vegetable and fruit intake.PM2.5, particulate matter with an aerodynamic diameter ≤ 2.5 μm; BC, Black carbon; NO3-, nitrate; SO42-, Sulfate; NH4+, ammonium; OM, organic matter.
Table 1. Associations of 3-year averaged PM2.5 and its components (each SD increment) with prefrailty and frailty
Pollution Single-pollutant modela
OR (95% CI)Component-PM2.5 modelb
OR (95% CI)Component-residual modelc
OR (95% CI)Prefrailty PM2.5 1.131 (1.100, 1.163) − − BC 1.117 (1.086, 1.149) 0.231 (0.170, 0.314)† 0.011 (0.004, 0.027)† NO3− 1.137 (1.106, 1.169) 1.525 (1.226, 1.895) 1.256 (1.130, 1.397) SO42- 1.143 (1.112, 1.175) 1.554 (1.327, 1.819) 1.371 (1.235, 1.521) NH4+ 1.140 (1.108, 1.172) 1.440 (1.222, 1.698) 1.339 (1.188, 1.509) OM 1.138 (1.107, 1.170) 1.274 (1.111, 1.460) 1.180 (1.085, 1.284) Frailty PM2.5 1.394 (1.311, 1.482) − − BC 1.370 (1.288, 1.459) 0.084 (0.041, 0.170)† 0.000 (0.000, 0.004)† NO3− 1.400 (1.316, 1.488) 1.726 (1.027, 2.902) 1.359 (1.060, 1.742) SO42- 1.404 (1.321, 1.492) 1.822 (1.244, 2.669) 1.627 (1.267, 2.090) NH4+ 1.400 (1.317, 1.488) 1.576 (1.063, 2.336) 1.521 (1.146, 2.018) OM 1.398 (1.316, 1.486) 1.415 (1.021, 1.961) 1.320 (1.083, 1.608) Note. OR, odds ratio; 95% CI, 95% confidence interval; PM2.5, particulate matter with an aerodynamic diameter ≤ 2.5 μm; BC, Black carbon; NO3−, nitrate; SO42-, Sulfate; NH4+, ammonium; OM, organic matter. Model was adjusted for age, sex, marital status, educational level, per capita monthly income, smoking status, drinking status, high-fat, and vegetable and fruit intake. a PM2.5 and its components were included by origin value to assess the associations with outcomes. b additionally adjust for PM2.5 mass based on single-pollutant model. c The original value was replaced with the residual of each component of PM2.5, based on the single-pollutant model. † The extremely low odds ratios for BC likely reflect high multicollinearity and residualization, indicating limited independent information beyond other PM2.5.  下载: 导出CSV
-
[1] Rockwood K, Mitnitski A. Frailty in relation to the accumulation of deficits. J Gerontol A Biol Sci Med Sci, 2007; 62, 722−7. doi: 10.1093/gerona/62.7.722 [2] Wang C, Zhang JC, Hu CP, et al. Prevalence and risk factors for cognitive frailty in aging hypertensive patients in China. Brain Sci, 2021; 11, 1018. doi: 10.3390/brainsci11081018 [3] Liu J, Xu SJ, Wang JR, et al. Prevalence of cognitive frailty among older adults in China: a systematic review and meta-analysis. BMJ Open, 2023; 13, e066630. doi: 10.1136/bmjopen-2022-066630 [4] Shin J, Choi J. Frailty related to the exposure to particulate matter and ozone: the Korean frailty and aging cohort study. Int J Environ Res Public Health, 2021; 18, 11796. doi: 10.3390/ijerph182211796 [5] Cai J, Zhao Y, Kan JL, et al. Prenatal exposure to specific PM2.5 chemical constituents and preterm birth in China: a nationwide cohort study. Environ Sci Technol, 2020; 54, 14494−501. doi: 10.1021/acs.est.0c02373 [6] Liu XT, Mao ZX, Li YQ, et al. Cohort profile: the Henan rural cohort: a prospective study of chronic non-communicable diseases. Int J Epidemiol, 2019; 48, 1756−1756j. doi: 10.1093/ije/dyz039 [7] Liu SG, Geng GN, Xiao QY, et al. Tracking daily concentrations of PM2.5 chemical composition in China since 2000. Environ Sci Technol, 2022; 56, 16517−27. doi: 10.1021/acs.est.2c06510 [8] Fan JN, Yu CQ, Guo Y, et al. Frailty index and all-cause and cause-specific mortality in Chinese adults: a prospective cohort study. Lancet Public Health, 2020; 5, e650−60. doi: 10.1016/S2468-2667(20)30113-4 [9] He D, Wang ZP, Li J, et al. Changes in frailty and incident cardiovascular disease in three prospective cohorts. Eur Heart J, 2024; 45, 1058−68. doi: 10.1093/eurheartj/ehad885 [10] Gawda A, Majka G, Nowak B, et al. Air pollution, oxidative stress, and exacerbation of autoimmune diseases. Cent Eur J Immunol, 2017; 42, 305−12. doi: 10.5114/ceji.2017.70975 -

 点击查看大图
计量
- 文章访问数: 16
- HTML全文浏览量: 6
- PDF下载量: 0
- 被引次数: 0

 Quick Links