

 下载:
下载:


-
Dementia is a major global public health concern. The number of people with dementia is expected to increase to 152.8 million globally by 2050[1]. The dementia worldwide involves symptoms including memory loss, cognitive dysfunction, impairment in activities of daily living, and increased costs for the families of patients. The long duration of dementia and the high cost of its treatment impose a huge burden on families and society through impacts on healthcare systems and socioeconomic development[2,3]. Cognitive impairment, particularly mild cognitive impairment, is often considered a transitional stage between normal aging and dementia. With the early identification and management of cognitive impairment, the progression of dementia can be slowed or prevented[4].
One of the main factors contributing to dementia and cognitive impairment is the rapid growth of the elderly population in East Asia[1]. The dementia prevalence of those of Mongolian ethnicity in China, Japan, and Korea is 4.2%, 4.8%, and 5.3%, respectively[5–7]. In European and American countries, populations are smaller, and dementia trends are steadily decreasing, so more research and proper prevention in East Asian countries could substantially reduce the global disease burden of dementia[1,8,9]. According to the 2016 Global Burden of Disease Study, China’s population with dementia accounted for one-quarter of the world’s total incidence[10].
Exposure to environmental pollution can negatively impact human health. Environmental pollution, especially PM2.5, in outdoor environments can cause dementia, including Alzheimer’s disease, vascular dementia, and mixed dementia[11–15]. Two large-sample studies on the UK population demonstrated the detrimental cognitive effects of ambient PM2.5, and similar results were found in animal studies[16–18]. Ambient PM2.5 is a mixture of fine (aerodynamic diameter ≤2.5 μm) chemical substances suspended in the air, and the composition and interactions between these substances are complex[19]. PM2.5 particles are highly permeable and can enter the blood circulation through alveolar capillaries[20]. PM2.5 may cause central nervous system dysfunction through three separate or combined pathways: (1) inhaled particulate matter can enter the brain through the bloodstream after deposition in the alveoli; (2) particles can be transported through the nasal–brain axis after deposition in the olfactory mucosa; and (3) the particles can enter the central nervous system through systemic inflammation[21–23].
Cigarette smoking has been extensively studied owing to its detrimental effects on various aspects of health, including the cardiovascular and respiratory systems. Recently, increasing attention has been directed toward the relationship between smoking and cognitive function. Smoking is associated with neurotoxic effects that increase the risk of dementia, and a measured response relationship with dementia was proposed[24]. Burning tobacco releases a large number of harmful substances that have been internationally identified as carcinogens; some can cross the blood–brain barrier and cause other diseases[25]. Additionally, smoking exacerbates diseases such as atherosclerosis and hypertension, both of which are important risk factors for cognitive impairment[26]. Approximately 14% of Alzheimer’s cases worldwide are caused by smoking[27]. Understanding the effects of smoking on cognitive functioning is crucial for guiding the development of public health strategies aimed at reducing the incidence of cognitive disorders in the aging population.
Dementia and cognitive impairment are caused by a combination of physiological, psychological, and social factors. Researchers have predominantly focused on single, independent factors. However, PM2.5 exposure with smoking, may exacerbate the effects of dementia, as both adversely affect cognitive functioning. Therefore, in this study, we analyzed the association of the exposure to ambient PM2.5 and smoking with dementia prevalence and cognitive impairment in a community-dwelling elderly Chinese population.
-
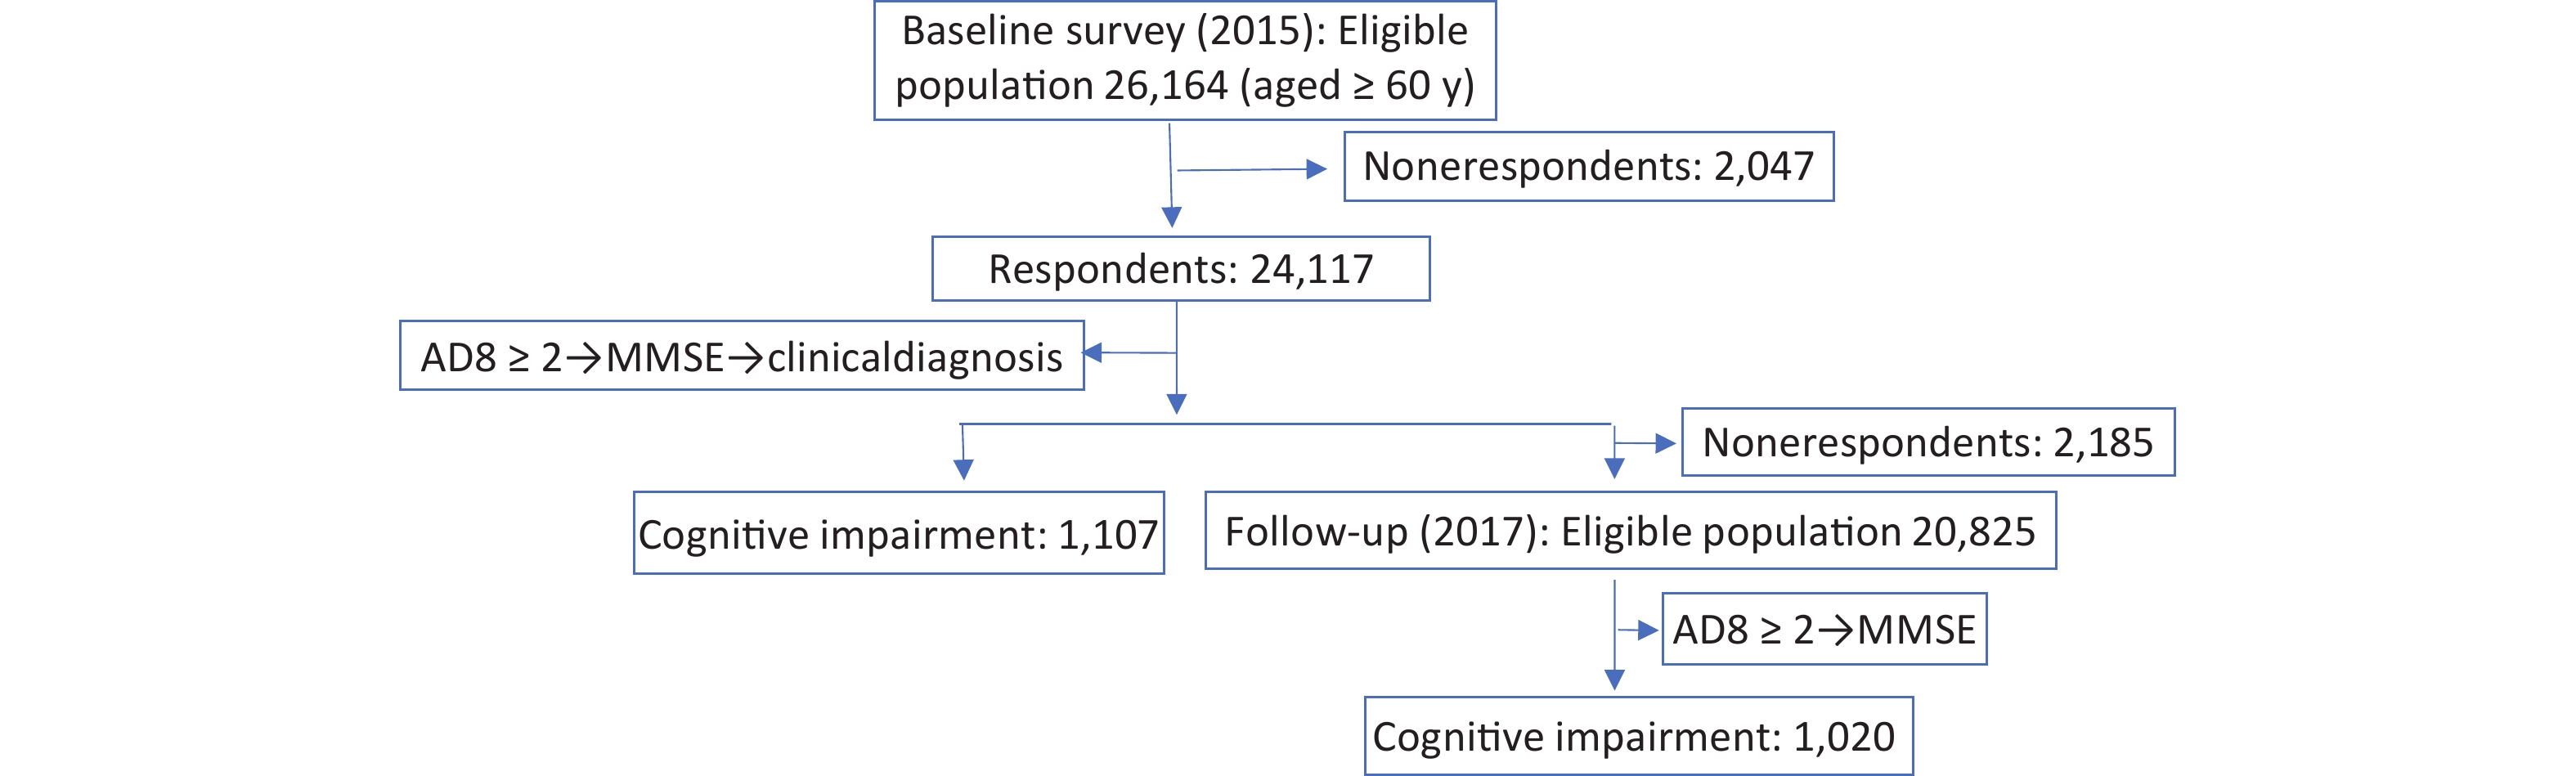
The Prevention and Intervention on Neurodegenerative Disease (PINDEC) project was conducted in 2015 as a baseline survey on a nationwide sample of community-dwelling older adults aged 60 years and above to explore the distribution of common chronic diseases and their influencing factors in this population[28]. We used a stratified multistage cluster sampling method to recruit participants. First, six provinces (Beijing, Shanghai, Hubei, Sichuan, Guangxi Zhuang Autonomous Region, and Yunnan) in China were selected by considering population size, levels of socioeconomic development, and geographical factors. One urban district and one rural county from each province were randomly selected based on probability proportional to population size (PPS). Next, one subdistrict (township) was randomly selected within each urban district (rural county, PPS). From each selection, four or eight neighborhood committees (administrative villages) were selected (PPS). Finally, 250−500 residents aged 60 years and older were randomly selected from each committee (administrative villages). After excluding 2,047 participants with missing data, 24,117 participants were analyzed. In 2017, those who participated in the baseline survey were followed up, and 21,932 subjects participated in the survey after excluding those who had died and those who were not followed up (Figure 1). The baseline survey response rate was 92%, and the follow-up survey response rate was 91%.
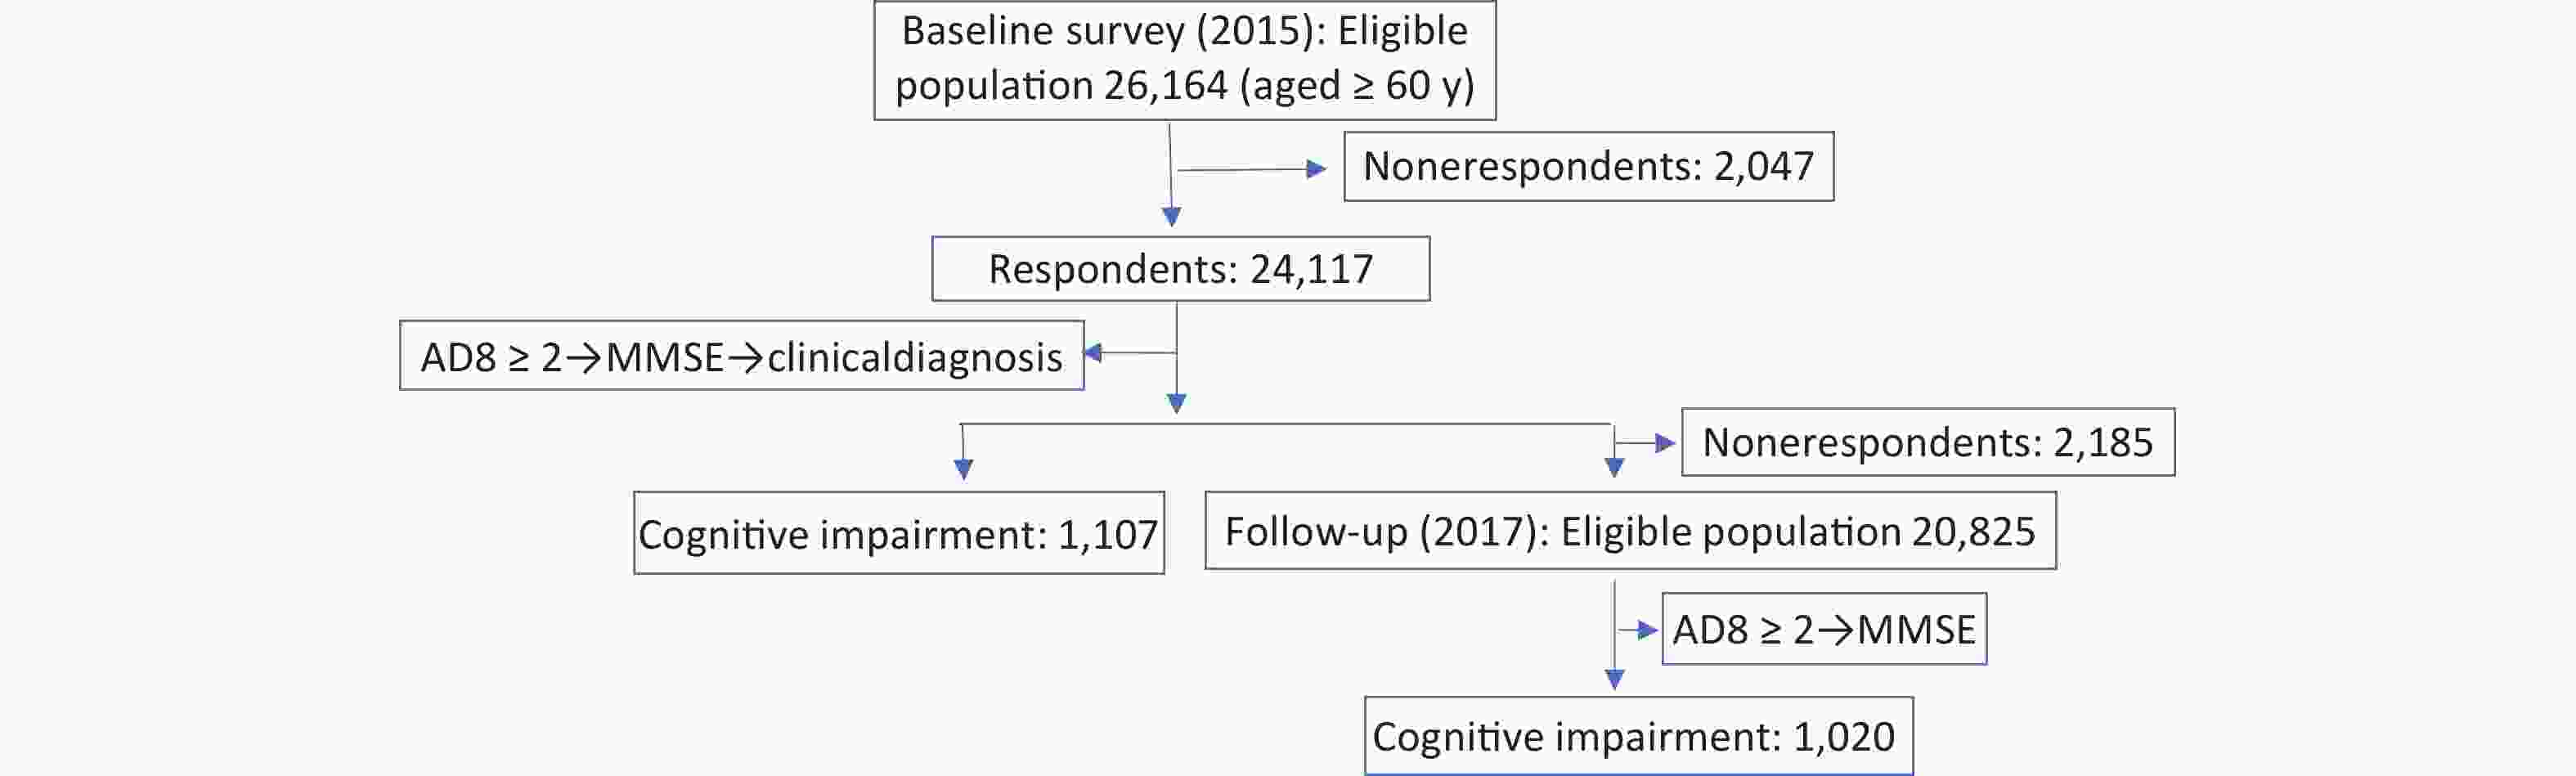
Figure 1. Flowchart of participant selection. AD8, Chinese version of the Ascertain Dementia 8; MMSE, Mini-Mental State Examination.
-
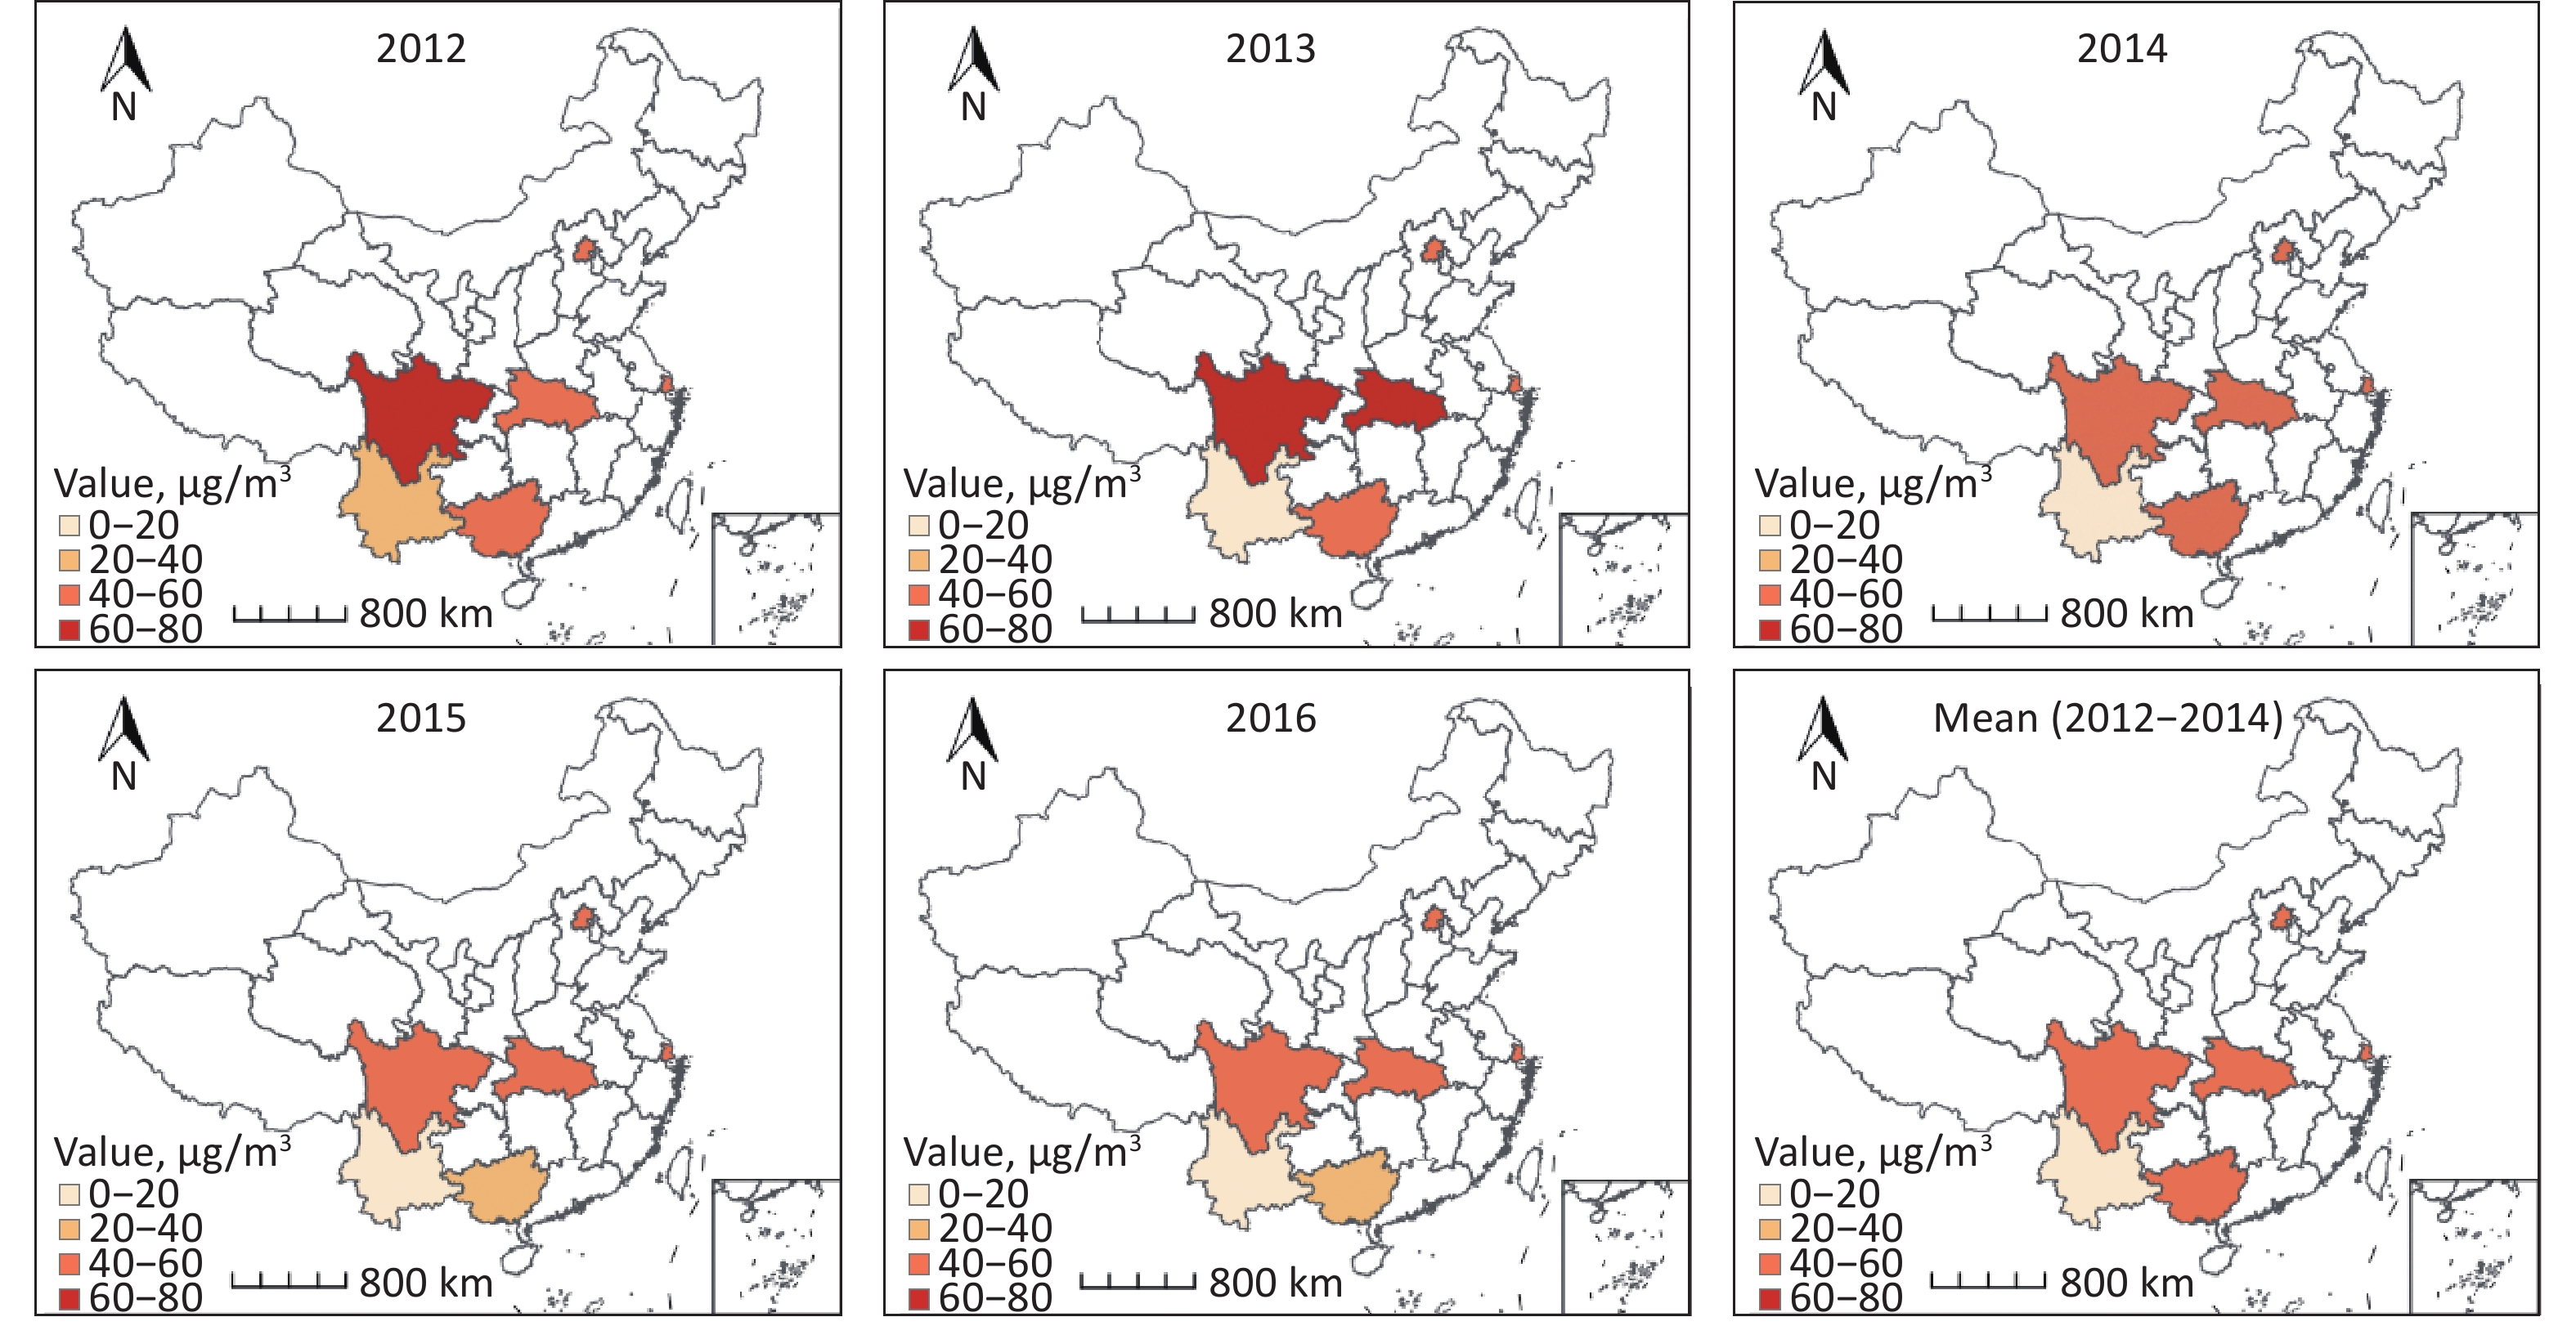
We obtained the annual surface PM2.5 concentrations in China from the Atmospheric Composition Analysis Group of Dalhousie University. The accuracy and reliability of the data were determined and cross-validated using several ground-based monitoring systems. A fine spatial resolution of approximately 1 km × 1 km guaranteed an accurate depiction of local PM2.5 concentrations. Details of the methodology for this average surface PM2.5 calculation can be found elsewhere[29]. For the data used in this study, we could only obtain the geographical location of the participants at the county level from 2012 to 2016. Therefore, those living in the same county (district) matched identical PM2.5 concentrations. We calculated the average annual mean PM2.5 concentrations for the three years (2012−2014) before the baseline survey to determine their impact on dementia. The annual mean PM2.5 concentrations for the two years (2015−2016) before the follow-up survey were obtained to determine their impact on cognitive impairment. According on the trisectional PM2.5 quantiles (the cutoff values were 33.3% and 66.6%), we divided PM2.5 exposure into three groups: low (T1), medium (T2), and high (T3).
-
Two criteria were applied for dementia during baseline investigation: (1) respondents self-reported that they had been diagnosed with dementia by professional medical institutions; (2) subjects who scored ≥ 2 on the Chinese version of the Ascertain Dementia 8 (AD8) scale (eight questions in total) were screened using the Chinese version of the Mini-Mental State Examination (MMSE)[30,31]. Suspected dementia was assessed based on education level and MMSE (total score of 30), with an MMSE score ≤ 17 for the illiterate group, ≤ 20 for the elementary school group, and ≤ 24 for the junior high school and above group. Clinical diagnoses were made by neurologists at collaborating hospitals for people with suspected dementia. The detailed methods employed for cognitive measurements are published elsewhere[5]. After excluding suspected dementia cases in 2015, 20,825 valid records were obtained for the follow-up survey. Newly suspected dementia cases were assessed during the 2017 wave. Patients with cognitive impairment were identified as having newly suspected dementia and the rest as the general population.
-
Demographic characteristics, medical history, and risk factors were obtained using face-to-face questionnaires. Height and weight data were obtained through physical measurements to calculate the body mass index (BMI) using the formula BMI = weight (kg) / height (m2). Low weight, normal weight, overweight, and obese were assigned cutoff values of 18.5, 24.0, and 28.0, respectively[32]. All the interviewers were uniformly trained. The smoking frequency was defined as never, occasionally, or daily. “Daily” was defined as smoking at least one tobacco product every day or almost every day for a month or more, and “never” was defined as not currently smoking at all. The rest of the population was defined as “occasional.” Drinking and interacting with neighbors were defined as never, occasionally, or daily, in the same way as smoking. Those who participated in social activities several times weekly were defined as often, those who participated several times within a month or year were defined as occasional, and those who seldom participated were defined as rare. Those who exercised frequently (≥ 3 days a week) were defined as regular exercisers, and others were defined as occasional exercisers. Respondents with three or more symptoms mentioned in the nine standard questions related to Parkinson’s disease (PD) were considered to have PD symptoms, whereas the others were considered normal[33]. Activities of daily living (ADLs) were scored according to the ADL scale: mild disability was one or more impaired Instrumental Activities of Daily Living (IADL) functions and no impaired Basic Self-Maintenance Scale (BADL) functions; moderate disability was one or two impaired BADL indicators; and severe disability was three or more impaired BADL indicators[34].
-
We multiplied the sampling cluster weights by the poststratification weights (based on the 6th National Census) to obtain the final weights to represent the entire population in China; the weighted population characteristics were similar to the census results. The continuous variable is expressed as $ \stackrel{-}{X} $ ± S, and categorical variables are expressed using n (%). Differences in categorical variables were tested using X2 test and are presented as the 95% confidence interval (CI).
Three models with varying covariate combinations were developed using multivariable logistic regression to investigate the additive effects of PM2.5 exposure and smoking on the incidence of dementia (or cognitive impairment). Model 1 was adjusted for age and sex; model 2 was adjusted for living area (urban or rural area), education level, marital status, occupation (job worked for the longest time), living status (with or without family), interacting with neighbors, participating in social activities, exercise frequency, ADL, PD symptoms, and BMI. Model 3 was adjusted for the covariates in model 2 plus PM2.5 exposure and smoking status to examine whether the effects of PM2.5 and smoking on cognition (cognitive impairment) were stable.
Subgroup analysis was performed to assess the effects of PM2.5 exposure and smoking status on dementia and cognitive impairment within the different strata. We further analyzed the joint effects of PM2.5 exposure and smoking frequency on cognitive impairment for low, moderate, and high PM2.5 exposure levels, and nonsmoking, occasional smoking, and daily smoking into nine groups.
We performed all statistical analyses using SAS version 9.4 (SAS Institute Inc., Cary, NC, USA), and two-sided P < 0.01 was considered a statistically significant difference.
-
Table 1 shows the distribution of PM2.5 concentration and smoking status in the different populations. The overall study population comprised 24,117 people with an average age of 70.5 years (standard deviation [SD], 7.0), including 12,950 urban (53.7%) and 11,167 rural (46.3%) dwellers, as well as 10,722 men (44.5%) and 13,395 women (55.5%). A total of 3,971 people were daily smokers (16.5%), who smoked an average of 15.9 cigarettes per day. Men were highly concentrated in the older population of smokers (94.5% and 77.2% of daily and occasional smokers, respectively). A total of 67.0% of the older women were nonsmokers.
Table 1. Baseline characteristics of particulate matter with aerodynamic diameter ≤ 2.5 μm and smoking status
Characteristics PM2.5, N (%) Smoking, N (%) Total T1 T2 T3 No Occasionally Daily Location Urban 12,950 (53.7) 2,985 (37.2) 3,855 (48.3) 6,110 (75.3) 10,937 (56.4) 389 (52.4) 1,624 (40.9) Rural 11,167 (46.3) 5,042 (62.8) 4,121 (51.7) 2,004 (24.7) 8,467 (43.6) 353 (47.6) 2,347 (59.1) Age groups, years 60– 12,379 (51.3) 4,418 (55.0) 3,967 (49.7) 3,994 (49.2) 9,725 (50.1) 337 (45.4) 2,317 (58.3) 70– 8,715 (36.1) 2,645 (33.0) 2,996 (37.6) 3,074 (37.9) 7,143 (36.8) 273 (36.8) 1,299 (32.7) ≥ 80 3,023 (12.5) 964 (12.0) 1,013 (12.7) 1,046 (12.9) 2,536 (13.1) 132 (17.8) 355 (8.9) Sex Male 10,722 (44.5) 3,575 (44.5) 3,580 (44.9) 3,567 (44.0) 6,397 (33.0) 573 (77.2) 3,752 (94.5) Female 13,395 (55.5) 4,452 (55.5) 4,396 (55.1) 4,547 (56.0) 13,007 (67.0) 169 (22.8) 219 (5.5) Education level Illiteracy 9,544 (39.6) 3,761 (46.9) 3,921 (49.2) 1,862 (22.9) 7,931 (40.9) 354 (47.7) 1,259 (31.7) Primary school 7,548 (31.3) 2,823 (35.2) 2,193 (27.5) 2,532 (31.2) 5,776 (29.8) 235 (31.7) 1,537 (38.7) Secondary school and above 7,025 (29.1) 1,443 (18.0) 1,862 (23.3) 3,720 (45.8) 5,697 (29.4) 153 (20.6) 1,175 (29.6) Marital status Married 18,435 (76.4) 6,027 (75.1) 6,076 (76.2) 6,332 (78.0) 14,706 (75.8) 437 (58.9) 3,292 (82.9) Single/divorced/widowed 5,682 (23.6) 2,000 (24.9) 1,900 (23.8) 1,782 (22.0) 4,698 (24.2) 305 (41.1) 679 (17.1) Occupation Farmer 14,001 (58.1) 6,952 (86.6) 4,510 (56.5) 2,539 (31.3) 11,123 (57.3) 366 (49.3) 2,512 (63.3) Worker 5,873 (24.4) 584 (7.3) 2,254 (28.3) 3,035 (37.4) 4,680 (24.1) 300 (40.4) 893 (22.5) Nonmanual worker 4,243 (17.6) 491 (6.1) 1,212 (15.2) 2,540 (31.3) 3,601 (18.6) 76 (10.2) 566 (14.3) Living status Alone/with others 2,824 (11.7) 719 (9.0) 1,021 (12.8) 1,084 (13.4) 2,268 (11.7) 94 (12.7) 462 (11.6) With family 21,293 (88.3) 7,308 (91.0) 6,955 (87.2) 7,030 (86.6) 17,136 (88.3) 648 (87.3) 3,509 (88.4) Socializing with neighbors Rarely 3,459 (14.3) 1,055 (13.1) 799 (10.0) 1,605 (19.8) 2,750 (14.2) 105 (14.2) 604 (15.2) Occasional 3,614 (15.0) 996 (12.4) 1,326 (16.6) 1,292 (15.9) 2,815 (14.5) 276 (37.2) 523 (13.2) Daily 17,044 (70.7) 5,976 (74.4) 5,851 (73.4) 5,217 (64.3) 13,839 (71.3) 361 (48.7) 2,844 (71.6) Social activity Rarely 13,674 (56.7) 5,307 (66.1) 3,904 (48.9) 4,463 (55.0) 11,011 (56.7) 287 (38.7) 2,376 (59.8) Occasional 5,168 (21.4) 1,091 (13.6) 2,293 (28.7) 1,784 (22.0) 4,159 (21.4) 155 (20.9) 854 (21.5) Often 5,275 (21.9) 1,629 (20.3) 1,779 (22.3) 1,867 (23.0) 4,234 (21.8) 300 (40.4) 741 (18.7) Alcohol consumption No 18,661 (77.4) 5,980 (74.5) 6,435 (80.7) 6,246 (77.0) 16,499 (85.0) 290 (39.1) 1,872 (47.1) Occasional 2,432 (10.1) 883 (11.0) 573 (7.2) 976 (12.0) 1,496 (7.7) 355 (47.8) 581 (14.6) Daily 3,024 (12.5) 1,164 (14.5) 968 (12.1) 892 (11.0) 1,409 (7.3) 97 (13.1) 1,518 (38.2) Regular exercise Occasional 4,794 (19.9) 1,857 (23.1) 1,509 (18.9) 1,428 (17.6) 3,817 (19.7) 237 (31.9) 740 (18.6) Often 19,323 (80.1) 6,170 (76.9) 6,467 (81.1) 6,686 (82.4) 15,587 (80.3) 505 (68.1) 3,231 (81.4) Activities of daily living Normal 20,724 (85.9) 6,629 (82.6) 7,064 (88.6) 7,031 (86.7) 16,500 (85.0) 658 (88.7) 3,566 (89.8) Mild 2,952 (12.2) 1,240 (15.4) 820 (10.3) 892 (11.0) 2,517 (13.0) 76 (10.2) 359 (9.0) Moderate 271 (1.1) 114 (1.4) 42 (0.5) 115 (1.4) 232 (1.2) 6 (0.8) 33 (0.8) Severe 170 (0.7) 44 (0.5) 50 (0.6) 76 (0.9) 155 (0.8) 2 (0.3) 13 (0.3) Parkinson’s symptoms Normal 20,469 (84.9) 6,731 (83.9) 7,368 (92.4) 6,370 (78.5) 16,324 (84.1) 641 (86.4) 3,504 (88.2) PD symptoms 3,648 (15.1) 1,296 (16.1) 608 (7.6) 1,744 (21.5) 3,080 (15.9) 101 (13.6) 467 (11.8) BMI Low weight 1,665 (6.9) 690 (8.6) 638 (8.0) 337 (4.2) 1,231 (6.3) 60 (8.1) 374 (9.4) Normal 12,427 (51.5) 4,220 (52.6) 4,300 (53.9) 3,907 (48.2) 9,628 (49.6) 471 (63.5) 2,328 (58.6) Overweight 7,561 (31.4) 2,270 (28.3) 2,349 (29.5) 2,942 (36.3) 6,379 (32.9) 164 (22.1) 1,018 (25.6) Obese 2,464 (10.2) 847 (10.6) 689 (8.6) 928 (11.4) 2,166 (11.2) 47 (6.3) 251 (6.3) Total 24,117 (100.0) 8,027 (100.0) 7,976 (100.0) 8,114 (100.0) 19,404 (100.0) 742 (100.0) 3,971 (100.0) Note. T1, low; T2, medium; T3, high. The mean PM2.5 exposure concentration was 48.4 μg/m3 (SD = 16.7) in 2012–2014 and 41.4 μg/m3 (SD = 15.1) in 2015–2016. The PM2.5 exposure concentrations were divided into three groups based on cut-off values of 39.50 and 54.40 μg/m3 in 2012–2014, and 39.40 and 49.83 μg/m3 in 2015–2016. The proportions by sex and age in each PM2.5 subgroup were similar to those in the overall survey population. Supplementary Figure S1 displays the annual average PM2.5 concentrations and 5-year means for 2012−2014 and 2015–2016 for the six surveyed provinces.
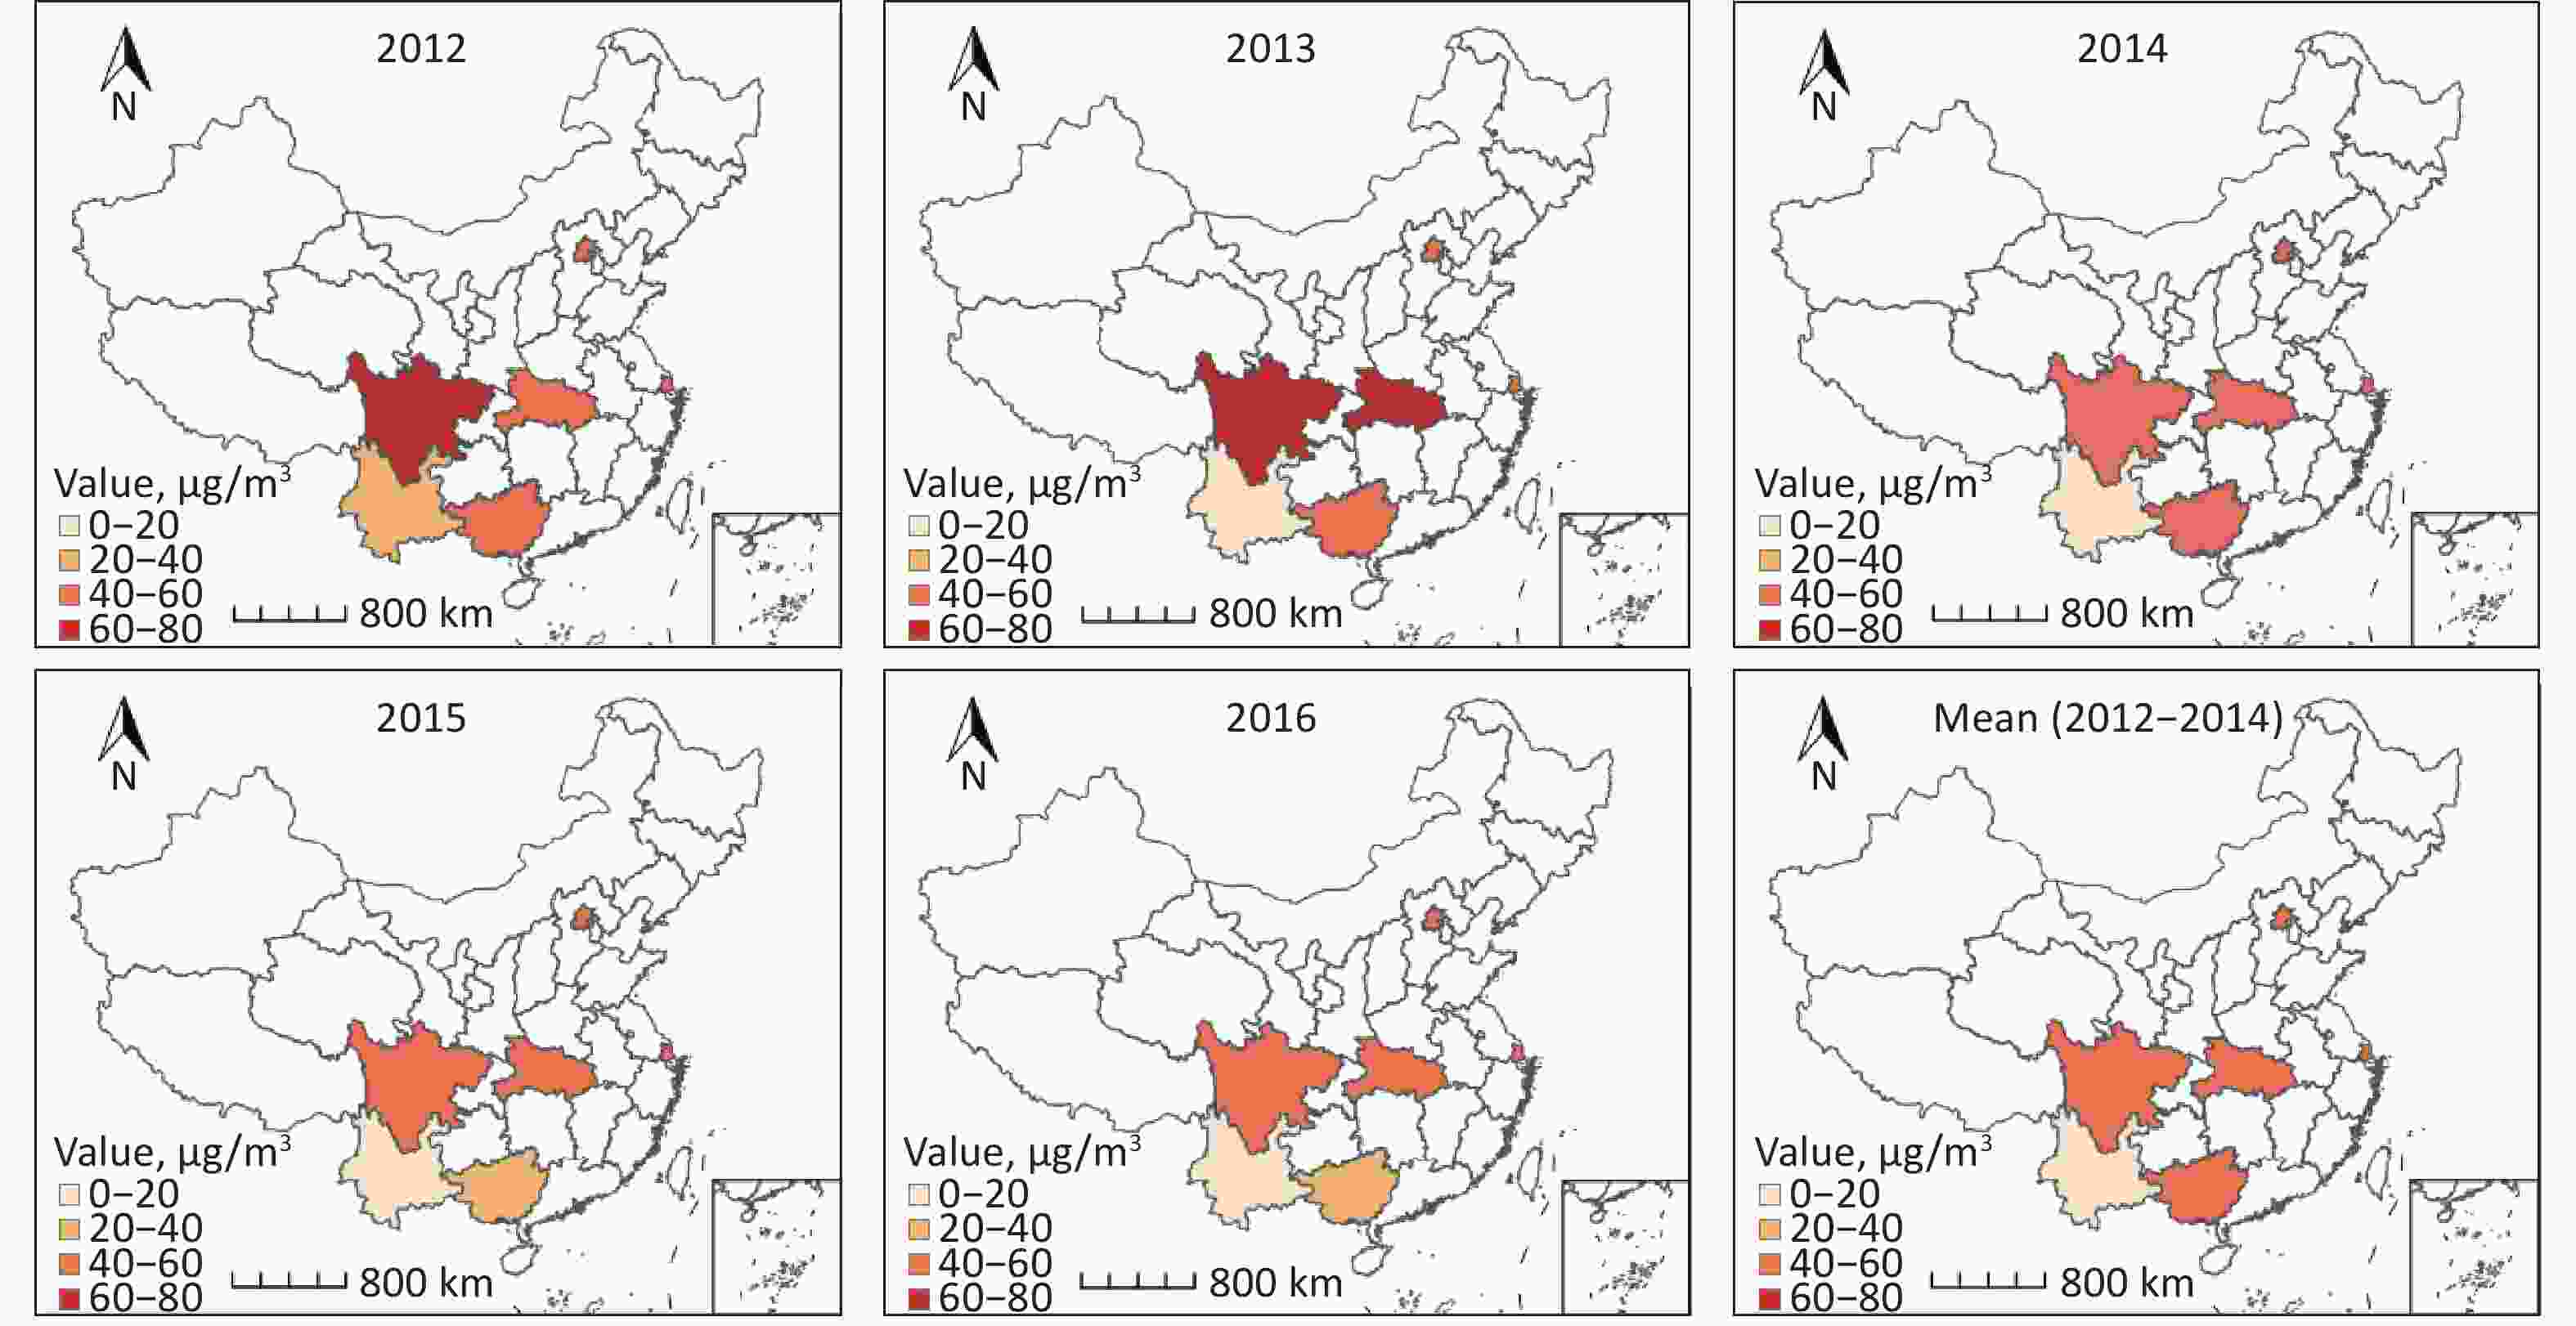
Figure S1. Annual average PM2.5 concentration from 2012−2016.
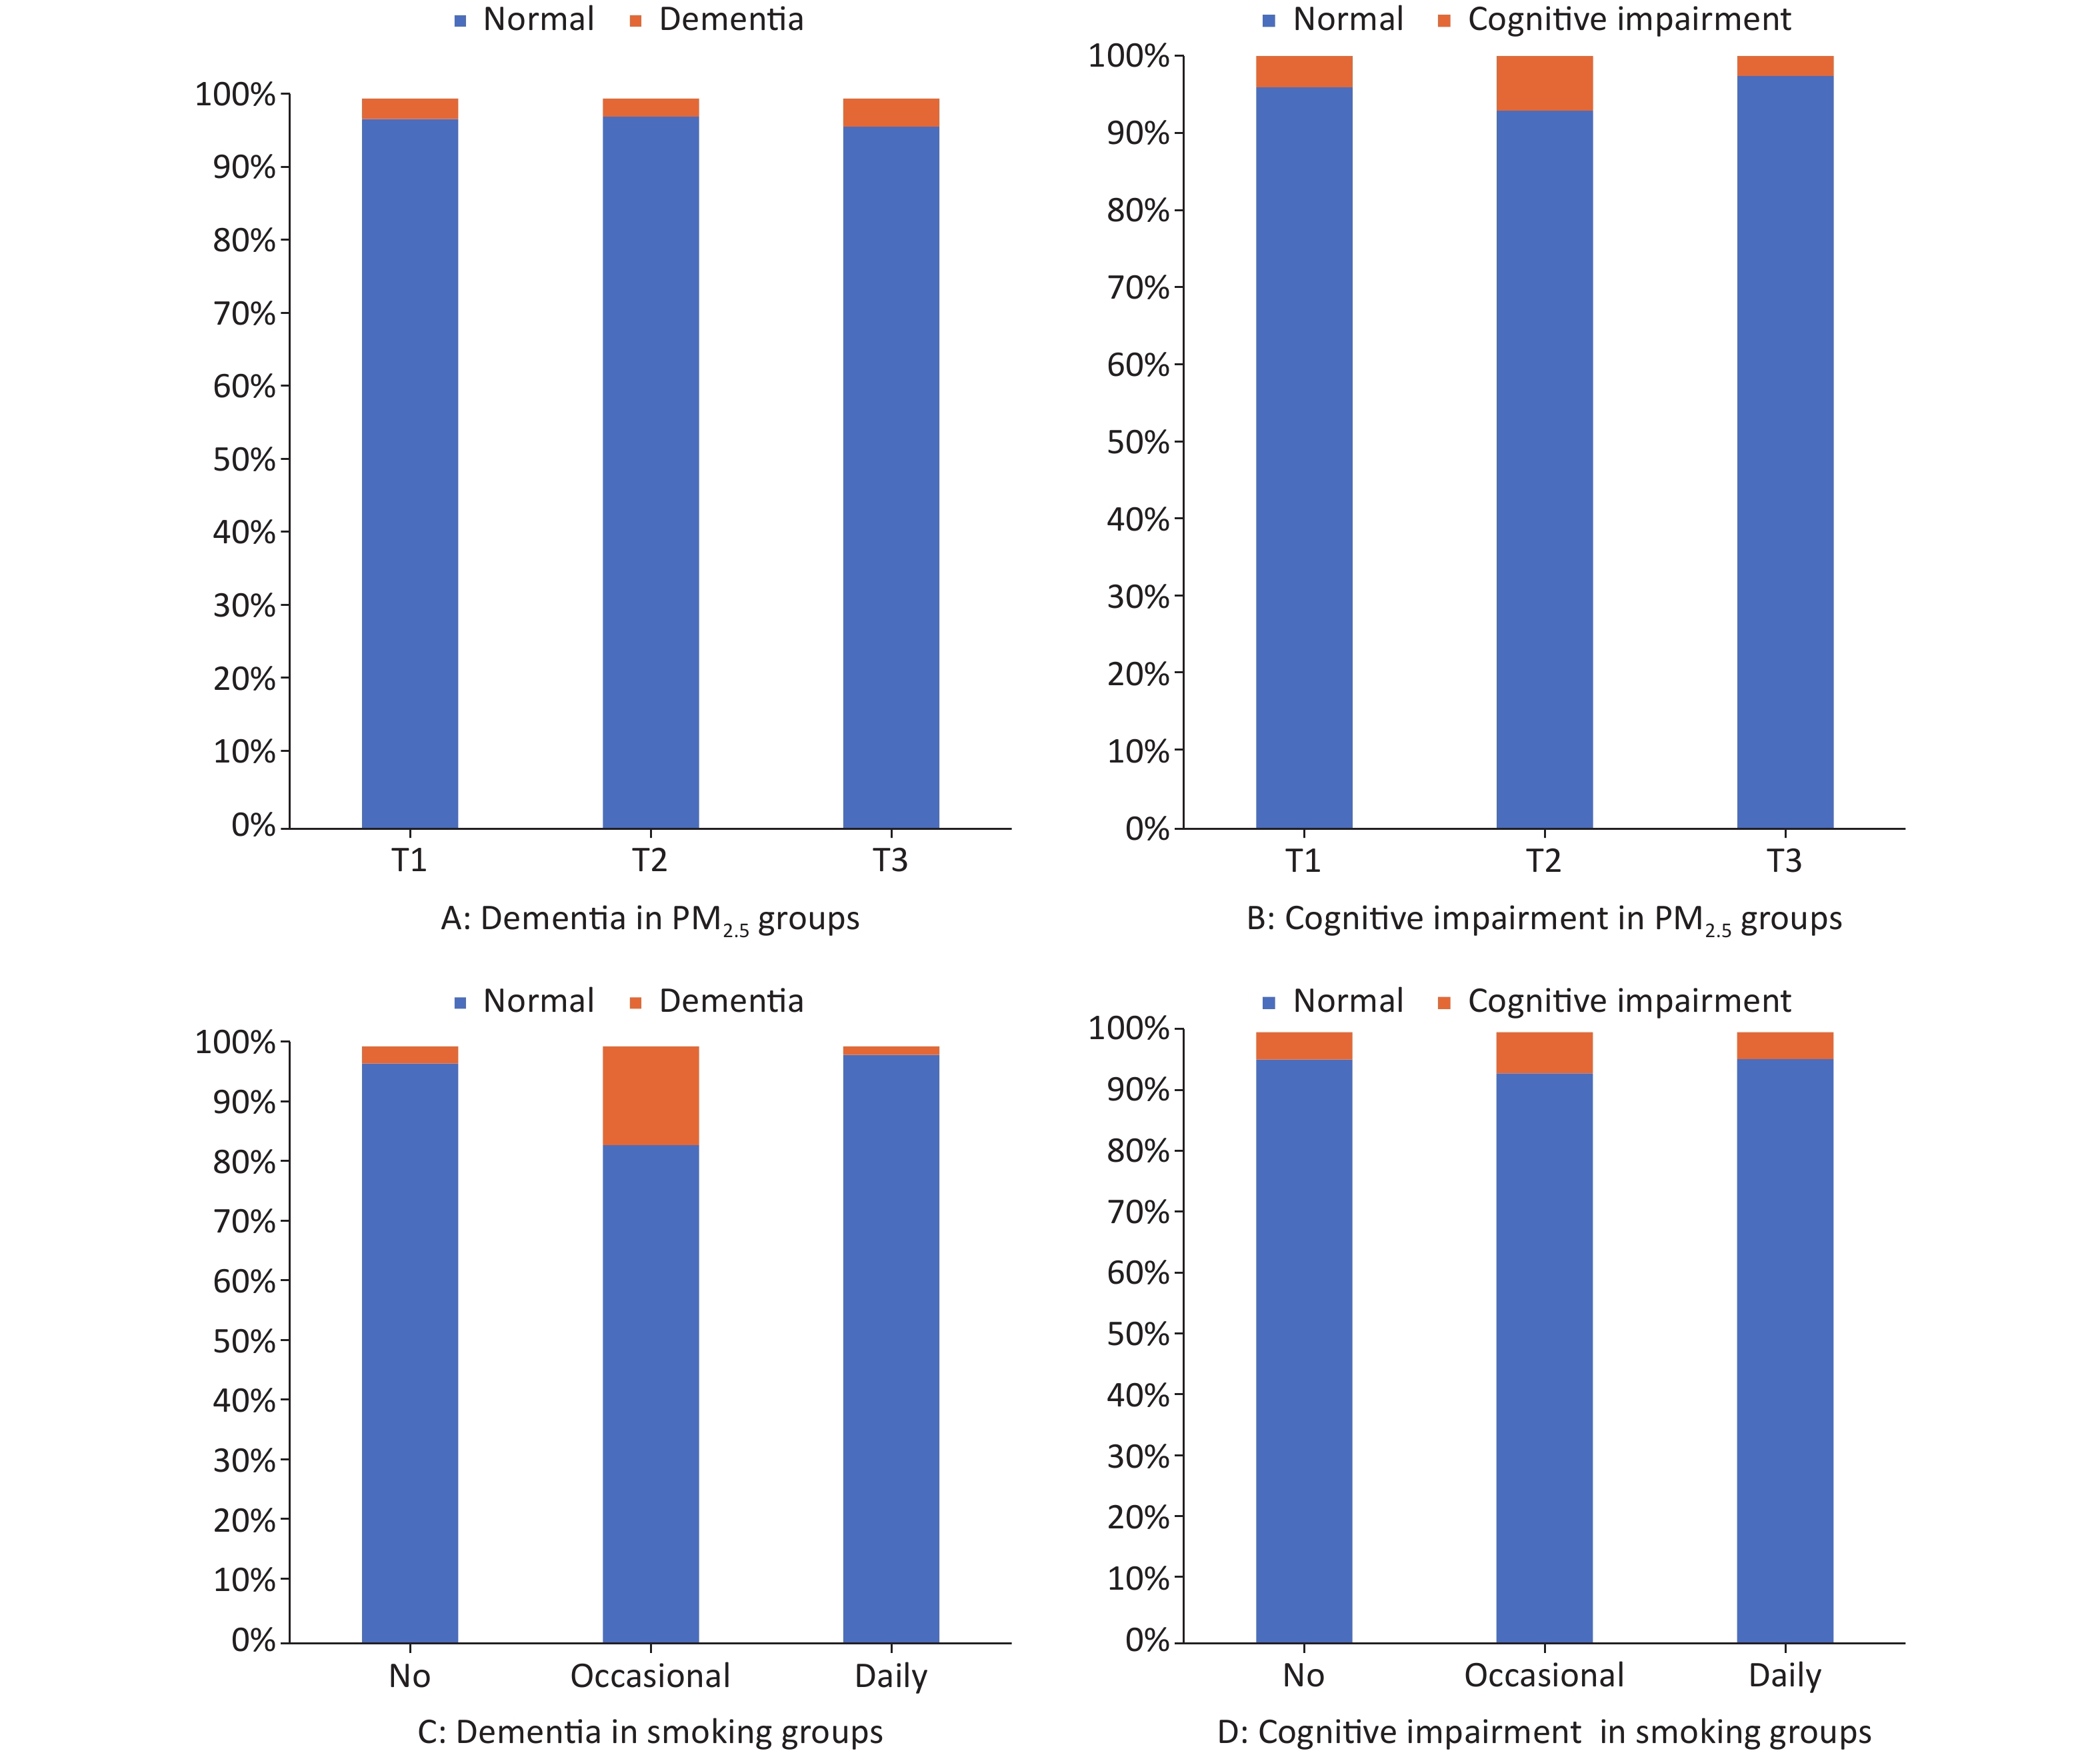
Supplementary Figure S2 presents the proportions of dementia and cognitive impairment for the PM2.5 and smoking subgroups. Remarkably higher proportions of dementia was observed in the higher PM2.5 concentration groups. Cognitive impairment did not follow this pattern. In the smoking subgroups, the proportions of dementia and cognitive impairment were significantly higher in occasional smokers than in non-smokers and daily smokers (P < 0.0001). The distribution of dementia at baseline according to location, sex, and age is shown in Supplementary Table S1.
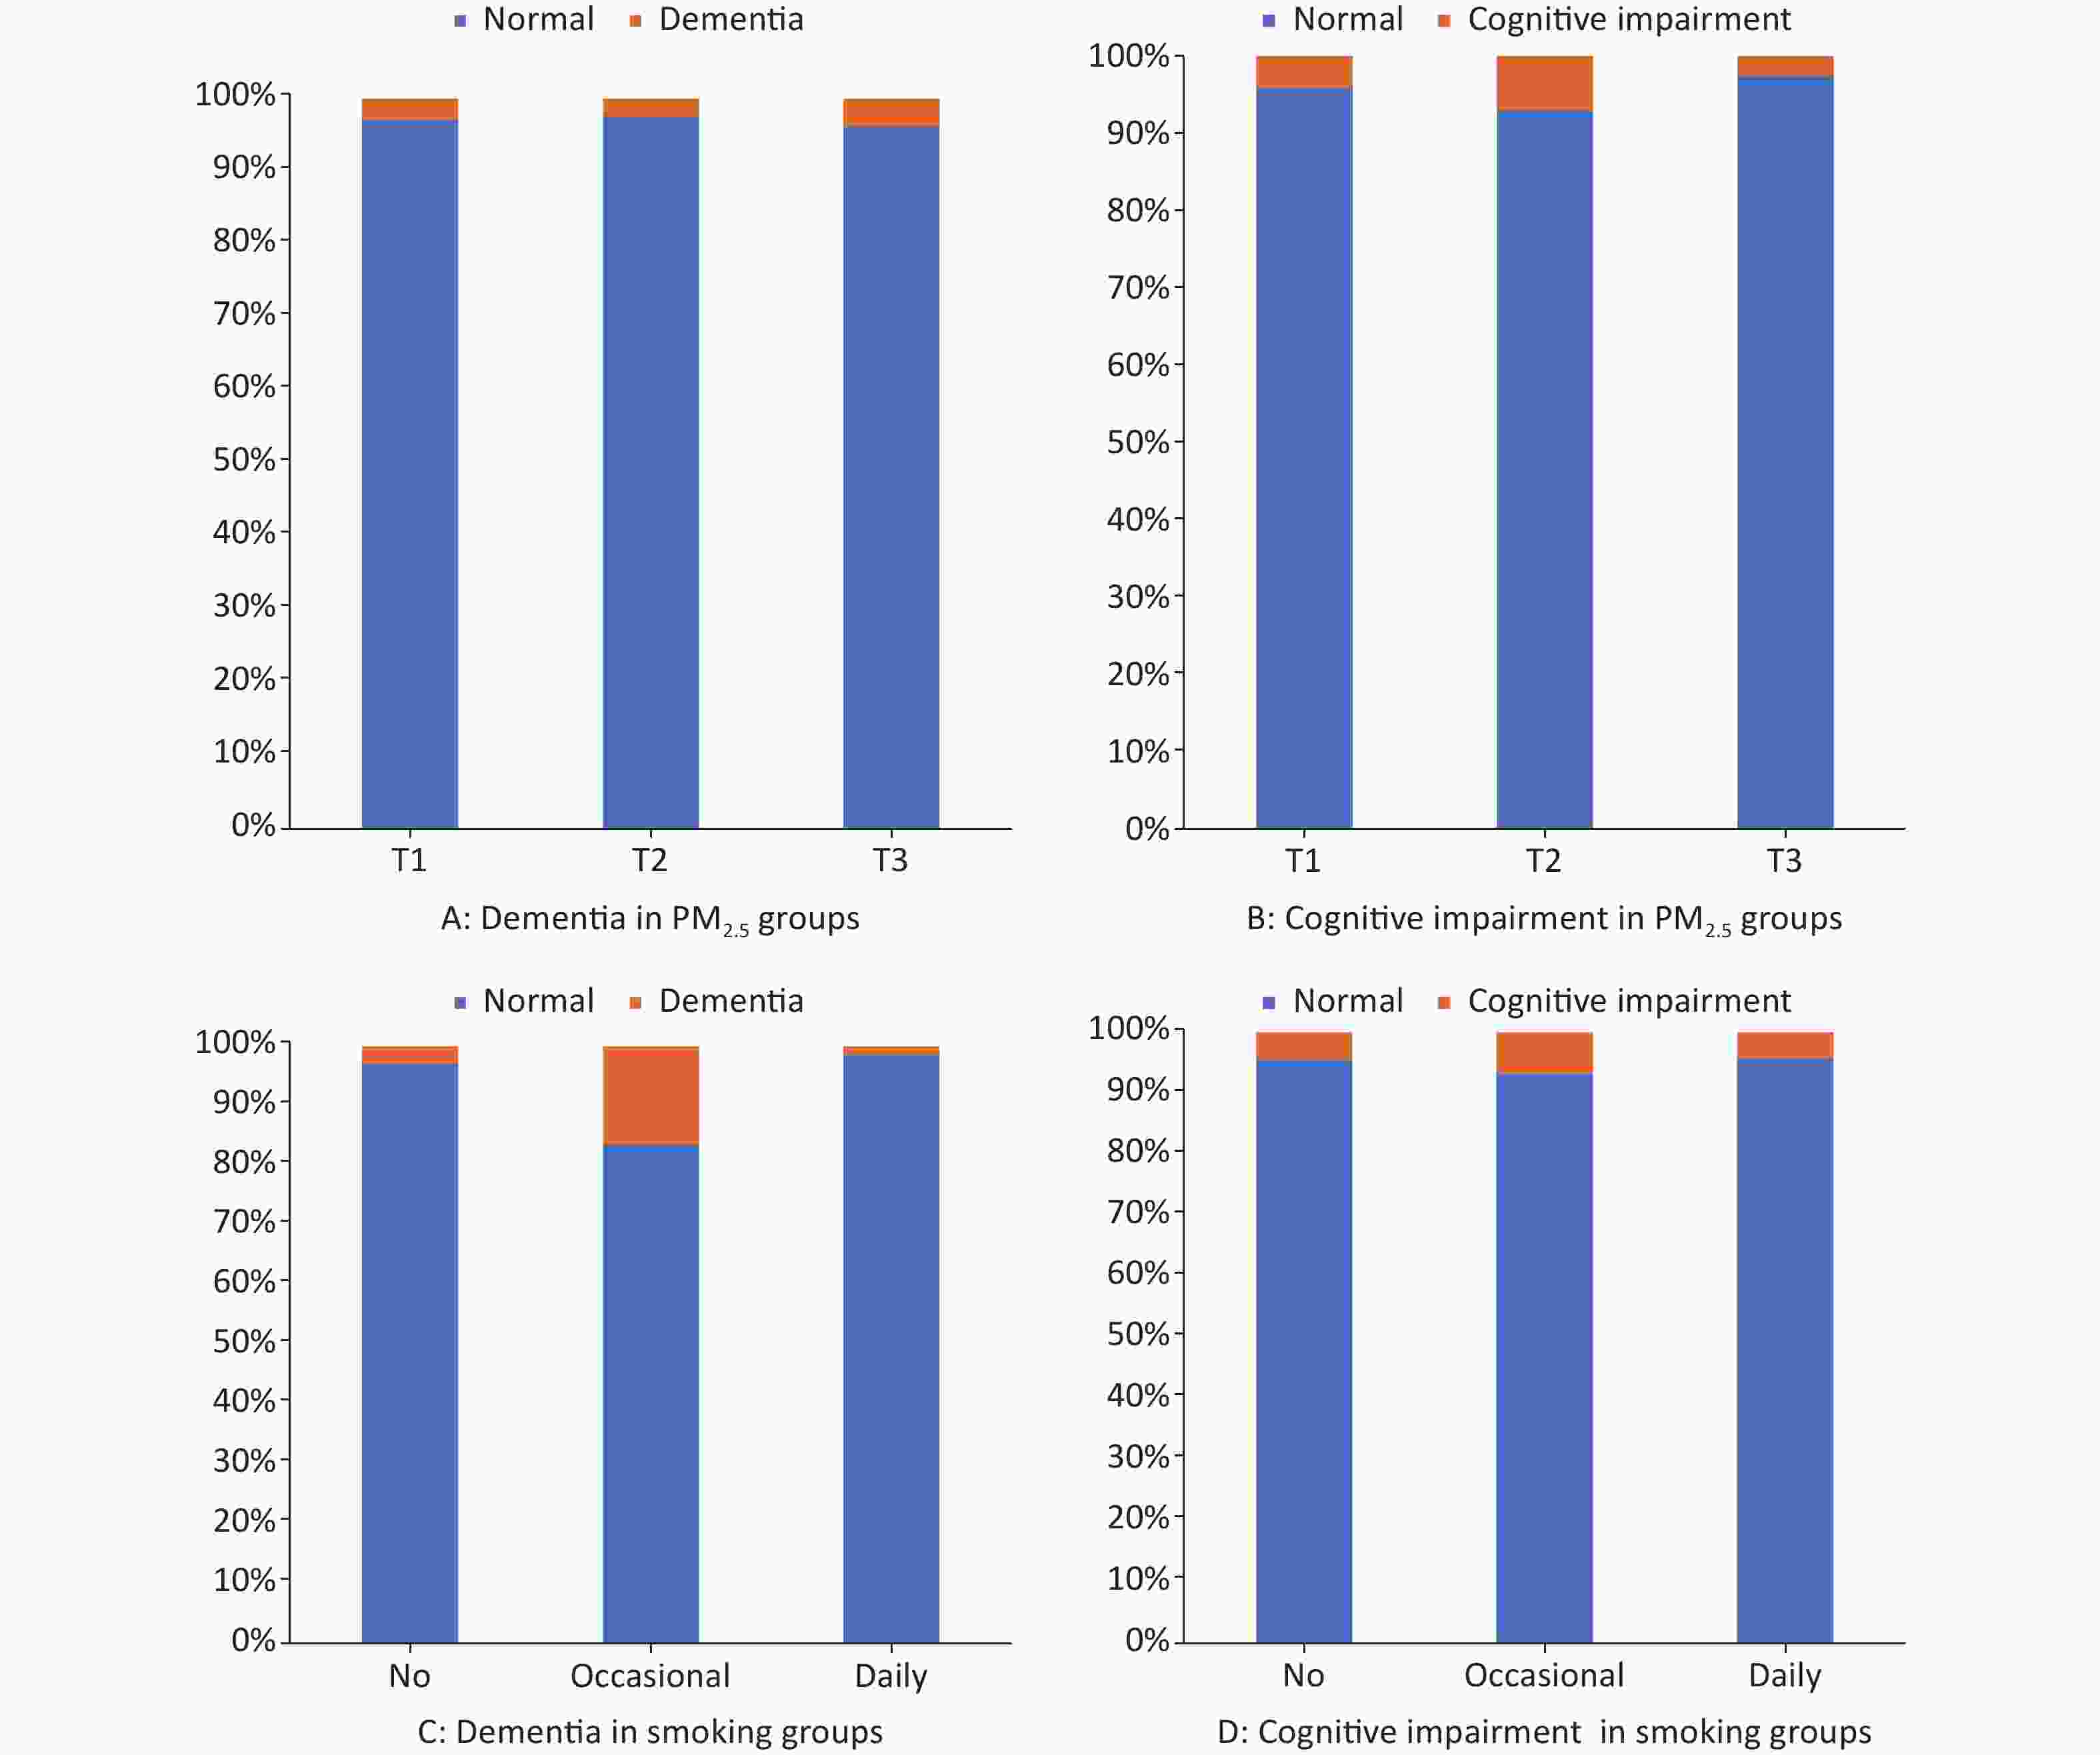
Figure S2. Proportion of dementia and cognitive impairment in PM2.5 and smoking subgroups. The x axis shows PM2.5 or smoking groups, and then y axis shows the proportion in percentage. (A) Proportion of dementia in PM2.5 groups. (B) Proportion of cognitive impairment in PM2.5 groups. (C) Proportion of dementia in smoking groups. (D) Proportion of cognitive impairment in smoking groups. P < 0.05 of logistic regression in A to D.
Table S1. Baseline characteristics of those in the different cognitive function groups
Characteristics Total Normal Abnormal N % p-value N % N % Location 0.0020 Urban 12,950 53.7 12,594 53.9 356 48.1 Rural 11,167 46.3 10,783 46.1 384 51.9 Age group (years) < 0.0001 60– 12,379 51.3 12,177 52.1 202 27.3 70– 8,715 36.1 8,397 35.9 318 43.0 ≥ 80 3,023 12.5 2,803 12.0 220 29.7 Sex < 0.0001 Male 10,722 44.5 10,502 44.9 220 29.7 Female 13,395 55.5 12,875 55.1 520 70.3 Total 24,117 100.0 23,377 100.0 740 100.0 Table 2 shows the three models used to study the main associations of PM2.5 concentration and smoking status with dementia. In general, being exposed to a high PM2.5 concentration was associated with a higher risk of dementia in all models. In model 1, corrected for the sample weight, age, and sex covariates, we found that high PM2.5 exposure positively associated with a high risk of dementia, whereas low PM2.5 exposure was associated with a low risk of dementia (T2: OR = 1.105 [95% CI: 1.102−1.108]; T3: OR = 2.095 [95% CI: 2.090−2.101]; P < 0.0001). Model 2 was based on Model 1, and the association remained after weighting by location, educational level, marital status, occupation, living status, socialization with neighbors, social activity, alcohol consumption, regular exercise, ADL, PD symptoms, and BMI. The results of adding smoking status (model 3) to model 2 were similar. In model 2 with multifactorial correction regarding the correlation between smoking and dementia, the OR was 1.199 (95% CI: 1.192−1.207; P < 0.0001) for occasional smoking and 1.172 (95% CI: 1.168−1.175; P < 0.0001) for daily smoking, using the nonsmoking elderly community as a reference. After including PM2.5, the ORs for occasional and daily smoking were 1.224 (95% CI: 1.217−1.232; P < 0.0001) and 1.248 (95% CI: 1.244−1.252; P < 0.0001), respectively.
Table 2. Association of PM2.5 and smoking with dementia in multivariate regression models
Variables Model 1 Model 2 Model 3 OR 95% CI,
upper95% CI,
lowerP-value OR 95% CI,
upper95% CI,
lowerP-value OR 95% CI,
upper95% CI,
lowerP-value PM2.5 < 0.0001 < 0.0001 < 0.0001 T1 ref ref ref T2 1.105 1.102 1.108 1.202 1.198 1.206 1.204 1.200 1.208 T3 2.095 2.090 2.101 1.627 1.623 1.632 1.630 1.626 1.635 Smoking < 0.0001 < 0.0001 < 0.0001 None ref ref ref Occasional 1.277 1.270 1.285 1.199 1.192 1.207 1.224 1.217 1.232 Daily 0.988 0.985 0.991 1.172 1.168 1.175 1.248 1.244 1.252 Note. Model 1: Adjusted covariates included sample weight, age groups, and sex. Model 2: Adjusted covariates included sample weight, age groups, sex, location, educational level, marital status, occupation, living status, socializing with neighbors, social activity, alcohol consumption, regular exercise, activities of daily living, Parkinson’s symptoms, and BMI. Model 3: Model 2 + smoking/PM2.5. T1, low; T2, medium; T3, high; CI, confidence interval; OR, odds ratio; BMI, body mass index. The results of the association of PM2.5 exposure and smoking status with cognitive impairment are presented in Table 3. The risk of cognitive impairment in the T2 group was 4.213 (95% CI: 4.202−4.224; P < 0.0001) compared with the T1 group, whereas the correlation in the T3 group was negative after adjusting for all covariates. We observed a higher risk of cognitive impairment among occasional smokers (model 2: OR = 1.449 [95% CI: 1.444−1.454]; P < 0.0001) compared with nonsmokers. Occasional smoking was still a risk factor for cognitive impairment after adjusting for PM2.5 (model 3: OR = 1.432 [95% CI: 1.427−1.436]; P < 0.0001). Similar results were found in the analysis of the sex and age subgroups, except for the women in the T3 group and occasional smokers, and people above 80 years of age in the T3 group (Supplementary Tables S2−S3).
Table 3. Association of PM2.5 and smoking with short-term cognitive impairment in multivariate regression models
Variables Model 1 Model 2 Model 3 OR 95% CI,
upper95% CI,
lowerP-value OR 95% CI,
upper95% CI,
lowerP-value OR 95% CI,
upper95% CI,
lowerP-value PM2.5 < 0.0001 < 0.0001 < 0.0001 T1 ref ref ref T2 4.031 4.022 4.040 4.228 4.218 4.239 4.213 4.202 4.224 T3 0.770 0.768 0.772 0.950 0.947 0.953 0.950 0.947 0.953 Smoking < 0.0001 < 0.0001 < 0.0001 None ref ref ref Occasional 1.587 1.582 1.592 1.449 1.444 1.454 1.432 1.427 1.436 Daily 0.908 0.906 0.910 0.913 0.911 0.915 0.997 0.995 0.999 Note. Model 1: Adjusted covariates included sample weight, age groups, and sex. Model 2: Adjusted covariates included sample weight, age groups, sex, location, educational level, marital status, occupation, living status, socializing with neighbors, social activities, alcohol consumption, regular exercise, activities of daily living, Parkinson’s symptoms, and BMI. Model 3: Model 2 + smoking/PM2.5. T1, low; T2, medium; T3, high; CI, confidence interval; OR, odds ratio; BMI, body mass index. We performed a subgroup analysis of PM2.5 concentration and smoking to observe their impacts on cognitive impairment (Tables 4 and 5). After controlling for PM2.5, smoking was found to affect cognitive impairment in the T1 PM2.5 subgroup regardless of the smoking frequency (occasional: OR, regardless of the smoking frequency (occasional: OR = 1.532 [95% CI: 1.513−1.551], daily: OR = 1.307 [95% CI: 1.299−1.316], P < 0.0001). Occasional smoking was more likely to affect cognitive decline than daily smoking in the T2 PM2.5 subgroups (OR = 1.475 vs. 0.967, P < 0.0001). Both moderate (T2) and high (T3) PM2.5 exposure levels were risk factors for cognitive impairment in nonsmokers. Moderate PM2.5 concentration exposure was a strong risk factor for short-term cognitive impairment in all smoking subgroups (ORs of 4.881, 10.730, and 2.841 in the no, occasional, and daily smoking subgroups, respectively).
Table 4. PM2.5 subgroup analysis of association of smoking with short-term cognitive impairment
Variables T1 T2 T3 OR 95% CI,
upper95% CI,
lowerP-value OR 95% CI,
upper95% CI,
lowerP-value OR 95% CI,
upper95% CI,
lowerP-value Smoking < 0.0001 < 0.0001 < 0.0001 None ref ref ref Occasional 1.532 1.513 1.551 1.475 1.470 1.480 0.853 0.837 0.870 Daily 1.307 1.299 1.316 0.967 0.965 0.969 0.967 0.960 0.974 Note. Adjusted covariates included sample weight, age group, sex, location, educational level, marital status, occupation, living status, socializing with neighbors, social activities, alcohol consumption, regular exercise, activities of daily living, Parkinson’s symptom, BMI/PM2.5. T1, low; T2, medium; T3, high; CI, confidence interval; OR, odds ratio; BMI, body mass index. Table 5. Smoking subgroup analysis of the association of PM2.5 with short-term cognitive impairment
Variables No Occasional Daily OR 95% CI,
upper95% CI,
lowerP-value OR 95% CI,
upper95% CI,
lowerP-value OR 95% CI,
upper95% CI,
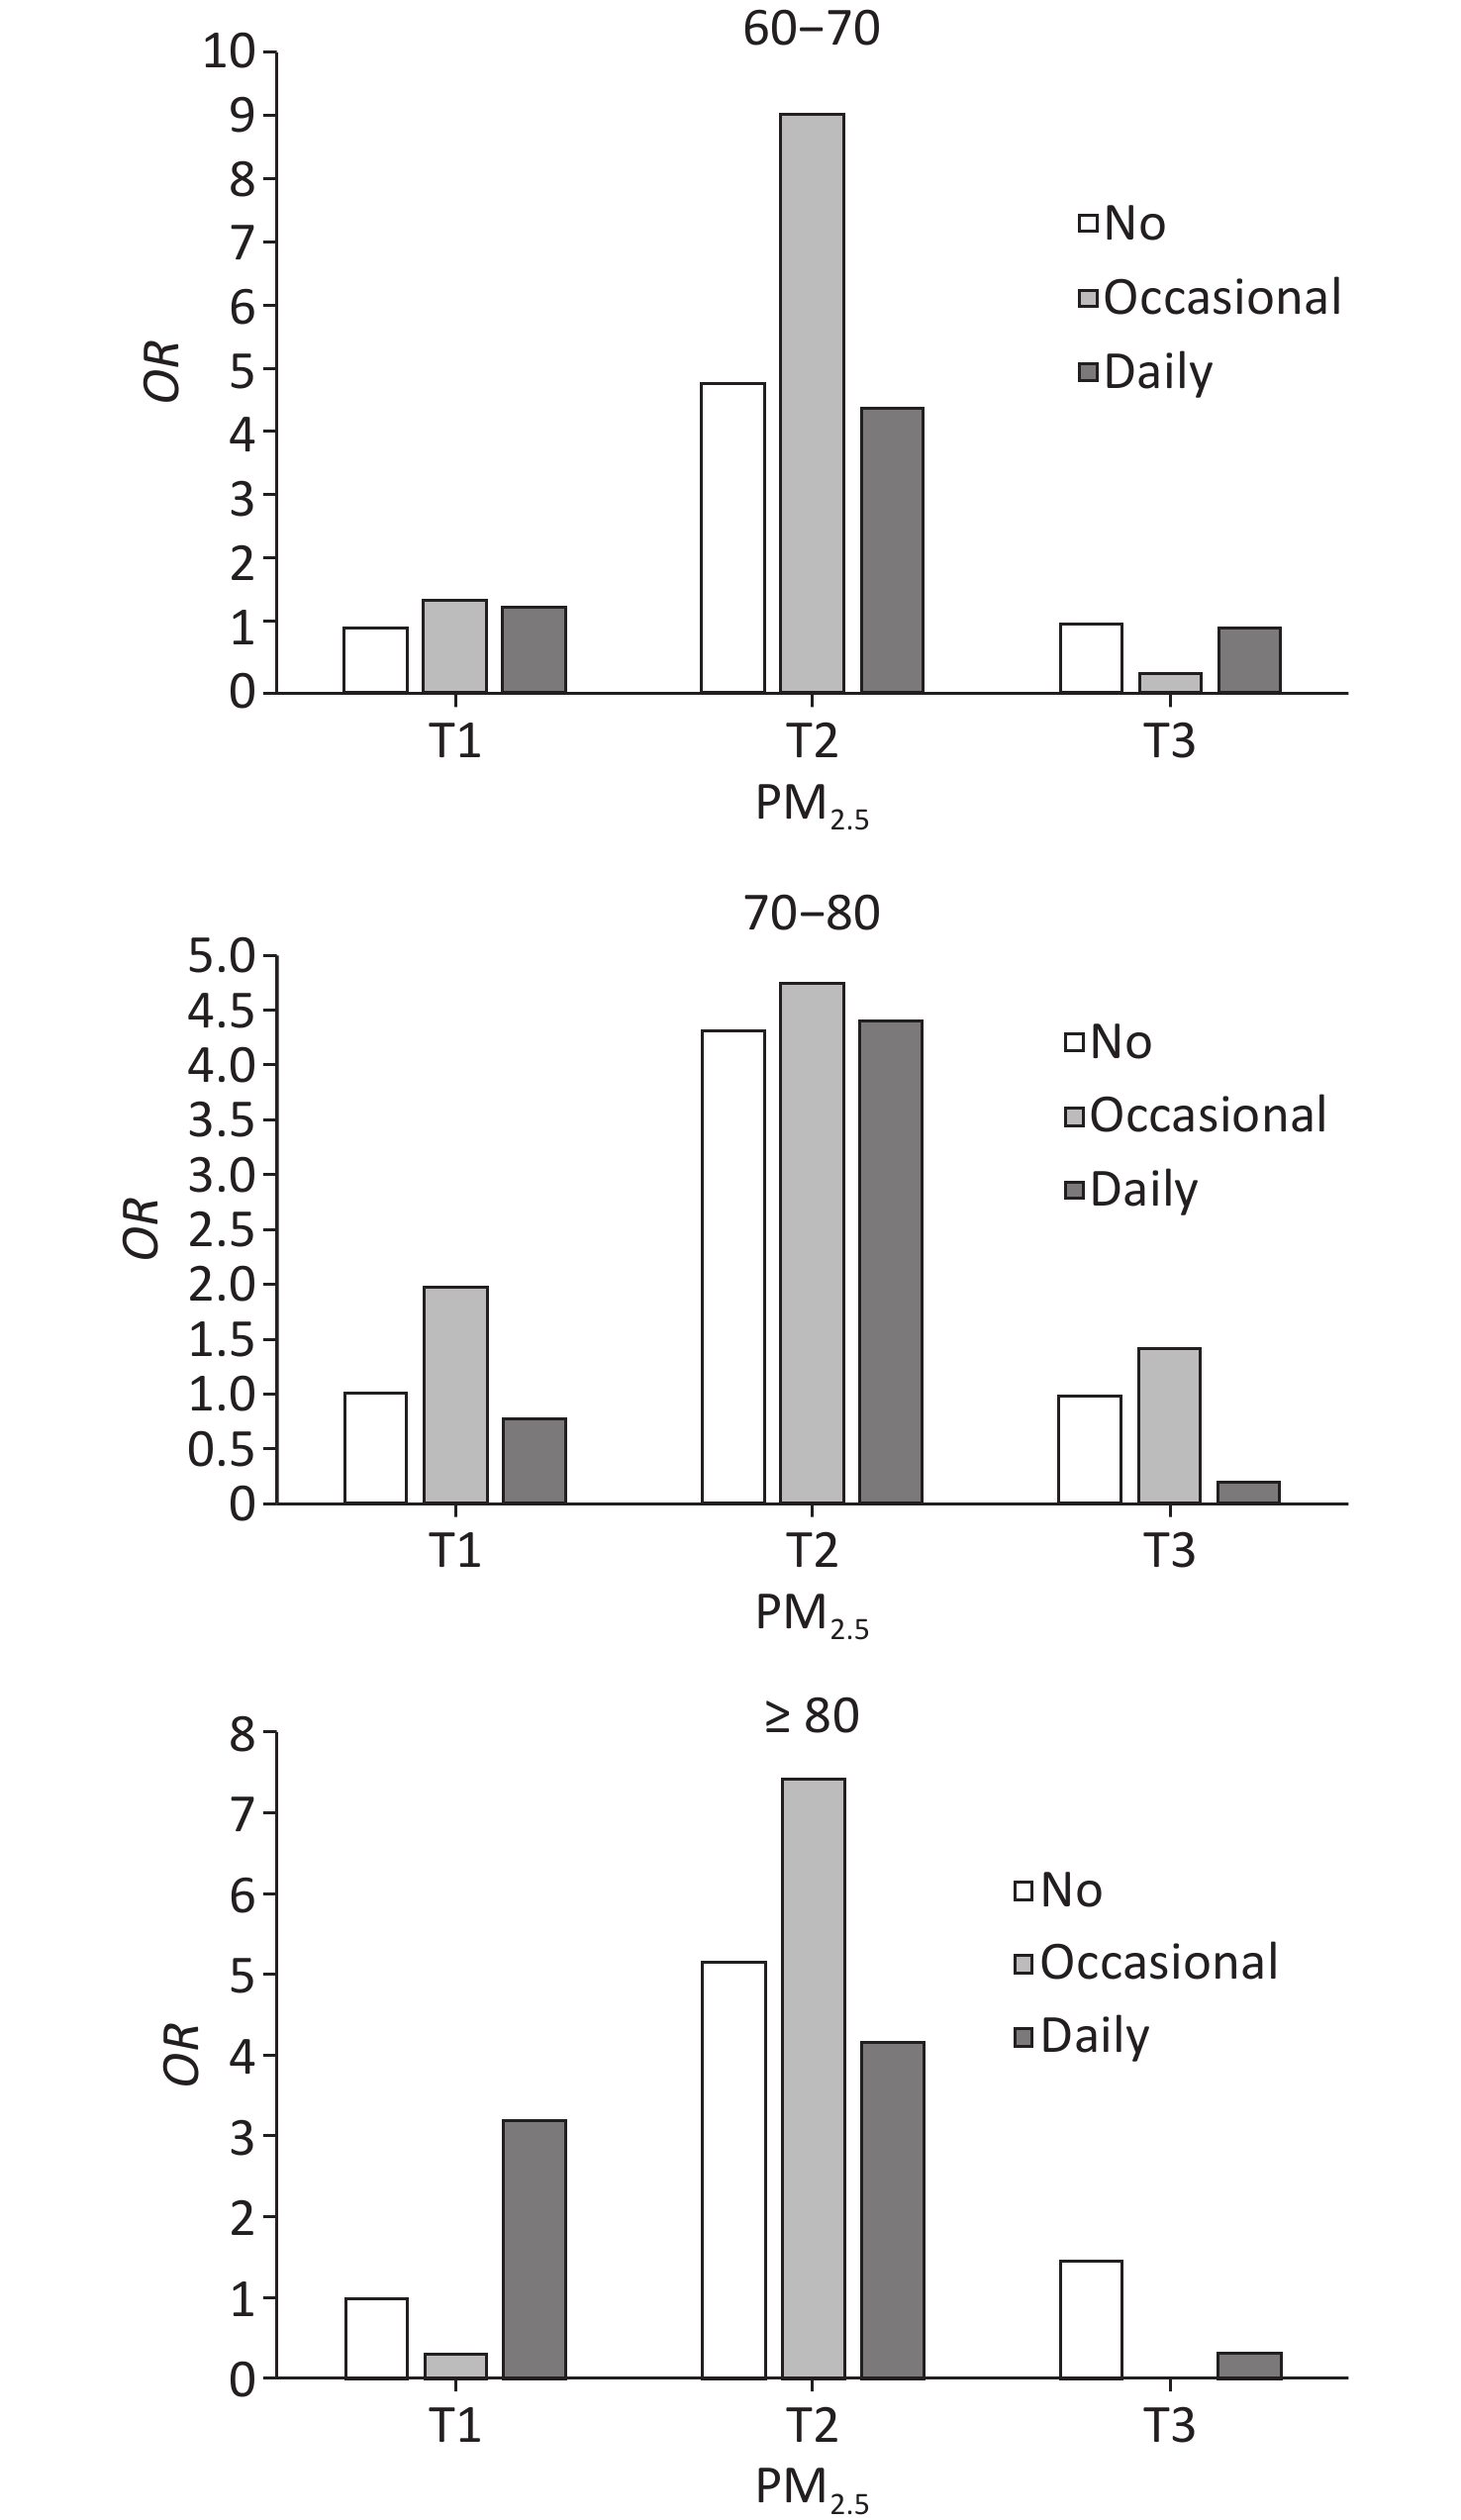
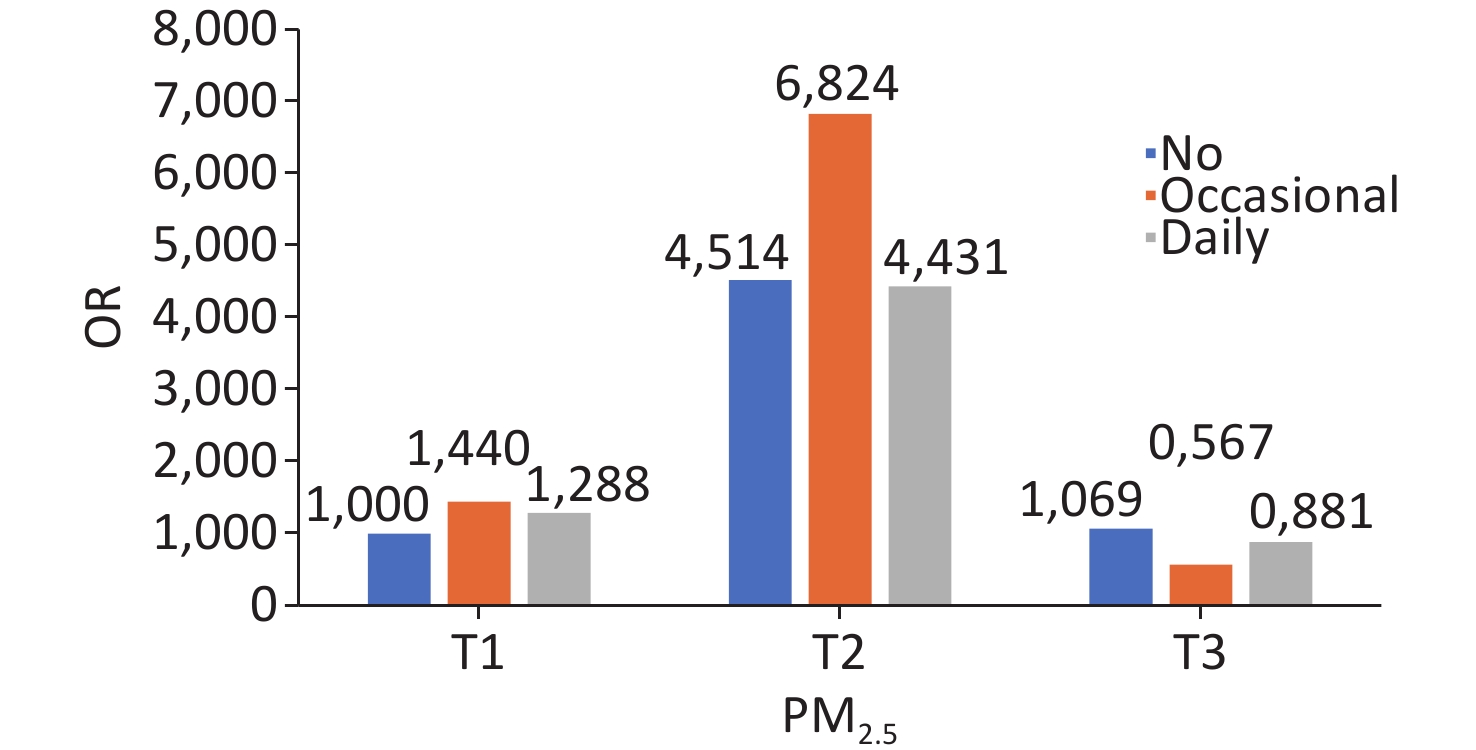
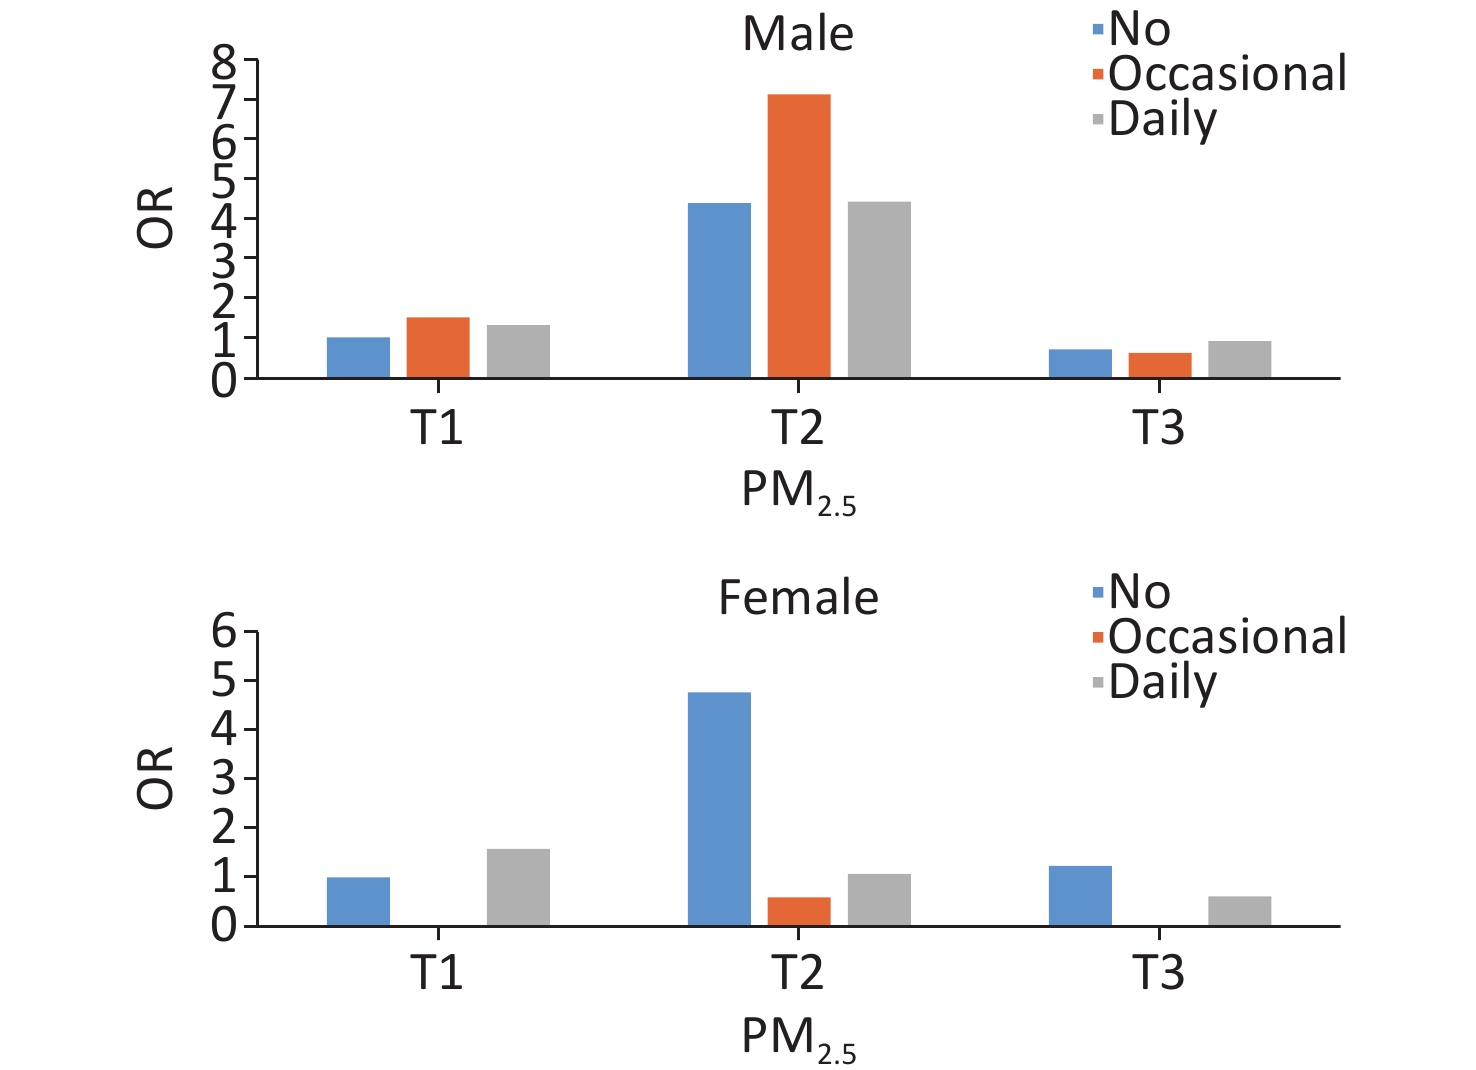
lowerP-value PM2.5 < 0.0001 < 0.0001 < 0.0001 T1 ref ref ref T2 4.881 4.866 4.896 10.730 10.560 10.902 2.841 2.826 2.857 T3 1.084 1.080 1.087 0.524 0.512 0.537 0.755 0.749 0.760 Note. Adjusted covariates included sample weight, age group, sex, location, educational level, marital status, occupation, living status, socializing with neighbors, social activity, alcohol consumption, regular exercise, activities of daily living, Parkinson’s symptoms, and BMI/PM2.5. T1, low; T2, medium; T3, high; CI, confidence interval; OR, odds ratio; BMI, body mass index. A significant joint effect of PM2.5 exposure and smoking frequency was observed (Figure 2). In the full model with adjustment for all covariates, the risk of short-term cognitive impairment was significantly higher in the group of moderate PM2.5 exposure and occasional smokers than in the other groups (OR = 6.824 [95% CI: 6.794−6.854]; P < 0.0001). The same trend was observed in most subgroup analyses of age and sex, except in women (Supplementary Figures S3 and S4).
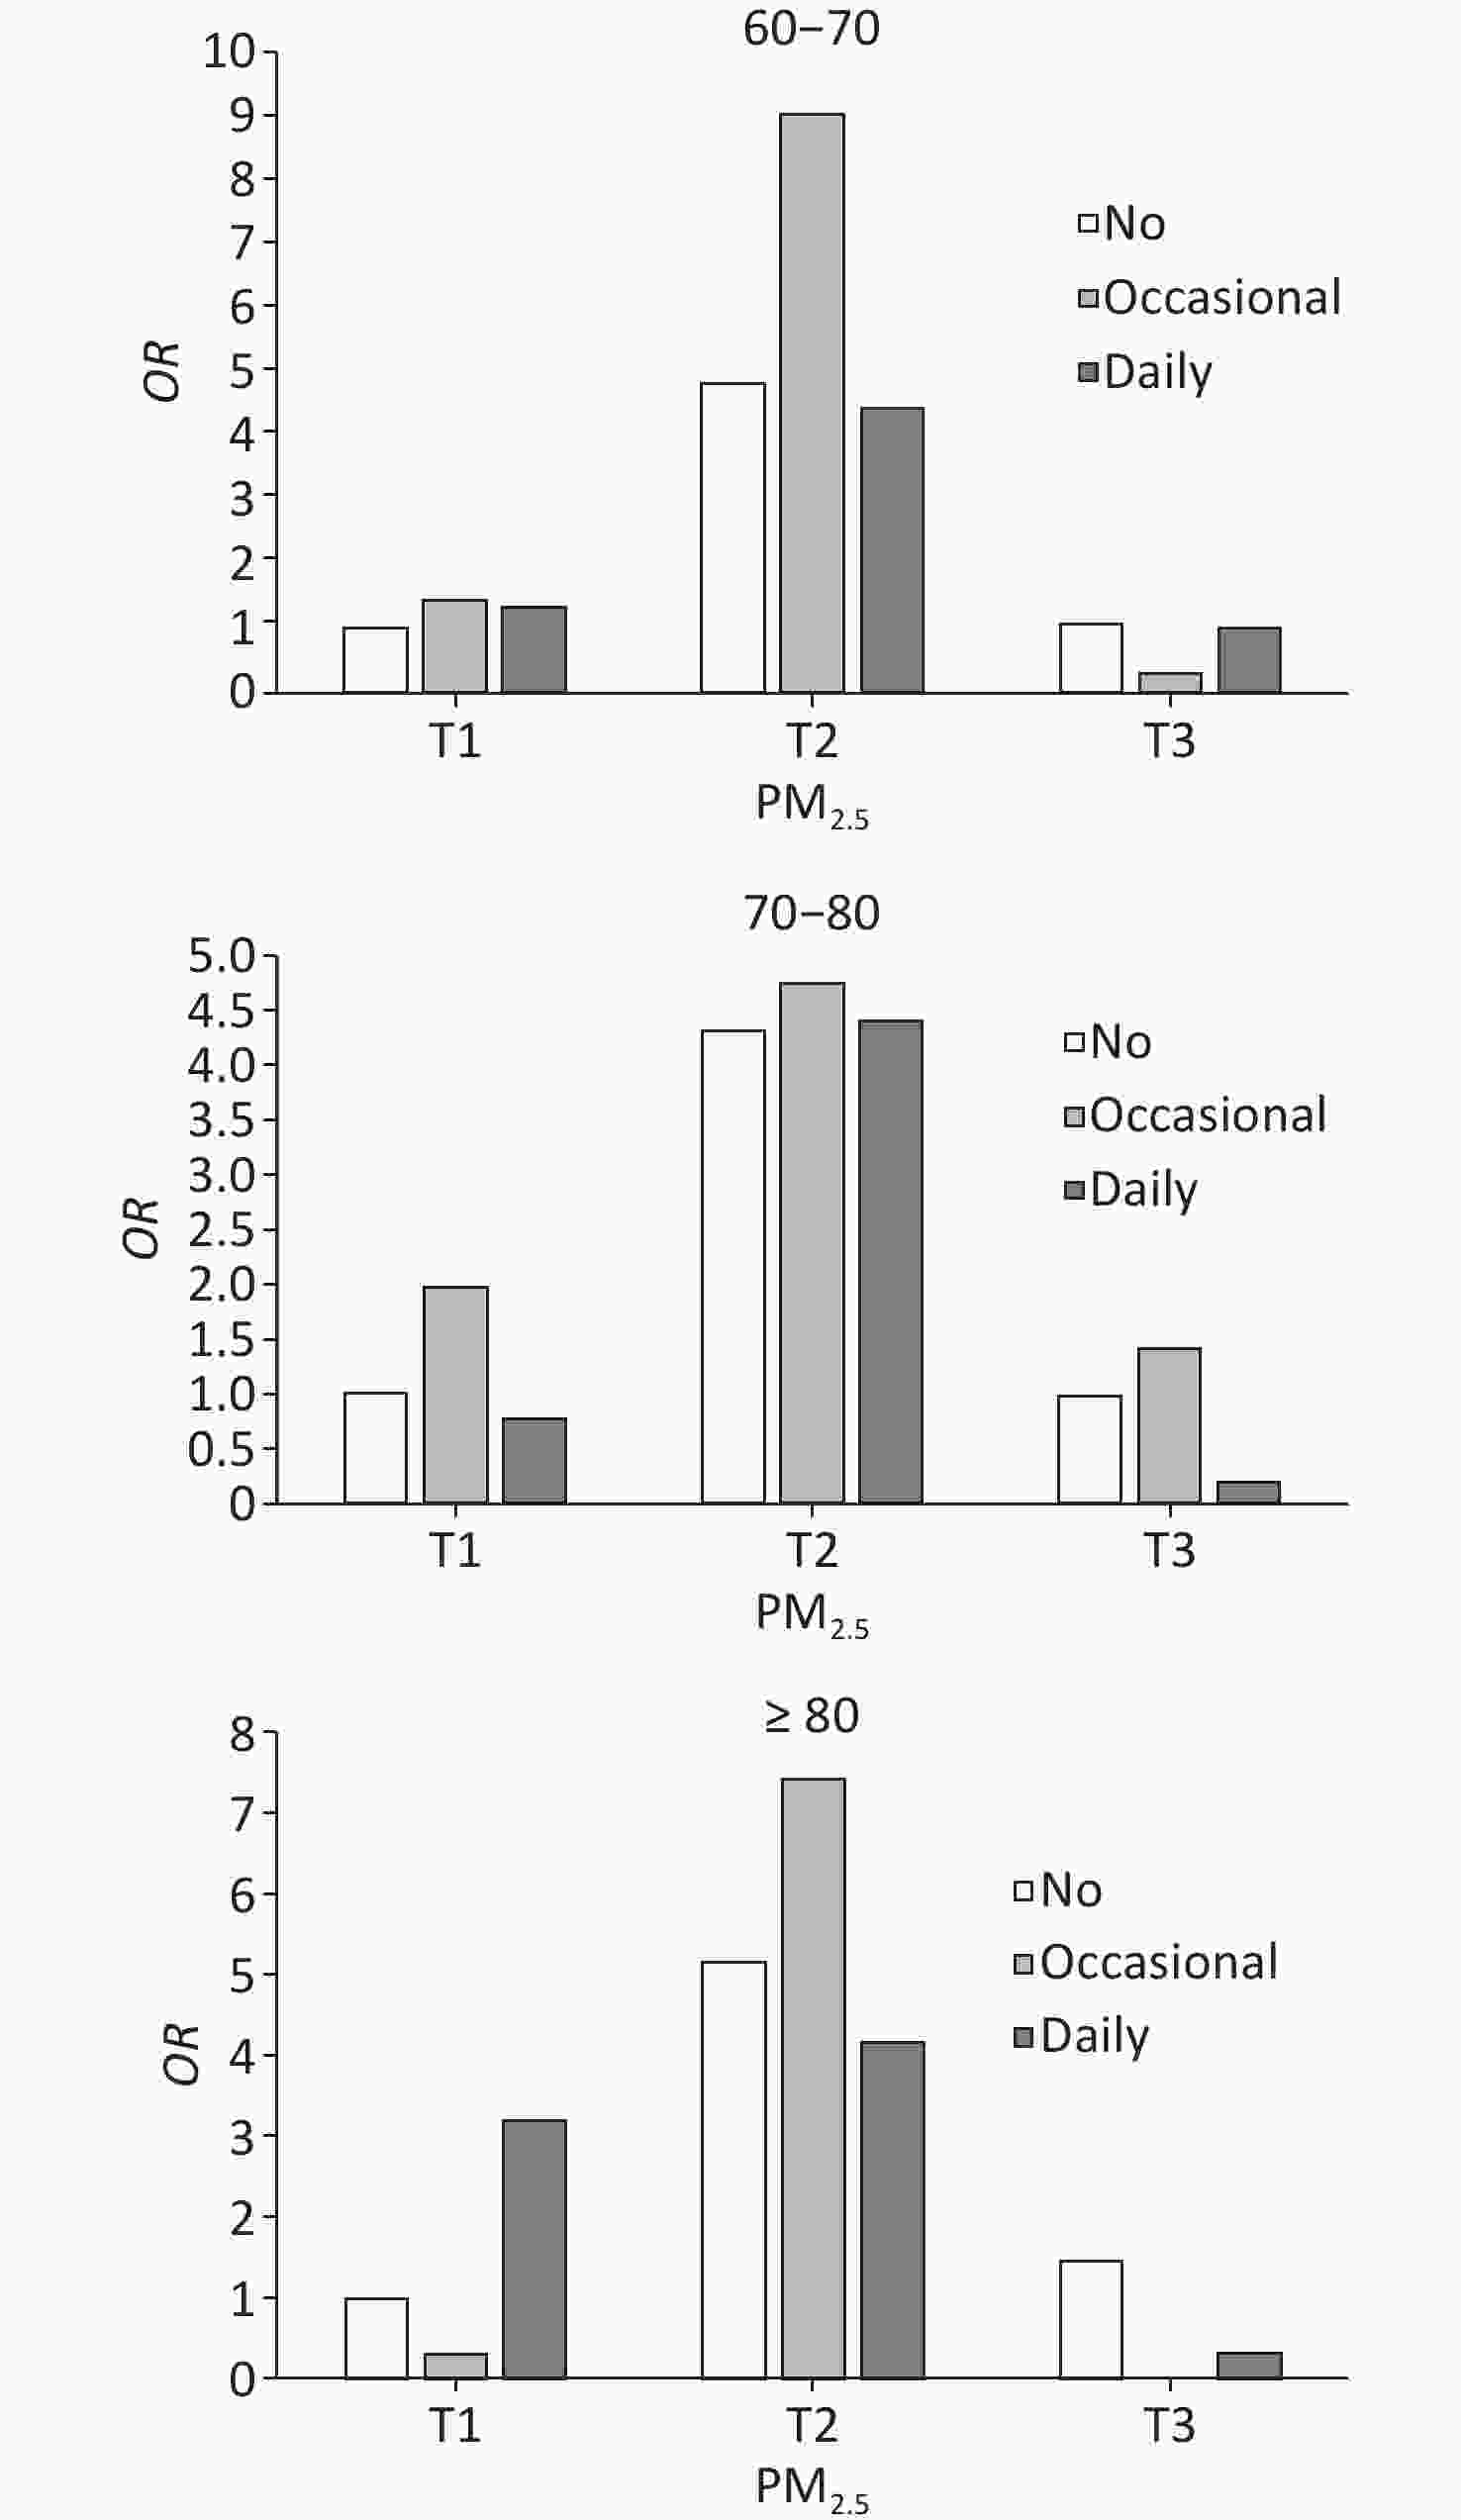
Figure 2. Joint effects of PM2.5 and smoking on cognitive impairment.

Figure S3. Sex subgroup analysis of joint effects of PM2.5 and smoking on cognitive impairment.
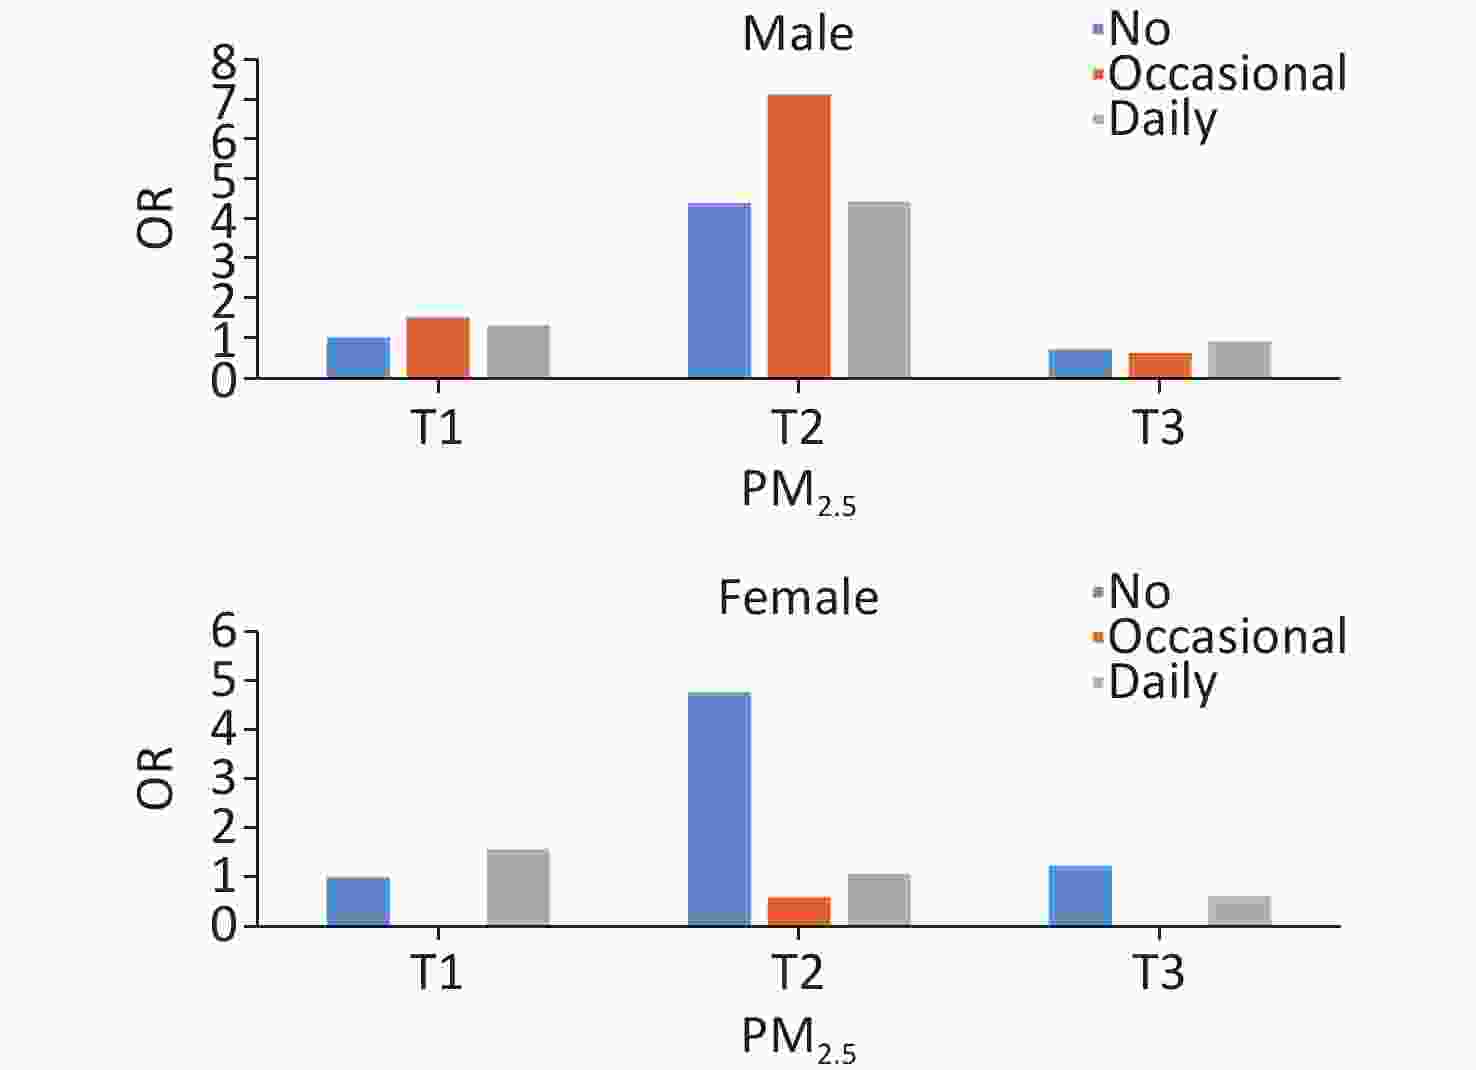
Figure S4. Age subgroup analysis of joint effects of PM2.5 and smoking on cognitive impairment.
-
To the best of our knowledge, this is one of the few epidemiological investigations of PM2.5, smoking, and neurodegenerative diseases in East Asian countries. We analyzed the combined effects of the exposure to different concentrations of ambient PM2.5 and smoking on the risks of dementia and cognitive impairment in older community-dwelling people. This study provides data for examining the links between the environment and cognition as well as a scientific basis for dementia prevention policies.
Although environmental pollution in China has recently decreased annually, the mean PM2.5 exposure concentration of 48.4 μg/m3 in the six provinces remains high compared with those in Nordic and other European countries, such as 11 μg/m3 in the U.K. from 2005 to 2010 and 15 μg/m3 in France in 2015[35–37]. This information regarding the complementary effects of smoking and PM2.5 fills the gap in the epidemiological surveys on PM2.5 and cognitive correlations in higher-pollution areas. We found that older residents in communities exposed to higher concentrations of ambient PM2.5 were at a higher risk of dementia after adjusting for covariates and controlling for smoking variables. This is consistent with the findings of previous studies and epidemiological investigations in Chinese populations[36,38,39]. Hu et al. (2022) noted that the recent reduction in PM2.5 in China has had a protective effect on cognition[40]. Similarly, evidence from the China Health and Retirement Longitudinal Study shows that PM1, PM2.5, and PM10 are significantly associated with cognitive impairment and can be influenced by smoking status[39]. Similarly, differences in cognition-related biomarkers were observed in the cerebrospinal fluid of children in the Mexico City metropolitan area who were continuously exposed to high levels of PM2.5 and other pollutants before and after birth compared with those breathing clean air[12]. A community-based survey in the USA showed that seniors living in areas with high concentrations of PM2.5 scored lower on working memory and orientational recognition tests than those in areas with low PM2.5 concentrations[41].
Smoking was also considered in this study. The current findings on smoking and cognition are inconsistent, with some studies reporting that smoking is a risk factor for dementia, others claiming that this correlation is weak, and some suggesting that the risk of dementia is reduced in people who regularly smoke[24,25,42–44]. In this study, after adjusting for covariates and controlling for PM2.5, daily smokers had a higher risk of developing dementia than occasional smokers and nonsmokers. A meta-analysis of 37 studies using a random-effects model showed that current smokers had a higher probability of developing dementia than nonsmokers (risk ratio, 1.3)[45]. Another meta-analysis including 19 prospective studies found that the risk of dementia was 1.27 times higher among smokers at baseline than among nonsmokers[24]. Although smoking may have benefits for cognitive health in older adults, the overall health risks far outweigh these benefits, and tobacco control remains a public health priority. Local governments in Beijing and Shanghai have implemented tobacco control policies that have notably reduced smoking rates and improved public health. However, a nationwide smoking ban has not yet been implemented[46]. The enforcement of laws and regulations should be strengthened, tobacco taxes should be increased, and tobacco control education campaigns should be implemented to further reduce the adverse impact of smoking on the cognitive health of older people.
We analyzed the separate and combined effects of the differences in short-term ambient PM2.5 concentrations and smoking frequencies on cognitive reduction using 2 years of follow-up data. The risk of short-term cognitive impairment was higher among occasional smokers in both the full model and subgroup analyses controlling for PM2.5. In all three models, daily smoking was inversely associated with short-term cognitive impairment, which is consistent with the results of previous surveys[43,47]. Nourse et al. (2021) noted that because nicotine-induced protective mechanisms are likely dependent on the mitogenic factors PINK-1 and PDR-1, smoking provides selective protection of some neurons[44]. Another study reported that cigarette smoking was not a risk factor for dementia[42]. We assume that this may have been due to smoking being a hobby for some, with regular smoking being generally perceived as more enjoyable when interacting with people; notably, gregariousness is a long-recognized protective factor for cognition[48,49].
We explored the joint effects of short-term PM2.5 exposure and different smoking frequencies on cognitive impairment. We found that elderly people who lived in an environment with moderate levels of PM2.5 and smoked occasionally were more likely to have cognitive impairment in the short term, and this joint effect was insignificant for those exposed to low and high levels of PM2.5. We found that elderly people exposed to moderate levels of PM2.5 and who were occasional smoking were more prone to short-term cognitive impairment, a result that contrasts with the widely held view that higher PM2.5 concentrations and frequent smoking are associated with an increased risk of dementia[36,38,45]. This suggests that additional factors modulate the impact of environmental and behavioral risks on dementia and cognitive impairment. Furthermore, the baseline data revealed that individuals exposed to poor air quality and who were frequent smokers were at a higher risk of developing dementia. These findings underscore the complexity of the etiologies of dementia and cognitive impairment, highlighting the need for a more refined understanding of the contributing risk factors.
In our age and sex subgroup analysis, we observed a higher risk of cognitive impairment among those exposed to moderate PM2.5 concentrations, especially in the 60 to 70-year-old group. Smoking showed a protective effect for women in the group with the highest exposure to PM2.5 compared with not smoking. Both PM2.5 and tobacco smoke are environmental pollutants with complex components, and PM2.5 affects cognition through inflammation and atherosclerosis pathways, similar to the pathways affected by smoking[47,50]. Although the underlying mechanisms are unclear, a link between inflammation of the middle-sequence nervous system and neurodegenerative diseases has been recognized[21,51,52]. The smoking rate in women was much lower than that in men in this study population, probably resulting in a stronger converse addictive effect of PM2.5 and smoking on women’s cognitive functioning because nonsmokers are more vulnerable to the adverse effects of PM2.5[53].
This may be the first nationally representative study examining the combined effects of ambient PM2.5 levels and smoking on cognition. In addition, in our study, a clinically confirmed diagnosis of dementia was required, which is less common in large epidemiological surveys, rather than relying on questionnaire measures. However, some limitations should be noted when interpreting our results. First, we only explored PM2.5, smoking, and other environmental pollutants including particulate matter, nitrogen oxide, carbon monoxide, and indoor pollutants, as well as passive smoking, solid fuels used for cooking, and occupational environmental pollution, may have been influencing factors. Therefore, more detailed studies are required at the regional level on environmental pollutants with a more precise determination of smoking frequency in relation to cognition at. Second, the PM2.5 used for analysis was an annual average; more accurate data were not available for the specific geographic locations of the individuals, and the lifetime residence of the survey respondents was unknown, potentially limiting the PM2.5 data. Third, the follow-up data included a clinically confirmed diagnosis of dementia; hence, cognitive impairment could only be assessed based on a combination of self-reported history of the disease, AD8, and the MMSE questionnaire results. Finally, information on demographic characteristics and lifestyle was obtained through face-to-face interviews, which may have led to recall bias.
The risk of dementia in older community-dwelling adults increases with increasing ambient PM2.5 concentrations and smoking frequency. At a certain level of ambient PM2.5, older adults who smoked were occasionally more likely to suffer cognitive impairment in the short term than daily smokers; however, the long-term effects need to be explored in future studies. We emphasize that lowering ambient PM2.5 concentrations and smoking cessation are recommended to promote health, and stricter environmental protection policies could improve people’s living environments.
-
Table S2. Sex subgroup analysis of association of PM2.5 and smoking with short-term cognitive impairment
Variables Male Female OR 95% CI P-value OR 95% CI P-value PM2.5 < 0.0001 < 0.0001 T1 ref ref T2 3.873 3.859 3.887 4.718 4.702 4.735 T3 0.664 0.661 0.667 1.227 1.222 1.232 Smoking < 0.0001 < 0.0001 None ref ref Occasional 1.574 1.568 1.579 0.115 0.111 0.119 Daily 1.058 1.056 1.061 0.272 0.269 0.275 Note. Adjusted covariates included sample weight, age group, location, educational level, marital status, occupation, living status, socializing with neighbors, social activities, alcohol consumption, regular exercise, activities of daily living, Parkinson’s symptoms, BMI, and smoking//PM2.5. T1, low; T2, medium; T3, high; CI , confidence interval; OR , odds ratio; BMI, body mass index. Table S3. Age subgroup analysis of association of PM2.5 and smoking with short-term cognitive impairment
Variables 60–70 70–80 ≥ 80 OR 95% CI P-value OR 95% CI P-value OR 95% CI P-value PM2.5 < 0.0001 < 0.0001 < 0.0001 T1 T2 4.386 4.372 4.400 4.448 4.428 4.469 3.993 3.960 4.025 T3 0.948 0.944 0.952 0.911 0.906 0.916 1.071 1.062 1.080 Smoking < 0.0001 < 0.0001 < 0.0001 None Occasional 1.691 1.684 1.698 1.167 1.159 1.174 1.240 1.226 1.254 Daily 0.963 0.961 0.966 0.940 0.937 0.944 0.979 0.972 0.986 Note. Adjusted covariates included sample weight, sex, location, educational level, marital status, occupation, living status, socializing with neighbors, social activities, alcohol consumption, regular exercise, activities of daily living, Parkinson’s symptom, BMI, and smoking//PM2.5. T1, low; T2, medium; T3, high; CI , confidence interval; OR , odds ratio; BMI, body mass index.
doi: 10.3967/bes2024.181
Separate and Combained Associations of PM2.5 Exposure and Smoking with Dementia and Cognitive Impairment
-
Abstract:
Objective The results of limited studies on the relationship between environmental pollution and dementia have been contradictory. We analyzed the combined effects of PM2.5 and smoking on the prevalence of dementia and cognitive impairment in an elderly community-dwelling Chinese population. Methods We assessed 24,117 individuals along with the annual average PM2.5 concentrations from 2012 to 2016. Dementia was confirmed in the baseline survey at a qualified clinical facility, and newly suspected dementia was assessed in 2017, after excluding cases of suspected dementia in 2015. National census data were used to weight the sample data to reflect the entire population in China, with multiple logistic regression performed to analyze the combined effects of PM2.5 and smoking frequency on dementia and cognitive impairment. Results Individuals exposed to the highest PM2.5 concentration and smoked daily were at higher risk of dementia than those in the lowest PM2.5 concentration group (OR, 1.603; 95% CI [1.626−1.635], P < 0.0001) and in the nonsmoking group (OR, 1.248; 95% CI [1.244−1.252]; P < 0.0001). Moderate PM2.5 exposure and occasional smoking together increased the short-term risk of cognitive impairment. High-level PM2.5 exposure and smoking were associated with an increased risk of dementia, so more efforts are needed to reduce this risk through environmental protection and antismoking campaigns. Conclusion High-level PM2.5 exposure and smoking were associated with an increased risk of dementia. Lowering the ambient PM2.5, and smoking cessation are recommended to promote health. -
Key words:
- PM2.5 exposure /
- Smoking /
- Dementia /
- Cognitive impairment /
- Environmental protection /
- Smoking cessation
The authors have no conflicts of interest to declare.
This study received ethical approval from the National Center for Chronic and Noncommunicable Disease Control and Prevention and the Chinese Center for Disease Control and Prevention, and a proof/certificate of approval is available upon request (Permit Number: 201620). All participants provided written informed consent, in accordance with the Declaration of Helsinki.
&These authors contributed equally to this work.
注释:1) Authors' Contributions: 2) Competing Interests: 3) Ethics: -
Figure 1. Flowchart of participant selection. AD8, Chinese version of the Ascertain Dementia 8; MMSE, Mini-Mental State Examination.
S2. Proportion of dementia and cognitive impairment in PM2.5 and smoking subgroups. The x axis shows PM2.5 or smoking groups, and then y axis shows the proportion in percentage. (A) Proportion of dementia in PM2.5 groups. (B) Proportion of cognitive impairment in PM2.5 groups. (C) Proportion of dementia in smoking groups. (D) Proportion of cognitive impairment in smoking groups. P < 0.05 of logistic regression in A to D.
Figure 2. Joint effects of PM2.5 and smoking on cognitive impairment.
The adjusted covariates included sample weight, age group, sex, location, educational level, marital status, occupation, living status, socialization with neighbors, social activities, alcohol consumption, regular exercise, activities of daily living, Parkinson’s symptoms, and BMI.
S3. Sex subgroup analysis of joint effects of PM2.5 and smoking on cognitive impairment.
The adjusted covariates included sample weight, age group, location, educational level, marital status, occupation, living status, socialization with neighbors, social activities, alcohol consumption, regular exercise, activities of daily living, Parkinson’s symptoms, and BMI.
S4. Age subgroup analysis of joint effects of PM2.5 and smoking on cognitive impairment.
The adjusted covariates included sample weight, sex, location, educational level, marital status, occupation, living status, socialization with neighbors, social activity, alcohol consumption, regular exercise, activities of daily living, Parkinson’s symptoms, and BMI.
Table 1. Baseline characteristics of particulate matter with aerodynamic diameter ≤ 2.5 μm and smoking status
Characteristics PM2.5, N (%) Smoking, N (%) Total T1 T2 T3 No Occasionally Daily Location Urban 12,950 (53.7) 2,985 (37.2) 3,855 (48.3) 6,110 (75.3) 10,937 (56.4) 389 (52.4) 1,624 (40.9) Rural 11,167 (46.3) 5,042 (62.8) 4,121 (51.7) 2,004 (24.7) 8,467 (43.6) 353 (47.6) 2,347 (59.1) Age groups, years 60– 12,379 (51.3) 4,418 (55.0) 3,967 (49.7) 3,994 (49.2) 9,725 (50.1) 337 (45.4) 2,317 (58.3) 70– 8,715 (36.1) 2,645 (33.0) 2,996 (37.6) 3,074 (37.9) 7,143 (36.8) 273 (36.8) 1,299 (32.7) ≥ 80 3,023 (12.5) 964 (12.0) 1,013 (12.7) 1,046 (12.9) 2,536 (13.1) 132 (17.8) 355 (8.9) Sex Male 10,722 (44.5) 3,575 (44.5) 3,580 (44.9) 3,567 (44.0) 6,397 (33.0) 573 (77.2) 3,752 (94.5) Female 13,395 (55.5) 4,452 (55.5) 4,396 (55.1) 4,547 (56.0) 13,007 (67.0) 169 (22.8) 219 (5.5) Education level Illiteracy 9,544 (39.6) 3,761 (46.9) 3,921 (49.2) 1,862 (22.9) 7,931 (40.9) 354 (47.7) 1,259 (31.7) Primary school 7,548 (31.3) 2,823 (35.2) 2,193 (27.5) 2,532 (31.2) 5,776 (29.8) 235 (31.7) 1,537 (38.7) Secondary school and above 7,025 (29.1) 1,443 (18.0) 1,862 (23.3) 3,720 (45.8) 5,697 (29.4) 153 (20.6) 1,175 (29.6) Marital status Married 18,435 (76.4) 6,027 (75.1) 6,076 (76.2) 6,332 (78.0) 14,706 (75.8) 437 (58.9) 3,292 (82.9) Single/divorced/widowed 5,682 (23.6) 2,000 (24.9) 1,900 (23.8) 1,782 (22.0) 4,698 (24.2) 305 (41.1) 679 (17.1) Occupation Farmer 14,001 (58.1) 6,952 (86.6) 4,510 (56.5) 2,539 (31.3) 11,123 (57.3) 366 (49.3) 2,512 (63.3) Worker 5,873 (24.4) 584 (7.3) 2,254 (28.3) 3,035 (37.4) 4,680 (24.1) 300 (40.4) 893 (22.5) Nonmanual worker 4,243 (17.6) 491 (6.1) 1,212 (15.2) 2,540 (31.3) 3,601 (18.6) 76 (10.2) 566 (14.3) Living status Alone/with others 2,824 (11.7) 719 (9.0) 1,021 (12.8) 1,084 (13.4) 2,268 (11.7) 94 (12.7) 462 (11.6) With family 21,293 (88.3) 7,308 (91.0) 6,955 (87.2) 7,030 (86.6) 17,136 (88.3) 648 (87.3) 3,509 (88.4) Socializing with neighbors Rarely 3,459 (14.3) 1,055 (13.1) 799 (10.0) 1,605 (19.8) 2,750 (14.2) 105 (14.2) 604 (15.2) Occasional 3,614 (15.0) 996 (12.4) 1,326 (16.6) 1,292 (15.9) 2,815 (14.5) 276 (37.2) 523 (13.2) Daily 17,044 (70.7) 5,976 (74.4) 5,851 (73.4) 5,217 (64.3) 13,839 (71.3) 361 (48.7) 2,844 (71.6) Social activity Rarely 13,674 (56.7) 5,307 (66.1) 3,904 (48.9) 4,463 (55.0) 11,011 (56.7) 287 (38.7) 2,376 (59.8) Occasional 5,168 (21.4) 1,091 (13.6) 2,293 (28.7) 1,784 (22.0) 4,159 (21.4) 155 (20.9) 854 (21.5) Often 5,275 (21.9) 1,629 (20.3) 1,779 (22.3) 1,867 (23.0) 4,234 (21.8) 300 (40.4) 741 (18.7) Alcohol consumption No 18,661 (77.4) 5,980 (74.5) 6,435 (80.7) 6,246 (77.0) 16,499 (85.0) 290 (39.1) 1,872 (47.1) Occasional 2,432 (10.1) 883 (11.0) 573 (7.2) 976 (12.0) 1,496 (7.7) 355 (47.8) 581 (14.6) Daily 3,024 (12.5) 1,164 (14.5) 968 (12.1) 892 (11.0) 1,409 (7.3) 97 (13.1) 1,518 (38.2) Regular exercise Occasional 4,794 (19.9) 1,857 (23.1) 1,509 (18.9) 1,428 (17.6) 3,817 (19.7) 237 (31.9) 740 (18.6) Often 19,323 (80.1) 6,170 (76.9) 6,467 (81.1) 6,686 (82.4) 15,587 (80.3) 505 (68.1) 3,231 (81.4) Activities of daily living Normal 20,724 (85.9) 6,629 (82.6) 7,064 (88.6) 7,031 (86.7) 16,500 (85.0) 658 (88.7) 3,566 (89.8) Mild 2,952 (12.2) 1,240 (15.4) 820 (10.3) 892 (11.0) 2,517 (13.0) 76 (10.2) 359 (9.0) Moderate 271 (1.1) 114 (1.4) 42 (0.5) 115 (1.4) 232 (1.2) 6 (0.8) 33 (0.8) Severe 170 (0.7) 44 (0.5) 50 (0.6) 76 (0.9) 155 (0.8) 2 (0.3) 13 (0.3) Parkinson’s symptoms Normal 20,469 (84.9) 6,731 (83.9) 7,368 (92.4) 6,370 (78.5) 16,324 (84.1) 641 (86.4) 3,504 (88.2) PD symptoms 3,648 (15.1) 1,296 (16.1) 608 (7.6) 1,744 (21.5) 3,080 (15.9) 101 (13.6) 467 (11.8) BMI Low weight 1,665 (6.9) 690 (8.6) 638 (8.0) 337 (4.2) 1,231 (6.3) 60 (8.1) 374 (9.4) Normal 12,427 (51.5) 4,220 (52.6) 4,300 (53.9) 3,907 (48.2) 9,628 (49.6) 471 (63.5) 2,328 (58.6) Overweight 7,561 (31.4) 2,270 (28.3) 2,349 (29.5) 2,942 (36.3) 6,379 (32.9) 164 (22.1) 1,018 (25.6) Obese 2,464 (10.2) 847 (10.6) 689 (8.6) 928 (11.4) 2,166 (11.2) 47 (6.3) 251 (6.3) Total 24,117 (100.0) 8,027 (100.0) 7,976 (100.0) 8,114 (100.0) 19,404 (100.0) 742 (100.0) 3,971 (100.0) Note. T1, low; T2, medium; T3, high.  下载: 导出CSV
S1. Baseline characteristics of those in the different cognitive function groups
Characteristics Total Normal Abnormal N % p-value N % N % Location 0.0020 Urban 12,950 53.7 12,594 53.9 356 48.1 Rural 11,167 46.3 10,783 46.1 384 51.9 Age group (years) < 0.0001 60– 12,379 51.3 12,177 52.1 202 27.3 70– 8,715 36.1 8,397 35.9 318 43.0 ≥ 80 3,023 12.5 2,803 12.0 220 29.7 Sex < 0.0001 Male 10,722 44.5 10,502 44.9 220 29.7 Female 13,395 55.5 12,875 55.1 520 70.3 Total 24,117 100.0 23,377 100.0 740 100.0
下载: 导出CSV
Table 2. Association of PM2.5 and smoking with dementia in multivariate regression models
Variables Model 1 Model 2 Model 3 OR 95% CI,
upper95% CI,
lowerP-value OR 95% CI,
upper95% CI,
lowerP-value OR 95% CI,
upper95% CI,
lowerP-value PM2.5 < 0.0001 < 0.0001 < 0.0001 T1 ref ref ref T2 1.105 1.102 1.108 1.202 1.198 1.206 1.204 1.200 1.208 T3 2.095 2.090 2.101 1.627 1.623 1.632 1.630 1.626 1.635 Smoking < 0.0001 < 0.0001 < 0.0001 None ref ref ref Occasional 1.277 1.270 1.285 1.199 1.192 1.207 1.224 1.217 1.232 Daily 0.988 0.985 0.991 1.172 1.168 1.175 1.248 1.244 1.252 Note. Model 1: Adjusted covariates included sample weight, age groups, and sex. Model 2: Adjusted covariates included sample weight, age groups, sex, location, educational level, marital status, occupation, living status, socializing with neighbors, social activity, alcohol consumption, regular exercise, activities of daily living, Parkinson’s symptoms, and BMI. Model 3: Model 2 + smoking/PM2.5. T1, low; T2, medium; T3, high; CI, confidence interval; OR, odds ratio; BMI, body mass index.
下载: 导出CSV
Table 3. Association of PM2.5 and smoking with short-term cognitive impairment in multivariate regression models
Variables Model 1 Model 2 Model 3 OR 95% CI,
upper95% CI,
lowerP-value OR 95% CI,
upper95% CI,
lowerP-value OR 95% CI,
upper95% CI,
lowerP-value PM2.5 < 0.0001 < 0.0001 < 0.0001 T1 ref ref ref T2 4.031 4.022 4.040 4.228 4.218 4.239 4.213 4.202 4.224 T3 0.770 0.768 0.772 0.950 0.947 0.953 0.950 0.947 0.953 Smoking < 0.0001 < 0.0001 < 0.0001 None ref ref ref Occasional 1.587 1.582 1.592 1.449 1.444 1.454 1.432 1.427 1.436 Daily 0.908 0.906 0.910 0.913 0.911 0.915 0.997 0.995 0.999 Note. Model 1: Adjusted covariates included sample weight, age groups, and sex. Model 2: Adjusted covariates included sample weight, age groups, sex, location, educational level, marital status, occupation, living status, socializing with neighbors, social activities, alcohol consumption, regular exercise, activities of daily living, Parkinson’s symptoms, and BMI. Model 3: Model 2 + smoking/PM2.5. T1, low; T2, medium; T3, high; CI, confidence interval; OR, odds ratio; BMI, body mass index.
下载: 导出CSV
Table 4. PM2.5 subgroup analysis of association of smoking with short-term cognitive impairment
Variables T1 T2 T3 OR 95% CI,
upper95% CI,
lowerP-value OR 95% CI,
upper95% CI,
lowerP-value OR 95% CI,
upper95% CI,
lowerP-value Smoking < 0.0001 < 0.0001 < 0.0001 None ref ref ref Occasional 1.532 1.513 1.551 1.475 1.470 1.480 0.853 0.837 0.870 Daily 1.307 1.299 1.316 0.967 0.965 0.969 0.967 0.960 0.974 Note. Adjusted covariates included sample weight, age group, sex, location, educational level, marital status, occupation, living status, socializing with neighbors, social activities, alcohol consumption, regular exercise, activities of daily living, Parkinson’s symptom, BMI/PM2.5. T1, low; T2, medium; T3, high; CI, confidence interval; OR, odds ratio; BMI, body mass index.
下载: 导出CSV
Table 5. Smoking subgroup analysis of the association of PM2.5 with short-term cognitive impairment
Variables No Occasional Daily OR 95% CI,
upper95% CI,
lowerP-value OR 95% CI,
upper95% CI,
lowerP-value OR 95% CI,
upper95% CI,
lowerP-value PM2.5 < 0.0001 < 0.0001 < 0.0001 T1 ref ref ref T2 4.881 4.866 4.896 10.730 10.560 10.902 2.841 2.826 2.857 T3 1.084 1.080 1.087 0.524 0.512 0.537 0.755 0.749 0.760 Note. Adjusted covariates included sample weight, age group, sex, location, educational level, marital status, occupation, living status, socializing with neighbors, social activity, alcohol consumption, regular exercise, activities of daily living, Parkinson’s symptoms, and BMI/PM2.5. T1, low; T2, medium; T3, high; CI, confidence interval; OR, odds ratio; BMI, body mass index.
下载: 导出CSV
S2. Sex subgroup analysis of association of PM2.5 and smoking with short-term cognitive impairment
Variables Male Female OR 95% CI P-value OR 95% CI P-value PM2.5 < 0.0001 < 0.0001 T1 ref ref T2 3.873 3.859 3.887 4.718 4.702 4.735 T3 0.664 0.661 0.667 1.227 1.222 1.232 Smoking < 0.0001 < 0.0001 None ref ref Occasional 1.574 1.568 1.579 0.115 0.111 0.119 Daily 1.058 1.056 1.061 0.272 0.269 0.275 Note. Adjusted covariates included sample weight, age group, location, educational level, marital status, occupation, living status, socializing with neighbors, social activities, alcohol consumption, regular exercise, activities of daily living, Parkinson’s symptoms, BMI, and smoking//PM2.5. T1, low; T2, medium; T3, high; CI , confidence interval; OR , odds ratio; BMI, body mass index.
下载: 导出CSV
S3. Age subgroup analysis of association of PM2.5 and smoking with short-term cognitive impairment
Variables 60–70 70–80 ≥ 80 OR 95% CI P-value OR 95% CI P-value OR 95% CI P-value PM2.5 < 0.0001 < 0.0001 < 0.0001 T1 T2 4.386 4.372 4.400 4.448 4.428 4.469 3.993 3.960 4.025 T3 0.948 0.944 0.952 0.911 0.906 0.916 1.071 1.062 1.080 Smoking < 0.0001 < 0.0001 < 0.0001 None Occasional 1.691 1.684 1.698 1.167 1.159 1.174 1.240 1.226 1.254 Daily 0.963 0.961 0.966 0.940 0.937 0.944 0.979 0.972 0.986 Note. Adjusted covariates included sample weight, sex, location, educational level, marital status, occupation, living status, socializing with neighbors, social activities, alcohol consumption, regular exercise, activities of daily living, Parkinson’s symptom, BMI, and smoking//PM2.5. T1, low; T2, medium; T3, high; CI , confidence interval; OR , odds ratio; BMI, body mass index.
下载: 导出CSV
-
[1] GBD 2019 Dementia Forecasting Collaborators. Estimation of the global prevalence of dementia in 2019 and forecasted prevalence in 2050: an analysis for the Global Burden of Disease Study 2019. Lancet Public Health, 2022; 7, e105−25. doi: 10.1016/S2468-2667(21)00249-8 [2] Vetrano DL, Rizzuto D, Calderón-Larrañaga A, et al. Trajectories of functional decline in older adults with neuropsychiatric and cardiovascular multimorbidity: a Swedish cohort study. PLoS Med, 2018; 15, e1002503. doi: 10.1371/journal.pmed.1002503 [3] Jia JP, Wei CB, Chen SQ, et al. The cost of Alzheimer’s disease in China and re-estimation of costs worldwide. Alzheimers Dement, 2018; 14, 483-91. 4. 2020 Alzheimer’s disease facts and figures. Alzheimers Dement, 2020; 16, 391-460. [4] 2020 Alzheimer’s disease facts and figures. Alzheimers Dement, 2020; 16, 391-460. [5] Qi SG, Yin P, Zhang H, et al. Prevalence of dementia in China in 2015: a nationwide community-based study. Front Public Health, 2021; 9, 733314. doi: 10.3389/fpubh.2021.733314 [6] Shimada H, Makizako H, Lee S, et al. Lifestyle activities and the risk of dementia in older Japanese adults. Geriatr Gerontol Int, 2018; 18, 1491−6. doi: 10.1111/ggi.13504 [7] Jang JW, Park JH, Kim S, et al. Prevalence and incidence of dementia in South Korea: a nationwide analysis of the national health insurance service senior cohort. J Clin Neurol, 2021; 17, 249−56. doi: 10.3988/jcn.2021.17.2.249 [8] Wolters FJ, Chibnik LB, Waziry R, et al. Twenty-seven-year time trends in dementia incidence in Europe and the United States: the Alzheimer Cohorts Consortium. Neurology, 2020; 95, e519−31. [9] Satizabal CL, Beiser AS, Chouraki V, et al. Incidence of dementia over three decades in the Framingham heart study. N Engl J Med, 2016; 374, 523−32. doi: 10.1056/NEJMoa1504327 [10] GBD 2016 Disease and Injury Incidence and Prevalence Collaborators. Global, regional, and national incidence, prevalence, and years lived with disability for 328 diseases and injuries for 195 countries, 1990-2016: a systematic analysis for the Global Burden of Disease Study 2016. Lancet, 2017; 390, 1211−59. doi: 10.1016/S0140-6736(17)32154-2 [11] Thiankhaw K, Chattipakorn N, Chattipakorn SC. PM2.5 exposure in association with AD-related neuropathology and cognitive outcomes. Environ Pollut, 2022; 292, 118320. doi: 10.1016/j.envpol.2021.118320 [12] Calderón-Garcidueñas L, Avila-Ramírez J, Calderón-Garcidueñas A, et al. Cerebrospinal fluid biomarkers in highly exposed PM2.5 urbanites: the risk of Alzheimer’s and Parkinson’s diseases in Young Mexico City residents. J Alzheimers Dis, 2016; 54, 597−613. doi: 10.3233/JAD-160472 [13] Shou YK, Huang YL, Zhu XZ, et al. A review of the possible associations between ambient PM2.5 exposures and the development of Alzheimer’s disease. Ecotoxicol Environ Saf, 2019; 174, 344−52. doi: 10.1016/j.ecoenv.2019.02.086 [14] Kang YJ, Tan HY, Lee CY, et al. An air particulate pollutant induces neuroinflammation and neurodegeneration in human brain models. Adv Sci (Weinh), 2021; 8, e2101251. doi: 10.1002/advs.202101251 [15] Lee SH, Chen YH, Chien CC, et al. Three month inhalation exposure to low-level PM2.5 induced brain toxicity in an Alzheimer’s disease mouse model. PLoS One, 2021; 16, e0254587. doi: 10.1371/journal.pone.0254587 [16] Carey IM, Anderson HR, Atkinson RW, et al. Are noise and air pollution related to the incidence of dementia? A cohort study in London, England. BMJ Open, 2018; 8, e022404. doi: 10.1136/bmjopen-2018-022404 [17] Dimakakou E, Johnston HJ, Streftaris G, et al. Is environmental and occupational particulate air pollution exposure related to type-2 diabetes and dementia? A cross-sectional analysis of the UK Biobank. Int J Environ Res Public Health, 2020; 17, 9581. doi: 10.3390/ijerph17249581 [18] Fonken LK, Xu X, Weil ZM, et al. Air pollution impairs cognition, provokes depressive-like behaviors and alters hippocampal cytokine expression and morphology. Mol Psychiatry, 2011; 16, 987−95. doi: 10.1038/mp.2011.76 [19] Johannson KA, Balmes JR, Collard HR. Air pollution exposure: a novel environmental risk factor for interstitial lung disease? Chest, 2015; 147, 1161-7. [20] Illum L. Transport of drugs from the nasal cavity to the central nervous system. Eur J Pharm Sci, 2000; 11, 1−18. doi: 10.1016/S0928-0987(00)00087-7 [21] Stone V, Miller MR, Clift MJD, et al. Nanomaterials versus ambient ultrafine particles: an opportunity to exchange toxicology knowledge. Environ Health Perspect, 2017; 125, 106002. doi: 10.1289/EHP424 [22] Balasubramanian SK, Poh KW, Ong CN, et al. The effect of primary particle size on biodistribution of inhaled gold nano-agglomerates. Biomaterials, 2013; 34, 5439−52. doi: 10.1016/j.biomaterials.2013.03.080 [23] Elder A, Gelein R, Silva V, et al. Translocation of inhaled ultrafine manganese oxide particles to the central nervous system. Environ Health Perspect, 2006; 114, 1172−8. doi: 10.1289/ehp.9030 [24] Anstey KJ, von Sanden C, Salim A, et al. Smoking as a risk factor for dementia and cognitive decline: a meta-analysis of prospective studies. Am J Epidemiol, 2007; 166, 367−78. doi: 10.1093/aje/kwm116 [25] Hahad O, Daiber A, Michal M, et al. Smoking and neuropsychiatric disease-associations and underlying mechanisms. Int J Mol Sci, 2021; 22, 7272. doi: 10.3390/ijms22147272 [26] Jia RR, Wang Q, Huang HY, et al. Cardiovascular disease risk models and dementia or cognitive decline: a systematic review. Front Aging Neurosci, 2023; 15, 1257367. doi: 10.3389/fnagi.2023.1257367 [27] Norton S, Matthews FE, Barnes DE, et al. Potential for primary prevention of Alzheimer’s disease: an analysis of population-based data. Lancet Neurol, 2014; 13, 788−94. doi: 10.1016/S1474-4422(14)70136-X [28] Wang ZH, Qi SG, Zhang H, et al. Design and implementation of a project-prevention and intervention on neurodegenerative disease in the elderly. Chin J Public Health, 2021; 37, 1585−9. (In Chinese) [29] Van Donkelaar A, Martin RV, Brauer M, et al. Global estimates of fine particulate matter using a combined geophysical-statistical method with information from satellites, models, and monitors. Environ Sci Technol, 2016; 50, 3762−72. doi: 10.1021/acs.est.5b05833 [30] Folstein MF, Folstein SE, McHugh PR. “Mini-mental state”. A practical method for grading the cognitive state of patients for the clinician. J Psychiatr Res, 1975; 12, 189−98. doi: 10.1016/0022-3956(75)90026-6 [31] Li T, Wang HL, Yang YH, et al. The reliability and validity of Chinese version of AD8. Chin J Intern Med, 2012; 51, 777−80. (In Chinese) [32] Zhou B, Coorperative Meta-analysis Group of China Obesity Task Force. Predictive values of body mass index and waist circumference to risk factors of related diseases in Chinese adult population. Chin J Epidemiol, 2002; 23, 5−10. (In Chinese) [33] Zhang W, Niu XY, Gao SW, et al. Evaluation of a screening questionnaire for Parkinson’s disease in a Chinese population. J Clin Neurosci, 2014; 21, 278−81. doi: 10.1016/j.jocn.2013.03.027 [34] Li ZZ, Tang Z, Wang R. Status of elderly disability in 7 cities of China. Chin J Epidemiol, 2016; 37, 1561−4. (In Chinese) [35] Paul KC, Haan M, Mayeda ER, et al. Ambient air pollution, noise, and late-life cognitive decline and dementia risk. Annu Rev Public Health, 2019; 40, 203−20. doi: 10.1146/annurev-publhealth-040218-044058 [36] Delgado-Saborit JM, Guercio V, Gowers AM, et al. A critical review of the epidemiological evidence of effects of air pollution on dementia, cognitive function and cognitive decline in adult population. Sci Total Environ, 2021; 757, 143734. doi: 10.1016/j.scitotenv.2020.143734 [37] Mortamais M, Gutierrez LA, De Hoogh K, et al. Long-term exposure to ambient air pollution and risk of dementia: results of the prospective Three-City Study. Environ Int, 2021; 148, 106376. doi: 10.1016/j.envint.2020.106376 [38] Wang JN, Li TT, Lv YB, et al. Fine particulate matter and poor cognitive function among Chinese older adults: evidence from a community-based, 12-year prospective cohort study. Environ Health Perspect, 2020; 128, 067013. doi: 10.1289/EHP5304 [39] Yao YF, Wang K, Xiang H. Association between cognitive function and ambient particulate matters in middle-aged and elderly Chinese adults: evidence from the China Health and Retirement Longitudinal Study (CHARLS). Sci Total Environ, 2022; 828, 154297. doi: 10.1016/j.scitotenv.2022.154297 [40] Hu XM, Nie ZQ, Ou YQ, et al. Air quality improvement and cognitive function benefit: insight from clean air action in China. Environ Res, 2022; 214, 114200. doi: 10.1016/j.envres.2022.114200 [41] Ailshire JA, Clarke P. Fine particulate matter air pollution and cognitive function among U. S. older adults. J Gerontol B Psychol Sci Soc Sci, 2015; 70, 322−8. doi: 10.1093/geronb/gbu064 [42] Abner EL, Nelson PT, Jicha GA, et al. Tobacco smoking and dementia in a Kentucky cohort: a competing risk analysis. J Alzheimers Dis, 2019; 68, 625−33. doi: 10.3233/JAD-181119 [43] Otuyama LJ, Oliveira D, Locatelli D, et al. Tobacco smoking and risk for dementia: evidence from the 10/66 population-based longitudinal study. Aging Ment Health, 2020; 24, 1796−806. doi: 10.1080/13607863.2019.1647140 [44] Nourse JB, Harshefi G, Marom A, et al. Conserved nicotine-activated neuroprotective pathways involve mitochondrial stress. Iscience, 2021; 24, 102140. doi: 10.1016/j.isci.2021.102140 [45] Zhong GC, Wang Y, Zhang Y, et al. Smoking is associated with an increased risk of dementia: a meta-analysis of prospective cohort studies with investigation of potential effect modifiers. PLoS One, 2015; 10, e0118333. doi: 10.1371/journal.pone.0118333 [46] Chan KH, Xiao D, Zhou MG, et al. Tobacco control in China. Lancet Public Health, 2023; 8, e1006−15. doi: 10.1016/S2468-2667(23)00242-6 [47] Chen GC, Hukportie DN, Wan ZX, et al. The association between exposure to air pollution and dementia incidence: the modifying effect of smoking. J Gerontol A Biol Sci Med Sci, 2023; 78, 2309−17. doi: 10.1093/gerona/glac228 [48] Grande G, Qiu CX, Fratiglioni L. Prevention of dementia in an ageing world: evidence and biological rationale. Ageing Res Rev, 2020; 64, 101045. doi: 10.1016/j.arr.2020.101045 [49] Fujita Y, Maki K. Associations of smoking behavior with lifestyle and mental health among Japanese dental students. BMC Med Educ, 2018; 18, 264. doi: 10.1186/s12909-018-1365-1 [50] Künzli N, Jerrett M, Mack WJ, et al. Ambient air pollution and atherosclerosis in Los Angeles. Environ Health Perspect, 2005; 113, 201−6. doi: 10.1289/ehp.7523 [51] Akiyama H, Arai T, Kondo H, et al. Cell mediators of inflammation in the Alzheimer disease brain. Alzheimer Dis Assoc Disord, 2000; 14, S47−53. doi: 10.1097/00002093-200000001-00008 [52] Amor S, Puentes F, Baker D, et al. Inflammation in neurodegenerative diseases. Immunology, 2010; 129, 154−69. doi: 10.1111/j.1365-2567.2009.03225.x [53] Liang FC, Liu FC, Huang KY, et al. Long-term exposure to fine particulate matter and cardiovascular disease in China. J Am Coll Cardiol, 2020; 75, 707−17. -
 24156+Supplementary Materials.pdf

-

 点击查看大图
计量
- 文章访问数: 9298
- HTML全文浏览量: 4591
- PDF下载量: 44
- 被引次数: 0

 Quick Links