



 下载:
下载:

-
Over the past 30 years, depression has remained the leading mental cause of disease burden[1]. Concerns regarding the aging population have increased globally, given the adverse physical and psychological conditions that older adults may experience. According to cross-sectional studies, approximately 13.3% of older adults suffer from major depressive disorder worldwide[1]. Despite the high burden of depression, most older adults with depression remain underrecognized and undertreated[2]. Additionally, given that older adults with depression are more likely to suffer from other chronic diseases, the prevention, recognition, and treatment of depression among older adults is urgently needed to achieve healthy aging and universal health coverage[3].
Social isolation and loneliness, the structural and functional components of social connections, respectively, are two key social determinants of health and have been linked to poor mental health[4]. According to current evidence, social isolation and loneliness have direct and indirect effects on depression through the activation of the hypothalamic-pituitary-adrenocortical axis, cognitive and immune functions, sleep disorders, and behavioral changes[5]. Digital exclusion, meaning unequal access to the Internet and limited ability to utilize it, is more prevalent among older people than among younger people, and is related to multiple health problems including depression[6]. Social connections might drive the relationship between digital exclusion and depression. Among older adults, especially those facing activity restrictions, Internet use provides an opportunity for social connections, online entertainment, and health-related services, which can further increase perceived social support and mitigate stress[6]. However, the functional roles of social isolation and loneliness in the relationship between digital exclusion and depression remain unclear. Related studies are scarce, and existing research focuses only on the association between digital exclusion and depression, the mediating role of social isolation, and subpopulations such as older people with functional disabilities, or only on the mediating effects[6].
To provide evidence of the mechanism through which digital exclusion affects the risk of depression through social connections, especially for the mediating, interactive, and joint effects of social inactivity and loneliness among adults aged 50 years and older, we designed a dynamic cohort study based on five nationally representative aging surveys. Given that the levels of digital infrastructure, welfare systems, and population aging may differ substantially across countries, and that cultural norms regarding aging, family support, and technology use may affect the relationship between digital exclusion and depression, we conducted this study using data from 24 countries to provide a multinational perspective.
We used data from five aging studies, namely, the Health and Retirement Study (HRS), English Longitudinal Study of Aging (ELSA), Survey of Health, Aging, and Retirement in Europe (SHARE), China Health and Retirement Longitudinal Study (CHARLS), and Mexican Health and Aging Study (MHAS). These surveys are nationally representative and conducted according to similar protocols to facilitate comparability. To ensure comparability between the surveys, we collected data from each survey over a similar timeframe: HRS (waves 9–14) from 2008 to 2018; ELSA (waves 5–9) from 2010 to 2018; SHARE (waves 4–8) from 2011 to 2019; CHARLS (waves 1–4) from 2011 to 2018; and MHAS (waves 3–5) from 2012 to 2018. We excluded participants who were < 50 years in age at baseline; lacked information on digital exclusion, social inactivity, loneliness, and key covariates at baseline; had depressive symptoms at baseline; or had only one observation record (Supplementary Figures S1–S6). Eligible participants were followed up from their first survey response until the occurrence of outcomes, the last valid questionnaire return, or the end of the survey, whichever came first.
We defined digital exclusion as a binary variable (0 = no; 1 = yes) according to the relevant questions (Supplementary Table S1). Participants who answered “no Internet use” in the HRS, SHARE, and CHRALS or who responded "less than once per week Internet use" in the ELSA and MHAS were classified as digitally excluded. Individuals were categorized as socially active if they had joined one or more social groups. Loneliness was measured using either the 3-item Revised Loneliness Scale (R-UCLA, score 3–9) or a single question (score 0–3), with higher scores indicating greater loneliness. Participants were classified as lonely if their R-UCLA score was ≥ 4 or if their single-item question score was ≥ 1[7]. Depressive symptoms were assessed using three different scales in five aging surveys: (1) the 8-item Center for Epidemiological Studies Depression Scale (CES-D) (HRS, ELSA, and MHAS), (2) the 10-item CES-D (CHARLS), and (3) the 12-item EURO-D (SHARE). We excluded items related to loneliness from the 8-item and 10-item CES-D scales to avoid exaggerated linkage effects caused by overlapping measurements. We used a cutoff point of ≥ 2 for the 7-item CES-D and ≥ 9 for the 9-item CES-D in our revised scales, which represented results similar to those of the original version.
Cox proportional hazards models were employed to evaluate the association between digital exclusion and depression using crude and adjusted hazard ratios (HRs) with 95% confidence intervals (CIs). Proportional hazard assumptions were tested using Schoenfeld residuals, and no violations were detected. To adjust the covariates optimally, we identified the minimal sufficient adjustment set (MSAS) using a cause-directed acyclic graph (DAG) (Supplementary Figure S7). The MSAS in the final model included age, sex, marital status, family income level, education, labor force status, social activity, and loneliness.
Subgroup analyses were conducted using the MSAS model stratified by age group (< 60, 60–69, 70–79, or ≥ 80 years), sex (female or male), marital status (other, married/partnered), social activity (active or inactive), and loneliness status (not lonely or lonely). We further conducted five sensitivity analyses to estimate the reliability of the results: (1) we converted the continuous variable age into an age group and the categorical variable loneliness into a continuous score; (2) we performed a fixed cohort study that included only participants from the first wave of surveys within our selected time frame and used sample weights; (3) we employed competing risk models treating death as a competing event for depression onset; (4) we used a multiple imputation method to impute missing data; and (5) we used fully adjusted models encompassing body mass index (BMI), smoking status, alcohol consumption, physical activity, and NCDs in addition to the covariates incorporated within the MSAS.
For interactions between digital exclusion, social inactivity, and loneliness, we used adjusted HRs and 95% CIs for the interaction terms to estimate multiplicative interactions and the relative excess risk due to interaction (RERI) and the corresponding 95% CIs to evaluate additive interactions. Causal mediation analysis was performed using R software with the mediation package to estimate the values of the direct and indirect effects of digital exclusion on depression and to calculate the mediated proportion of social inactivity and loneliness. In addition, we divided the participants into eight groups based on combinations of digital exclusion (no or yes), social activity (active or inactive), and loneliness (not lonely or lonely) to assess the joint effects. Adjusted HRs (aHRs) and 95% CIs for depressive symptoms were estimated for each group using digitally included, socially active, and not lonely individuals as references. We ultimately pooled all estimates from the five cohorts using random-effects meta-analyses.
The median (inter-quartile range, IQR) age of the 77,540 eligible individuals was 64 (57–71) years. In total, 48.8% (37,830) of the participants were digitally excluded (Table 1). The percentage of digitally excluded individuals ranged from 17.2% (Denmark) to 91.1% (China) (Supplementary Figure S8). For each aging survey, the digital exclusion rates were 91.1%, 48.0%, 41.2%, 30.6%, and 36.2% for CHARLS, SHARE, HRS, ELSA, and MHAS, respectively. The disparities in digital exclusion across countries can be explained by socioeconomic status, which was the key determinant of Internet use, given the essential conditions for access to related devices, acquired skills, and acknowledgment[8].
Table 1. Baseline characteristics of the 77,506 participants
Characteristics Total
(N = 77,540)HRS
(N = 9,489)ELSA
(N = 6,727)SHARE
(N = 48,998)CHARLS
(N = 7,070)MHAS
(N = 5,256)Digital exclusion (%) No 39,710 (51.2) 5,578 (58.8) 4,668 (69.4) 25,481 (52.0) 630 (8.9) 3,353 (63.8) Yes 37,830 (48.8) 3,911 (41.2) 2,059 (30.6) 23,517 (48.0) 6,440 (91.1) 1,903 (36.2) Social activity (%) Active 39,799 (51.3) 7,420 (78.2) 4,603 (68.4) 22,656 (46.2) 2,593 (36.7) 2,527 (48.1) Inactive 37,741 (48.7) 2,069 (21.8) 2,124 (31.6) 26,342 (53.8) 4,477 (63.3) 2,729 (51.9) Loneliness (%) Not lonely 53,495 (69.0) 4,764 (50.2) 4,089 (60.8) 33,725 (68.8) 6,046 (85.5) 4,871 (92.7) Lonely 24,045 (31.0) 4,725 (49.8) 2,638 (39.2) 15,273 (31.2) 1,024 (14.5) 385 (7.3) Age, median (Q1, Q3)* 64 (57, 71) 66 (58, 73) 63 (57, 71) 63 (57, 71) 59 (55, 66) 63 (57, 69) Sex (%) Male 37,824 (48.8) 4,082 (43.0) 3,233 (48.1) 23,818 (48.6) 3,979 (56.3) 2,712 (51.6) Female 39,716 (51.2) 5,407 (57.0) 3,494 (51.9) 25,180 (51.4) 3,091 (43.7) 2,544 (48.4) Marital status (%) Single 18,847 (24.3) 3,142 (33.1) 1,543 (22.9) 11,773 (24.0) 743 (10.5) 1,646 (31.3) Married or partnered 58,693 (75.7) 6,347 (66.9) 5,184 (77.1) 37,225 (76.0) 6,327 (89.5) 3,610 (68.7) Family income (%) Q1 (lowest) 20,450 (26.4) 2,371 (25.0) 1,682 (25.0) 13,323 (27.2) 1,763 (24.9) 1,311 (24.9) Q2 19,127 (24.7) 2,364 (24.9) 1,615 (24.0) 12,433 (25.4) 1,472 (20.8) 1,243 (23.7) Q3 19,520 (25.2) 2,381 (25.1) 1,747 (26.0) 11,970 (24.4) 2,066 (29.2) 1,356 (25.8) Q4 (highest) 18,443 (23.8) 2,373 (25.0) 1,683 (25.0) 11,272 (23.0) 1,769 (25.1) 1,346 (25.6) Education (%) Lower than upper secondary 29,334 (37.8) 670 (7.1) 498 (7.4) 17,966 (36.7) 6,004 (84.9) 4,196 (79.8) Higher than secondary 28,528 (36.8) 3,703 (39.0) 4,660 (69.3) 19,029 (38.8) 889 (12.6) 247 (4.7) Tertiary 19,678 (25.4) 5,116 (53.9) 1,569 (23.3) 12,003 (24.5) 177 (2.5) 813 (15.5) Labor force status (%) Not labor force 9,617 (12.4) 813 (8.5) 169 (2.5) 6,418 (13.1) 150 (2.1) 2,067 (39.3) Employed/self-employed 29,585 (38.2) 3,421 (36.1) 3,150 (46.8) 16,234 (33.1) 4,425 (62.6) 2,355 (44.8) Retired 38,338 (49.4) 5,255 (55.4) 3,408 (50.7) 26,346 (53.8) 2,495 (35.3) 834 (15.9) Body-mass index (%) Underweight or normal 28,144 (36.3) 2,657 (28.0) 2,068 (30.7) 18,158 (37.0) 3,833 (54.2) 1,428 (27.2) Overweight 31,521 (40.7) 3,706 (39.1) 2,494 (37.1) 21,048 (43.0) 2,125 (30.1) 2,148 (40.9) Obesity 16,217 (20.9) 3,126 (32.9) 1,224 (18.2) 9,792 (20.0) 798 (11.3) 1,277 (24.3) Unknown 1,658 (2.1) — 941 (14.0) — 314 (4.4) 403 (7.6) Smoke (%) Never smoked 34,183 (44.1) 4,374 (46.1) 2,777 (41.3) 19,954 (40.7) 3952 (55.9) 3,126 (59.5) Smoked 28,802 (37.1) 4,039 (42.6) 2,761 (41.0) 19,838 (40.5) 722 (10.2) 1,442 (27.4) Smoking 13,420 (17.3) 1,076 (11.3) 850 (12.7) 8,410 (17.2) 2,396 (33.9) 688 (13.1) Unknown 1135 (1.5) 339 (5.0) — 796 (1.6) — — Alcohol assumption (%) No 26,499 (34.2) 3,737 (39.4) 616 (9.2) 13,983 (28.5) 4,429 (62.6) 3,734 (71.0) Yes 51,041 (65.8) 5,752 (60.6) 6,111 (90.8) 35,015 (71.5) 2,641 (37.4) 1,522 (29.0) Physical inactivity (%) No 65,599 (84.6) 7,491 (78.9) 5,739 (85.3) 45,885 (93.6) 4,113 (58.2) 2,371 (45.1) Yes 11,569 (14.9) 1,998 (21.1) 988 (14.7) 3,113 (6.4) 2,585 (36.5) 2,885 (54.9) Unknown 372 (0.5) — — — 372 (5.3) — Noncommunicable diseases (%) None 31,695 (40.9) 1,928 (20.3) 2,808 (41.7) 21,831 (44.6) 2,980 (42.2) 2,148 (40.9) 1 or more 45,399 (58.5) 7,561 (79.7) 3,919 (58.3) 27,167 (55.4) 3,677 (52.0) 3,075 (58.5) Unknown 446 (0.6) — — — 413 (5.8) 33 (0.6) Note. HRS: Health and Retirement Study; ELSA: English Longitudinal Study of Aging; SHARE: Survey of Health, Aging, and Retirement in Europe; CHARLS: China Health and Retirement Longitudinal Study; MHAS: Mexican Health and Aging Study. During the 389,436 person-year (median, 5 years) of follow-up, 23,109 respondents developed depressive symptoms. The pooled incidence rate was 7.29 (95% CI: 4.51–10.06; I2 = 99.8%; P < 0.001) per 100 person-years, and was diverse across surveys, ranging from 3.83 per 100 person-years (HRS) to 11.91 per 100 person-years (MHAS). Models adjusted by MSAS revealed that digital exclusion significantly increased the risk of depression in the HRS (aHR = 1.24, 95% CI: 1.13–1.37), ELSA (1.16, 1.05–1.28), SHARE (1.28, 1.22–1.34), CHARLS (1.51, 1.27–1.78), and MHAS (1.11, 1.03–1.20), with a pooled aHR of 1.23 (1.14–1.32; I2 = 74.9%, P = 0.003). This link between digital exclusion and depression was robust in all five sensitivity analyses (Supplementary Figure S9). The most common interpretation of this association is the subsequent positive impact of digital use on social connection[6]. This finding reveals that the association between digital exclusion and depression is consistent across countries despite diverse socioeconomic development. Across countries, older adults can participate equally in the digital world through the internet to expand their social networks and receive social support and online health-related information[9].
In our study, we found that the relationship between digital exclusion and depression was partly mediated by social inactivity, with proportions ranging from 3.16% (95% CI: 0.88%–7.59%) in the HRS to 16.42% (8.18%–38.75%) in the ELSA (Table 2), and a pooled proportion of 7.03% (3.86%–10.19%; I2 = 50.0%, P = 0.091). This finding strengthens current evidence on the effect of digital exclusion on depression through social connections. Accordingly, practical actions should focus on promoting digital inclusion and social engagement simultaneously. At the policy level, efforts to improve age-friendly Internet access and reduce access barriers among older adults are needed. At the community level, integrating digital skills training with social and volunteer activities may help address both digital exclusion and social isolation. At the individual level, health and community services can encourage socially inactive or digitally excluded older adults to participate in accessible social and digital programs. Notably, the CIs of the mediating results were large, which may be partially explained by the different measures of digital use, loneliness, and depression. However, no mediating effect of loneliness was observed in any survey. The root cause may be the complex bidirectional relationship between digital use and loneliness.[10] When the Internet is used to enhance existing relationships and for forging new social networks, it can reduce loneliness because of its positive effects on social connections. Yet, when people choose to use the Internet to escape real social activities or withdraw from the “social pain” of interaction, they may feel greater loneliness.
Table 2. The interactions and mediations of digital exclusion, social inactivity, and loneliness with the risk of depression in older adults
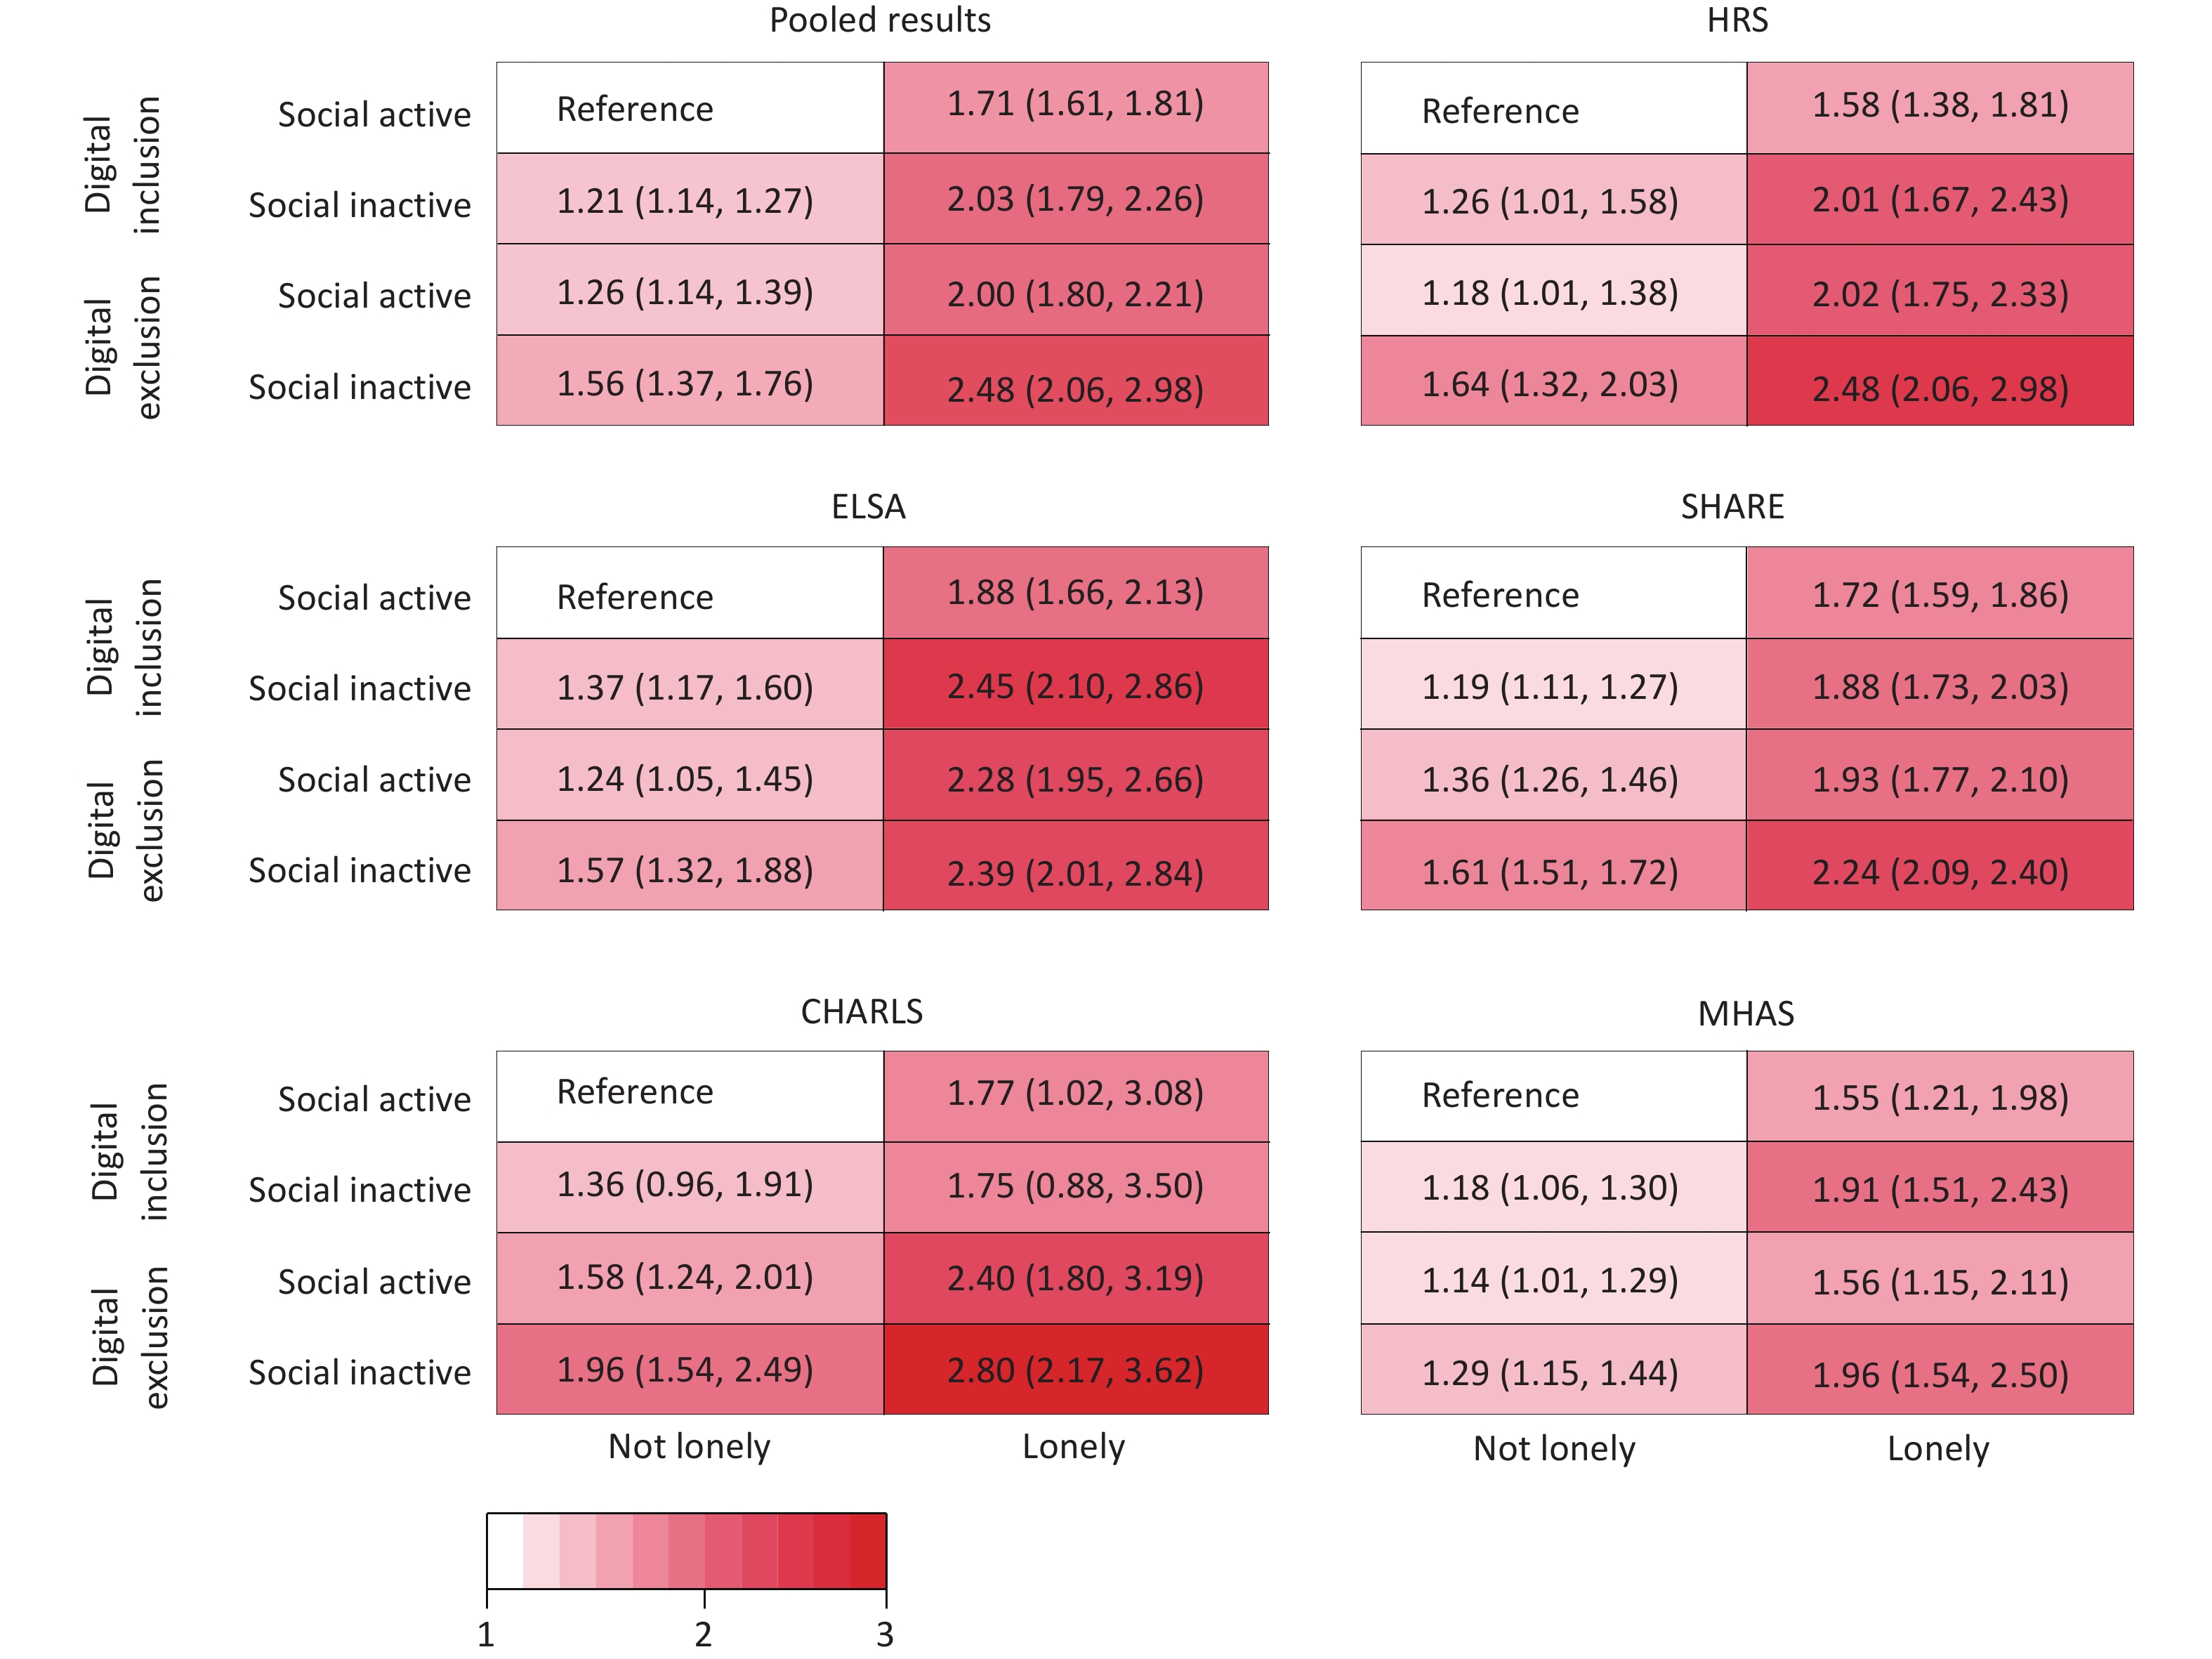
Addictive interactions Multiplicative interactions Mediation proportion (%) RERI (95% CI) P-value aHR (95% CI) P-value Percentage (95% CI) P-value Social inactivity HRS 0.08 (−0.17, 0.34) 0.263 1.01 (0.84, 1.23) 0.898 3.16 (0.88, 7.59) 0.014 ELSA −0.16 (−0.39, 0.06) 0.919 0.86 (0.72, 1.01) 0.073 16.42 (8.18, 38.75) <0.001 SHARE 0.06 (−0.03, 0.15) 0.084 1.01 (0.94, 1.09) 0.713 8.39 (5.96, 11.26) <0.001 CHARLS 0.06 (−0.33, 0.45) 0.567 0.95 (0.69, 1.32) 0.761 8.56 (4.54, 15.36) <0.001 MHAS −0.02 (−0.19, 0.16) 0.567 0.97 (0.83, 1.13) 0.701 12.05 (4.46, 54.88) 0.014 Loneliness HRS 0.21 (0.01, 0.41) 0.043 1.05 (0.88, 1.24) 0.609 5.33 (−0.15, 12.87) 0.054 ELSA −0.04 (−0.33, 0.25) 0.608 0.88 (0.74, 1.05) 0.172 8.20 (−2.93, 24.80) 0.274 SHARE −0.11 (−0.23, 0.01) 0.969 0.85 (0.79, 0.91) < 0.001 1.19 (−0.48, 2.84) 0.088 CHARLS 0.13 (−0.54, 0.80) 0.351 0.93 (0.60, 1.45) 0.758 1.46 (−1.21, 4.46) 0.228 MHAS 0.18 (−0.26, 0.62) 0.208 1.08 (0.82, 1.41) 0.594 5.04 (−5.43, 27.10) 0.198 Note. RERI, relative excess risk due to interaction; HR, hazard ratio; CI, confidence interval. HRS: Health and Retirement Study; ELSA: English Longitudinal Study of Aging; SHARE: Survey of Health, Aging, and Retirement in Europe; CHARLS: China Health and Retirement Longitudinal Study; MHAS: Mexican Health and Aging Study. According to the results of the subgroup analyses, the association between digital exclusion and depression was more prominent among individuals aged 70–79 years, males, those who were married, those with a high level of education, those who were socially active, and those without loneliness (Supplementary Figure S10). In the interaction analyses, we found only a pronounced additive interaction effect between digital exclusion and loneliness on depression in the HRS (RERI = 0.21; 95% CI: 0.01–0.41) and a multiplicative interaction effect between them in the SHARE (aHR = 0.85; 95% CI: 0.79–0.91) (Table 2). The combined effects of digital exclusion, loneliness, and social inactivity on the risk of depression are shown in Figure 1. Compared with participants who were digitally active, not lonely, and socially active, the risk of depression increased among participants who were either digitally excluded, lonely, or socially inactive, with the highest risk of depression among people who were digitally excluded, socially inactive, and lonely (pooled aHR = 2.48, 95% CI: 2.06–2.98; I2 = 19.0%, P = 0.294). This joint effect of digital exclusion, social inactivity, and loneliness on the risk of depression indicates that eliminating any of these three risk factors could significantly reduce the risk of depression among older adults. Although the mediating role of loneliness in the association between digital exclusion and depression was not observed in our study, minimizing perceived loneliness to prevent depression among older adults is essential given its direct and joint effects on depression.
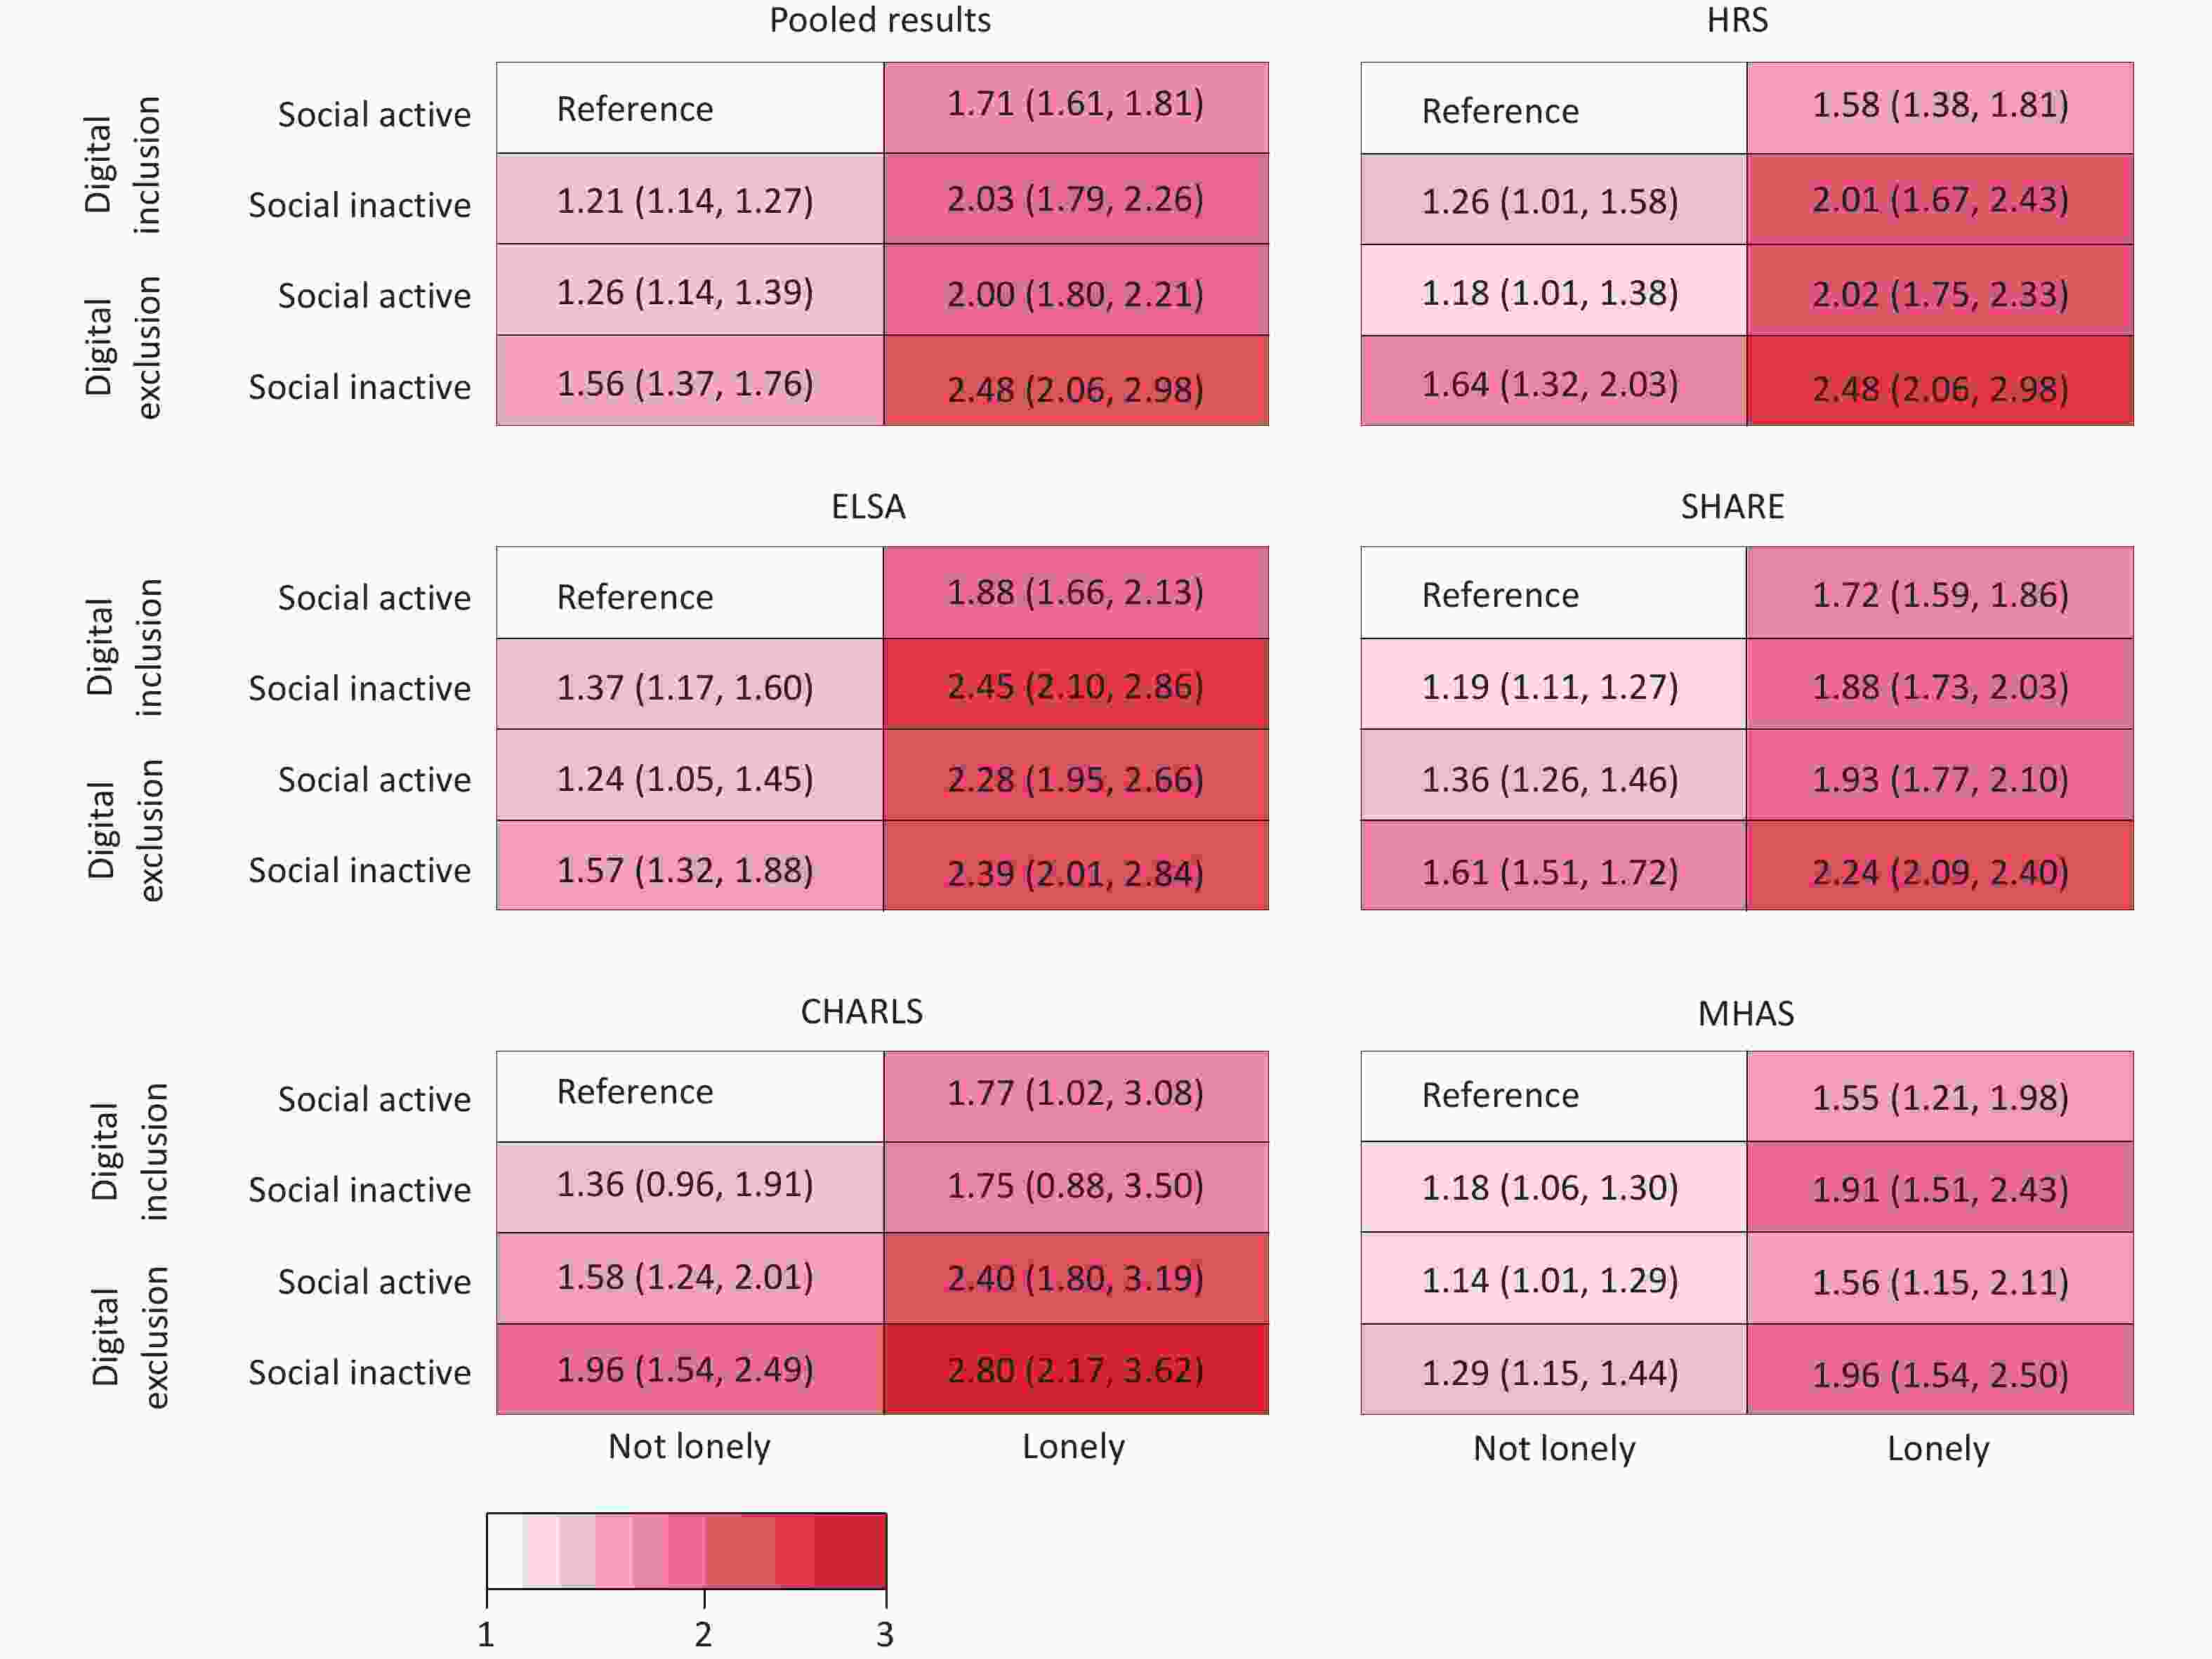
Figure 1. Joint effects of digital exclusion, social inactivity, and loneliness on the risk of depression in older adults. HRS: Health and Retirement Study; ELSA: English Longitudinal Study of Aging; SHARE: Survey of Health, Aging, and Retirement in Europe; CHARLS: China Health and Retirement Longitudinal Study; MHAS: Mexican Health and Aging Study.
Although this study is the first to identify social inactivity as a partial mediator in the relationship between digital exclusion and depression among older adults, it has several limitations. First, digital exclusion in our study was measured by whether older participants used the Internet; thus, the deeper content of digital exclusion, such as digital device exclusion, digital skill exclusion, or digital knowledge exclusion, is still unknown and can be explored in future studies. Second, depression in our study was defined in accordance with self-reported scales rather than a clinical diagnosis. Although these scales are widely validated and commonly used in epidemiological research, they may not fully correspond to the diagnostic criteria for clinical depression. Third, the extrapolation of our results may be limited because several participants were excluded from our study.
In conclusion, digital exclusion increased the risk of depression among older adults and this association was partly mediated by social inactivity. Furthermore, the joint effects of digital exclusion, loneliness, and social inactivity on the risk of depression were prominent. These findings indicate that integrated and multidimensional interventions that simultaneously address digital exclusion, loneliness, and social inactivity can be more efficient and cost-effective in promoting good mental health among older adults.
doi: 10.3967/bes2026.053
Association of Digital Exclusion with Depression Risk and the Mediating Effect of Social Activity: A Multinational Prospective Cohort Study
-
This study was supported by the National Natural Science Foundation of China (Grant No. 72122001).
The authors declare no competing interests.
All data were obtained from publicly available cohort studies, each of which received ethical approval from relevant institutional review boards.
Conceptualization and supervision: Jue Liu. Data curation, methodology, and analysis: Yaping Wang. Writing – original draft: Yaping Wang. Writing – review and editing: Xi Li and Jue Liu.
注释:1) Funding: 2) Competing Interests: 3) Ethics: 4) Authors’ Contributions: -
Figure 1. Joint effects of digital exclusion, social inactivity, and loneliness on the risk of depression in older adults. HRS: Health and Retirement Study; ELSA: English Longitudinal Study of Aging; SHARE: Survey of Health, Aging, and Retirement in Europe; CHARLS: China Health and Retirement Longitudinal Study; MHAS: Mexican Health and Aging Study.
Table 1. Baseline characteristics of the 77,506 participants
Characteristics Total
(N = 77,540)HRS
(N = 9,489)ELSA
(N = 6,727)SHARE
(N = 48,998)CHARLS
(N = 7,070)MHAS
(N = 5,256)Digital exclusion (%) No 39,710 (51.2) 5,578 (58.8) 4,668 (69.4) 25,481 (52.0) 630 (8.9) 3,353 (63.8) Yes 37,830 (48.8) 3,911 (41.2) 2,059 (30.6) 23,517 (48.0) 6,440 (91.1) 1,903 (36.2) Social activity (%) Active 39,799 (51.3) 7,420 (78.2) 4,603 (68.4) 22,656 (46.2) 2,593 (36.7) 2,527 (48.1) Inactive 37,741 (48.7) 2,069 (21.8) 2,124 (31.6) 26,342 (53.8) 4,477 (63.3) 2,729 (51.9) Loneliness (%) Not lonely 53,495 (69.0) 4,764 (50.2) 4,089 (60.8) 33,725 (68.8) 6,046 (85.5) 4,871 (92.7) Lonely 24,045 (31.0) 4,725 (49.8) 2,638 (39.2) 15,273 (31.2) 1,024 (14.5) 385 (7.3) Age, median (Q1, Q3)* 64 (57, 71) 66 (58, 73) 63 (57, 71) 63 (57, 71) 59 (55, 66) 63 (57, 69) Sex (%) Male 37,824 (48.8) 4,082 (43.0) 3,233 (48.1) 23,818 (48.6) 3,979 (56.3) 2,712 (51.6) Female 39,716 (51.2) 5,407 (57.0) 3,494 (51.9) 25,180 (51.4) 3,091 (43.7) 2,544 (48.4) Marital status (%) Single 18,847 (24.3) 3,142 (33.1) 1,543 (22.9) 11,773 (24.0) 743 (10.5) 1,646 (31.3) Married or partnered 58,693 (75.7) 6,347 (66.9) 5,184 (77.1) 37,225 (76.0) 6,327 (89.5) 3,610 (68.7) Family income (%) Q1 (lowest) 20,450 (26.4) 2,371 (25.0) 1,682 (25.0) 13,323 (27.2) 1,763 (24.9) 1,311 (24.9) Q2 19,127 (24.7) 2,364 (24.9) 1,615 (24.0) 12,433 (25.4) 1,472 (20.8) 1,243 (23.7) Q3 19,520 (25.2) 2,381 (25.1) 1,747 (26.0) 11,970 (24.4) 2,066 (29.2) 1,356 (25.8) Q4 (highest) 18,443 (23.8) 2,373 (25.0) 1,683 (25.0) 11,272 (23.0) 1,769 (25.1) 1,346 (25.6) Education (%) Lower than upper secondary 29,334 (37.8) 670 (7.1) 498 (7.4) 17,966 (36.7) 6,004 (84.9) 4,196 (79.8) Higher than secondary 28,528 (36.8) 3,703 (39.0) 4,660 (69.3) 19,029 (38.8) 889 (12.6) 247 (4.7) Tertiary 19,678 (25.4) 5,116 (53.9) 1,569 (23.3) 12,003 (24.5) 177 (2.5) 813 (15.5) Labor force status (%) Not labor force 9,617 (12.4) 813 (8.5) 169 (2.5) 6,418 (13.1) 150 (2.1) 2,067 (39.3) Employed/self-employed 29,585 (38.2) 3,421 (36.1) 3,150 (46.8) 16,234 (33.1) 4,425 (62.6) 2,355 (44.8) Retired 38,338 (49.4) 5,255 (55.4) 3,408 (50.7) 26,346 (53.8) 2,495 (35.3) 834 (15.9) Body-mass index (%) Underweight or normal 28,144 (36.3) 2,657 (28.0) 2,068 (30.7) 18,158 (37.0) 3,833 (54.2) 1,428 (27.2) Overweight 31,521 (40.7) 3,706 (39.1) 2,494 (37.1) 21,048 (43.0) 2,125 (30.1) 2,148 (40.9) Obesity 16,217 (20.9) 3,126 (32.9) 1,224 (18.2) 9,792 (20.0) 798 (11.3) 1,277 (24.3) Unknown 1,658 (2.1) — 941 (14.0) — 314 (4.4) 403 (7.6) Smoke (%) Never smoked 34,183 (44.1) 4,374 (46.1) 2,777 (41.3) 19,954 (40.7) 3952 (55.9) 3,126 (59.5) Smoked 28,802 (37.1) 4,039 (42.6) 2,761 (41.0) 19,838 (40.5) 722 (10.2) 1,442 (27.4) Smoking 13,420 (17.3) 1,076 (11.3) 850 (12.7) 8,410 (17.2) 2,396 (33.9) 688 (13.1) Unknown 1135 (1.5) 339 (5.0) — 796 (1.6) — — Alcohol assumption (%) No 26,499 (34.2) 3,737 (39.4) 616 (9.2) 13,983 (28.5) 4,429 (62.6) 3,734 (71.0) Yes 51,041 (65.8) 5,752 (60.6) 6,111 (90.8) 35,015 (71.5) 2,641 (37.4) 1,522 (29.0) Physical inactivity (%) No 65,599 (84.6) 7,491 (78.9) 5,739 (85.3) 45,885 (93.6) 4,113 (58.2) 2,371 (45.1) Yes 11,569 (14.9) 1,998 (21.1) 988 (14.7) 3,113 (6.4) 2,585 (36.5) 2,885 (54.9) Unknown 372 (0.5) — — — 372 (5.3) — Noncommunicable diseases (%) None 31,695 (40.9) 1,928 (20.3) 2,808 (41.7) 21,831 (44.6) 2,980 (42.2) 2,148 (40.9) 1 or more 45,399 (58.5) 7,561 (79.7) 3,919 (58.3) 27,167 (55.4) 3,677 (52.0) 3,075 (58.5) Unknown 446 (0.6) — — — 413 (5.8) 33 (0.6) Note. HRS: Health and Retirement Study; ELSA: English Longitudinal Study of Aging; SHARE: Survey of Health, Aging, and Retirement in Europe; CHARLS: China Health and Retirement Longitudinal Study; MHAS: Mexican Health and Aging Study.  下载: 导出CSV
Table 2. The interactions and mediations of digital exclusion, social inactivity, and loneliness with the risk of depression in older adults
Addictive interactions Multiplicative interactions Mediation proportion (%) RERI (95% CI) P-value aHR (95% CI) P-value Percentage (95% CI) P-value Social inactivity HRS 0.08 (−0.17, 0.34) 0.263 1.01 (0.84, 1.23) 0.898 3.16 (0.88, 7.59) 0.014 ELSA −0.16 (−0.39, 0.06) 0.919 0.86 (0.72, 1.01) 0.073 16.42 (8.18, 38.75) <0.001 SHARE 0.06 (−0.03, 0.15) 0.084 1.01 (0.94, 1.09) 0.713 8.39 (5.96, 11.26) <0.001 CHARLS 0.06 (−0.33, 0.45) 0.567 0.95 (0.69, 1.32) 0.761 8.56 (4.54, 15.36) <0.001 MHAS −0.02 (−0.19, 0.16) 0.567 0.97 (0.83, 1.13) 0.701 12.05 (4.46, 54.88) 0.014 Loneliness HRS 0.21 (0.01, 0.41) 0.043 1.05 (0.88, 1.24) 0.609 5.33 (−0.15, 12.87) 0.054 ELSA −0.04 (−0.33, 0.25) 0.608 0.88 (0.74, 1.05) 0.172 8.20 (−2.93, 24.80) 0.274 SHARE −0.11 (−0.23, 0.01) 0.969 0.85 (0.79, 0.91) < 0.001 1.19 (−0.48, 2.84) 0.088 CHARLS 0.13 (−0.54, 0.80) 0.351 0.93 (0.60, 1.45) 0.758 1.46 (−1.21, 4.46) 0.228 MHAS 0.18 (−0.26, 0.62) 0.208 1.08 (0.82, 1.41) 0.594 5.04 (−5.43, 27.10) 0.198 Note. RERI, relative excess risk due to interaction; HR, hazard ratio; CI, confidence interval. HRS: Health and Retirement Study; ELSA: English Longitudinal Study of Aging; SHARE: Survey of Health, Aging, and Retirement in Europe; CHARLS: China Health and Retirement Longitudinal Study; MHAS: Mexican Health and Aging Study.
下载: 导出CSV
-
[1] Abdoli N, Salari N, Darvishi N, et al. The global prevalence of major depressive disorder (MDD) among the elderly: a systematic review and meta-analysis. Neurosci Biobehav Rev, 2022; 132, 1067−73. doi: 10.1016/j.neubiorev.2021.10.041 [2] Rodda J, Walker Z, Carter J. Depression in older adults. BMJ, 2011; 343, d5219. [3] Rajan S, McKee M, Rangarajan S, et al. Association of symptoms of depression with cardiovascular disease and mortality in low-, middle-, and high-income countries. JAMA Psychiatry, 2020; 77, 1052−63. doi: 10.1001/jamapsychiatry.2020.1351 [4] Wang YP, Liu M, Yang FD, et al. The associations of socioeconomic status, social activities, and loneliness with depressive symptoms in adults aged 50 years and older across 24 countries: findings from five prospective cohort studies. Lancet Healthy Longev, 2024; 5, 100618. doi: 10.1016/j.lanhl.2024.07.001 [5] Hodgson S, Watts I, Fraser S, et al. Loneliness, social isolation, cardiovascular disease and mortality: a synthesis of the literature and conceptual framework. J R Soc Med, 2020; 113, 185−92. doi: 10.1177/0141076820918236 [6] Wang CY, Zhu YQ, Ma J, et al. The association between internet use and depression among older adults in China: the mediating role of social networks. Digit Health, 2023; 9, 20552076231207587. [7] Hughes ME, Waite LJ, Hawkley LC, et al. A short scale for measuring loneliness in large surveys: results from two population-based studies. Res Aging, 2004; 26, 655−72. doi: 10.1177/0164027504268574 [8] He WB, Cao LJ, Liu R, et al. Factors associated with internet use and health information technology use among older people with multi-morbidity in the United States: findings from the national health interview survey 2018. BMC Geriatr, 2022; 22, 733. doi: 10.1186/s12877-022-03410-y [9] Nowland R, Necka EA, Cacioppo JT. Loneliness and social internet use: pathways to reconnection in a digital world? Perspect Psychol Sci, 2018; 13, 70-87. [10] Seifert A. The digital exclusion of older adults during the COVID-19 pandemic. J Gerontol Soc Work, 2020; 63, 674−6. doi: 10.1080/01634372.2020.1764687 -

 点击查看大图
图(1) / 表ll (2)
计量
- 文章访问数: 22
- HTML全文浏览量: 8
- PDF下载量: 0
- 被引次数: 0

 Quick Links