

 下载:
下载:


-
Stroke is a leading cause of death and disability worldwide[1], with 101 million prevalent cases, 143 million disability-adjusted life-years (DALYs), and 6.55 million stroke-related deaths in 2019[2]. The past 30 years have witnessed a sustained high prevalence of stroke-related deaths and DALYs in China[3]. In addition to cardiometabolic, environmental, and social elements[1], dietary behavior and food intake are closely associated with the risk of stroke[4]. Fish, as an important source of dietary N-3 polyunsaturated fatty acids (N-3 PUFAs), high-quality protein, calcium, selenium, iodine, vitamin D, and other nutrients[5,6], is an essential component of heart-protective dietary patterns, such as the Mediterranean diet[7], which is recommended by the American Heart Association and other dietary guidelines[8].
Previous studies have suggested that regular fish consumption is associated with reduced risk of myocardial infarction and coronary heart disease[9,10]. However, the effect of fish consumption on stroke and its subtypes remain unclear. A meta-analysis that included 88,204 participants, most of whom were from the United States, Germany, and Sweden, showed no significant benefit of fish consumption for stroke[11]. In contrast, another meta-analysis with a wider geographical scope and ethnic diversity revealed a link between a lower risk of stroke and more fish consumption[9]. Regarding stroke subtypes, a meta-analysis of prospective cohort studies observed that fish consumption was associated with a lower risk of hemorrhagic stroke[12], whereas a more recent cohort study found inconsistencies regarding this association[13].
Some studies have shown that the level of fish consumption and underlying risk may explain the heterogeneity in the inconsistent association between fish consumption and stroke risk[14-16]. A cohort study suggested that fish oil supplementation was associated with a significantly lower incidence of cardiovascular disease (CVD), and that this association was particularly strong in individuals with hypertension[17]. Furthermore, one study found that fish consumption was correlated with sex and age[18]. Therefore, it is necessary to investigate the relationship between fish consumption and risk factors to provide precise personalized recommendations for stroke prevention. The simultaneous consideration of multiple risk factors may be more valuable than focusing on a single risk factor for identifying populations with potential risks. We used previously developed equations to predict the 10-year stroke risk in the general Chinese population by incorporating multiple risk factors to classify individuals into low- and moderate-to-high-risk groups[19]. Until now, it was unclear whether the association between fish consumption and stroke events varied across the 10-year stroke risk stratifications.
To address this research gap, we investigated the association between fish consumption and stroke risk along with possible interactions between fish consumption and predicted stroke risk stratification by extracting data from a large population-based sample of the Prediction for Atherosclerotic Cardiovascular Disease Risk in China (China-PAR) project.
-
The study participants were derived from three cohorts of the China-PAR project: the China Multi-Center Collaborative Study of Cardiovascular Epidemiology (ChinaMUCA-1998), International Collaborative Study of CVD in Asia (InterASIA), and Community Intervention of Metabolic Syndrome in China & Chinese Family Health Study (CIMIC). Detailed of these cohorts have been described elsewhere[20,21]. Together, these three cohorts cover 15 provinces, providing a broad northeast-to-southwest geographical representation of China. Following a uniform protocol, the first follow-up surveys for both InterASIA and ChinaMUCA-1998 were conducted from 2007 to 2008. The second follow-up survey was conducted for all three subcohorts using a uniform protocol from 2012 to 2015. Baseline examinations were conducted by trained research staff under stringent quality control in all studies.
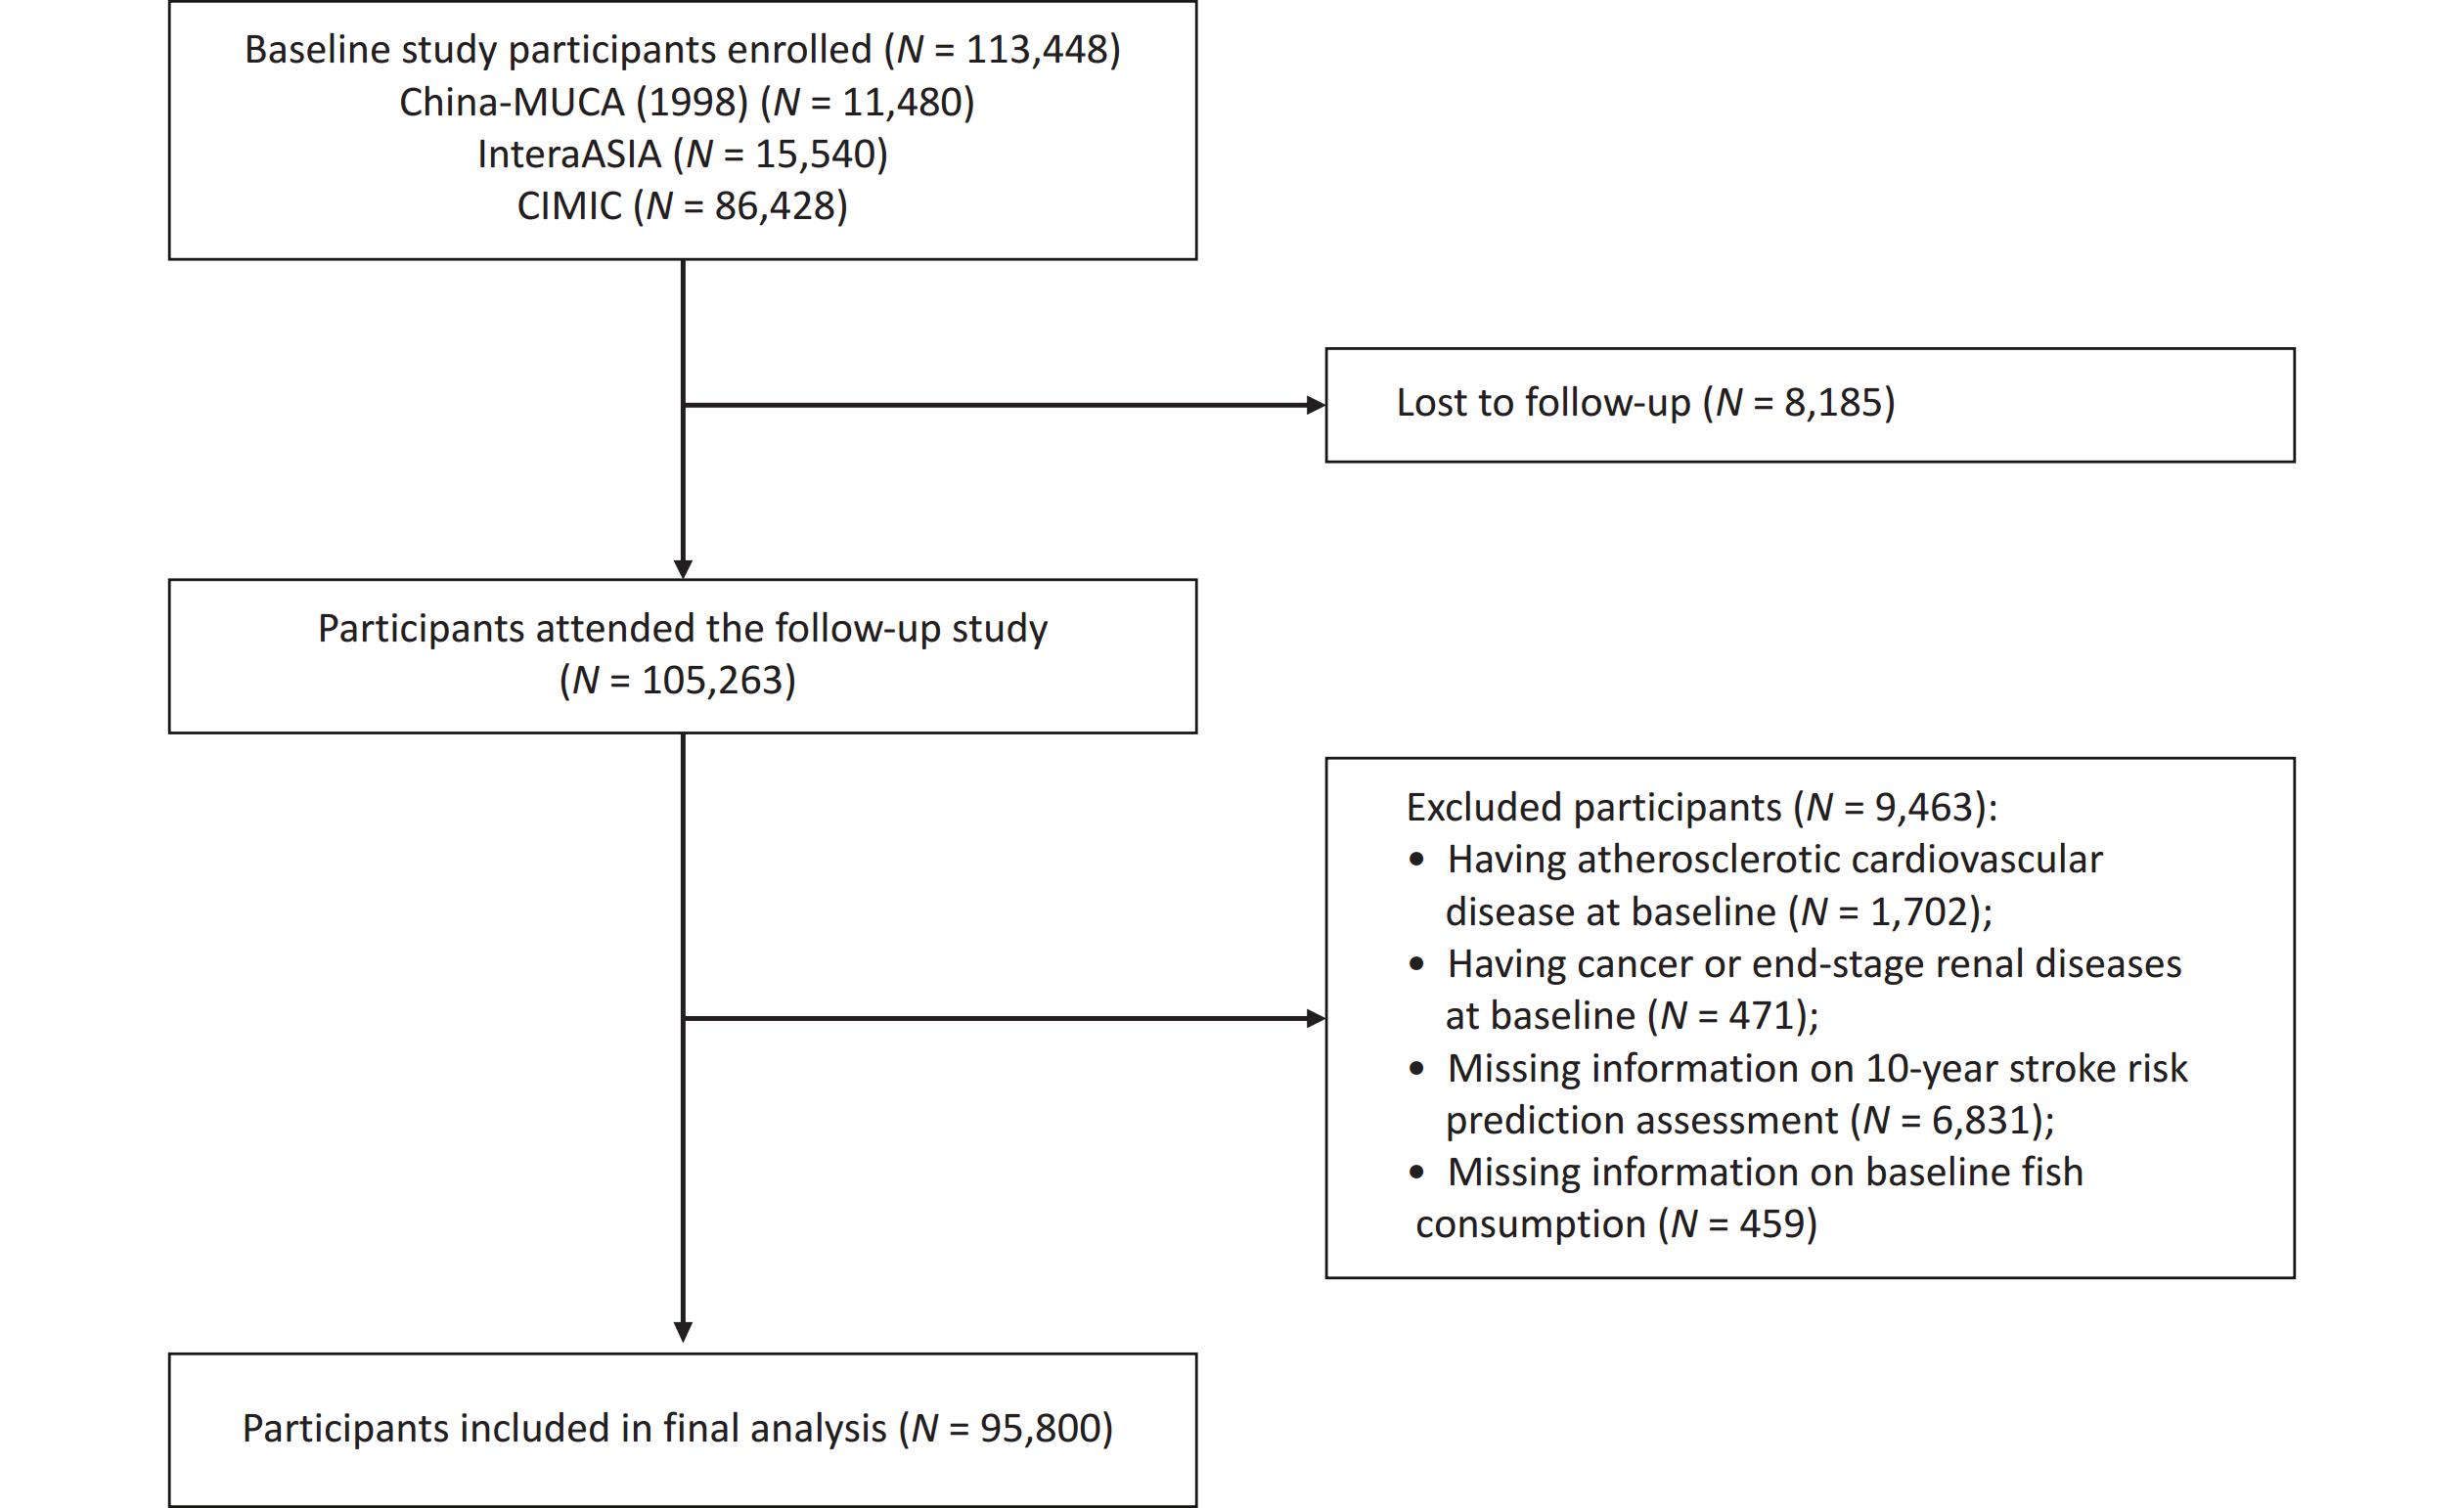
Briefly, 113,448 participants were enrolled from the three cohorts at baseline, and 105,263 (92.79%) were followed-up successfully. Of those who completed the follow-up, 1,702 individuals with atherosclerotic CVD at baseline, 471 with cancer or end-stage renal disease at baseline, 6,831 with missing information on the 10-year stroke risk prediction assessment, and 459 with missing information on baseline fish consumption were excluded, resulting in 95,800 participants included in the final analysis (Figure 1).
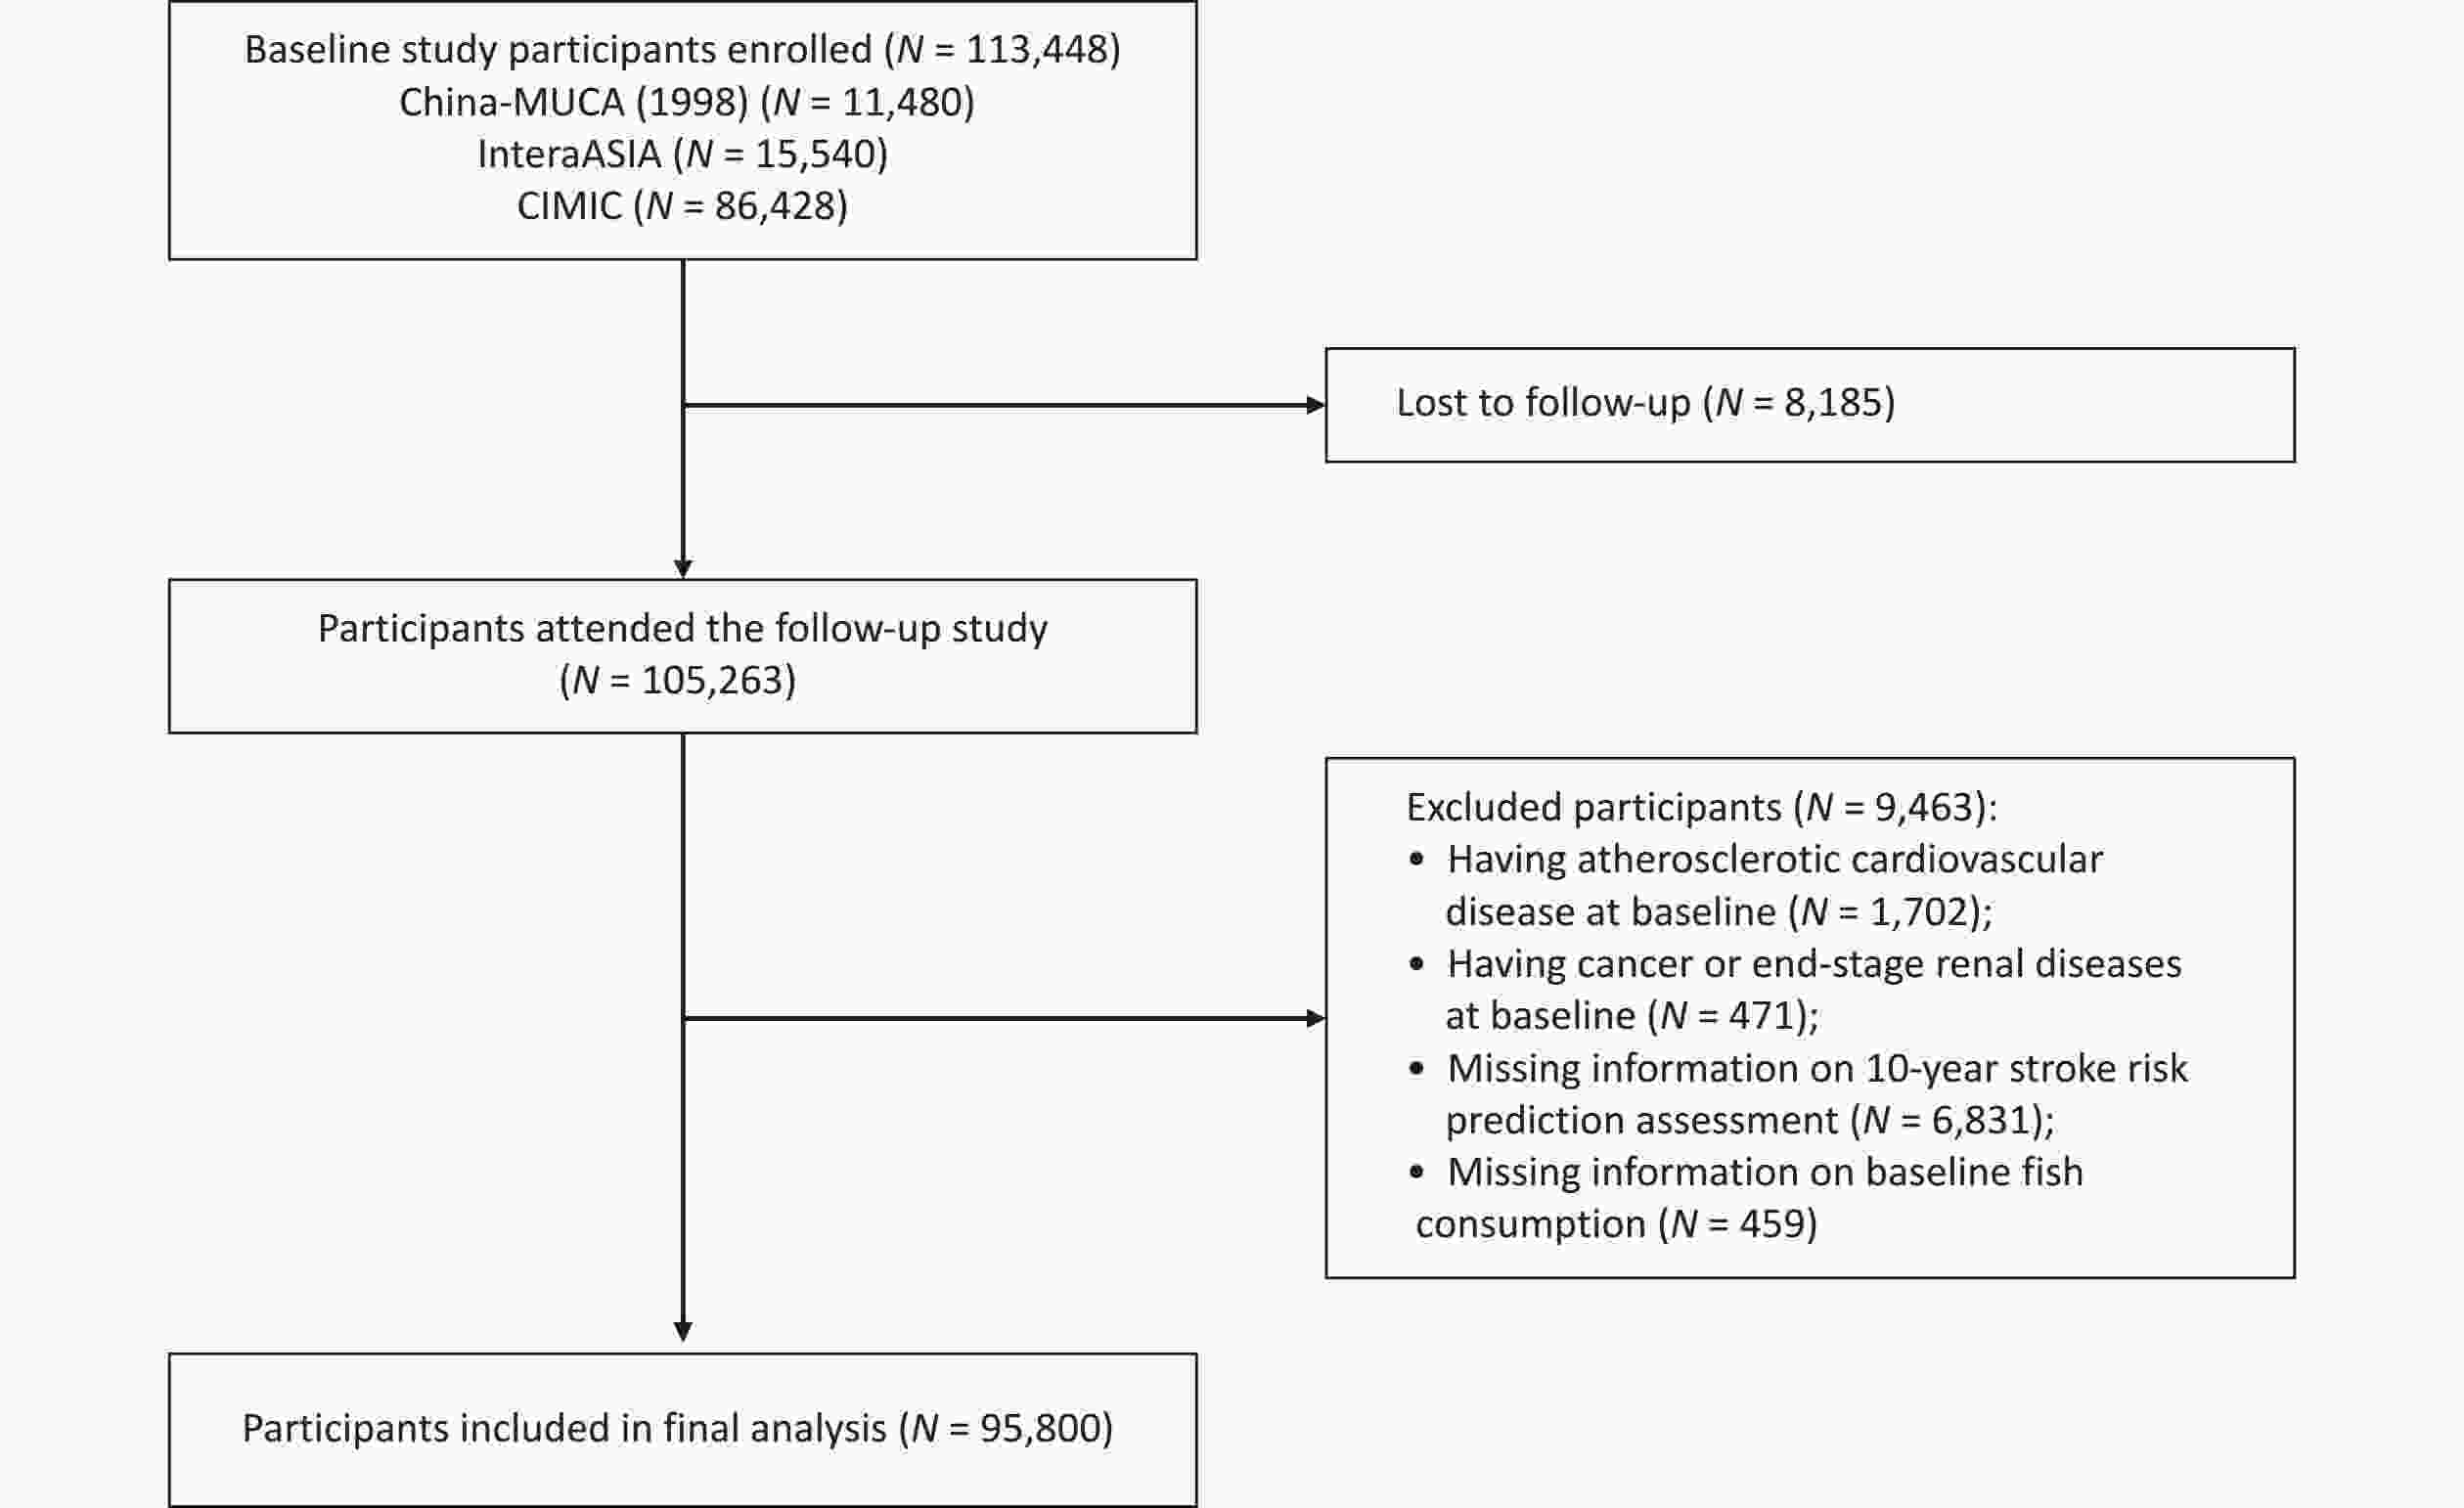
Figure 1. Flowchart of participant selection. China-MUCA (1998), China Multi-Center Collaborative Study of Cardiovascular Epidemiology (1998); InterASIA, International Collaborative Study of Cardiovascular Disease in Asia; CIMIC, Community Intervention of Metabolic Syndrome in China & Chinese Family Health Study.
-
A standardized semi-quantitative food frequency questionnaire (FFQ) was used to assess food consumption over the year preceding enrollment in each cohort. Fish consumption was evaluated by questioning participants about their fish consumption frequency (never, daily, weekly, monthly, or yearly) and the portion size of typical food items in the preceding year. To minimize potential recall bias, we initially provided training sessions for interviewers on dietary intake, and certified qualified interviewers using standard training protocols on food frequency. Second, we intentionally made efforts to obtain information on food intake using standardized questionnaires comprising closed-ended, easy-to-understand questions with appropriate response options. The reliability and validity of the FFQ was evaluated in a previous study[22].
-
Standardized protocols were applied to the questionnaires, physical examinations, and biochemical tests in all three cohorts, and conducted by trained research staff under stringent quality control. Specifically, demographic (age at baseline, sex, geographic region, urban or rural residence, per capita household income, educational attainment, etc.), lifestyle (smoking status, alcohol consumption, physical activity, etc.), and medical history (self-reported antihypertensive, antidiabetic, and lipid-lowering medications) were collected using standardized questionnaires. Physical examinations, including blood pressure (BP), weight, height, waist circumference (WC), and serum measurements, were also performed following to a standardized protocol. All investigators and research staff underwent a training session on the use of standardized protocols and instruments for data collection. Current smoking status was categorized as participants who smoked ≥ 400 cigarettes, ≥ 500 g of tobacco leaves, or smoked at least one cigarette daily for one year[20]. Alcohol consumption was defined as individuals who consumed alcohol consumption at least once per week in the previous year[23]. Body weight and height were measured with the participants wearing light indoor clothes without shoes, and body mass index (BMI) was calculated as weight in kilograms divided by height in meters squared. The ideal physical activity level was defined as ≥ 150 min/week of moderate physical activity, 75 min/week of vigorous physical activity, or an equivalent combination[24]. A family history of stroke was defined as having at least one parent or sibling with stroke. Diabetes mellitus was defined as fasting blood glucose ≥ 126 mg/dL and/or use of insulin or self-reported current treatment with antidiabetic medication (insulin or oral hypoglycemic agents) within two weeks. Trained healthcare practitioners measured the participants’ BP during clinic or home visits, in accordance with the protocol recommended by the American Heart Association[25]. The BP was measured in a sitting position after ≥ 5 min rest per individual. The measurements were triplicated at 30 s intervals, and the average of the three readings was used in the analyses. Hypertension was defined as systolic BP (SBP) ≥ 140 mmHg and/or diastolic BP ≥ 90 mmHg, or using antihypertensive drugs within past two weeks. Hypercholesterolemia was defined as total cholesterol (TC) ≥ 240 mg/dL, or current lipid-lowering treatment within two weeks. Diet score is the ideal consumption amount for fruit and vegetable (≥ 500 g/d), red meat (< 75 g/d), soybean (≥ 125 g/d), and tea (≥ 3 times/week) according to the Chinese dietary guideline recommendations[26-28]. Participants received one point for each achieved ideal; otherwise, no points were awarded. This equal weighting of the components produced a composite score ranging from one to four, indicating dietary health.
-
We utilized previously established predictive 10-year stroke risk models for the general Chinese population to identify individuals at low-, moderate-to-high-risk. These equations enable accurate stroke-specific risk assessment and aid in the management of risk factors for the primary prevention of stroke in China. The gender-specific 10-year risk equations included major stroke risk factors such as age, treated and untreated SBP, current smoking status, diabetes mellitus, TC, high-density lipoprotein cholesterol, family history of stroke, geography, urbanization, and WC. The detailed predictive 10-year stroke risk model has been published elsewhere[19].
In this study, we employed the following definition with reference to the criteria of CVD risk stratification[21]: High stroke risk was determined using a threshold equal to or above the 90th percentile of the 10-year risk of stroke with an absolute value of 7.0%, and the moderate-risk threshold was 3.5%. Therefore, participants with predicted 10-year stroke risks of < 3.5% and ≥ 3.5% were classified into low- and moderate-to-high-risk categories, respectively.
-
During follow-up, disease and vital status information were updated by interviewing participants or their proxies and verified using hospital records (comprising medical histories, physical examinations, laboratory results, operation reports, and insurance records) and death certificates. All the recorded endpoints were further adjudicated by blinded-certified physicians of the Endpoint Assessment Committee at Fuwai Hospital, who were blinded to the baseline information. Incident stroke was defined as a fatal or nonfatal stroke event during follow-up (I60-I69) based on the 10th revision of the International Classification of Diseases code. We also classified the stroke subtypes as ischemic (I63), hemorrhagic (I60-I62), and unspecified.
-
Baseline characteristics are represented as mean ± standard deviation (SD) for continuous variables, and as frequency (%) for categorical variables using fish consumption categories. To limit the potential influence of outliers, fish consumption data was winsorized at the 1 and 99 percentiles[29], and categorized into quartiles (i.e., < 25, 25–100, 100–250, ≥ 250 g/wk). Person-years of follow-up for each study participant was calculated as the difference between the date of the baseline examination and date of stroke occurrence, death, or last follow-up interview, whichever occurred first. To address the potential heterogeneity among the subcohorts and differences in fish consumption between Northern and Southern China, we applied cohort- and region-stratified Cox proportional hazards models to estimate the hazard ratios (HRs) and 95% confidence intervals (CIs) for stroke and its subtypes associated with fish consumption. This analysis used the first fish consumption category as reference. Schoenfeld residuals were used to verify the proportional hazard assumptions. To investigate potential differences in the association between fish consumption and stroke risk among low- and moderate-to-high-risk individuals, we further examined risk stratification analysis using the 10-year stroke risk score. Cohort- and region-stratified Cox proportional hazards models were adjusted for age, sex (Model 1); plus urbanization (urban/rural), educational attainment (below high school/high school or above), per capita household income (< 6,000/≥ 6,000 CNY/year), current smoking status (yes/no), alcohol consumption (yes/no), ideal physical activity (yes/no), BMI, family history of stroke (yes/no), diabetes mellitus (yes/no), hypertension (yes/no), and hypercholesterolemia (yes/no) (Model 2); plus diet score (continuous variable) (Model 3). To avoid overadjustment, factors included in the 10-year stroke risk prediction equations were not adjusted in the analyses stratified by the predicted stroke risk groups, and Model 2 was used as the main model for all analyses. Trend tests were conducted across quartiles by modeling the median values of each group as continuous variables.
To flexibly evaluate the dose-response relationship between fish consumption and risk of stroke and its subtypes, we modeled exposure as a continuous predictor using restricted cubic spline (RCS) regression with four knots (5th, 35th, 65th, and 95th knots). HRs were evaluated using the first fish consumption quartile as a reference for both low- and moderate-to-high-risk groups. The relative excess risk due to interaction (RERI), attributable proportion due to interaction (AP), and synergy index (SI) were used to examine additive interactions (Supplementary Material)[30-32], and a cross-interaction term was added to the model to examine multiplicative interactions. A significant additive interaction effect was defined if the 95% CIs for RERI and AP did not include 0, 95% CIs for SI did not include 1, and multiplicative interaction effect was defined as P < 0.05 for the interaction term. To evaluate the robustness of results, five sensitivity analyses were conducted as follows: (1) events that occurred within the first year of follow-up were excluded; and (2) adjusted diet score in Model 3 were replaced with individual ideal dietary incorporations (ideal intake of vegetables and fruits, red meat, soybean, and tea); (3) application of a Fine-Gray competing risks model to account for the risk of non-stroke deaths[33]; (4) pooling results of three cohort meta-analyses; and (5) adopting the Cox regression model with time-varying variables to include fish consumption updates per survey before endpoints.
All data were analyzed using the SAS statistical package (version 9.4. SAS Institute, Inc., Cary, NC, USA), and graphs were plotted using R (version 4.1.2, R Foundation for Statistical Computing, Vienna, Austria). All tests were two-sided, and P < 0.05 was considered statistically significant.
-
Among the 95,800 participants, the mean (SD) age was 51.4 (12.2) years at baseline, and 38,720 (40.4%) were males (Table 1). The median (interquartile range) consumption of fish was 100.0 (25.0, 250.0) g per week. Men, younger people, urban residents, those in southern China, and individuals with higher economic status and education levels were more likely to consume more fish per week. Compared to the first quartile of fish consumption, participants in the fourth quartile of fish consumption were more likely to be smokers and alcohol consumers, and they had a lower prevalence of hypertension, diabetes, and dyslipidemia and higher intake of fruit and vegetables as well as lower intake of red meat. Information regarding the baseline characteristics of the low- and moderate-to-high-risk groups is presented in Supplementary Table S1 (available in www.besjournal.com).
Table 1. Baseline characteristics of total participants according to quartile categories of fish consumption
Characteristic Total Quartile of fish consumption, g/week P for
trendQ1 (< 25) Q2 (25−) Q3 (100−) Q4 (≥ 250) No. of participants, N (%) 95,800 23,337 (24.4) 20,219 (21.1) 25,310 (26.4) 2,693 (28.1) − Fish Consumption (g/week),
median (IQR)100.0 (25.0, 250.0) 1.9 (0.0, 14.4) 46.7 (35.0, 58.3) 128.3 (105.0, 163.3) 500.0 (300.0, 750.0) − Age (year), mean ± SD 51.4 ± 12.2 52.5 ± 12.7 52.2 ± 11.9 51.2 ± 12.5 50.2 ± 11.6 < 0.001 Male, N (%) 38,720 (40.4) 8,452 (36.2) 8,358 (41.3) 10,424 (41.2) 11,486 (42.6) < 0.001 Northern China, N (%) 47,990 (50.1) 20,624 (88.4) 15,869 (78.5) 7,289 (28.8) 4,208 (15.6) < 0.001 Rural resident, N (%) 86,201 (90.0) 22,864 (98.0) 18,657 (92.3) 22,825 (90.2) 21,855 (81.1) < 0.001 Per−capita household income
(≥ 6,000 CNY/year), N (%)34,644 (36.5) 2,918 (12.7) 5,806 (28.9) 12,521 (49.9) 13,399 (50.3) < 0.001 Highschool or above education,
N (%),13,580 (14.2) 2,066 (8.9) 2,559 (12.7) 3,661 (14.5) 5,294 (19.7) < 0.001 Current smoker, N (%) 21,313 (22.2) 4,472 (19.2) 4,385 (21.7) 5,797 (22.9) 6,659 (24.7) < 0.001 Alcohol drinker, N (%) 17,499 (18.3) 2,010 (8.6) 3,610 (17.9) 5,300 (20.9) 6,579 (24.4) < 0.001 Ideal physical activity*, N (%) 62,662 (65.9) 17,126 (73.4) 13,672 (68.4) 15,163 (60.3) 16,701 (62.9) < 0.001 BMI (kg/m2), mean ± SD 23.8 ± 3.6 24.1 ± 3.7 24.2 ± 3.7 23.5 ± 3.6 23.4 ± 3.5 < 0.001 TC (mg/dL), mean ± SD, 175.1 ± 33.2 175.1 ± 33.8 178.7 ± 33.7 171.8 ± 34.6 175.6 ± 36.2 0.642 LDL−C (mg/dL), mean ± SD 97.1 ± 29.9 97.2 ± 28.6 100.3 ± 29.5 93.81 ± 29.3 97.5 ± 31.3 0.406 SBP (mmHg), mean ± SD 128.6 ± 21.5 129.7 ± 22.4 133.5 ± 22.9 128.0 ± 20.5 124.6 ± 19.5 < 0.001 DBP (mmHg), mean ± SD 79.1 ± 11.7 79.8 ± 11.9 81.5 ± 11.1 78.7 ± 11.5 77.2 ± 11.3 < 0.001 Family history of stroke, N (%) 5,762 (6.0) 2,153 (9.2) 1,015 (5.0) 1,265 (5.0) 1,329 (4.9) < 0.001 Hypertension, N (%) 32,534 (34.0) 8,301 (35.6) 8,525 (42.2) 8,404 (33.2) 7,304 (27.1) < 0.001 Diabetes, N (%) 5,987 (6.2) 1,970 (8.4) 1,336 (6.6) 1,328 (5.2) 1,353 (5.0) < 0.001 Hypercholesterolemia, N (%) 5,731 (6.0) 1,960 (8.4) 1,244 (6.2) 1,044 (4.1) 1,483 (5.5) < 0.001 Ideal diet†, N (%) Fruit and vegetable 43,702 (45.6) 10,403 (44.6) 11,057 (54.7) 9,077 (35.9) 13,165 (48.9) 0.006 Soybean 4,764 (5.0) 807 (3.5) 919 (4.5) 1,175 (4.6) 1,863 (6.9) < 0.001 Red meat 81,985 (85.7) 21,697 (93.1) 17,326 (85.8) 22,541 (89.2) 20,421 (75.9) < 0.001 Tea 29,542 (31.3) 5,640 (24.2) 7,459 (37.0) 8,085 (32.6) 8,358 (31.8) < 0.001 Note. IQR, interquartile range; BMI, body mass index; LDL−C, Low−Density Lipoprotein Cholesterol; TC, total cholesterol; SBP, systolic blood pressure; DBP, diastolic blood pressure; *, Ideal physical activity was defined as ≥ 150 min/week of moderate physical activity or 75 min/week of vigorous physical activity or an equivalent combination; †, Ideal diet was defined as a healthy diet score (attainment criteria for each food group intake: fruits and vegetables ≥ 500 g/d; soybean ≥ 125 g/d; red meat < 75 g/d; tea ≥ 3 times/week were considered as attainment. During the 703,869 person-years of follow-up, 2,773 participants were diagnosed with incident stroke events, of which 1,745 were ischemic and 813 were hemorrhagic. In summary, fish consumption was inversely associated with stroke risk in the total population. Based on the multivariate adjusted model (Model 2), compared with the first quartile of fish consumption, the multivariate adjusted HRs (95% CI) for the fourth quartile of fish consumption were 0.68 (0.59–0.78) for total stroke, 0.70 (0.59–0.83) for ischemic stroke, and 0.72 (0.57–0.93) for hemorrhagic stroke (Table 2).
Table 2. Association between quartiles of fish consumption and stroke incidence in total population
Health outcomes Quartile of fish consumption, g/week P for trend Q1 (< 25) Q2 (25–) Q3 (100–) Q4 (≥ 250) Stroke No. of events/No. of participants 988/23,337 654/20,219 544/25,310 587/26,934 − Incidence rate (/100,000 Pys) 669.66 442.75 306.12 260.04 − HR (95% CI), model 1 1.00 [reference] 0.81 (0.73, 0.90) 0.70 (0.62, 0.79) 0.68 (0.60, 0.77) < 0.001 HR (95% CI), model 2 1.00 [reference] 0.78 (0.70, 0.87) 0.69 (0.61, 0.78) 0.68 (0.59, 0.78) < 0.001 HR (95% CI), model 3 1.00 [reference] 0.78 (0.70, 0.88) 0.70 (0.61, 0.79) 0.69 (0.60, 0.79) < 0.001 Ischemic stroke No. of events/No. of participants 620/23,337 428/20,219 346/25,310 351/26,934 − Incidence rate, per 100,000 Pys 418.88 289.21 194.42 155.20 − HR (95% CI), model 1 1.00 [reference] 0.87 (0.76, 0.99) 0.77 (0.66, 0.90) 0.72 (0.60, 0.85) 0.002 HR (95% CI), model 2 1.00 [reference] 0.84 (0.73, 0.96) 0.75 (0.64, 0.88) 0.70 (0.59, 0.83) 0.002 HR (95% CI), model 3 1.00 [reference] 0.84 (0.73, 0.97) 0.76 (0.64, 0.89) 0.70 (0.59, 0.84) 0.003 Hemorrhagic stroke No. of events/No. of participants 285/23,337 189/20,219 163/25,310 176/26,934 − Incidence rate, per 100,000 Pys 191.35 127.01 91.34 77.69 − HR (95% CI), model 1 1.00 [reference] 0.80 (0.66, 0.98) 0.72 (0.58, 0.90) 0.70 (0.55, 0.89) 0.048 HR (95% CI), model 2 1.00 [reference] 0.75 (0.62, 0.92) 0.71 (0.57, 0.90) 0.72 (0.57, 0.93) 0.166 HR (95% CI), model 3 1.00 [reference] 0.77 (0.63, 0.94) 0.72 (0.57, 0.91) 0.74 (0.57, 0.94) 0.193 Note. Model 1, Cox proportional hazard model, stratified by cohort and region, adjusted for age and sex; Model 2, further adjusted for urban or rural residence, per capita household income, educational attainment, current smoking status, alcohol consumption, family history of stroke, hypertension, diabetes, dyslipidemia, ideal physical activity, and BMI; Model 3, Further adjusted for diet score. BMI, body mass index; Pys, person−years; HR, hazard ratio; CI, confidence interval. The association between fish consumption and a lower risk of stroke was more pronounced among individuals with moderate-to-high-risk than among those with low-risk. Specifically, compared to the first quartile fish consumption, the second, third, and fourth quartile fish consumption was associated with a lower risk of stroke, with HRs (95% CI) of 0.93 (95% CI: 0.70–1.24), 0.61 (95% CI: 0.46–0.82), and 0.64 (95% CI: 0.49–0.85) among low-risk individuals, respectively, and 0.70 (95% CI: 0.63–0.79), 0.58 (95% CI: 0.51–0.66), 0.53 (95% CI: 0.47–0.60) among moderate-to-high-risk individuals, respectively (Table 3). In addition, a significant additive interaction between fish consumption and predicted stroke risk was observed for the risk of total (RERI = 4.08, 95% CI: 2.80–5.36; SI = 1.64, 95% CI: 1.42–1.89), ischemic (RERI = 5.30, 95% CI: 3.40–7.21; SI = 1.80, 95% CI: 1.50–2.15), and hemorrhagic strokes incidences (RERI = 3.53, 95% CI: 1.20–5.86; SI = 1.52, 95% CI: 1.17–1.97), respectively, and the attributable total, ischemic, and hemorrhagic strokes risk proportions were approximately 36%, 41%, and 31% for their additive interaction, respectively (Table 4). We found no statistically significant multiplicative interactions (all P for interaction > 0.05).
Table 3. Association between quartiles of fish consumption and stroke incidence according to predicted stroke risk stratification
Health outcomes Quartile of fish consumption, g/week P for trend Q1 (< 25) Q2 (25–) Q3 (100–) Q4 (≥ 250) Low−risk Stroke No. of events/No. of participants 108/11,383 109/9,962 101/15,672 165/18,742 − Incidence rate (/100,000 Pys) 140.99 134.46 87.30 98.67 − HR (95% CI), model 1 1.00 [reference] 0.83 (0.62, 1.10) 0.50 (0.38, 0.66) 0.49 (0.38, 0.63) < 0.001 HR (95% CI), model 2 1.00 [reference] 0.93 (0.70, 1.24) 0.61 (0.46, 0.82) 0.64 (0.49, 0.85) 0.005 HR (95% CI), model 3 1.00 [reference] 0.93 (0.70, 1.23) 0.62 (0.46, 0.83) 0.65 (0.49, 0.85) 0.006 Ischemic stroke No. of events/No. of participants 66/11,383 74/9,962 69/15,672 97/18,742 − Incidence rate (/100,000 Pys) 86.80 91.20 59.42 57.95 − HR (95% CI), model 1 1.00 [reference] 0.93 (0.65, 1.32) 0.55 (0.39, 0.78) 0.46 (0.33, 0.64) < 0.001 HR (95% CI), model 2 1.00 [reference] 1.04 (0.73, 1.49) 0.69 (0.48, 1.00) 0.62 (0.43, 0.88) 0.002 HR (95% CI), model 3 1.00 [reference] 1.04 (0.73, 1.49) 0.69 (0.48, 1.00) 0.62 (0.43, 0.88) 0.002 Hemorrhagic stroke No. of events/No. of participants 26/11,383 29/9,962 25/15,672 48/18,742 − Incidence rate (/100,000 Pys) 33.88 35.66 21.50 28.67 − HR (95% CI), model 1 1.00 [reference] 0.86 (0.49, 1.51) 0.52 (0.30, 0.92) 0.61 (0.37, 1.20) 0.123 HR (95% CI), model 2 1.00 [reference] 0.98 (0.56, 1.73) 0.60 (0.33, 1.09) 0.76 (0.44, 1.32) 0.468 HR (95% CI), model 3 1.00 [reference] 0.96 (0.55, 1.70) 0.61 (0.34, 1.11) 0.78 (0.45, 1.34) 0.546 Moderate−to−high−risk Stroke No. of events/No. of participants 880/11,954 545/10,257 443/9,638 422/8,192 − Incidence rate (/100,000 Pys) 1240.5 817.75 718.42 721.16 − HR (95% CI), model 1 1.00 [reference] 0.68 (0.61, 0.76) 0.52 (0.46, 0.58) 0.47 (0.41, 0.53) < 0.001 HR (95% CI), model 2 1.00 [reference] 0.70 (0.63, 0.79) 0.58 (0.51, 0.66) 0.53 (0.47, 0.60) < 0.001 HR (95% CI), model 3 1.00 [reference] 0.71 (0.63, 0.79) 0.58 (0.52, 0.66) 0.53 (0.47, 0.61) < 0.001 Ischemic stroke No. of events/No. of participants 554/11,954 354/10,257 277/9,638 254/8,192 − Incidence rate (/100,000 Pys) 776.52 529.52 447.84 432.24 − HR (95% CI), model 1 1.00 [reference] 0.70 (0.61, 0.81) 0.51 (0.44, 0.59) 0.43 (0.37, 0.50) < 0.001 HR (95% CI), model 2 1.00 [reference] 0.72 (0.63, 0.84) 0.56 (0.48, 0.65) 0.48 (0.40, 0.56) < 0.001 HR (95% CI), model 3 1.00 [reference] 0.73 (0.63, 0.84) 0.56 (0.48, 0.65) 0.48 (0.41, 0.56) < 0.001 Hemorrhagic stroke No. of events/No. of participants 259/11,954 160/10,257 138/9,638 128/8,192 − Incidence rate (/100,000 Pys) 358.69 237.07 221.99 216.60 − HR (95% CI), model 1 1.00 [reference] 0.67 (0.55, 0.82) 0.57 (0.46, 0.70) 0.52 (0.42, 0.65) < 0.001 HR (95% CI), model 2 1.00 [reference] 0.69 (0.56, 0.85) 0.63 (0.51, 0.79) 0.59 (0.47, 0.75) < 0.001 HR (95% CI), model 3 1.00 [reference] 0.70 (0.57, 0.87) 0.64 (0.51, 0.80) 0.60 (0.48, 0.76) 0.001 Note. Cox proportional hazard model, stratified by cohort, Model 1, adjusted for age and sex; Model 2, adjusted for sex, per capita household income, educational attainment, alcohol consumption, ideal physical activity, and BMI; Model 3, adjusted for sex, per capita household income, educational attainment, alcohol consumption, ideal physical activity, and BMI, and diet score. BMI, body mass index; Pys, person−years; HR, hazard ratio; CI, confidence interval. Table 4. Additive interaction between fish consumption and predicted stroke risk stratification on stroke incidence*
VariablesStroke Ischemic stroke Hemorrhagic stroke RERI (95% CI) 4.08 (2.80, 5.36) 5.30 (3.40, 7.21) 3.53 (1.20, 5.86) P value < 0.001 < 0.001 0.003 AP (95% CI) 0.36 (0.28, 0.43) 0.41 (0.32, 0.50) 0.31 (0.15, 0.47) P value < 0.001 < 0.001 < 0.001 SI (95% CI) 1.64 (1.42, 1.89) 1.80 (1.50, 2.15) 1.52 (1.17, 1.97) P value < 0.001 < 0.001 0.002 Note. *The reference level was participants with the highest quartile of fish consumption and low−risk, and the highest level was participants with the lowest quartile of fish consumption and moderate−to−high−risk. Cox proportional hazards model, stratified by cohort and adjusted for sex, per capita household income, educational attainment, alcohol consumption, ideal physical activity, and BMI. BMI, body mass index; RERI, relative excess risk due to interaction; AP, attributable proportion due to interaction; SI, synergy index. The null hypotheses for each interaction were RERI = 0, AP = 0, SI = 1 and CI = confidence interval. RCS regression analysis indicated a non-linear dose-response relationship between fish consumption and the risk of total, ischemic, and hemorrhagic strokes (P for non-linear < 0.05; Figure 2A–C) in the total population. Further stratified analyses by 10-year stroke risk showed non-linear dose-response relationships between fish consumption and risk of stroke in low-risk and moderate-to-high-risk individuals (P for non-linear < 0.05; Figure 2D, G) and were in concordance with the categorical analysis in Table 3. Similar non-linear dose-response relationships were observed for the associations between fish consumption and ischemic stroke in moderate-to-high-risk individuals (P for non-linear < 0.05; Figure 2H), and hemorrhagic stroke in low-risk and moderate-to-high-risk individuals (P for non-linear < 0.05; Figure 2F, I), whereas no non-linear association with ischemic stroke risk was observed in low-risk individuals (P for non-linear = 0.086; Figure 2E).
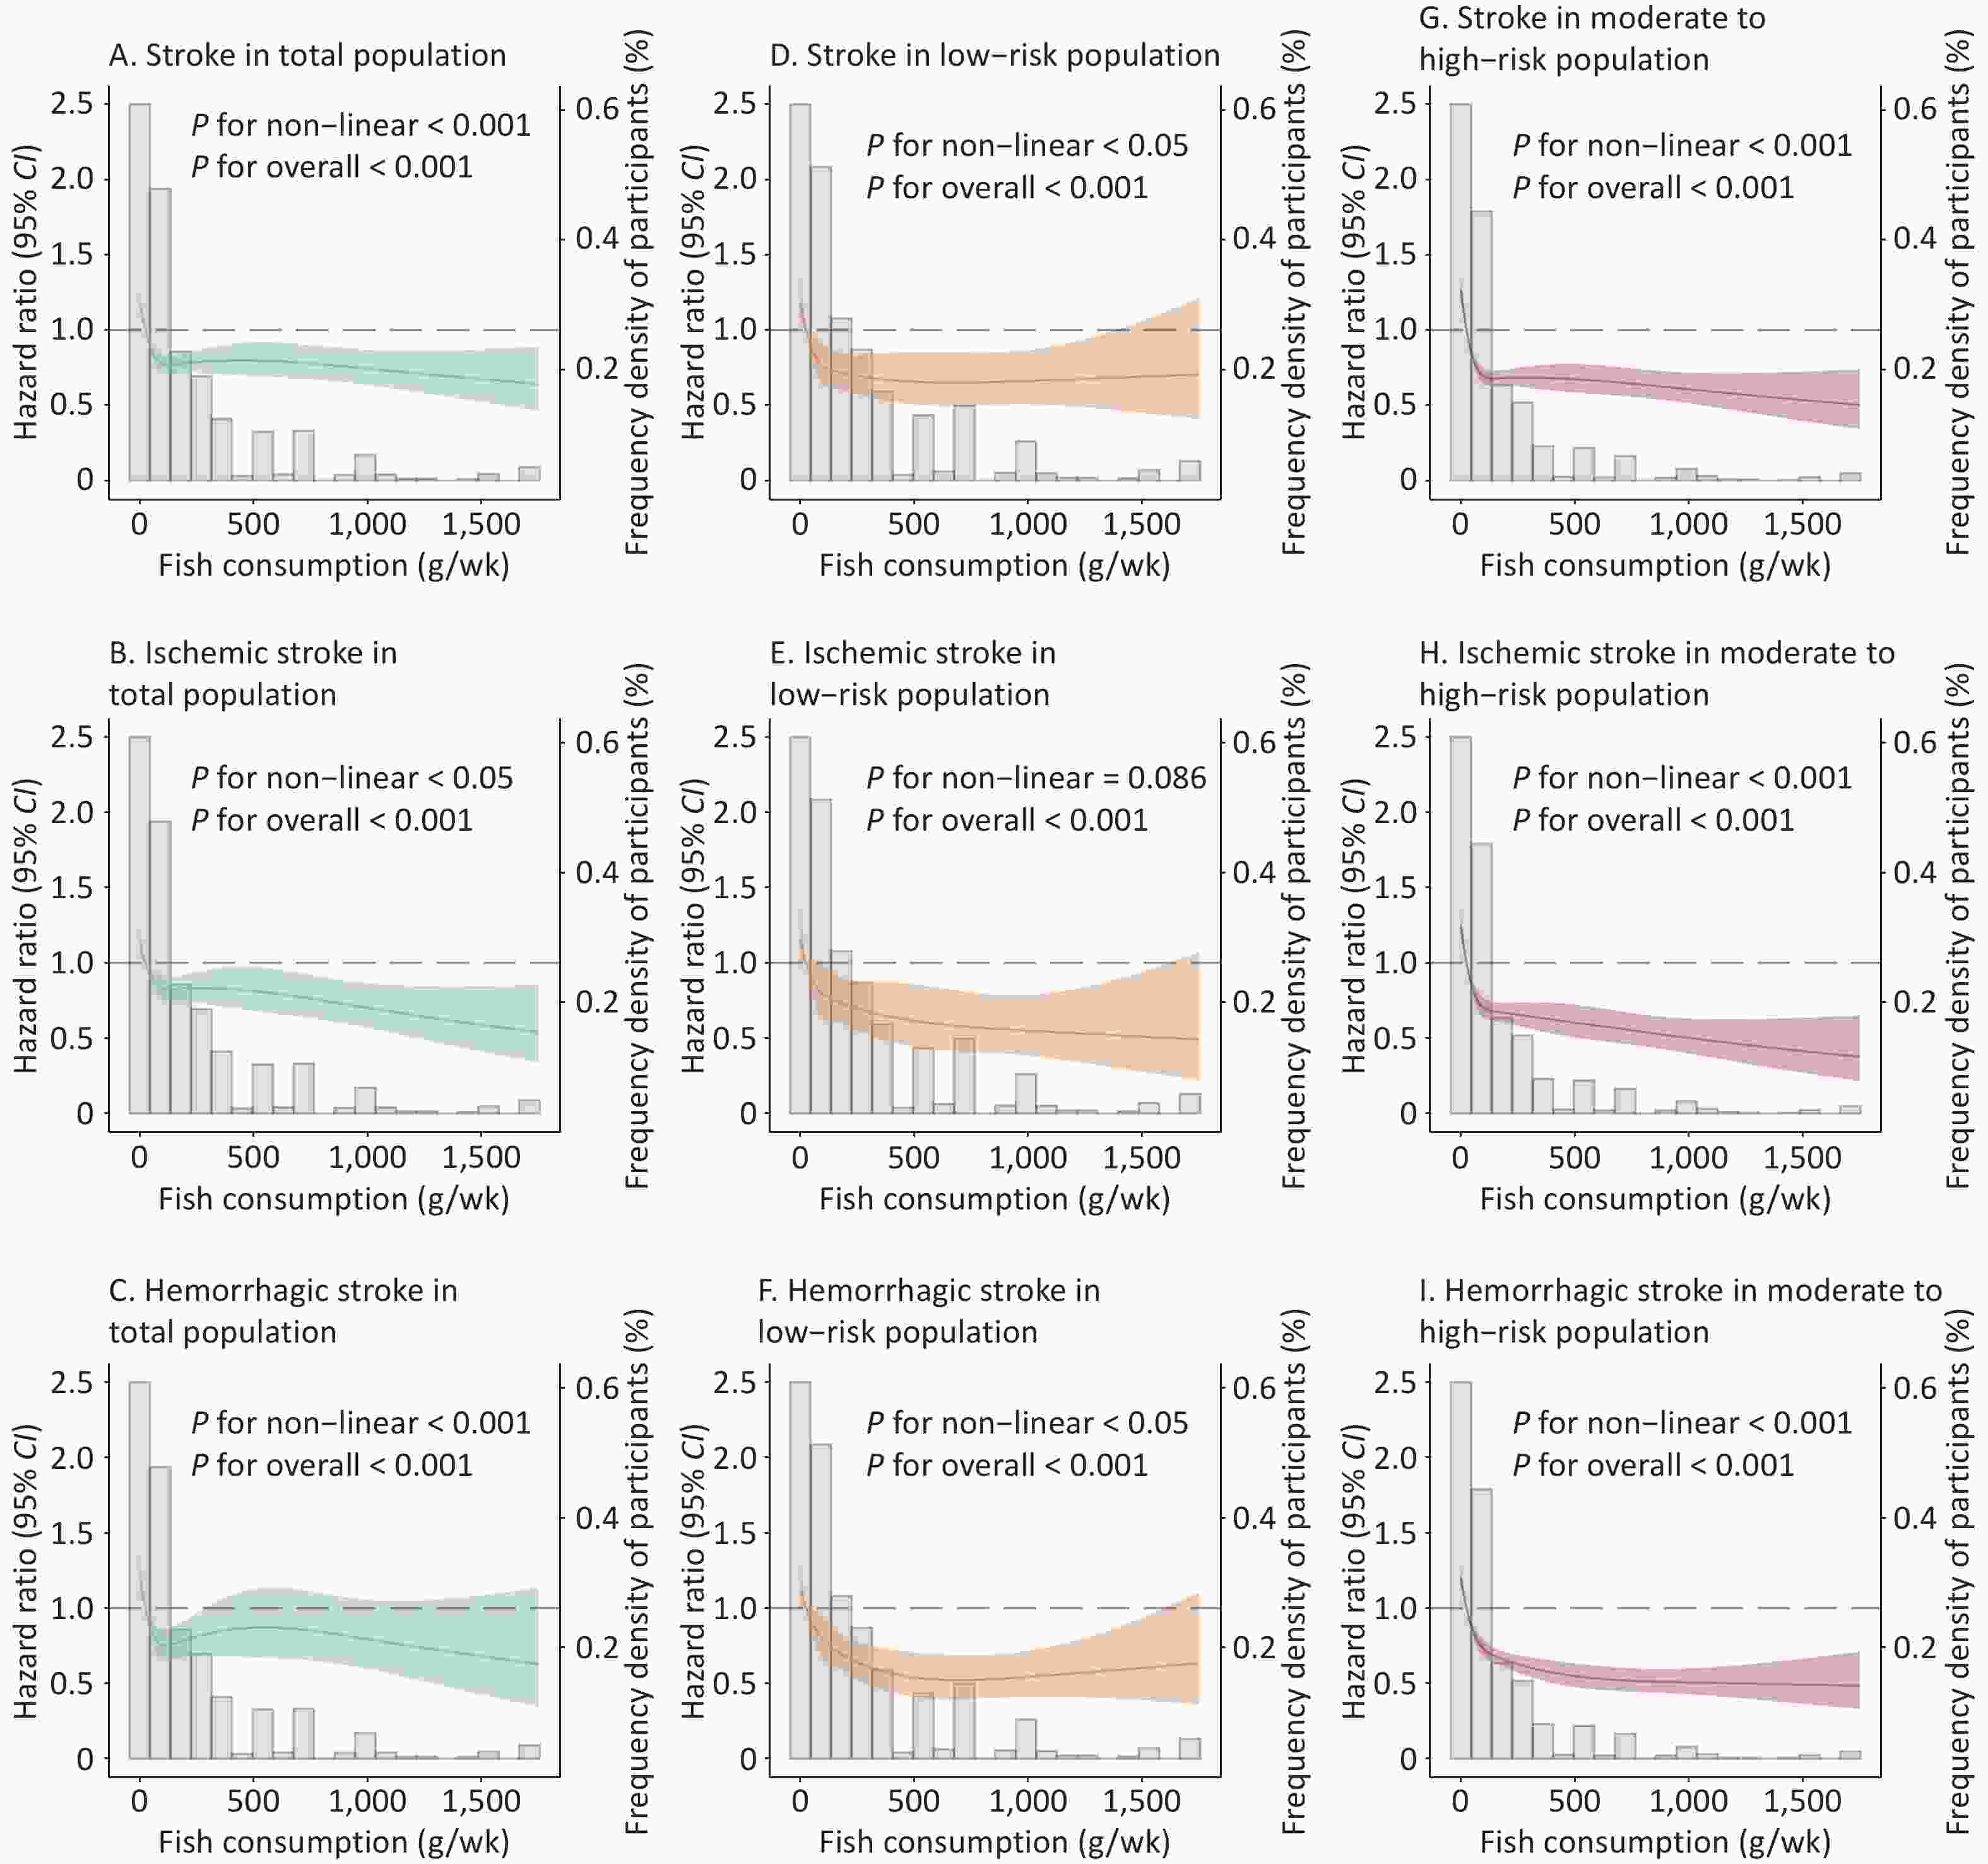
Figure 2. Restricted cubic spline curves for the association of fish consumption with total, ischemic, and hemorrhagic strokes in the total, low-risk, and moderate-to-high-risk populations. (A) Strokes in the total population. (B) Ischemic stroke in the total population. (C) Hemorrhagic stroke in the total population. (D) Stroke in the low-risk population. (E) Ischemic stroke in a low-risk population. (F) Hemorrhagic stroke in a low-risk population. (G) Stroke in the moderate-to high-risk population. (H) Ischemic stroke in a moderate-to-high-risk population. (I) Hemorrhagic stroke in a moderate-to high-risk population. The gray histogram represents the distribution of fish consumption (g/week) in the study population; the solid line is the RCS curve, shading indicates the 95% CI of the RCS curve, and dashed line is the reference line with an effect value of 1. Cox proportional hazards model, stratified by cohort and adjusted for sex, per capita household income, educational attainment, alcohol consumption, ideal physical activity, and BMI. RCS, restricted cubic spline; BMI, body mass index; g/wk, g/week; CI, confidence interval.
Sensitivity analyses excluded events that occurred within the first year of follow-up, replaced the ideal diet score with a single ideal diet in Model 3, accounted for competing risks, pooled the results from three cohort meta-analyses, and adopted the Cox regression model with time-varying variables to include updated fish consumption in each survey before the endpoints revealed no substantial changes in the associations identified in the main analyses (Supplementary Table S2, available in www.besjournal.com).
Table S2. Sensitivity analyses for the associations between quartile of fish consumption and stroke incidence
HR (95% CI) Quartile of fish consumption, g/week P for trend Q1 Q2 Q3 Q4 Excluding stroke identified during the first years of follow-up Total population Stroke 1.00 [reference] 0.78 (0.70, 0.88) 0.71 (0.62, 0.81) 0.69 (0.60, 0.79) 0.001 Ischemic stroke 1.00 [reference] 0.85 (0.74, 0.98) 0.79 (0.67, 0.93) 0.73 (0.61, 0.87) 0.009 Hemorrhagic stroke 1.00 [reference] 0.77 (0.63, 0.95) 0.73 (0.57, 0.92) 0.70 (0.54, 0.91) 0.079 Low−risk* Stroke 1.00 [reference] 0.92 (0.69, 1.24) 0.63 (0.47, 0.85) 0.65 (0.49, 0.86) 0.007 Ischemic stroke 1.00 [reference] 1.03 (0.71, 1.48) 0.71 (0.49, 1.02) 0.62 (0.44, 0.89) 0.003 Hemorrhagic stroke 1.00 [reference] 0.95 (0.53, 1.72) 0.62 (0.34, 1.15) 0.77 (0.44, 1.35) 0.522 Moderate−to−High−risk* Stroke 1.00 [reference] 0.71 (0.63, 0.80) 0.61 (0.54, 0.69) 0.55 (0.48, 0.63) < 0.001 Ischemic stroke 1.00 [reference] 0.74 (0.63, 0.85) 0.59 (0.51, 0.70) 0.51 (0.43, 0.60) < 0.001 Hemorrhagic stroke 1.00 [reference] 0.70 (0.57, 0.87) 0.66 (0.52, 0.82) 0.58 (0.46, 0.74) 0.001 Model 3 Replacing a single ideal diet with diet score† Total population Stroke 1.00 [reference] 0.80 (0.71, 0.89) 0.71 (0.63, 0.81) 0.71 (0.62, 0.81) 0.002 Ischemic stroke 1.00 [reference] 0.86 (0.75, 0.99) 0.79 (0.67, 0.92) 0.74 (0.62, 0.88) 0.010 Hemorrhagic stroke 1.00 [reference] 0.78 (0.63, 0.95) 0.74 (0.58, 0.93) 0.76 (0.59, 0.98) 0.276 Low−risk* Stroke 1.00 [reference] 0.94 (0.71, 1.26) 0.64 (0.48, 0.87) 0.68 (0.51, 0.90) 0.013 Ischemic stroke 1.00 [reference] 1.05 (0.73, 1.51) 0.72 (0.50, 1.04) 0.64 (0.45, 0.92) 0.005 Hemorrhagic stroke 1.00 [reference] 1.06 (0.60, 1.89) 0.68 (0.37, 1.25) 0.85 (0.48, 1.49) 0.628 Moderate−to−High−risk* Stroke 1.00 [reference] 0.71 (0.64, 0.80) 0.58 (0.51, 0.66) 0.53 (0.47, 0.61) < 0.001 Ischemic stroke 1.00 [reference] 0.73 (0.63, 0.85) 0.56 (0.48, 0.66) 0.48 (0.41, 0.57) < 0.001 Hemorrhagic stroke 1.00 [reference] 0.70 (0.57, 0.87) 0.64 (0.51, 0.79) 0.60 (0.48, 0.76) 0.001 Using Fine & Gary sub−distribution hazard models Total population Stroke 1.00 [reference] 0.78 (0.70, 0.87) 0.69 (0.61, 0.79) 0.70 (0.61, 0.80) 0.001 Ischemic stroke 1.00 [reference] 0.84 (0.73, 0.96) 0.75 (0.64, 0.89) 0.72 (0.60, 0.86) 0.008 Hemorrhagic stroke 1.00 [reference] 0.76 (0.62, 0.93) 0.72 (0.57, 0.91) 0.74 (0.58, 0.95) 0.226 Low−risk* Stroke 1.00 [reference] 0.93 (0.70, 1.24) 0.61 (0.46, 0.82) 0.64 (0.49, 0.84) 0.005 Ischemic stroke 1.00 [reference] 1.04 (0.73, 1.48) 0.70 (0.49, 1.00) 0.62 (0.44, 0.87) 0.002 Hemorrhagic stroke 1.00 [reference] 0.98 (0.55, 1.77) 0.60 (0.33, 1.10) 0.76 (0.44, 1.32) 0.477 Moderate−to−High−risk* Stroke 1.00 [reference] 0.71 (0.63, 0.80) 0.59 (0.52, 0.67) 0.55 (0.49, 0.62) < 0.001 Ischemic stroke 1.00 [reference] 0.74 (0.64, 0.85) 0.58 (0.49, 0.67) 0.50 (0.43, 0.59) < 0.001 Hemorrhagic stroke 1.00 [reference] 0.70 (0.57, 0.86) 0.65 (0.52, 0.81) 0.61 (0.48, 0.77) 0.002 Pooling results of three cohort meta−analyses Total population Stroke 1.00 [reference] 0.81 (0.72, 0.91) 0.72 (0.64, 0.82) 0.73 (0.64, 0.83) − Ischemic stroke 1.00 [reference] 0.86 (0.74, 0.99) 0.78 (0.66, 0.91) 0.74 (0.62, 0.87) − Hemorrhagic stroke 1.00 [reference] 0.79 (0.64, 0.97) 0.76 (0.60, 0.96) 0.78 (0.61, 1.00) − Low−risk* Stroke 1.00 [reference] 1.01 (0.72, 1.40) 0.74 (0.54, 1.01) 0.80 (0.59, 1.08) − Ischemic stroke 1.00 [reference] 1.09 (0.71, 1.69) 0.88 (0.60, 1.29) 0.84 (0.57, 1.23) − Hemorrhagic stroke 1.00 [reference] 1.16 (0.62, 2.20) 0.61 (0.33, 1.13) 0.73 (0.41, 1.32) − Moderate−to−High−risk* Stroke 1.00 [reference] 0.76 (0.68, 0.86) 0.70 (0.61, 0.80) 0.66 (0.57, 0.76) − Ischemic stroke 1.00 [reference] 0.80 (0.69, 0.93) 0.72 (0.60, 0.86) 0.66 (0.55, 0.80) − Hemorrhagic stroke 1.00 [reference] 0.75 (0.61, 0.93) 0.80 (0.63, 1.03) 0.76 (0.58, 1.00) − Adopting the Cox regression model with time−varying variables to include fish consumption updated in each survey before endpoints Total population Stroke 1.00 [reference] 0.74 (0.66, 0.84) 0.69 (0.61, 0.79) 0.65 (0.57, 0.76) < 0.001 Ischemic stroke 1.00 [reference] 0.83 (0.72, 0.96) 0.77 (0.65, 0.91) 0.67 (0.55, 0.80) < 0.001 Hemorrhagic stroke 1.00 [reference] 0.67 (0.54, 0.83) 0.71 (0.56, 0.91) 0.75 (0.58, 0.98) 0.041 Low−risk* Stroke 1.00 [reference] 0.79 (0.56, 1.12) 0.61 (0.42, 0.89) 0.66 (0.45, 0.96) 0.313 Ischemic stroke 1.00 [reference] 0.89 (0.58, 1.37) 0.80 (0.50, 1.28) 0.77 (0.48, 1.24) 0.503 Hemorrhagic stroke 1.00 [reference] 0.72 (0.37, 1.42) 0.44 (0.21, 0.95) 0.57 (0.27, 1.18) 0.972 Moderate-to-High-risk* Stroke 1.00 [reference] 0.71 (0.62, 0.80) 0.67 (0.58, 0.77) 0.58 (0.50, 0.68) < 0.001 Ischemic stroke 1.00 [reference] 0.77 (0.67, 0.90) 0.72 (0.60, 0.86) 0.58 (0.48, 0.72) < 0.001 Hemorrhagic stroke 1.00 [reference] 0.64 (0.51, 0.81) 0.73 (0.56, 0.94) 0.70 (0.53, 0.93) 0.126 Note. Cox proportional hazards model, stratified by cohort and region, adjusted for age, sex, urban or rural residence, per capita household income, educational attainment, current smoking status, alcohol consumption, family history of stroke, hypertension, diabetes, dyslipidemia, ideal physical activity, and BMI. *: The model in risk stratification: stratified by cohort, adjusted for sex, per capita household income, educational attainment, alcohol consumption, ideal physical activity, and BMI. †: Substitution of diet score for single ideal diet (ideal fruit and vegetables ≥ 500 g/d; ideal soybean ≥ 125 g/d; ideal red meat < 75 g/d; ideal tea ≥ 3 times/week). HR, hazard ratio; CI, confidence interval. ‡: Stratified by cohort and region, adjusted for age, sex, urban or rural residence, per capita household income, educational attainment, current smoking status, alcohol consumption, family history of stroke, hypertension, diabetes, dyslipidemia, ideal physical activity, BMI, and diet score. -
Using data from three large prospective cohorts of the Chinese population, we observed that higher fish consumption was associated with a lower risk of total, ischemic, and hemorrhagic strokes in the general population. Further stratification according to the predicted stroke risk revealed that this beneficial association was more pronounced among individuals with moderate-to-high-risk. Our study is the first to demonstrate that the association between fish consumption and incident stroke is enhanced by the underlying risk profile of the individual, with an additive interaction between fish consumption and predicted stroke risk for stroke occurrence.
Previous studies on the association between fish consumption and risk of stroke and its subtypes have primarily been conducted in non-Chinese populations, whereas findings from current meta-analyses of prospective cohort studies in Japan, the US, and other European countries are remain inconsistent[11,34,35]. The heterogeneity in the results may be partly due to regional differences in dietary patterns, fish types, or preparation methods. A significant beneficial association between fish consumption and stroke risk is observed in Asian countries[36,37], but not in Western countries[38]. Similar to our findings, a recent Shanghai cohort study suggested that fish consumption reduced the risk of total and ischemic strokes but not hemorrhagic stroke[13]. This discrepancy may, in part, be attributed to limitations in the statistical capacity coupled with variations in the geographical areas encompassed.
Recently, Mohan et al.[15] reported prospective associations involving 191,558 individuals from four cohort studies, and found that fish consumption was associated with a lower risk of CVD among high-risk individuals or patients with existing vascular disease. Nutrients present in fish, such as omega-3 fatty acids, have a substantial effect on individuals with a higher predisposition to stroke. A population-based cohort study indicated that the inverse link between fish oil consumption and cardiovascular events was slightly more potent among individuals with hypertension, despite the abundance of fish oil in N-3 PUFAs[17]. Four intervention studies identified an association between fish consumption and reduced WC[39]. Moreover, a dietary intervention study showed that the greatest decrease in WC was found in adults who are overweight and obese, and a 3.4 cm reduction relative to the control group was found among those in the lean fish-consuming group (cod 5 t/week)[40]. Additionally, the combination of fish consumption with other dietary or lifestyle factors that contribute to stroke risk may cause significant reduction in stroke incidence in high-risk individuals[18]. Future recommendations for personalized fish consumption should comprehensively consider an individual’s cardiovascular risk profile.
A more substantial association between fish consumption and stroke in individuals at moderate-to-high-risk is biologically plausible, and several mechanisms may contribute to reducing this risk. Dietary N-3 PUFA from fish reduces triglycerides, especially in hypertriglyceridemia, by enhancing the clearance and lowering of the level of hepatic very-low-density lipoprotein production. Additionally, it improves arterial elasticity through vasodilators and protects against platelet-monocyte aggregation, reducing atherothrombosis[41]. Furthermore, fish contains vitamin D, which promotes heart health, unique amino acids that modify CVD risk, and other essential vitamins and trace elements[16,42]. For instance, selenium and calcium in fish might alleviate oxidative stress and inflammation in patients with coronary heart disease, whereas vitamin D potentially regulates BP and inhibits inflammation, vascular smooth muscle proliferation, and vascular calcification[11]. Research suggests that taurine reduces cardiovascular risk through multiple mechanisms, including weight reduction, improved blood lipid profiles, and anti-atherosclerotic and anti-inflammatory effects[16]. Further research is warranted for complete elucidation of the mechanisms underlying these additive interactions.
This study has many strengths, including the large sample size of the Chinese population, prospective design, prolonged follow-up, and comprehensive adjustment for potential confounders. These strengths enhanced the study’s robustness as well as minimized potential biases and confounding factors. The present study had some limitations. First, unavoidable measurement errors in self-reported diet and other data, coupled with potential for recall bias and changes in dietary habits during the extended follow-up, and misclassification can occur. Second, we did not consider cooking methods (e.g., steaming, boiling, and frying) or contaminants in the fish, which may have affected our results. Third, the available data were insufficient for calculating total energy intake. Nevertheless, BMI and physical activity were adjusted as rough proxies for estimating total energy intake. Finally, owing to the observational nature of this study, a causal relationship between fish consumption and stroke could not be concluded. Further, randomized controlled trials are required to validate our findings.
-
In this prospective cohort study, higher fish consumption was associated with a significantly lower risk of stroke, and moderate-to high-risk individuals may derive more pronounced benefits from this association. Furthermore, there was a pronounced additive interaction between fish consumption and the predicted 10-year stroke risk, highlighting the potential for personalized dietary interventions, especially for those at a higher risk of stroke.
doi: 10.3967/bes2025.003
Association between Fish Consumption and Stroke Incidence Across Different Predicted Risk Populations: A Prospective Cohort Study from China
-
Abstract:
Objective The relationship between fish consumption and stroke is inconsistent, and it is uncertain whether this association varies across predicted stroke risks. Methods A cohort study comprising 95,800 participants from the Prediction for Atherosclerotic Cardiovascular Disease Risk in China project was conducted. A standardized questionnaire was used to collect data on fish consumption. Participants were stratified into low- and moderate-to-high-risk categories based on their 10-year stroke risk prediction scores. Hazard ratios (HRs) and 95% confidence intervals (CIs) were estimated using Cox proportional hazard models and additive interaction by relative excess risk due to interaction (RERI), attributable proportion (AP), and synergy index (SI). Results During 703,869 person-years of follow-up, 2,773 incident stroke events were identified. Higher fish consumption was associated with a lower risk of stroke, particularly among moderate-to-high-risk individuals (HR = 0.53, 95% CI: 0.47–0.60) than among low-risk individuals (HR = 0.64, 95% CI: 0.49–0.85). A significant additive interaction between fish consumption and predicted stroke risk was observed (RERI = 4.08, 95% CI: 2.80–5.36; SI = 1.64, 95% CI: 1.42–1.89; AP = 0.36, 95% CI: 0.28–0.43). Conclusion Higher fish consumption was associated with a lower risk of stroke, and this beneficial association was more pronounced in individuals with moderate-to-high stroke risk. -
Key words:
- Fish consumption /
- Stroke /
- Predicted stroke risk /
- Cohort study /
- Interaction
None.
The China-PAR project was approved by the Institutional Review Board at Fuwai Hospital in Beijing (2022-1665) and all participating institutions. Written informed consent was obtained from all participants prior to data collection.
注释:1) Authors’ Contributions: 2) Competing Interests: 3) Ethics: -
Figure 1. Flowchart of participant selection. China-MUCA (1998), China Multi-Center Collaborative Study of Cardiovascular Epidemiology (1998); InterASIA, International Collaborative Study of Cardiovascular Disease in Asia; CIMIC, Community Intervention of Metabolic Syndrome in China & Chinese Family Health Study.
Figure 2. Restricted cubic spline curves for the association of fish consumption with total, ischemic, and hemorrhagic strokes in the total, low-risk, and moderate-to-high-risk populations. (A) Strokes in the total population. (B) Ischemic stroke in the total population. (C) Hemorrhagic stroke in the total population. (D) Stroke in the low-risk population. (E) Ischemic stroke in a low-risk population. (F) Hemorrhagic stroke in a low-risk population. (G) Stroke in the moderate-to high-risk population. (H) Ischemic stroke in a moderate-to-high-risk population. (I) Hemorrhagic stroke in a moderate-to high-risk population. The gray histogram represents the distribution of fish consumption (g/week) in the study population; the solid line is the RCS curve, shading indicates the 95% CI of the RCS curve, and dashed line is the reference line with an effect value of 1. Cox proportional hazards model, stratified by cohort and adjusted for sex, per capita household income, educational attainment, alcohol consumption, ideal physical activity, and BMI. RCS, restricted cubic spline; BMI, body mass index; g/wk, g/week; CI, confidence interval.
Table 1. Baseline characteristics of total participants according to quartile categories of fish consumption
Characteristic Total Quartile of fish consumption, g/week P for
trendQ1 (< 25) Q2 (25−) Q3 (100−) Q4 (≥ 250) No. of participants, N (%) 95,800 23,337 (24.4) 20,219 (21.1) 25,310 (26.4) 2,693 (28.1) − Fish Consumption (g/week),
median (IQR)100.0 (25.0, 250.0) 1.9 (0.0, 14.4) 46.7 (35.0, 58.3) 128.3 (105.0, 163.3) 500.0 (300.0, 750.0) − Age (year), mean ± SD 51.4 ± 12.2 52.5 ± 12.7 52.2 ± 11.9 51.2 ± 12.5 50.2 ± 11.6 < 0.001 Male, N (%) 38,720 (40.4) 8,452 (36.2) 8,358 (41.3) 10,424 (41.2) 11,486 (42.6) < 0.001 Northern China, N (%) 47,990 (50.1) 20,624 (88.4) 15,869 (78.5) 7,289 (28.8) 4,208 (15.6) < 0.001 Rural resident, N (%) 86,201 (90.0) 22,864 (98.0) 18,657 (92.3) 22,825 (90.2) 21,855 (81.1) < 0.001 Per−capita household income
(≥ 6,000 CNY/year), N (%)34,644 (36.5) 2,918 (12.7) 5,806 (28.9) 12,521 (49.9) 13,399 (50.3) < 0.001 Highschool or above education,
N (%),13,580 (14.2) 2,066 (8.9) 2,559 (12.7) 3,661 (14.5) 5,294 (19.7) < 0.001 Current smoker, N (%) 21,313 (22.2) 4,472 (19.2) 4,385 (21.7) 5,797 (22.9) 6,659 (24.7) < 0.001 Alcohol drinker, N (%) 17,499 (18.3) 2,010 (8.6) 3,610 (17.9) 5,300 (20.9) 6,579 (24.4) < 0.001 Ideal physical activity*, N (%) 62,662 (65.9) 17,126 (73.4) 13,672 (68.4) 15,163 (60.3) 16,701 (62.9) < 0.001 BMI (kg/m2), mean ± SD 23.8 ± 3.6 24.1 ± 3.7 24.2 ± 3.7 23.5 ± 3.6 23.4 ± 3.5 < 0.001 TC (mg/dL), mean ± SD, 175.1 ± 33.2 175.1 ± 33.8 178.7 ± 33.7 171.8 ± 34.6 175.6 ± 36.2 0.642 LDL−C (mg/dL), mean ± SD 97.1 ± 29.9 97.2 ± 28.6 100.3 ± 29.5 93.81 ± 29.3 97.5 ± 31.3 0.406 SBP (mmHg), mean ± SD 128.6 ± 21.5 129.7 ± 22.4 133.5 ± 22.9 128.0 ± 20.5 124.6 ± 19.5 < 0.001 DBP (mmHg), mean ± SD 79.1 ± 11.7 79.8 ± 11.9 81.5 ± 11.1 78.7 ± 11.5 77.2 ± 11.3 < 0.001 Family history of stroke, N (%) 5,762 (6.0) 2,153 (9.2) 1,015 (5.0) 1,265 (5.0) 1,329 (4.9) < 0.001 Hypertension, N (%) 32,534 (34.0) 8,301 (35.6) 8,525 (42.2) 8,404 (33.2) 7,304 (27.1) < 0.001 Diabetes, N (%) 5,987 (6.2) 1,970 (8.4) 1,336 (6.6) 1,328 (5.2) 1,353 (5.0) < 0.001 Hypercholesterolemia, N (%) 5,731 (6.0) 1,960 (8.4) 1,244 (6.2) 1,044 (4.1) 1,483 (5.5) < 0.001 Ideal diet†, N (%) Fruit and vegetable 43,702 (45.6) 10,403 (44.6) 11,057 (54.7) 9,077 (35.9) 13,165 (48.9) 0.006 Soybean 4,764 (5.0) 807 (3.5) 919 (4.5) 1,175 (4.6) 1,863 (6.9) < 0.001 Red meat 81,985 (85.7) 21,697 (93.1) 17,326 (85.8) 22,541 (89.2) 20,421 (75.9) < 0.001 Tea 29,542 (31.3) 5,640 (24.2) 7,459 (37.0) 8,085 (32.6) 8,358 (31.8) < 0.001 Note. IQR, interquartile range; BMI, body mass index; LDL−C, Low−Density Lipoprotein Cholesterol; TC, total cholesterol; SBP, systolic blood pressure; DBP, diastolic blood pressure; *, Ideal physical activity was defined as ≥ 150 min/week of moderate physical activity or 75 min/week of vigorous physical activity or an equivalent combination; †, Ideal diet was defined as a healthy diet score (attainment criteria for each food group intake: fruits and vegetables ≥ 500 g/d; soybean ≥ 125 g/d; red meat < 75 g/d; tea ≥ 3 times/week were considered as attainment.  下载: 导出CSV
Table 2. Association between quartiles of fish consumption and stroke incidence in total population
Health outcomes Quartile of fish consumption, g/week P for trend Q1 (< 25) Q2 (25–) Q3 (100–) Q4 (≥ 250) Stroke No. of events/No. of participants 988/23,337 654/20,219 544/25,310 587/26,934 − Incidence rate (/100,000 Pys) 669.66 442.75 306.12 260.04 − HR (95% CI), model 1 1.00 [reference] 0.81 (0.73, 0.90) 0.70 (0.62, 0.79) 0.68 (0.60, 0.77) < 0.001 HR (95% CI), model 2 1.00 [reference] 0.78 (0.70, 0.87) 0.69 (0.61, 0.78) 0.68 (0.59, 0.78) < 0.001 HR (95% CI), model 3 1.00 [reference] 0.78 (0.70, 0.88) 0.70 (0.61, 0.79) 0.69 (0.60, 0.79) < 0.001 Ischemic stroke No. of events/No. of participants 620/23,337 428/20,219 346/25,310 351/26,934 − Incidence rate, per 100,000 Pys 418.88 289.21 194.42 155.20 − HR (95% CI), model 1 1.00 [reference] 0.87 (0.76, 0.99) 0.77 (0.66, 0.90) 0.72 (0.60, 0.85) 0.002 HR (95% CI), model 2 1.00 [reference] 0.84 (0.73, 0.96) 0.75 (0.64, 0.88) 0.70 (0.59, 0.83) 0.002 HR (95% CI), model 3 1.00 [reference] 0.84 (0.73, 0.97) 0.76 (0.64, 0.89) 0.70 (0.59, 0.84) 0.003 Hemorrhagic stroke No. of events/No. of participants 285/23,337 189/20,219 163/25,310 176/26,934 − Incidence rate, per 100,000 Pys 191.35 127.01 91.34 77.69 − HR (95% CI), model 1 1.00 [reference] 0.80 (0.66, 0.98) 0.72 (0.58, 0.90) 0.70 (0.55, 0.89) 0.048 HR (95% CI), model 2 1.00 [reference] 0.75 (0.62, 0.92) 0.71 (0.57, 0.90) 0.72 (0.57, 0.93) 0.166 HR (95% CI), model 3 1.00 [reference] 0.77 (0.63, 0.94) 0.72 (0.57, 0.91) 0.74 (0.57, 0.94) 0.193 Note. Model 1, Cox proportional hazard model, stratified by cohort and region, adjusted for age and sex; Model 2, further adjusted for urban or rural residence, per capita household income, educational attainment, current smoking status, alcohol consumption, family history of stroke, hypertension, diabetes, dyslipidemia, ideal physical activity, and BMI; Model 3, Further adjusted for diet score. BMI, body mass index; Pys, person−years; HR, hazard ratio; CI, confidence interval.
下载: 导出CSV
Table 3. Association between quartiles of fish consumption and stroke incidence according to predicted stroke risk stratification
Health outcomes Quartile of fish consumption, g/week P for trend Q1 (< 25) Q2 (25–) Q3 (100–) Q4 (≥ 250) Low−risk Stroke No. of events/No. of participants 108/11,383 109/9,962 101/15,672 165/18,742 − Incidence rate (/100,000 Pys) 140.99 134.46 87.30 98.67 − HR (95% CI), model 1 1.00 [reference] 0.83 (0.62, 1.10) 0.50 (0.38, 0.66) 0.49 (0.38, 0.63) < 0.001 HR (95% CI), model 2 1.00 [reference] 0.93 (0.70, 1.24) 0.61 (0.46, 0.82) 0.64 (0.49, 0.85) 0.005 HR (95% CI), model 3 1.00 [reference] 0.93 (0.70, 1.23) 0.62 (0.46, 0.83) 0.65 (0.49, 0.85) 0.006 Ischemic stroke No. of events/No. of participants 66/11,383 74/9,962 69/15,672 97/18,742 − Incidence rate (/100,000 Pys) 86.80 91.20 59.42 57.95 − HR (95% CI), model 1 1.00 [reference] 0.93 (0.65, 1.32) 0.55 (0.39, 0.78) 0.46 (0.33, 0.64) < 0.001 HR (95% CI), model 2 1.00 [reference] 1.04 (0.73, 1.49) 0.69 (0.48, 1.00) 0.62 (0.43, 0.88) 0.002 HR (95% CI), model 3 1.00 [reference] 1.04 (0.73, 1.49) 0.69 (0.48, 1.00) 0.62 (0.43, 0.88) 0.002 Hemorrhagic stroke No. of events/No. of participants 26/11,383 29/9,962 25/15,672 48/18,742 − Incidence rate (/100,000 Pys) 33.88 35.66 21.50 28.67 − HR (95% CI), model 1 1.00 [reference] 0.86 (0.49, 1.51) 0.52 (0.30, 0.92) 0.61 (0.37, 1.20) 0.123 HR (95% CI), model 2 1.00 [reference] 0.98 (0.56, 1.73) 0.60 (0.33, 1.09) 0.76 (0.44, 1.32) 0.468 HR (95% CI), model 3 1.00 [reference] 0.96 (0.55, 1.70) 0.61 (0.34, 1.11) 0.78 (0.45, 1.34) 0.546 Moderate−to−high−risk Stroke No. of events/No. of participants 880/11,954 545/10,257 443/9,638 422/8,192 − Incidence rate (/100,000 Pys) 1240.5 817.75 718.42 721.16 − HR (95% CI), model 1 1.00 [reference] 0.68 (0.61, 0.76) 0.52 (0.46, 0.58) 0.47 (0.41, 0.53) < 0.001 HR (95% CI), model 2 1.00 [reference] 0.70 (0.63, 0.79) 0.58 (0.51, 0.66) 0.53 (0.47, 0.60) < 0.001 HR (95% CI), model 3 1.00 [reference] 0.71 (0.63, 0.79) 0.58 (0.52, 0.66) 0.53 (0.47, 0.61) < 0.001 Ischemic stroke No. of events/No. of participants 554/11,954 354/10,257 277/9,638 254/8,192 − Incidence rate (/100,000 Pys) 776.52 529.52 447.84 432.24 − HR (95% CI), model 1 1.00 [reference] 0.70 (0.61, 0.81) 0.51 (0.44, 0.59) 0.43 (0.37, 0.50) < 0.001 HR (95% CI), model 2 1.00 [reference] 0.72 (0.63, 0.84) 0.56 (0.48, 0.65) 0.48 (0.40, 0.56) < 0.001 HR (95% CI), model 3 1.00 [reference] 0.73 (0.63, 0.84) 0.56 (0.48, 0.65) 0.48 (0.41, 0.56) < 0.001 Hemorrhagic stroke No. of events/No. of participants 259/11,954 160/10,257 138/9,638 128/8,192 − Incidence rate (/100,000 Pys) 358.69 237.07 221.99 216.60 − HR (95% CI), model 1 1.00 [reference] 0.67 (0.55, 0.82) 0.57 (0.46, 0.70) 0.52 (0.42, 0.65) < 0.001 HR (95% CI), model 2 1.00 [reference] 0.69 (0.56, 0.85) 0.63 (0.51, 0.79) 0.59 (0.47, 0.75) < 0.001 HR (95% CI), model 3 1.00 [reference] 0.70 (0.57, 0.87) 0.64 (0.51, 0.80) 0.60 (0.48, 0.76) 0.001 Note. Cox proportional hazard model, stratified by cohort, Model 1, adjusted for age and sex; Model 2, adjusted for sex, per capita household income, educational attainment, alcohol consumption, ideal physical activity, and BMI; Model 3, adjusted for sex, per capita household income, educational attainment, alcohol consumption, ideal physical activity, and BMI, and diet score. BMI, body mass index; Pys, person−years; HR, hazard ratio; CI, confidence interval.
下载: 导出CSV
Table 4. Additive interaction between fish consumption and predicted stroke risk stratification on stroke incidence*
VariablesStroke Ischemic stroke Hemorrhagic stroke RERI (95% CI) 4.08 (2.80, 5.36) 5.30 (3.40, 7.21) 3.53 (1.20, 5.86) P value < 0.001 < 0.001 0.003 AP (95% CI) 0.36 (0.28, 0.43) 0.41 (0.32, 0.50) 0.31 (0.15, 0.47) P value < 0.001 < 0.001 < 0.001 SI (95% CI) 1.64 (1.42, 1.89) 1.80 (1.50, 2.15) 1.52 (1.17, 1.97) P value < 0.001 < 0.001 0.002 Note. *The reference level was participants with the highest quartile of fish consumption and low−risk, and the highest level was participants with the lowest quartile of fish consumption and moderate−to−high−risk. Cox proportional hazards model, stratified by cohort and adjusted for sex, per capita household income, educational attainment, alcohol consumption, ideal physical activity, and BMI. BMI, body mass index; RERI, relative excess risk due to interaction; AP, attributable proportion due to interaction; SI, synergy index. The null hypotheses for each interaction were RERI = 0, AP = 0, SI = 1 and CI = confidence interval.
下载: 导出CSV
S2. Sensitivity analyses for the associations between quartile of fish consumption and stroke incidence
HR (95% CI) Quartile of fish consumption, g/week P for trend Q1 Q2 Q3 Q4 Excluding stroke identified during the first years of follow-up Total population Stroke 1.00 [reference] 0.78 (0.70, 0.88) 0.71 (0.62, 0.81) 0.69 (0.60, 0.79) 0.001 Ischemic stroke 1.00 [reference] 0.85 (0.74, 0.98) 0.79 (0.67, 0.93) 0.73 (0.61, 0.87) 0.009 Hemorrhagic stroke 1.00 [reference] 0.77 (0.63, 0.95) 0.73 (0.57, 0.92) 0.70 (0.54, 0.91) 0.079 Low−risk* Stroke 1.00 [reference] 0.92 (0.69, 1.24) 0.63 (0.47, 0.85) 0.65 (0.49, 0.86) 0.007 Ischemic stroke 1.00 [reference] 1.03 (0.71, 1.48) 0.71 (0.49, 1.02) 0.62 (0.44, 0.89) 0.003 Hemorrhagic stroke 1.00 [reference] 0.95 (0.53, 1.72) 0.62 (0.34, 1.15) 0.77 (0.44, 1.35) 0.522 Moderate−to−High−risk* Stroke 1.00 [reference] 0.71 (0.63, 0.80) 0.61 (0.54, 0.69) 0.55 (0.48, 0.63) < 0.001 Ischemic stroke 1.00 [reference] 0.74 (0.63, 0.85) 0.59 (0.51, 0.70) 0.51 (0.43, 0.60) < 0.001 Hemorrhagic stroke 1.00 [reference] 0.70 (0.57, 0.87) 0.66 (0.52, 0.82) 0.58 (0.46, 0.74) 0.001 Model 3 Replacing a single ideal diet with diet score† Total population Stroke 1.00 [reference] 0.80 (0.71, 0.89) 0.71 (0.63, 0.81) 0.71 (0.62, 0.81) 0.002 Ischemic stroke 1.00 [reference] 0.86 (0.75, 0.99) 0.79 (0.67, 0.92) 0.74 (0.62, 0.88) 0.010 Hemorrhagic stroke 1.00 [reference] 0.78 (0.63, 0.95) 0.74 (0.58, 0.93) 0.76 (0.59, 0.98) 0.276 Low−risk* Stroke 1.00 [reference] 0.94 (0.71, 1.26) 0.64 (0.48, 0.87) 0.68 (0.51, 0.90) 0.013 Ischemic stroke 1.00 [reference] 1.05 (0.73, 1.51) 0.72 (0.50, 1.04) 0.64 (0.45, 0.92) 0.005 Hemorrhagic stroke 1.00 [reference] 1.06 (0.60, 1.89) 0.68 (0.37, 1.25) 0.85 (0.48, 1.49) 0.628 Moderate−to−High−risk* Stroke 1.00 [reference] 0.71 (0.64, 0.80) 0.58 (0.51, 0.66) 0.53 (0.47, 0.61) < 0.001 Ischemic stroke 1.00 [reference] 0.73 (0.63, 0.85) 0.56 (0.48, 0.66) 0.48 (0.41, 0.57) < 0.001 Hemorrhagic stroke 1.00 [reference] 0.70 (0.57, 0.87) 0.64 (0.51, 0.79) 0.60 (0.48, 0.76) 0.001 Using Fine & Gary sub−distribution hazard models Total population Stroke 1.00 [reference] 0.78 (0.70, 0.87) 0.69 (0.61, 0.79) 0.70 (0.61, 0.80) 0.001 Ischemic stroke 1.00 [reference] 0.84 (0.73, 0.96) 0.75 (0.64, 0.89) 0.72 (0.60, 0.86) 0.008 Hemorrhagic stroke 1.00 [reference] 0.76 (0.62, 0.93) 0.72 (0.57, 0.91) 0.74 (0.58, 0.95) 0.226 Low−risk* Stroke 1.00 [reference] 0.93 (0.70, 1.24) 0.61 (0.46, 0.82) 0.64 (0.49, 0.84) 0.005 Ischemic stroke 1.00 [reference] 1.04 (0.73, 1.48) 0.70 (0.49, 1.00) 0.62 (0.44, 0.87) 0.002 Hemorrhagic stroke 1.00 [reference] 0.98 (0.55, 1.77) 0.60 (0.33, 1.10) 0.76 (0.44, 1.32) 0.477 Moderate−to−High−risk* Stroke 1.00 [reference] 0.71 (0.63, 0.80) 0.59 (0.52, 0.67) 0.55 (0.49, 0.62) < 0.001 Ischemic stroke 1.00 [reference] 0.74 (0.64, 0.85) 0.58 (0.49, 0.67) 0.50 (0.43, 0.59) < 0.001 Hemorrhagic stroke 1.00 [reference] 0.70 (0.57, 0.86) 0.65 (0.52, 0.81) 0.61 (0.48, 0.77) 0.002 Pooling results of three cohort meta−analyses Total population Stroke 1.00 [reference] 0.81 (0.72, 0.91) 0.72 (0.64, 0.82) 0.73 (0.64, 0.83) − Ischemic stroke 1.00 [reference] 0.86 (0.74, 0.99) 0.78 (0.66, 0.91) 0.74 (0.62, 0.87) − Hemorrhagic stroke 1.00 [reference] 0.79 (0.64, 0.97) 0.76 (0.60, 0.96) 0.78 (0.61, 1.00) − Low−risk* Stroke 1.00 [reference] 1.01 (0.72, 1.40) 0.74 (0.54, 1.01) 0.80 (0.59, 1.08) − Ischemic stroke 1.00 [reference] 1.09 (0.71, 1.69) 0.88 (0.60, 1.29) 0.84 (0.57, 1.23) − Hemorrhagic stroke 1.00 [reference] 1.16 (0.62, 2.20) 0.61 (0.33, 1.13) 0.73 (0.41, 1.32) − Moderate−to−High−risk* Stroke 1.00 [reference] 0.76 (0.68, 0.86) 0.70 (0.61, 0.80) 0.66 (0.57, 0.76) − Ischemic stroke 1.00 [reference] 0.80 (0.69, 0.93) 0.72 (0.60, 0.86) 0.66 (0.55, 0.80) − Hemorrhagic stroke 1.00 [reference] 0.75 (0.61, 0.93) 0.80 (0.63, 1.03) 0.76 (0.58, 1.00) − Adopting the Cox regression model with time−varying variables to include fish consumption updated in each survey before endpoints Total population Stroke 1.00 [reference] 0.74 (0.66, 0.84) 0.69 (0.61, 0.79) 0.65 (0.57, 0.76) < 0.001 Ischemic stroke 1.00 [reference] 0.83 (0.72, 0.96) 0.77 (0.65, 0.91) 0.67 (0.55, 0.80) < 0.001 Hemorrhagic stroke 1.00 [reference] 0.67 (0.54, 0.83) 0.71 (0.56, 0.91) 0.75 (0.58, 0.98) 0.041 Low−risk* Stroke 1.00 [reference] 0.79 (0.56, 1.12) 0.61 (0.42, 0.89) 0.66 (0.45, 0.96) 0.313 Ischemic stroke 1.00 [reference] 0.89 (0.58, 1.37) 0.80 (0.50, 1.28) 0.77 (0.48, 1.24) 0.503 Hemorrhagic stroke 1.00 [reference] 0.72 (0.37, 1.42) 0.44 (0.21, 0.95) 0.57 (0.27, 1.18) 0.972 Moderate-to-High-risk* Stroke 1.00 [reference] 0.71 (0.62, 0.80) 0.67 (0.58, 0.77) 0.58 (0.50, 0.68) < 0.001 Ischemic stroke 1.00 [reference] 0.77 (0.67, 0.90) 0.72 (0.60, 0.86) 0.58 (0.48, 0.72) < 0.001 Hemorrhagic stroke 1.00 [reference] 0.64 (0.51, 0.81) 0.73 (0.56, 0.94) 0.70 (0.53, 0.93) 0.126 Note. Cox proportional hazards model, stratified by cohort and region, adjusted for age, sex, urban or rural residence, per capita household income, educational attainment, current smoking status, alcohol consumption, family history of stroke, hypertension, diabetes, dyslipidemia, ideal physical activity, and BMI. *: The model in risk stratification: stratified by cohort, adjusted for sex, per capita household income, educational attainment, alcohol consumption, ideal physical activity, and BMI. †: Substitution of diet score for single ideal diet (ideal fruit and vegetables ≥ 500 g/d; ideal soybean ≥ 125 g/d; ideal red meat < 75 g/d; ideal tea ≥ 3 times/week). HR, hazard ratio; CI, confidence interval. ‡: Stratified by cohort and region, adjusted for age, sex, urban or rural residence, per capita household income, educational attainment, current smoking status, alcohol consumption, family history of stroke, hypertension, diabetes, dyslipidemia, ideal physical activity, BMI, and diet score.
下载: 导出CSV
-
[1] Roth GA, Mensah GA, Johnson CO, et al. Global burden of cardiovascular diseases and risk factors, 1990-2019: update from the GBD 2019 study. J Am Coll Cardiol, 2020; 76, 2982−3021. doi: 10.1016/j.jacc.2020.11.010 [2] GBD 2019 Stroke Collaborators. Global, regional, and national burden of stroke and its risk factors, 1990-2019: a systematic analysis for the Global Burden of Disease Study 2019. Lancet Neurol, 2021; 20, 795−820. doi: 10.1016/S1474-4422(21)00252-0 [3] Ma QF, Li R, Wang LJ, et al. Temporal trend and attributable risk factors of stroke burden in China, 1990-2019: an analysis for the Global Burden of Disease Study 2019. Lancet Public Health, 2021; 6, e897−906. doi: 10.1016/S2468-2667(21)00228-0 [4] Tu WJ, Wang LD, Special Writing Group of China Stroke Surveillance Report. China stroke surveillance report 2021. Mil Med Res, 2023; 10, 33. [5] Gil A, Gil F. Fish, a Mediterranean source of n-3 PUFA: benefits do not justify limiting consumption. Br J Nutr, 2015; 113 Suppl 2: S58-67. [6] Petsini F, Fragopoulou E, Antonopoulou S. Fish consumption and cardiovascular disease related biomarkers: a review of clinical trials. Crit Rev Food Sci Nutr, 2019; 59, 2061−71. doi: 10.1080/10408398.2018.1437388 [7] Estruch R, Ros E, Salas-Salvadó J, et al. Primary prevention of cardiovascular disease with a mediterranean diet supplemented with extra-virgin olive oil or nuts. N Engl J Med, 2018; 378, e34. [8] Visseren FLJ, Mach F, Smulders YM, et al. 2021 ESC Guidelines on cardiovascular disease prevention in clinical practice. Eur Heart J, 2021; 42, 3227−337. doi: 10.1093/eurheartj/ehab484 [9] Jayedi A, Shab-Bidar S. Fish consumption and the risk of chronic disease: an umbrella review of meta-analyses of prospective cohort studies. Adv Nutr, 2020; 11, 1123−33. doi: 10.1093/advances/nmaa029 [10] Aung T, Halsey J, Kromhout D, et al. Associations of omega-3 fatty acid supplement use with cardiovascular disease risks: meta-analysis of 10 trials involving 77917 individuals. JAMA Cardiol, 2018; 3, 225−34. doi: 10.1001/jamacardio.2017.5205 [11] Krittanawong C, Isath A, Hahn J, et al. Fish consumption and cardiovascular health: a systematic review. Am J Med, 2021; 134, 713−20. doi: 10.1016/j.amjmed.2020.12.017 [12] Guo N, Zhu Y, Tian DD, et al. Role of diet in stroke incidence: an umbrella review of meta-analyses of prospective observational studies. BMC Med, 2022; 20, 194. doi: 10.1186/s12916-022-02381-6 [13] Cui SH, Yi KQ, Wu YL, et al. Fish consumption and risk of stroke in Chinese adults: a prospective cohort study in Shanghai, China. Nutrients, 2022; 14, 4239. doi: 10.3390/nu14204239 [14] Jayedi A, Soltani S, Abdolshahi A, et al. Fish consumption and the risk of cardiovascular disease and mortality in patients with type 2 diabetes: a dose-response meta-analysis of prospective cohort studies. Crit Rev Food Sci Nutr, 2021; 61, 1640−50. doi: 10.1080/10408398.2020.1764486 [15] Mohan D, Mente A, Dehghan M, et al. Associations of fish consumption with risk of cardiovascular disease and mortality among individuals with or without vascular disease from 58 countries. JAMA Intern Med, 2021; 181, 631−49. doi: 10.1001/jamainternmed.2021.0036 [16] Tørris C, Småstuen MC, Molin M. Nutrients in fish and possible associations with cardiovascular disease risk factors in metabolic syndrome. Nutrients, 2018; 10, 952. doi: 10.3390/nu10070952 [17] Li ZH, Zhong WF, Liu SM, et al. Associations of habitual fish oil supplementation with cardiovascular outcomes and all cause mortality: evidence from a large population based cohort study. BMJ, 2020; 368, m456. [18] Petermann-Rocha F, Parra-Soto S, Gray S, et al. Vegetarians, fish, poultry, and meat-eaters: who has higher risk of cardiovascular disease incidence and mortality? A prospective study from UK Biobank. Eur Heart J, 2021; 42, 1136−43. doi: 10.1093/eurheartj/ehaa939 [19] Xing XL, Yang XL, Liu FC, et al. Predicting 10-year and lifetime stroke risk in Chinese population. Stroke, 2019; 50, 2371−8. doi: 10.1161/STROKEAHA.119.025553 [20] Huang KY, Liang FC, Yang XL, et al. Long term exposure to ambient fine particulate matter and incidence of stroke: prospective cohort study from the China-PAR project. BMJ, 2019; 367, l6720. [21] Yang XL, Li JX, Hu DS, et al. Predicting the 10-year risks of atherosclerotic cardiovascular disease in Chinese population: the China-PAR project (prediction for ASCVD risk in China). Circulation, 2016; 134, 1430−40. doi: 10.1161/CIRCULATIONAHA.116.022367 [22] Zhao WH, Huang ZP, Zhang X, et al. Reproducibility and validity of a Chinese food frequency questionnaire. Biomed Environ Sci, 2010; 23, 1−38. [23] Hu CY, Huang CY, Li JX, et al. Causal associations of alcohol consumption with cardiovascular diseases and all-cause mortality among Chinese males. Am J Clin Nutr, 2022; 116, 771−9. doi: 10.1093/ajcn/nqac159 [24] Piercy KL, Troiano RP, Ballard RM, et al. The physical activity guidelines for Americans. JAMA, 2018; 320, 2020−8. doi: 10.1001/jama.2018.14854 [25] Perloff D, Grim C, Flack J, et al. Human blood pressure determination by sphygmomanometry. Circulation, 1993; 88, 2460−70. doi: 10.1161/01.CIR.88.5.2460 [26] Wang SS, Lay S, Yu HN, et al. Dietary guidelines for Chinese residents (2016), comments and comparisons. J Zhejiang Univ Sci B, 2016; 17, 649−56. doi: 10.1631/jzus.B1600341 [27] Han C, Liu FC, Yang XL, et al. Ideal cardiovascular health and incidence of atherosclerotic cardiovascular disease among Chinese adults: the China-PAR project. Sci China Life Sci, 2018; 61, 504−14. doi: 10.1007/s11427-018-9281-6 [28] Wang XY, Liu FC, Li JX, et al. Tea consumption and the risk of atherosclerotic cardiovascular disease and all-cause mortality: the China-PAR project. Eur J Prev Cardiol, 2020; 27, 1956−63. doi: 10.1177/2047487319894685 [29] Zhong VW, Van Horn L, Greenland P, et al. Associations of processed meat, unprocessed red meat, poultry, or fish intake with incident cardiovascular disease and all-cause mortality. JAMA Intern Med, 2020; 180, 503−12. doi: 10.1001/jamainternmed.2019.6969 [30] Knol MJ, VanderWeele TJ. Recommendations for presenting analyses of effect modification and interaction. Int J Epidemiol, 2012; 41, 514−20. doi: 10.1093/ije/dyr218 [31] Ribeiro AI, Fraga S, Severo M, et al. Association of neighbourhood disadvantage and individual socioeconomic position with all-cause mortality: a longitudinal multicohort analysis. Lancet Public Health, 2022; 7, e447−57. doi: 10.1016/S2468-2667(22)00036-6 [32] VanderWeele TJ, Knol MJ. A Tutorial on Interaction. Epidemiologic Methods, 2014; 3, 33−72. [33] Austin PC, Fine JP. Practical recommendations for reporting Fine-Gray model analyses for competing risk data. Stat Med, 2017; 36, 4391−400. doi: 10.1002/sim.7501 [34] Larsson SC, Orsini N. Fish consumption and the risk of stroke: a dose-response meta-analysis. Stroke, 2011; 42, 3621−3. doi: 10.1161/STROKEAHA.111.630319 [35] Xun P, Qin B, Song Y, et al. Fish consumption and risk of stroke and its subtypes: accumulative evidence from a meta-analysis of prospective cohort studies. Eur J Clin Nutr, 2012; 66, 1199−207. doi: 10.1038/ejcn.2012.133 [36] Park GH, Cho JH, Lee D, et al. Association between seafood intake and cardiovascular disease in South Korean Adults: a community-based prospective cohort study. Nutrients, 2022; 14, 4864. doi: 10.3390/nu14224864 [37] Umesawa M, Yamagishi K, Iso H. Intake of fish and long-chain n-3 polyunsaturated fatty acids and risk of diseases in a Japanese population: a narrative review. Eur J Clin Nutr, 2021; 75, 902−20. doi: 10.1038/s41430-020-00751-y [38] Zhao W, Tang H, Yang XD, et al. Fish consumption and stroke risk: a meta-analysis of prospective cohort studies. J Stroke Cerebrovasc Dis, 2019; 28, 604−11. doi: 10.1016/j.jstrokecerebrovasdis.2018.10.036 [39] Thorsdottir I, Tomasson H, Gunnarsdottir I, et al. Randomized trial of weight-loss-diets for young adults varying in fish and fish oil content. Int J Obes, 2007; 31, 1560−6. doi: 10.1038/sj.ijo.0803643 [40] Ramel A, Jonsdottir MT, Thorsdottir I. Consumption of cod and weight loss in young overweight and obese adults on an energy reduced diet for 8-weeks. Nutr Metab Cardiovasc Dis, 2009; 19, 690−6. doi: 10.1016/j.numecd.2008.12.013 [41] Djuricic I, Calder PC. Pros and cons of long-chain omega-3 polyunsaturated fatty acids in cardiovascular health. Annu Rev Pharmacol Toxicol, 2023; 63, 383−406. doi: 10.1146/annurev-pharmtox-051921-090208 [42] Mendivil CO. Fish consumption: a review of its effects on metabolic and hormonal health. Nutr Metab Insights, 2021; 14: 11786388211022378. -

 点击查看大图
计量
- 文章访问数: 8694
- HTML全文浏览量: 4244
- PDF下载量: 87
- 被引次数: 0

 Quick Links