

 下载:
下载:

-
Intensive-care-unit–acquired weakness (ICU-AW) is a severe neuromuscular complication of sepsis and comprises three subtypes: critical illness polyneuropathy (CIP), critical illness myopathy (CIM), and critical illness neuromyopathy (CINM). It presents as symmetrical respiratory and limb muscle weakness, with an incidence of over 67% in patients mechanically ventilated for more than 10 days, and it can be assessed using techniques such as muscle ultrasonography and electrophysiological evaluation[1-3]. Treating ICU-AW requires extended periods of mechanical ventilation and intensive care unit (ICU) stay because such weakness causes long-term functional disability, increased risk of post-intensive care syndrome, long-term functional impairment, and reduced quality of life among survivors[4,5].
The pathogenesis involves interactions between systemic inflammation, metabolic disorders, and treatment-related factors, including high-dose antibiotic neurotoxicity, corticosteroid-related muscle breakdown, ventilation-induced disuse atrophy, and continuous renal replacement therapy (CRRT)-associated metabolic disturbances, which considerably complicate ICU-AW prevention and management[6-10]. Current risk assessment methods are inadequate, and most prediction models lack interpretability, which limits their clinical utility.
Machine learning and explainable artificial intelligence (e.g., Shapley additive extensions (SHAP)) help resolve the “black-box” issue of traditional models[9]. However, previous studies were focused on the general ICU population or required complex data, lacking a tailored feasible model for sepsis[11–14].
Using the MIMIC-IV v3.1 database and an institutional cohort, we integrated baseline and early treatment data, selected predictors via least absolute shrinkage and selection operator (LASSO) regression and the Boruta algorithm, and developed and validated multiple machine-learning models. We aimed to construct an accurate, practical, and interpretable ICU-AW prediction tool to identify high-risk sepsis patients early and optimize therapeutic strategies.
-
This study was designed as a retrospective cohort study. Training and internal validation datasets were derived from the Medical Information Market for Intensive Care (MIMIC-IV v3.1) database, jointly developed by the Massachusetts Institute of Technology and Beth Israel Deaconess Medical Center. The MIMIC-IV database contains comprehensive clinical data of patients admitted to the ICU at the Beth Israel Deaconess Medical Center in Boston between 2008 and 2019; these data include demographic characteristics, vital signs, laboratory measurements, therapeutic interventions, diagnoses, and clinical outcomes. The database has undergone rigorous data validation and has been widely used in clinical research in critical care medicine. The external validation cohort consisted of ICU patients admitted to the Beijing Hospital of Traditional Chinese Medicine, Capital Medical University, between February 26, 2025 and March 15, 2026.
This study was approved by the Institutional Review Board of the Massachusetts Institute of Technology (approval number: PRO13183446). The requirement for informed consent was waived owing to the use of de-identified data. Ethical approval for the external validation cohort was obtained from the Ethics Committee of the Beijing Hospital of Traditional Chinese Medicine, Capital Medical University (approval number: 2025BL02-017-01).
-
The following inclusion criteria were applied: (1) age ≥ 18 years; (2) diagnosis of sepsis according to the Sepsis-3 criteria; (3) ICU length of stay ≥ 72 h, with complete data on initial clinical variables and early treatment information, and a confirmed diagnosis of ICU-AW during hospitalization; (4) complete clinical data without missing values.
-
The following exclusion criteria were employed: (1) pre-existing neuromuscular disorders prior to ICU admission, such as myasthenia gravis, Guillain–Barré syndrome, or pre-existing muscle dysfunction; (2) central nervous system conditions that could affect muscle strength assessment, including cerebral infarction, intracerebral hemorrhage, traumatic brain injury, intracranial hemorrhage, spinal cord injury, spinal cord concussion, or spinal cord compression; and (3) repeated ICU admissions.
-
The primary outcome of this study was the occurrence of ICU-AW in patients with sepsis during ICU hospitalization. In the MIMIC database, ICU-AW (including CIP, CIM, and CINM) was identified using International Classification of Diseases (ICD) codes (35981, 35782, G6281, and G7281). In the external cohort, ICU-AW was diagnosed using the Medical Research Council (MRC) muscle strength score, with a score of ≤ 48 indicating ICU-AW.
-
Based on the study design, 23 categorical and continuous variables were extracted.Categorical variables included the sex and treatment-related indicators within the first 48 h after ICU admission, namely, the use of CRRT, mechanical ventilation, corticosteroids, and antibiotics.Continuous variables included the age, albumin level, white blood cell count, creatinine level, potassium level, sodium level, blood urea nitrogen level, glucose level, heart rate, mean arterial pressure, respiratory rate, oxygen saturation (SpO2), body temperature, platelet count, lactate level, sequential organ failure assessment (SOFA) score, Charlson comorbidity index, and acute physiology and chronic health evaluation II (APACHE II) score.
-
To improve the model generalizability while ensuring the clinical interpretability of the selected features, a combined feature selection strategy integrating LASSO regression and the Boruta algorithm was applied.
LASSO regression with L1 regularization was used to reduce regression coefficients, drive redundant features toward zero, and retain potentially relevant predictors. Subsequently, the Boruta algorithm was employed to further refine the feature selection. Features labeled as “Confirmed” were retained for model development, while those classified as “Rejected” were excluded.
-
The preprocessed MIMIC dataset was randomly divided into training and test sets at a ratio of 7:3. Based on the study objectives and current practices in predictive modeling in critical care, seven machine-learning algorithms were developed: LightGBM, XGBoost, logistic regression, Naïve Bayes, random forest, CatBoost, and support vector machine (SVM).
All the models underwent hyperparameter optimization using a grid search combined with five-fold cross-validation. During the validation process, the area under the receiver operating characteristic curve (AUC) was used as the primary metric for parameter selection to ensure optimal model performance while reducing the risk of overfitting.
Given the low incidence of ICU-AW in this study (5.28%), class imbalance was addressed using the synthetic minority over-sampling technique for nominal and continuous variables (SMOTENC) in the training set. Synthetic samples of the minority class (ICU-AW) were generated to achieve an approximate ratio of 1:2 between the ICU-AW and non-ICU-AW cases, thereby improving the model’s ability to identify minority-class instances.
An independent external validation cohort consisting of 119 patients with sepsis from an institutional dataset was used to evaluate the generalizability of the seven optimized models.
-
The model performance was comprehensively evaluated from three perspectives: discrimination, calibration, and clinical utility.
The discriminative ability was assessed using the area under the receiver operating characteristic curve (AUC), accuracy, sensitivity, specificity, and F1 score. The AUC values ranged from 0 to 1, with higher values indicating better discrimination. Sensitivity reflects the ability of the model to correctly identify patients with ICU-AW (true positives), whereas specificity reflects its ability to correctly identify patients without ICU-AW (true negatives). Calibration performance was evaluated using calibration curves, which compare predicted probabilities with observed outcomes to assess the agreement between predicted and actual risks. Clinical usefulness was assessed using decision curve analysis (DCA), which quantifies the net benefit of the model across a range of threshold probabilities. The net benefit of the model was compared with that of two extreme strategies: treating all patients and treating no patients. A model was considered clinically useful when its net benefit exceeded those of both strategies across the relevant threshold ranges.
-
To enhance the model transparency and interpretability, SHAP were applied to the best-performing random forest model. SHAP is a unified framework based on the cooperative game theory that quantifies the contribution of each feature to individual predictions.
-
All data processing, model development, and statistical analyses were performed using the Decision Linnc analytical platform (Decision Linnc Core Team, 2023), a comprehensive environment that integrates multiple programming frameworks for data processing and analysis (Hang Zhou, China; available at: https://www.statsape.com/). Continuous variables are expressed as mean ± standard deviation (SD) for normally distributed data or median with interquartile range (IQR) [M (Q1, Q3)] for non-normally distributed data. Group comparisons were conducted using the Student’s t-test or the Wilcoxon rank-sum test, as appropriate. Categorical variables were presented as frequencies and percentages [n (%)], and comparisons between groups were performed using the chi-square (χ2) test. All statistical tests were two-sided, and a P value < 0.05 was considered statistically significant.
-
This study utilized MIMIC-IV v3.1 database and adopted a retrospective cohort design to identify eligible patients. A total of 3,842 adult patients (Table 1) with sepsis who met the Sepsis-3 criteria were included after applying the predefined inclusion and exclusion criteria. Among these patients, 203 (5.28%) were diagnosed with CIM/CIP during ICU hospitalization, while the remaining 3,639 (94.72%) did not develop ICU-AW.
Table 1. Baseline Characteristics of the Study Population Stratified as per Outcome (MIMIC Cohort)
Variable Levels N Overall Sepsis ICU-AW P-value N = 3,842 N = 3,639 N = 203 Age 3,842 66.17 (15.39) 66.40 (15.41) 62.10 (14.60) < 0.001 SOFA score 3,842 8.50 (3.81) 8.52 (3.81) 8.00 (3.74) 0.057 Charlson comorbidity index 3,842 5.86 (3.05) 5.91 (3.06) 4.87 (2.78) < 0.001 Albumin 3,842 2.71 (0.63) 2.71 (0.63) 2.74 (0.65) 0.485 White blood cells 3,842 15.41 (12.99) 15.41 (12.76) 15.47 (16.60) 0.959 Creatinine 3,842 2.08 (1.88) 2.09 (1.88) 1.87 (1.84) 0.098 Potassium 3,842 4.26 (0.84) 4.26 (0.84) 4.32 (0.87) 0.35 Sodium 3,842 137.67 (6.62) 137.63 (6.65) 138.30 (6.01) 0.128 Urea nitrogen 3,842 39.06 (29.41) 39.24 (29.46) 35.82 (28.37) 0.097 Glucose 3,842 8.78 (5.28) 8.75 (5.18) 9.46 (6.84) 0.147 HR 3,842 97.92 (21.94) 97.90 (21.85) 98.20 (23.56) 0.861 NBPM 3,842 78.44 (19.54) 78.11 (19.50) 84.23 (19.46) < 0.001 RR 3,842 21.74 (6.94) 21.71 (6.92) 22.35 (7.37) 0.225 SpO2 3,842 95.94 (4.82) 95.96 (4.84) 95.65 (4.50) 0.337 Temperature 3,842 36.89 (0.89) 36.88 (0.90) 37.09 (0.73) < 0.001 Platelet 3,842 205.12 (132.09) 204.75 (132.92) 211.83 (116.41) 0.404 Lactate 3,842 2.77 (2.39) 2.79 (2.39) 2.50 (2.22) 0.07 APACHE Ⅱ 3,842 23.68 (7.33) 23.71 (7.28) 23.07 (8.17) 0.278 Sex 3,842 0.726 0 1,639.00 (42.66%) 1,550.00 (42.59%) 89.00 (43.84%) 1 2,203.00 (57.34%) 2,089.00 (57.41%) 114.00 (56.16%) CRRT 3,842 0.4 0 3,419.00 (88.99%) 3,242.00 (89.09%) 177.00 (87.19%) 1 423.00 (11.01%) 397.00 (10.91%) 26.00 (12.81%) Ventilation 3,842 < 0.001 0 1,584.00 (41.23%) 1,469.00 (40.37%) 115.00 (56.65%) 1 2,258.00 (58.77%) 2,170.00 (59.63%) 88.00 (43.35%) Antibiotics 3,842 < 0.001 0 3,607.00 (93.88%) 3,496.00 (96.07%) 111.00 (54.68%) 1 235.00 (6.12%) 143.00 (3.93%) 92.00 (45.32%) Glucocorticoids 3,842 0.503 0 3,308.00 (86.10%) 3,130.00 (86.01%) 178.00 (87.68%) 1 534.00 (13.90%) 509.00 (13.99%) 25.00 (12.32%) Note. For categorical variables, a score of 0 indicates non-use/non-administration of the intervention and 1 indicates use/administration of the intervention (sex: 0 = female, 1 = male; CRRT/Ventilation/Antibiotics/Glucocorticoids: 0 = not used, 1 = used). ICU-AW = intensive-care-unit-acquired weakness; CRRT = continuous renal replacement therapy; HR = heart rate; NBPM = mean arterial pressure; RR = respiratory rate; SpO2 = oxygen saturation; SOFA = sequential organ failure assessment; APACHE II = acute physiology and chronic health evaluation II. The external validation cohort consisted of 119 patients with sepsis admitted to Beijing Hospital of Traditional Chinese Medicine, Capital Medical University, between February 26, 2025, and March 15, 2026. Among them, 60 (50.42%) were diagnosed with ICU-AW and 59 (49.58%) did not develop ICU-AW.
-
In the MIMIC cohort, significant differences between the ICU-AW and non-ICU-AW groups were observed in terms of age, Charlson comorbidity index, mean arterial pressure, and body temperature (all P < 0.001). Patients in the ICU-AW group were younger (62.10 ± 14.60 vs. 66.40 ± 15.41) and had lower Charlson comorbidity index scores (4.87 ± 2.78 vs. 5.91 ± 3.06) compared with those without ICU-AW, whereas mean arterial pressure and body temperature were significantly higher in the ICU-AW group.
Among the laboratory and physiological variables, creatinine (P = 0.098), blood urea nitrogen (P = 0.097), and lactate (P = 0.070) levels did not reach statistical significance but showed trends toward potential differences. No significant differences were observed in the albumin level, white blood cell count, potassium level, sodium level, glucose level, heart rate, respiratory rate, oxygen saturation (SpO2), platelet count, or APACHE II score between the two groups (all P > 0.05).
In terms of severity scores, the difference in SOFA scores between the two groups approached statistical significance (P = 0.057), suggesting a potential association without a clear separation between groups.
In the external validation cohort (n = 119), significant differences between the ICU-AW and non-ICU-AW groups were observed in terms of glucose levels, SOFA scores, and Charlson comorbidity indices. Notably, the glucose level and SOFA score showed highly significant differences (both P < 0.001), with higher values in the ICU-AW group (glucose level: 9.46 ± 1.33 vs. 8.33 ± 1.23; SOFA score: 8.93 ± 2.12 vs. 7.12 ± 1.90; Charlson comorbidity index: 8.13 ± 2.08 vs. 7.15 ± 2.21). By contrast, the age did not differ significantly between the two groups (P = 0.212).
-
In the MIMIC cohort, the overall sex distribution was 2,203 males (57.34%) and 1,639 females (42.66%). No significant difference existed in the sex distribution between the ICU-AW and non-ICU-AW groups (P = 0.726).
In terms of treatment-related variables within the first 48 h after ICU admission, the use of continuous renal replacement therapy (CRRT) and corticosteroids did not differ significantly between the two groups (P = 0.400 and P = 0.503). In the ICU-AW group, the utilization rates of CRRT and corticosteroids were 12.81% and 12.32%, respectively, compared with 10.91% and 13.99%, respectively, in the non-ICU-AW group.
By contrast, significant differences were observed in mechanical ventilation and antibiotic use between the groups (both P < 0.001). The proportion of patients receiving mechanical ventilation was lower in the ICU-AW group than in the non-ICU-AW group (43.35% vs. 59.63%, respectively), whereas antibiotic use within the first 48 h was markedly higher in the ICU-AW group (45.32% vs. 3.93%, respectively).
In the external validation cohort (Table 2) (n = 119), no statistically significant difference was observed in CRRT use between the groups (P = 0.098), although a trend toward higher use was noted in the ICU-AW group (8.33% vs. 1.69%). The overall CRRT utilization rate in this cohort was 5.04%.
Table 2. Baseline Characteristics of the Study Population as per Outcome Group (Hospital Database)
Variable Levels N Overall Sepsis ICU-AW P-value N = 119 N = 59 N = 60 Age, mean 119 77.64 (10.93) 76.37 (11.81) 78.88 (9.92) 0.212 Glucose 119 8.89 (1.39) 8.33 (1.23) 9.46 (1.33) < 0.001 SOFA score 119 8.03 (2.21) 7.12 (1.90) 8.93 (2.12) < 0.001 Charlson 119 7.65 (2.19) 7.15 (2.21) 8.13 (2.08) 0.014 CRRT 119 0.098 0 113.00 (94.96%) 58.00 (98.31%) 55.00 (91.67%) 1 6.00 (5.04%) 1.00 (1.69%) 5.00 (8.33%) Ventilation 119 < 0.001 0 40.00 (33.61%) 36.00 (61.02%) 4.00 (6.67%) 1 79.00 (66.39%) 23.00 (38.98%) 56.00 (93.33%) Antibiotics 119 < 0.001 0 38.00 (31.93%) 38.00 (64.41%) 0.00 (0.00%) 1 81.00 (68.07%) 21.00 (35.59%) 60.00 (100.00%) Note. Codes for categorical variables: CRRT, Ventilation, Antibiotics (0 = not used, 1 = used). ICU-AW = intensive-care-unit–acquired weakness; CRRT = continuous renal replacement therapy; SOFA = sequential organ failure assessment; Charlson = Charlson comorbidity index. This cohort served as the external validation set from Beijing Hospital of Traditional Chinese Medicine, Capital Medical University, where ICU-AW was diagnosed using a Medical Research Council (MRC) muscle strength score of ≤ 48. Mechanical ventilation and antibiotic use differed significantly between the groups (both P < 0.001), with patterns opposite to those observed in the MIMIC cohort. In the ICU-AW group, the rates of mechanical ventilation and antibiotic use were substantially higher (93.33% and 100%, respectively) than those in the non-ICU-AW group (38.98% and 35.59%, respectively). Notably, all patients in the ICU-AW group received antibiotics, whereas nearly two-thirds of the patients in the non-ICU-AW group did not.
-
To improve the model generalizability, eliminate redundant variables, and ensure the clinical interpretability of the selected features, a two-step feature selection strategy combining LASSO regression and the Boruta algorithm was applied. The key predictors associated with ICU-AW were progressively identified from the initial set of 23 clinical variables to establish a robust feature set for subsequent model development.
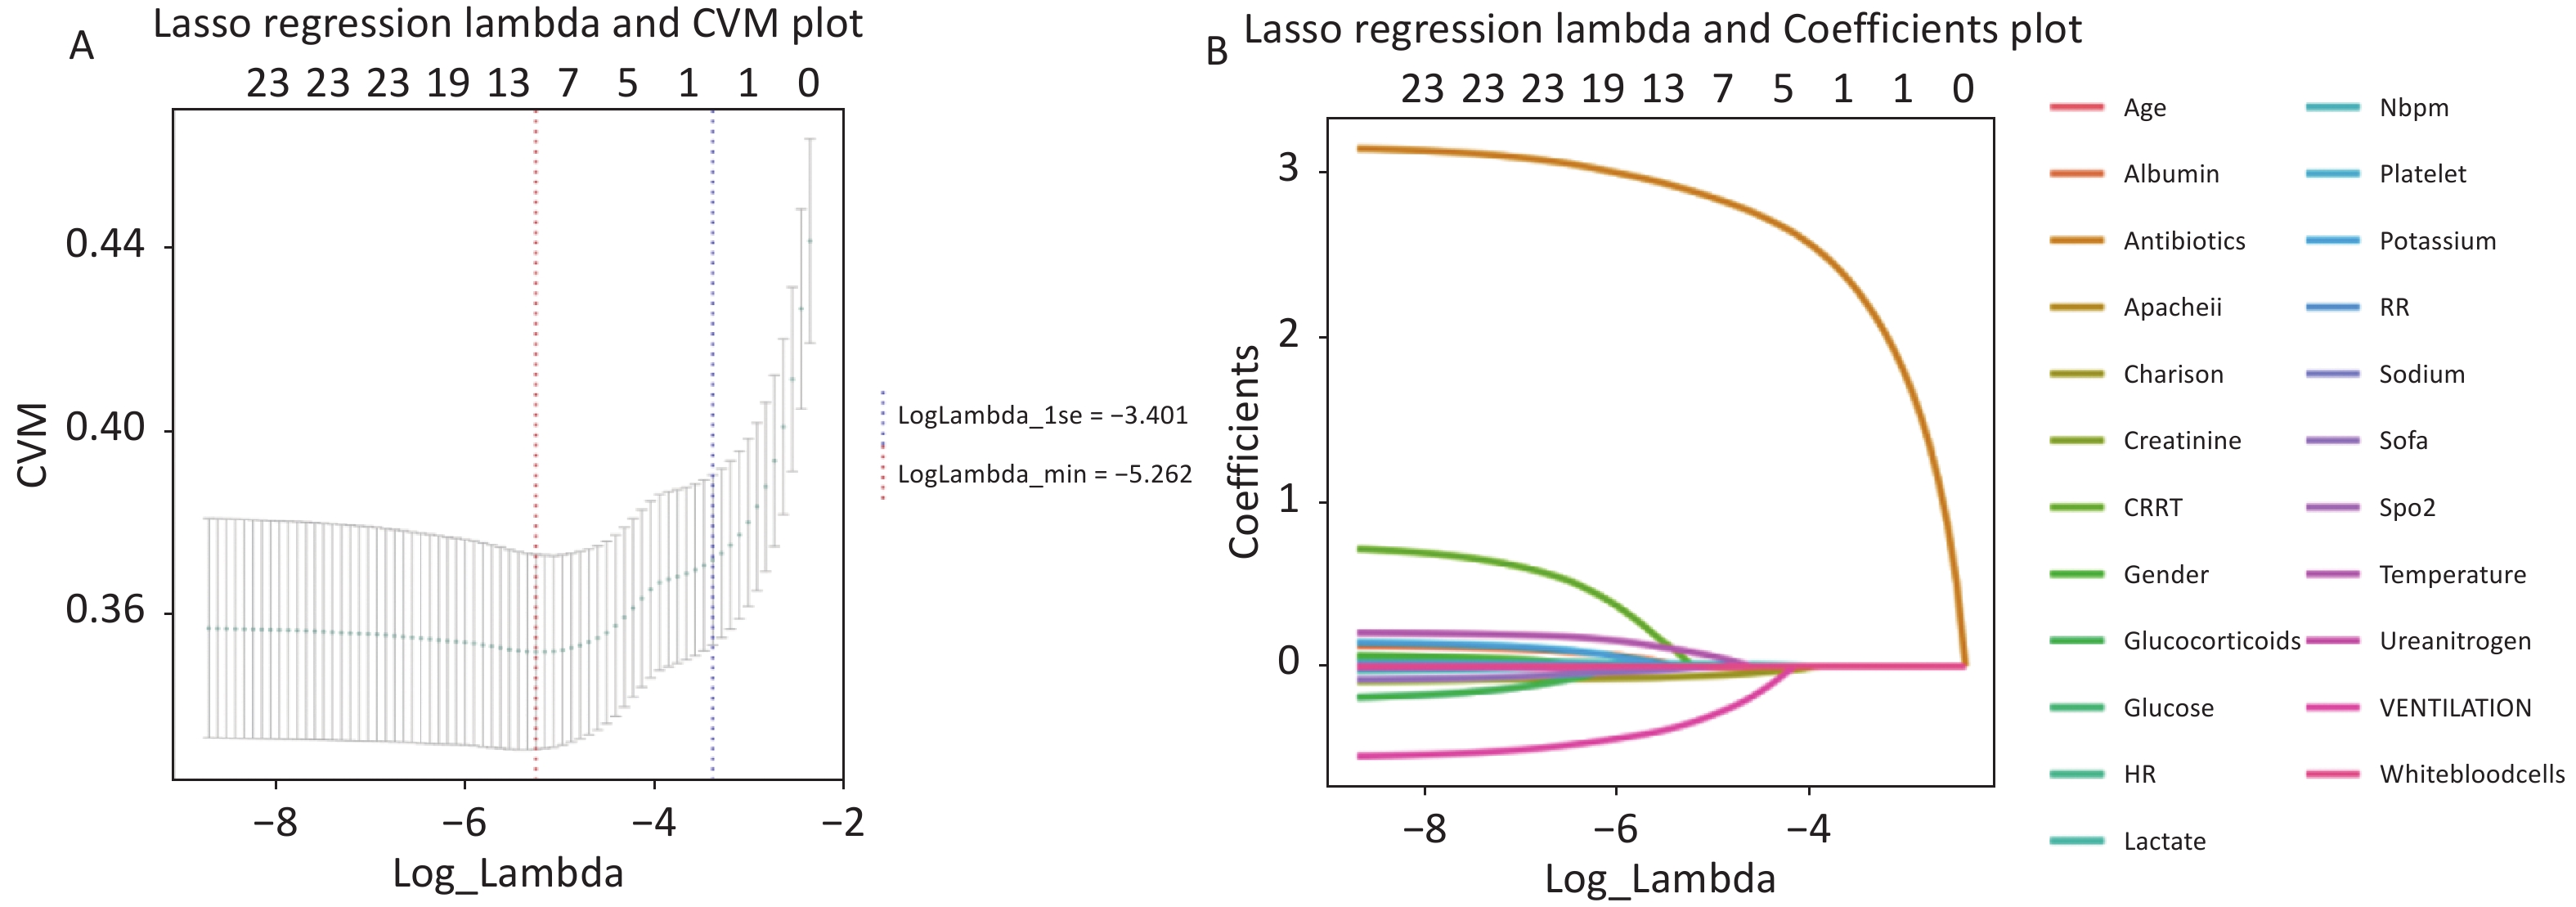
LASSO regression was applied for preliminary feature selection. The optimal regularization parameter (λ) was determined based on the relationship between λ and the cross-validation mean (CVM) error (Figure 1A) to balance model performance and feature sparsity.
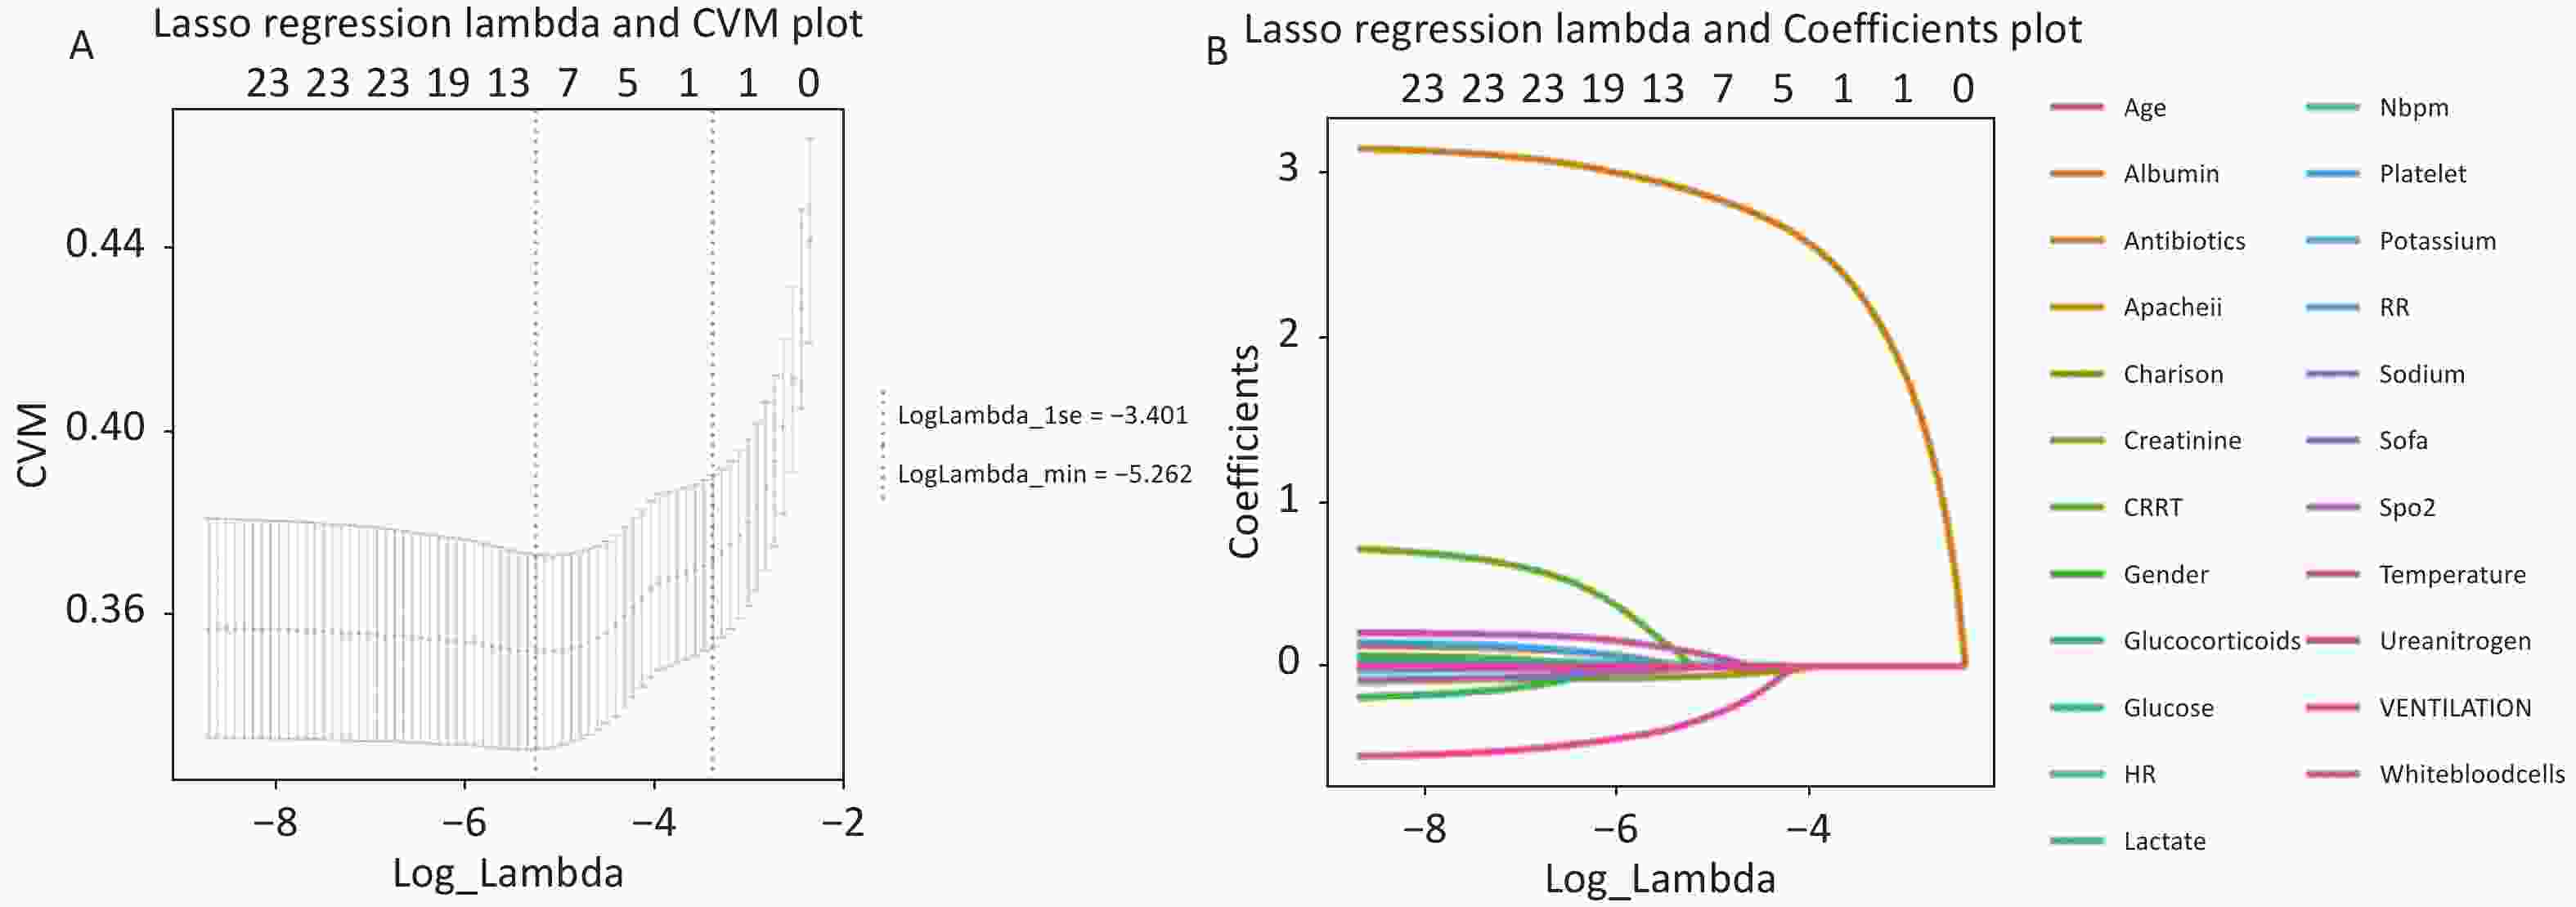
Figure 1. Least absolute shrinkage and selection operator (LASSO) regression for variable selection in the MIMIC cohort. (A) Cross-validation plot for LASSO regression, showing the relationship between log (lambda) and cross-validation mean (CVM). The red dashed line denotes the minimum CVM lambda, and the blue dashed line represents the 1-standard-error lambda. (B) Coefficient profiles of variables across different log(lambda) values, demonstrating the shrinkage of coefficients to zero with increasing lambda.
The coefficient paths of LASSO regression (Figure 1B) illustrate the shrinkage process: as λ increased, coefficients of individual features progressively approached zero. At the optimal λ (log λ = −3.401), 8 out of the 23 variables retained non-zero coefficients, while the remaining 15 variables were eliminated, yielding a preliminary set of candidate predictors.
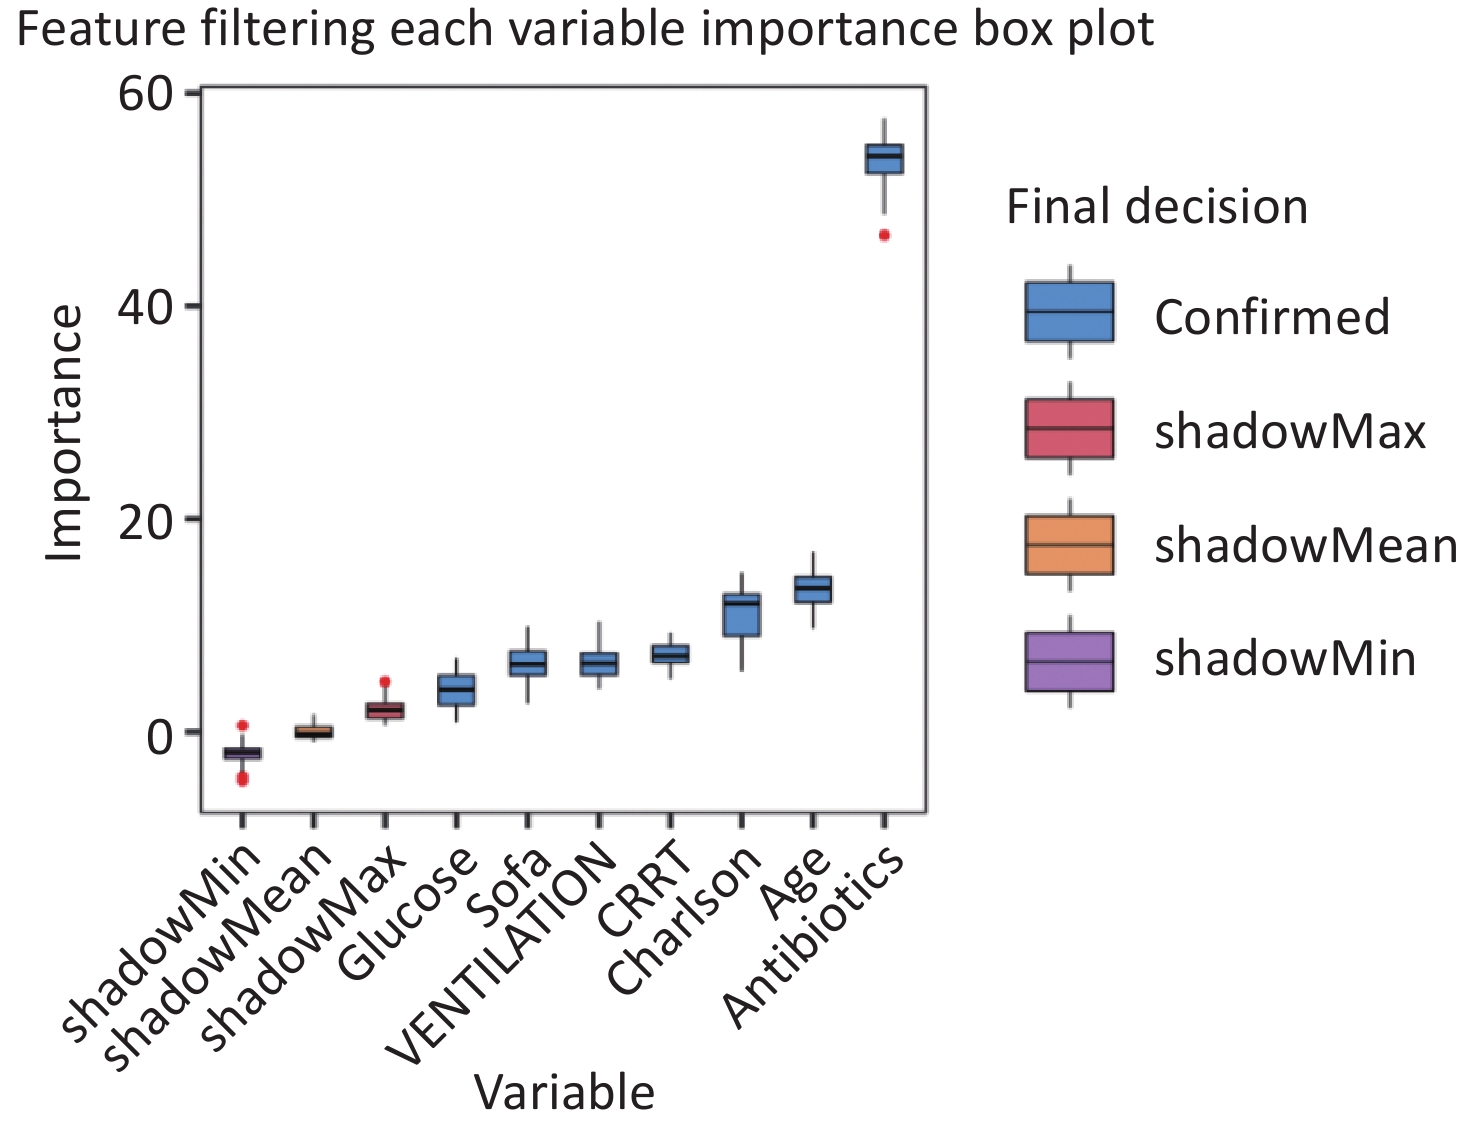
To further validate the predictive relevance of the features selected by LASSO and reduce the risk of false selection due to regularization bias, the Boruta algorithm was applied for feature importance evaluation, and the resulting feature importance ranking is shown in Figure 2. Among the eight features identified by the LASSO, seven were classified as confirmed features, indicating a stable and robust predictive value.
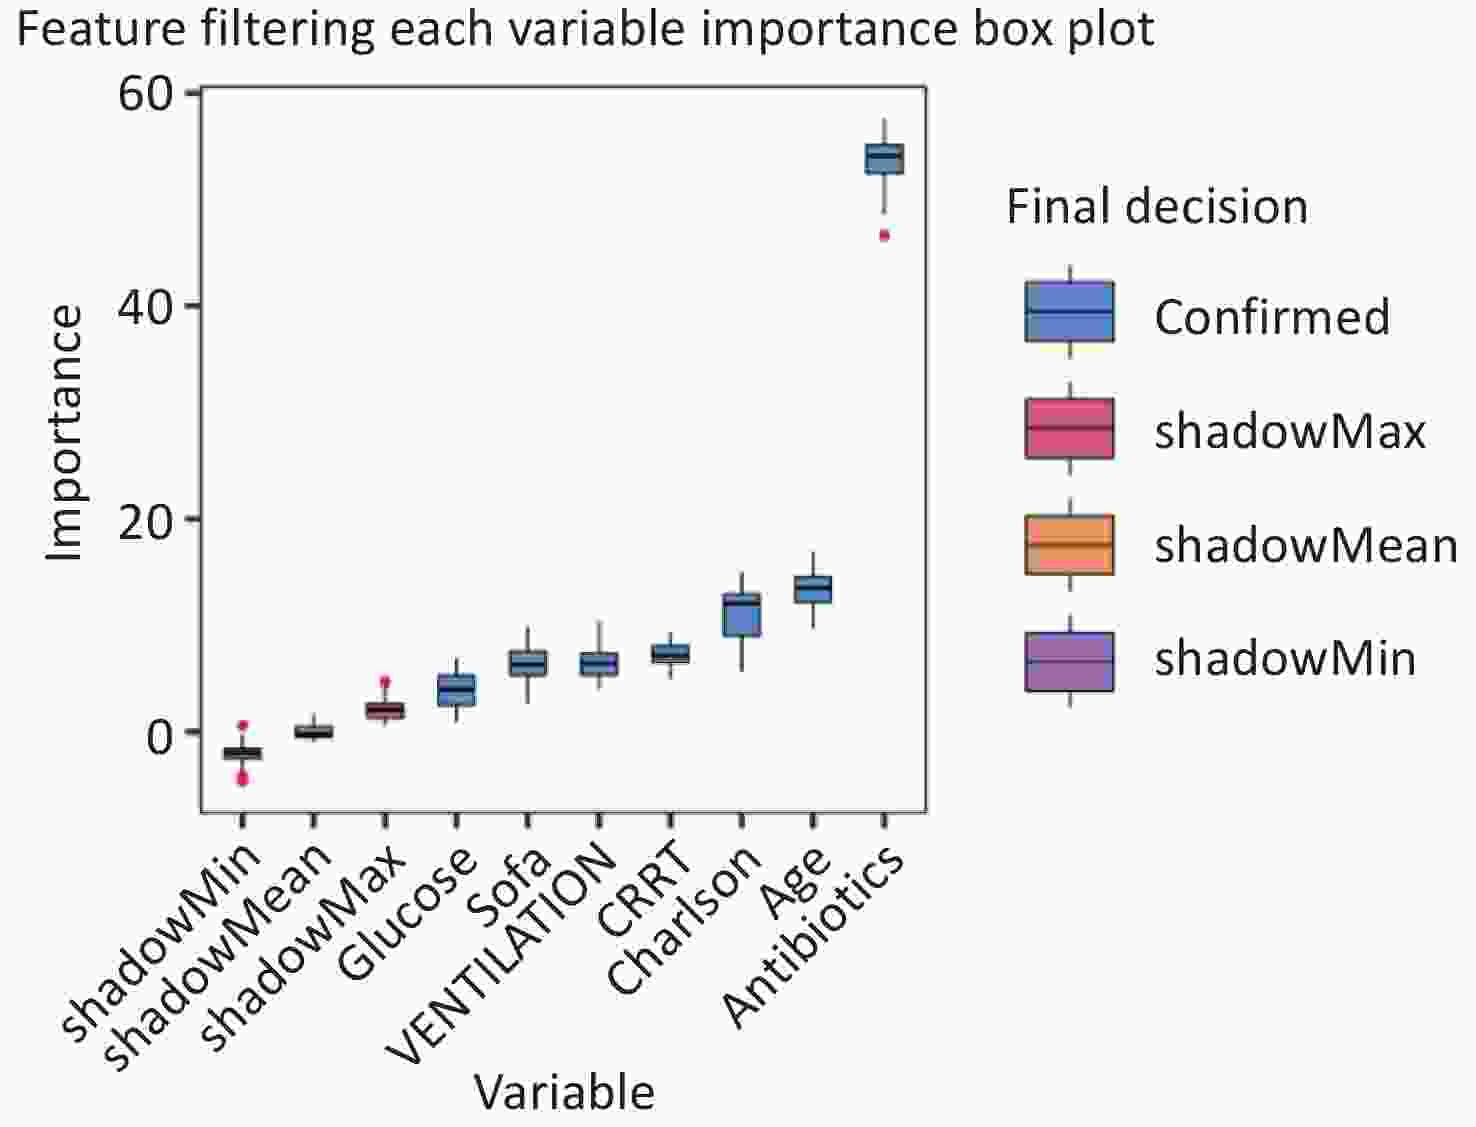
Figure 2. Feature importance ranks based on the Boruta algorithm. Variables are ranked as per their importance scores, with higher values representing stronger predictive power.
Based on the combined LASSO–Boruta selection strategy, seven core predictive features were identified: antibiotic use, age, Charlson comorbidity index, CRRT use, mechanical ventilation, SOFA score, and glucose level.
These features collectively capture demographic characteristics, disease severity, laboratory parameters, and key treatment interventions, thereby achieving a balance between model simplicity and predictive performance. This refined feature set provides a clinically meaningful and parsimonious foundation for subsequent machine-learning modeling.
-
After the synthetic minority oversampling technique for nominal and continuous variables (SMOTENC) was applied, 3,799 samples were included in the resampled dataset. Based on the outcome variables, the patients were categorized into a non-ICU-AW group (n = 2,533) and an ICU-AW group (n = 1,266). The demographic characteristics, severity scores, and treatment-related variables were compared between the two groups.
After SMOTENC resampling was performed, the age, glucose level, SOFA score, Charlson comorbidity index, antibiotic use, and mechanical ventilation remained significantly associated with ICU-AW (P < 0.05), whereas CRRT use showed no significant difference between the groups (P = 0.178).
Compared with the original dataset, CRRT changed from a statistically significant variable (P = 0.032) to a non-significant variable after resampling, suggesting that its association with ICU-AW may be influenced by class imbalance. In contrast, key predictors, such as age, antibiotic use, and mechanical ventilation, remained significantly different between the groups, indicating that their discriminative ability was robust and not affected by the resampling strategy.
-
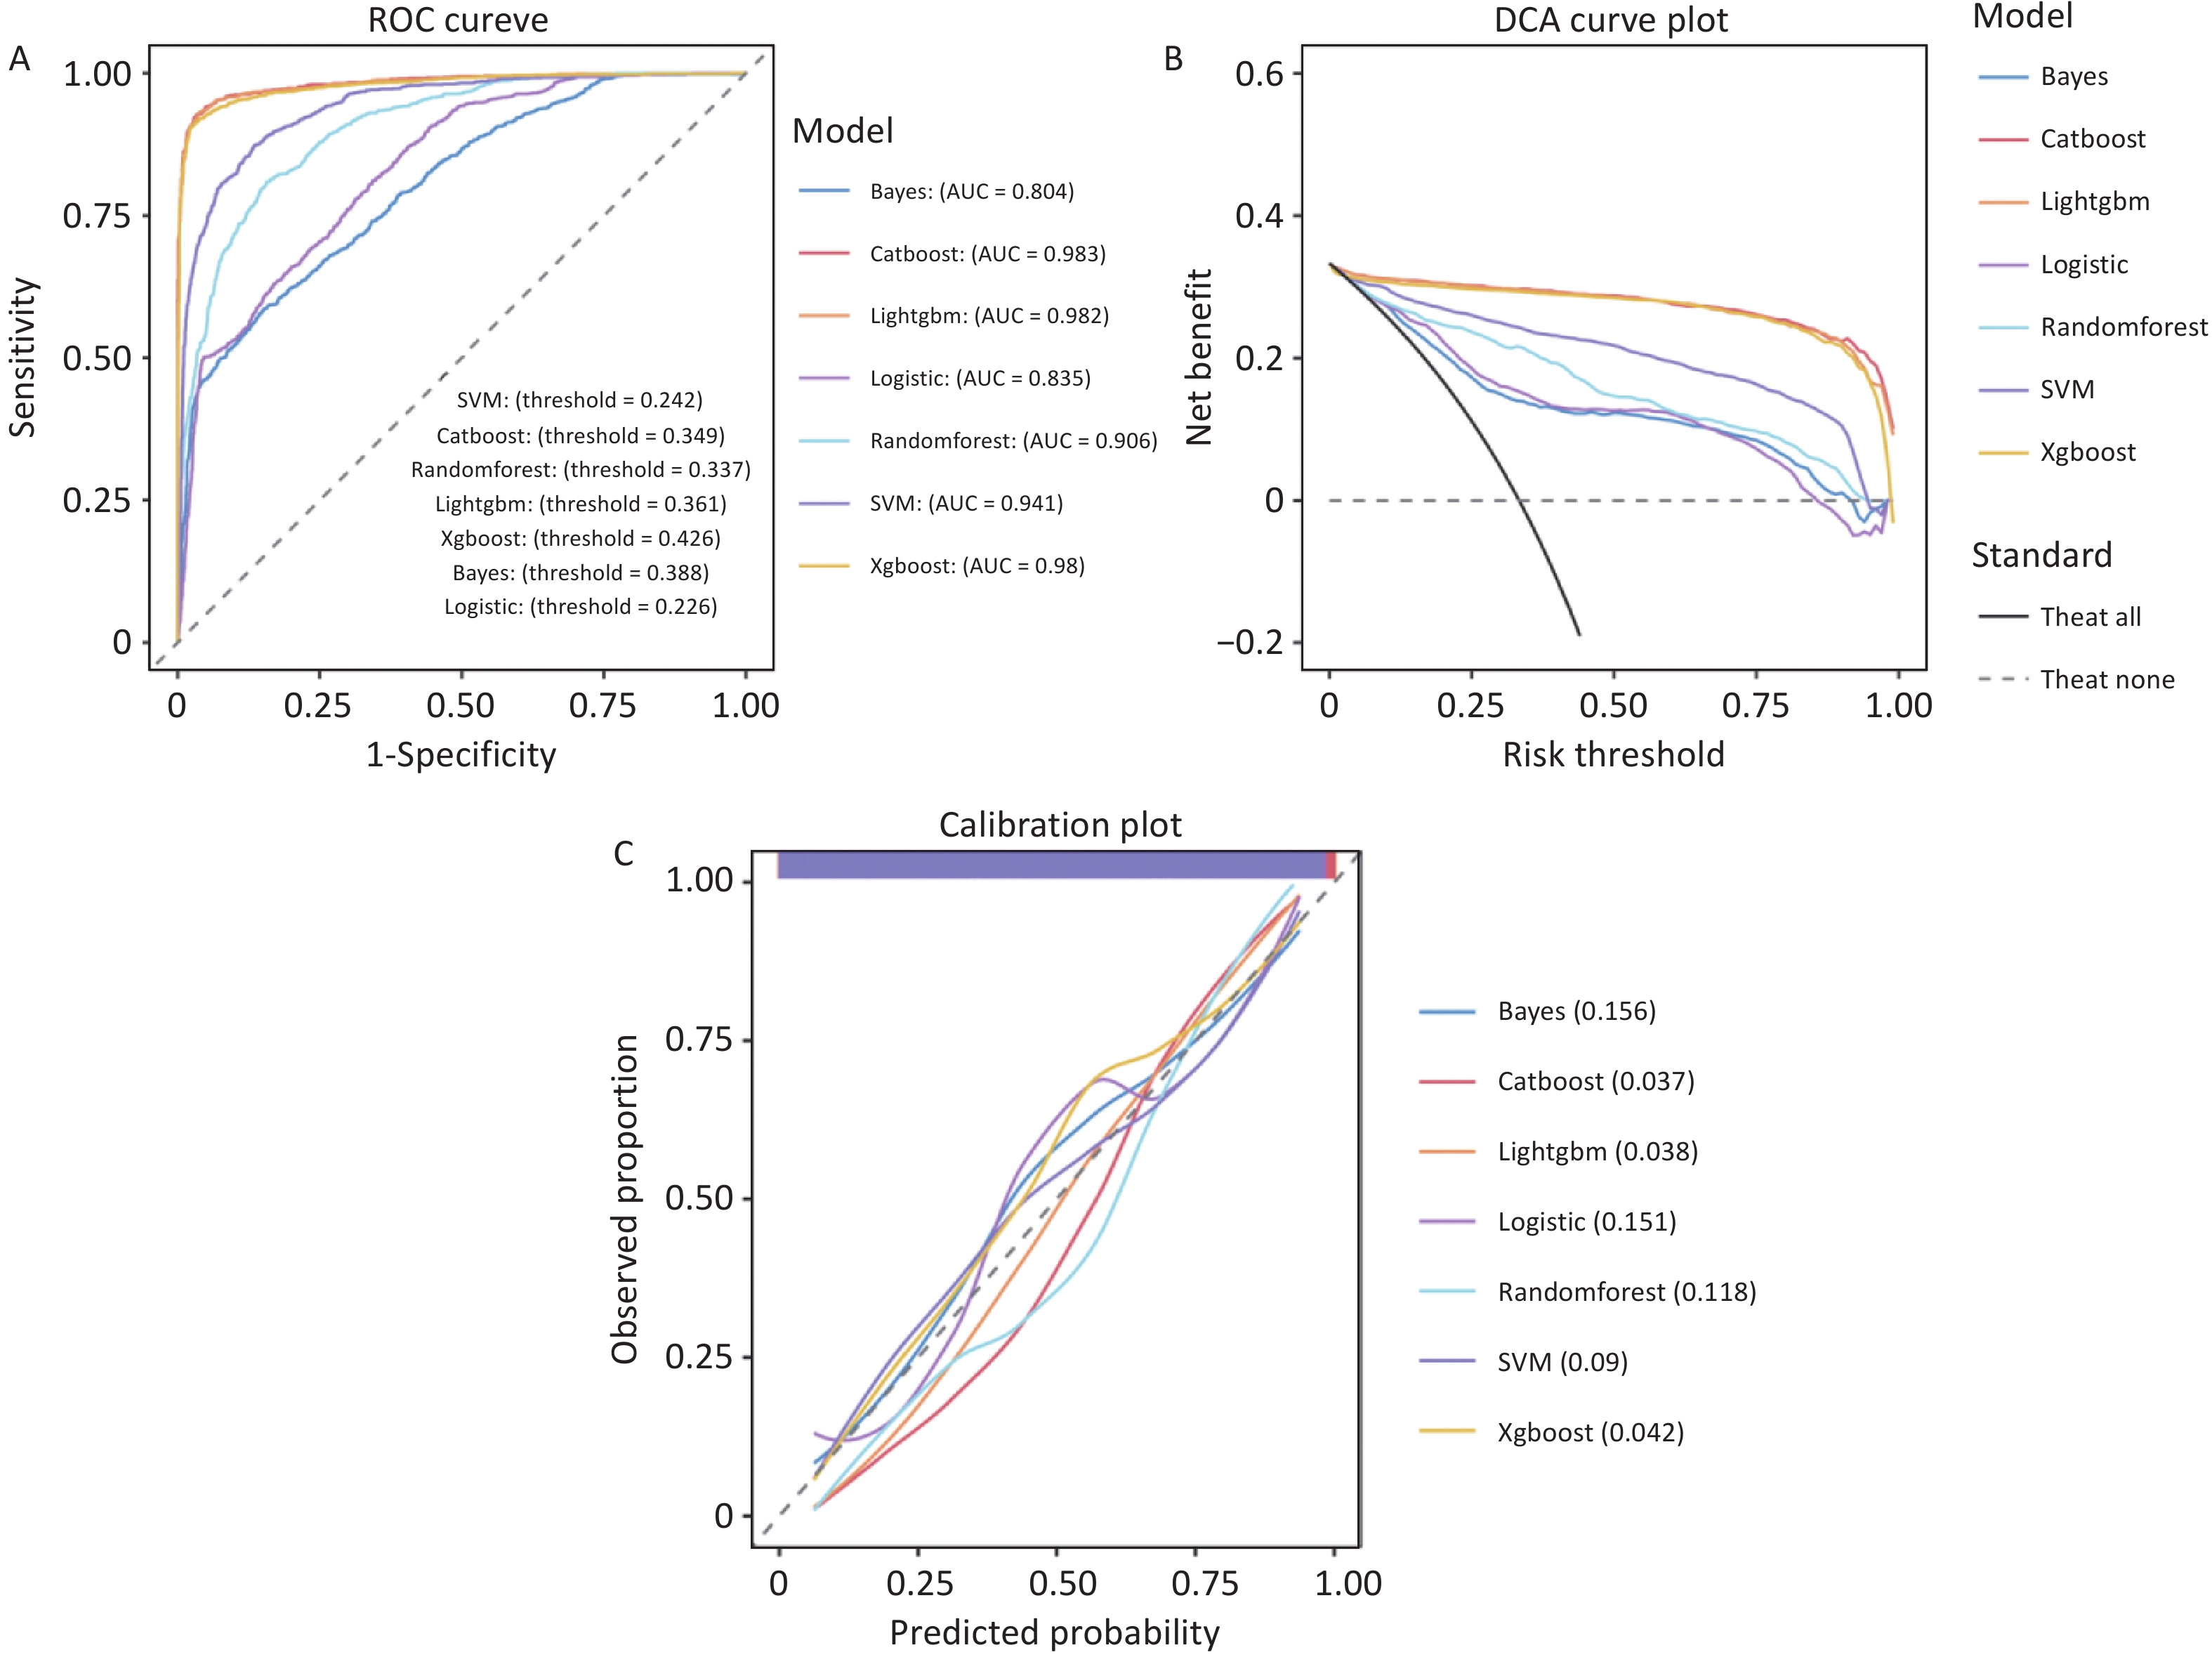
In the training set, the gradient-boosting models (LightGBM, XGBoost, and CatBoost) along with the random forest model demonstrated excellent discriminative power. The receiver operating characteristics (ROC) curves (Figure 3A) revealed that LightGBM achieved an AUC of 0.982, whereas CatBoost (0.983), XGBoost (0.980), and random forest (0.906) exceeded the AUC threshold of 0.8, indicating that these models effectively differentiated between ICU-AW and non-ICU-AW cases during training. This confirms their potential for generalization to the validation set.
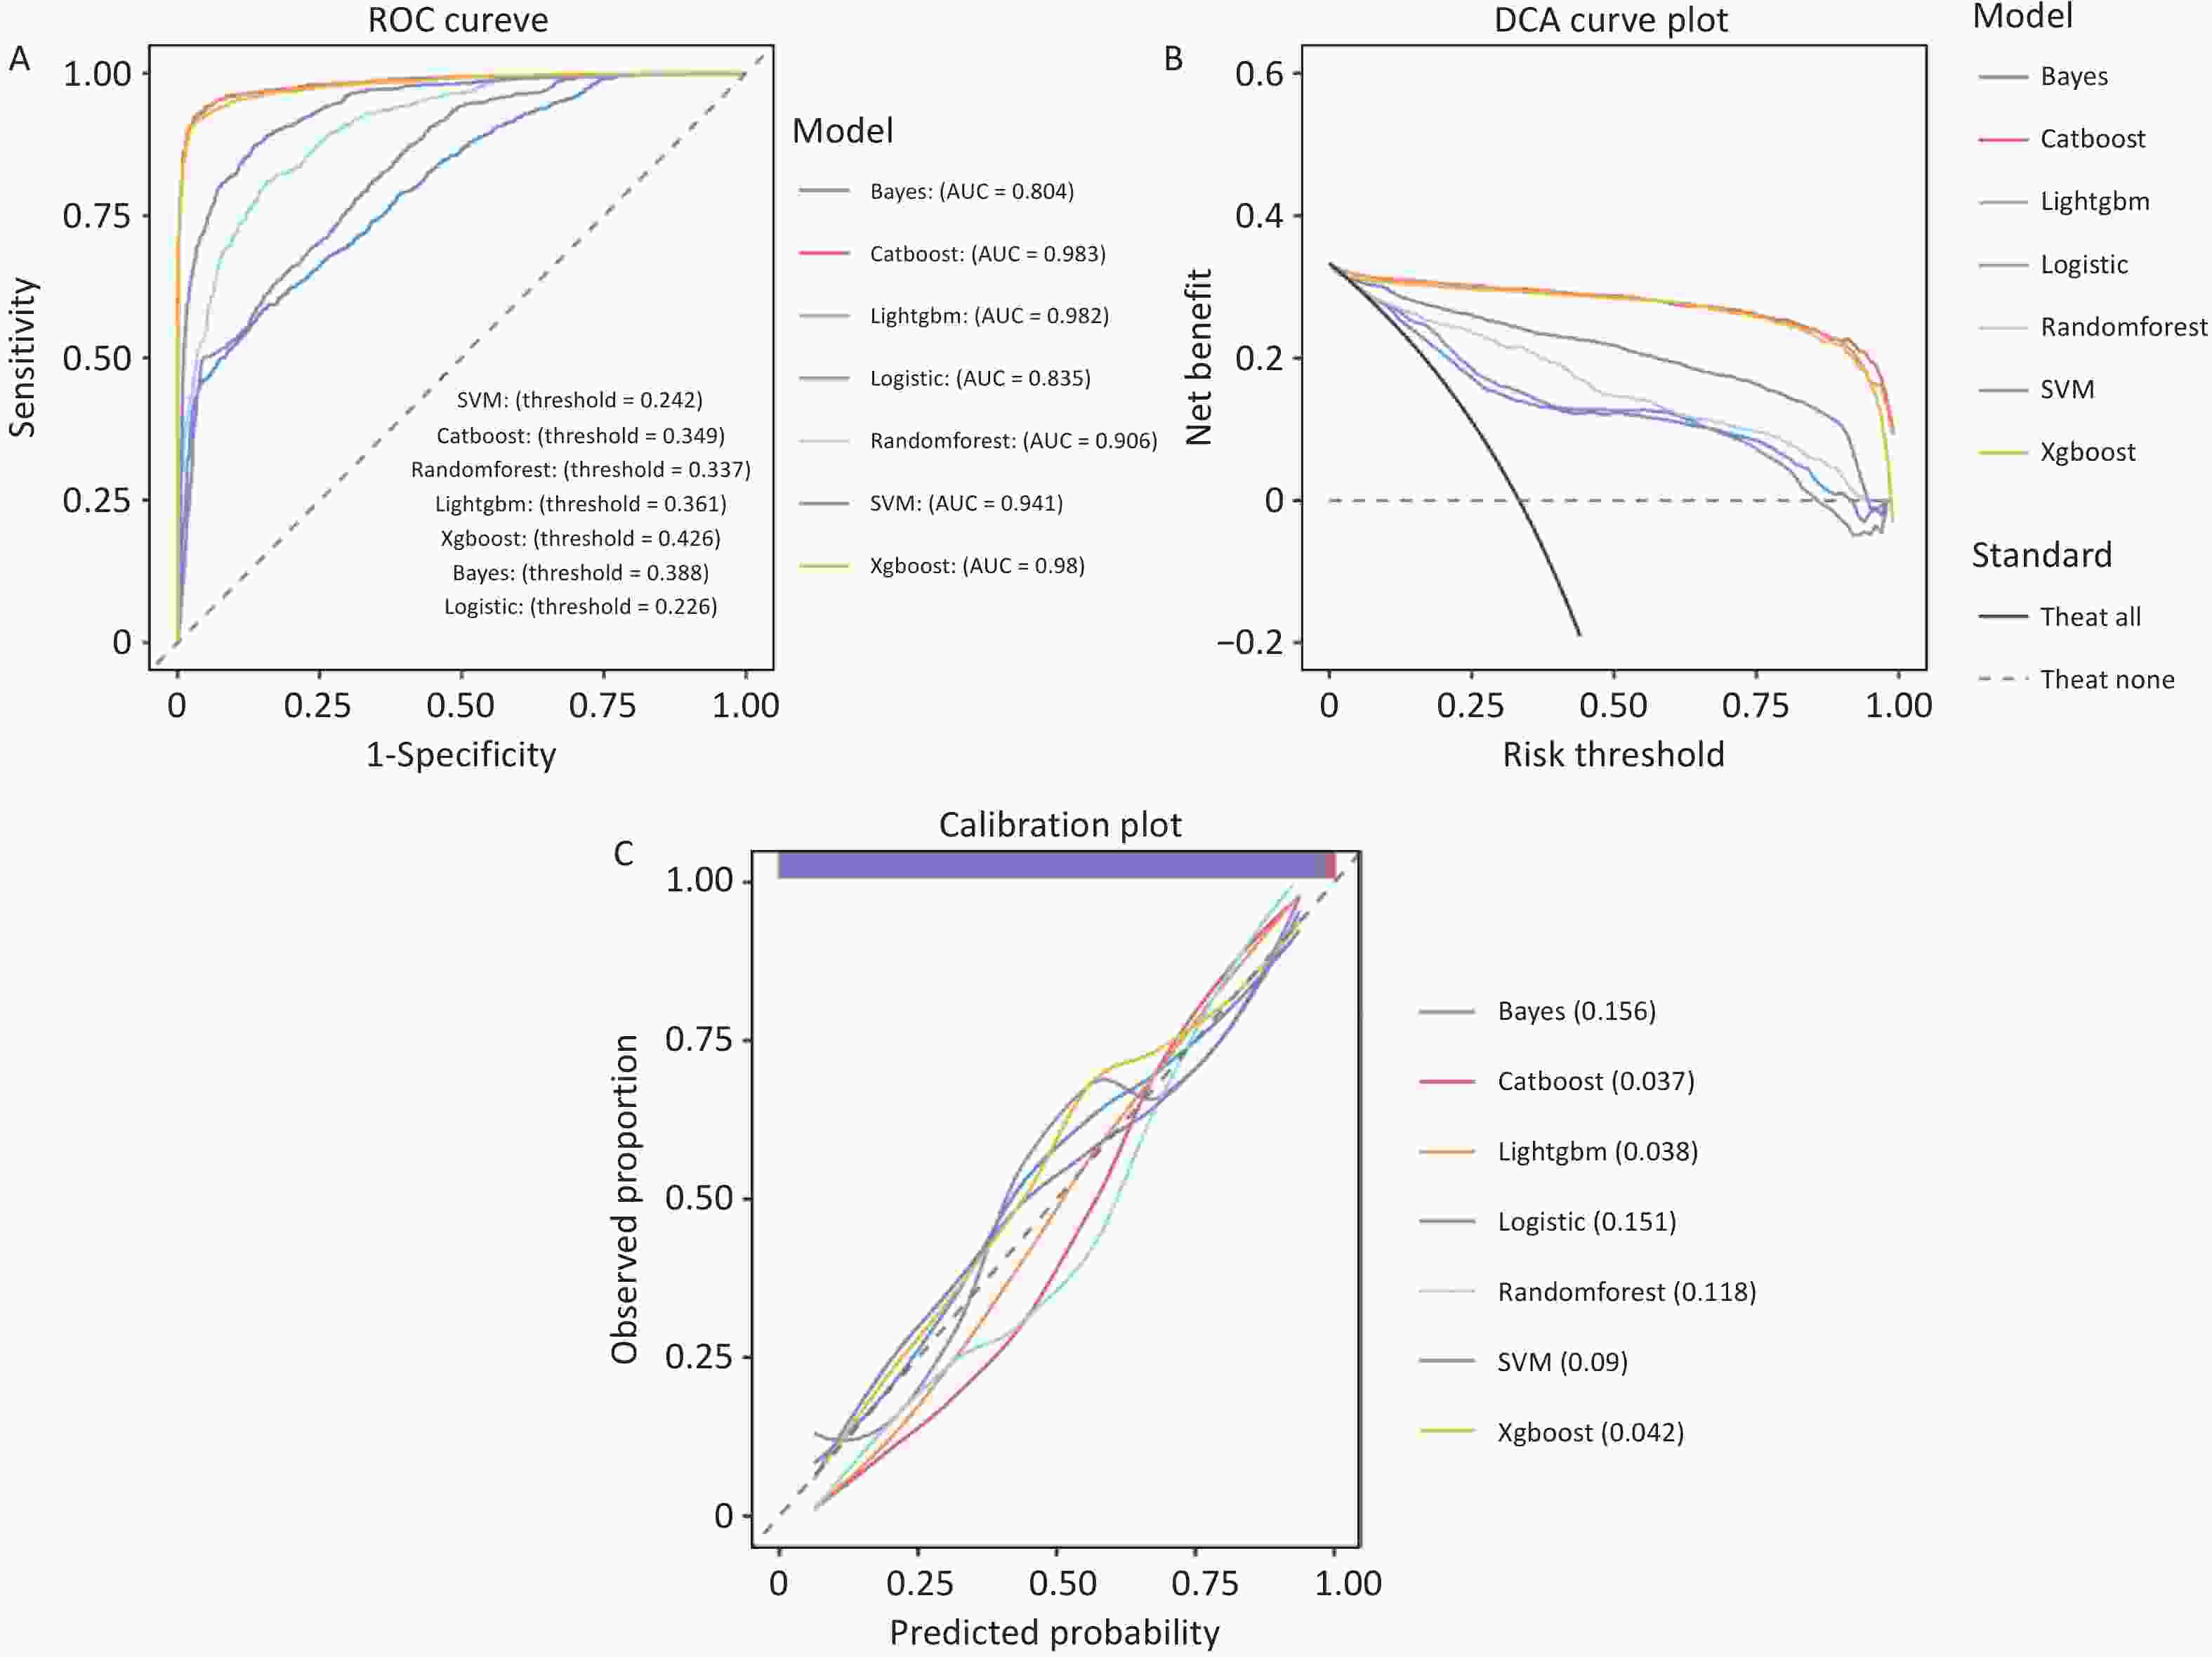
Figure 3. Performance evaluation of machine-learning models for predicting ICU-acquired weakness (ICU-AW) in patients with sepsis in the training set. (A) Receiver operating characteristic (ROC) curves of seven machine-learning models: Bayes, CatBoost, LightGBM, logistic regression, random forest, support vector machine (SVM), and XGBoost, for discrimination of ICU-AW. The area under the curve (AUC) for each model is presented in the legend. (B) Decision curve analysis (DCA) showing the clinical net benefit of each model across a range of threshold probabilities. The solid black line represents the strategy of treating all patients, and the dashed gray line represents the strategy of treating none. (C) Calibration curves of the seven models, comparing predicted probabilities with observed proportions of ICU-AW. The diagonal dashed line indicates perfect agreement between predicted and observed risk. Values in parentheses represent the corresponding calibration errors for each model.ROC, receiver operating characteristic; AUC, area under the curve; DCA, decision curve analysis; SVM, support vector machine; ICU-AW, intensive care unit-acquired weakness.
Calibration curves (Figure 3C) further validate the high reliability of these models. Both LightGBM and XGBoost exhibited calibration errors of only 0.038 and 0.042, respectively, whereas CatBoost (0.037) and random forest (0.118) showed similarly low errors. All models’ calibration curves closely approximated the “perfect calibration diagonal,” indicating that the predicted probabilities closely aligned with the actual event occurrence rates. This suggests that the model’s risk predictions can serve as a reliable quantitative basis for clinical decision making, demonstrating strong practical applicability.
The DCA (Figure 3B) further emphasized the clinical utility of the models. In the critical risk threshold range (0–0.25) for early clinical screening, all models demonstrated net benefit curves that remained consistently above the baseline of "no intervention (TreatNone)." Gradient-boosting models showed significantly higher net benefits than the other models, indicating that using these models to identify high-risk individuals and implement targeted interventions can substantially enhance clinical outcomes. This strategy is more meaningful in practice than the “no intervention” approach.
The quantitative performance metrics from the training set (Supplementary Table S1) revealed that the CatBoost model demonstrated the best overall performance, with the highest accuracy (0.954), specificity (0.981), and precision (0.960). LightGBM had the best sensitivity (0.909) and slightly outperformed XGBoost in terms of the F1-score (0.927 vs. 0.926). Although random forest had lower accuracy (0.813) and sensitivity (0.533) than the gradient-boosting models, it still outperformed the logistic regression and Naïve Bayes models. All models achieved a precision greater than 0.79, indicating a high level of confidence in identifying positive cases, which can significantly reduce the risk of false positives and minimize unnecessary medical resource use.
-
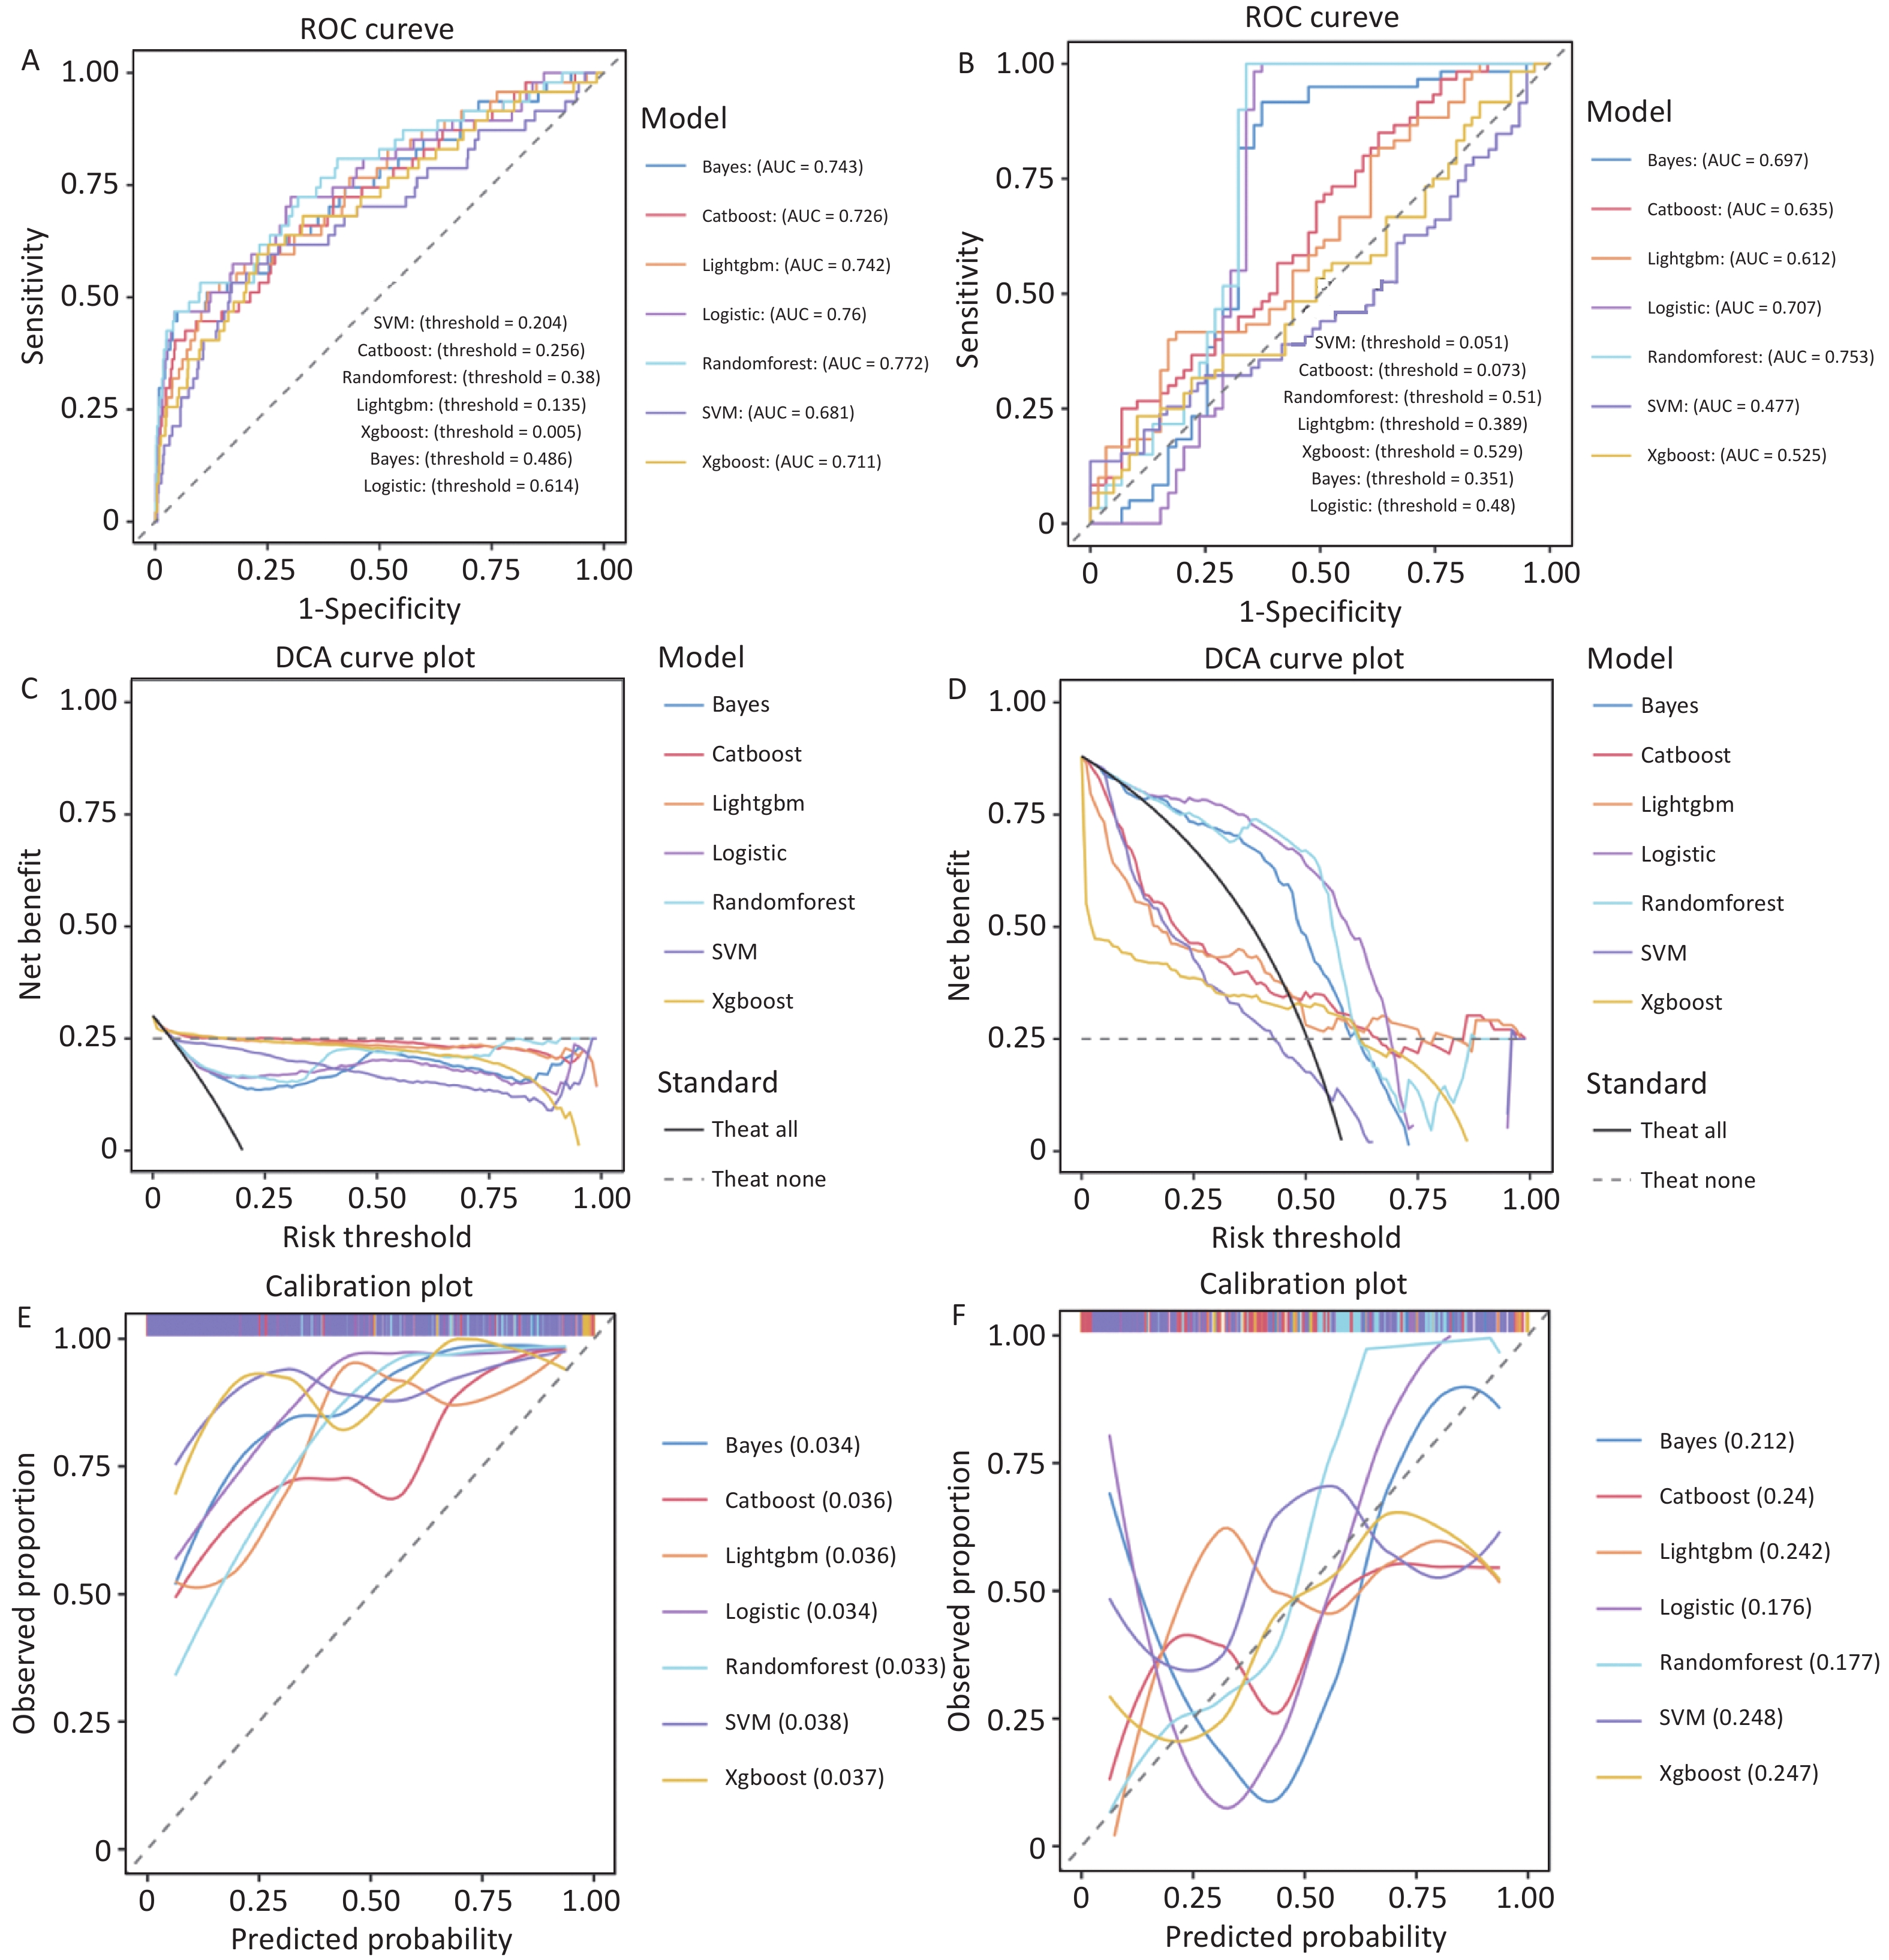
In the internal validation set (non-resampled data), all seven machine-learning models exhibited good discriminative ability, although their overall performance was slightly lower than that of the training set, reflecting more realistic clinical conditions (Figure 4A). ROC curve analysis showed that the random forest model achieved the highest AUC of 0.772, followed by logistic regression (0.760), Naïve Bayes (0.743), and LightGBM (0.742). XGBoost (0.711), CatBoost (0.726), and SVM (0.681) demonstrating weaker discriminative abilities. All models had AUC values greater than 0.68, which were significantly above the random guess threshold (AUC = 0.5), confirming their ability to effectively differentiate between ICU-AW and non-ICU-AW cases and their potential clinical value.
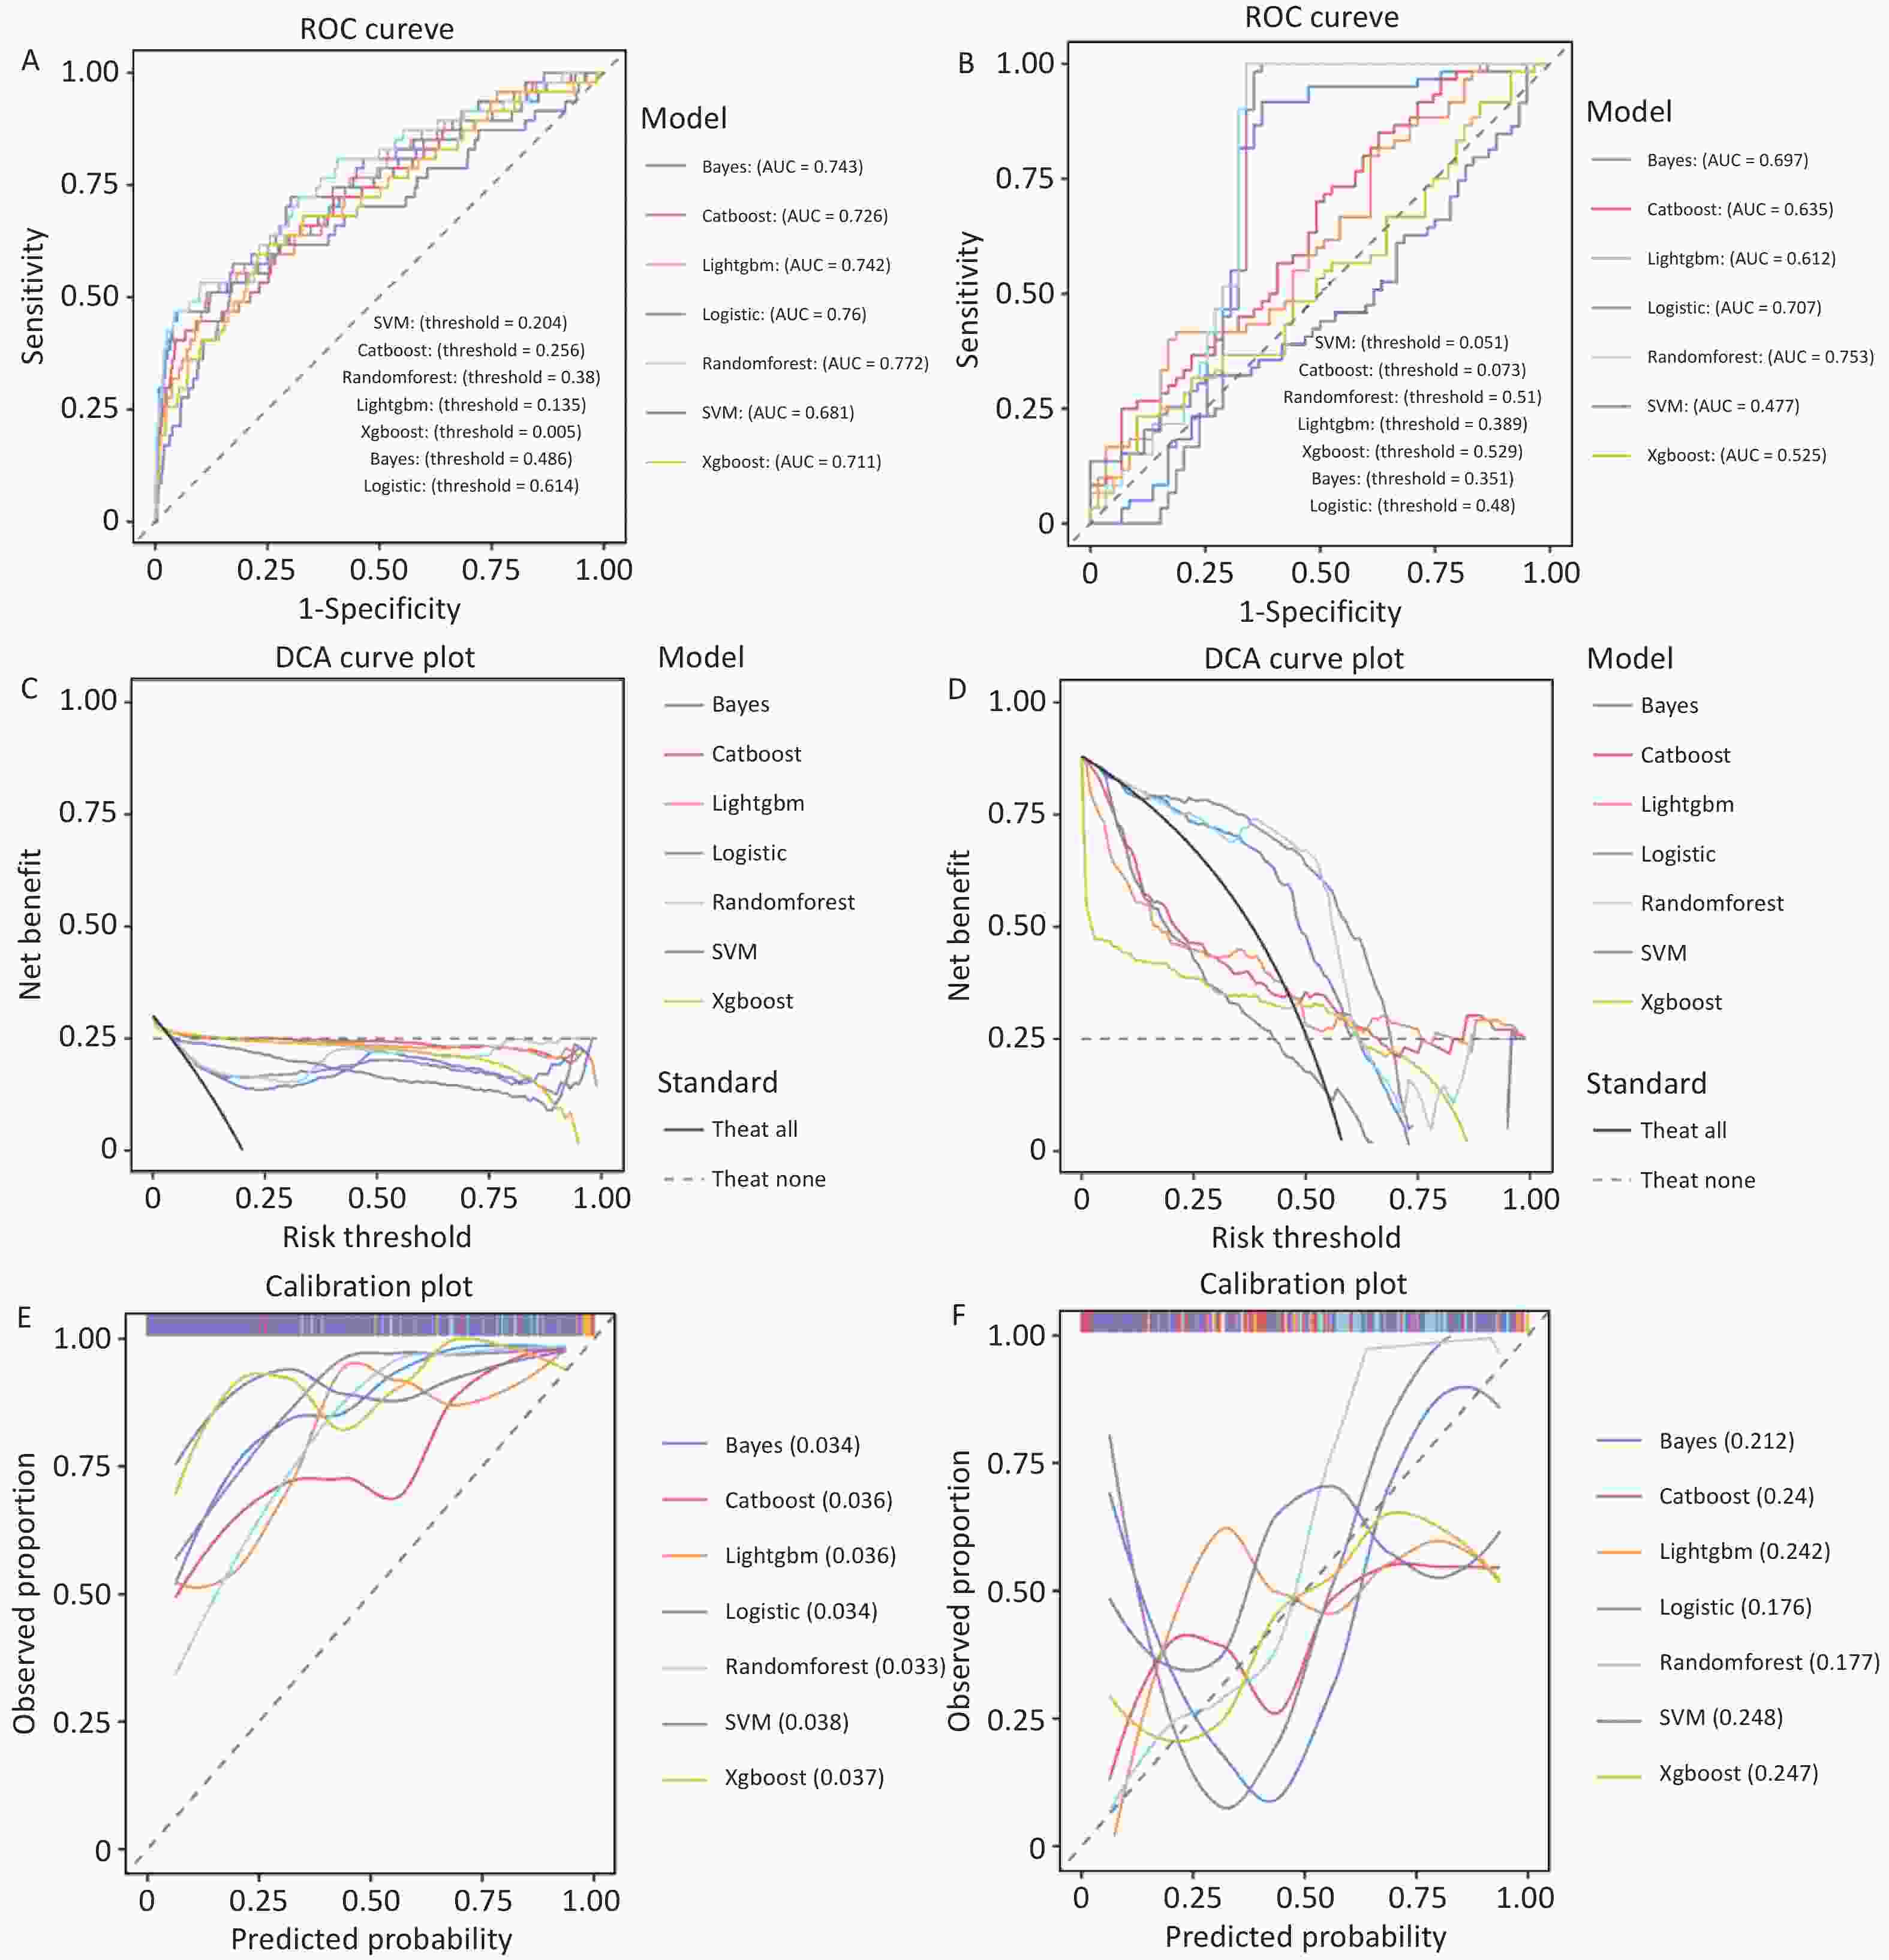
Figure 4. Performance evaluation of machine-learning models for predicting ICU-acquired weakness (ICU-AW) in sepsis patients in the internal validation and external test sets.
Calibration curves (Figure 4E) further demonstrate the reliability of the models. The calibration errors were all below 0.04, indicating good calibration across all models. Random forest (0.033), Naïve Bayes (0.034), and logistic regression (0.034) had the lowest calibration errors, with their predicted probabilities closely matching the actual event rates. LightGBM (0.036), CatBoost (0.036), and XGBoost (0.037) showed slightly higher calibration errors, whereas SVM had the highest calibration error (0.038). These findings indicate that all the models’ predicted risk probabilities aligned closely with the actual event occurrence, providing reliable and quantifiable guidance for clinical decision-making.
The DCA (Figure 4C) further validated the clinical applicability of the models. In the critical risk threshold range (0–0.5) for early clinical screening, the net benefit curves of the random forest, logistic regression, and Naïve Bayes were significantly higher than those of the gradient-boosting models and SVM and remained consistently above the "no intervention" baseline (TreatNone). Random forest showed the highest net benefit at low-risk thresholds (0–0.3), suggesting that using this model to identify high-risk individuals for targeted interventions could substantially improve clinical outcomes, such as reducing false negatives and optimizing healthcare resource allocation. This makes it a more practical strategy compared to the "no intervention" approach.
For risk thresholds above 0.5, the net benefit of all models declined, reflecting the "cost-benefit" trade-off of clinical interventions. In the medium-to-high-risk range, the cost of intervention in all high-risk patients gradually offsets the benefits, which does not indicate poor model performance but rather reflects the natural clinical challenge of resource allocation.
The quantitative performance metrics for the internal validation set (Supplementary Table S2) highlighted the clinical utility of the models. Random forest demonstrated the best overall performance, with the highest sensitivity (0.468), F1-score (0.370), accuracy (0.935), and specificity (0.955), making it optimal for balancing false negatives and false positives in clinical practice.
CatBoost achieved the highest accuracy (0.955) and specificity (0.986) but had a very low sensitivity (0.234), which may lead to underdiagnosis of ICU-AW cases, making it suitable only for situations where minimizing false positives is prioritized. LightGBM and XGBoost also demonstrated high accuracy but had lower sensitivity, limiting their clinical applicability. The SVM model exhibited the poorest performance across all metrics, indicating limited practical utility.
-
In the external validation cohort (119 clinical cases from our institution), significant performance differences were observed among the models, with all models showing a decline in performance compared to the internal validation cohort, reflecting real-world clinical conditions (Figure 4B). ROC curve analysis revealed that the random forest model maintained the best discriminative ability, with an AUC of 0.753, which was the highest among the AUCs achieved by all the models. The random forest demonstrated stable performance in cross-center data, followed by logistic regression (0.707) and Naïve Bayes (0.697). The gradient-boosting models (LightGBM: 0.612, XGBoost: 0.525, and CatBoost: 0.635) and SVM (0.477) exhibited significantly lower AUC values, indicating poor generalizability.
-
Calibration curves (Figure 4F) demonstrated that random forest (0.177) and logistic regression (0.176) had the lowest calibration errors, reflecting the best alignment between the predicted probabilities and actual event rates. Naïve Bayes (0.212) exhibited slightly higher calibration errors. The gradient-boosting models and SVM have calibration errors greater than 0.24, indicating lower prediction reliability and making them less applicable in clinical practice.
-
The DCA (Figure 4D) showed that across the risk threshold range (0–0.8), the net benefit curve of random forest remained the highest among all models, significantly exceeding the "no intervention" (TreatNone) baseline. Logistic regression showed a slightly lower net benefit, whereas the remaining models had net benefits close to or below the baseline, suggesting that only the random forest and logistic regression models demonstrated actual clinical utility in the external validation cohort.
-
Quantitative performance metrics from the external validation cohort (Supplementary Table S3) further highlighted the clinical utility of the models. The random forest model exhibited the best overall performance, with the highest accuracy (0.832), specificity (0.661), F1-score (0.857), and a relatively high sensitivity (0.851), demonstrating its ability to effectively balance precision and recall, even in cross-center data.
Logistic regression had the highest sensitivity (0.967), enabling the maximum identification of ICU-AW patients. However, its accuracy (0.807) and specificity (0.644) were slightly lower than that of the random forest, resulting in a relatively higher false-positive rate. Naïve Bayes exhibited moderate performance across all metrics without any clear advantages. The gradient-boosting models and SVM had accuracy rates below 0.60 and sensitivities below 0.30; thus, these are inadequate for clinical prediction.
-
Comprehensive evaluations across the training, internal validation, and external validation sets revealed that the random forest model demonstrated superior overall performance in terms of discrimination, calibration, and clinical utility. This model exhibited stable generalizability across centers; thus, it is as an optimal prediction model for ICU-AW risk in patients with sepsis.
-
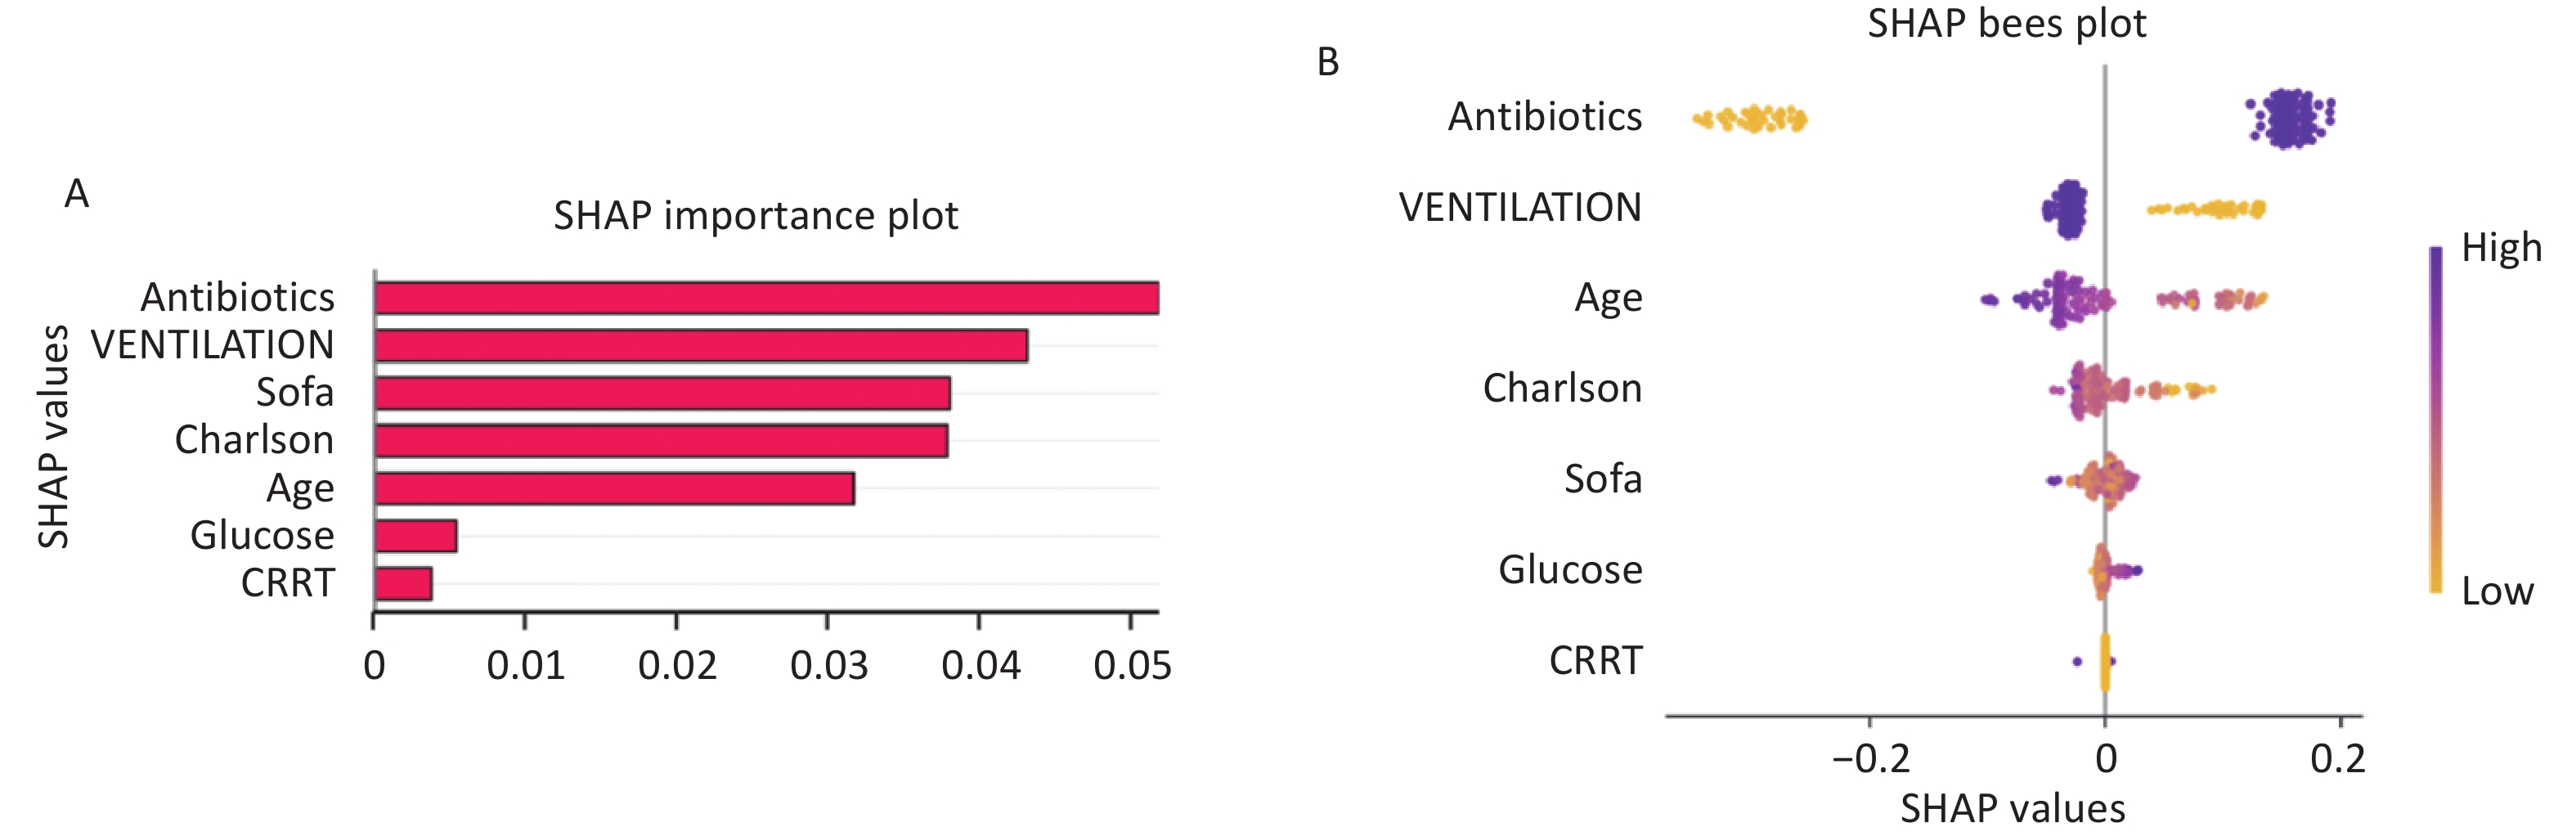
To address the "black-box" nature of machine-learning models and clarify the prediction logic and clinical drivers of the optimal model (random forest), the SHAP method was used to quantify global feature contributions[9,17]. The results are shown in Figure 5.
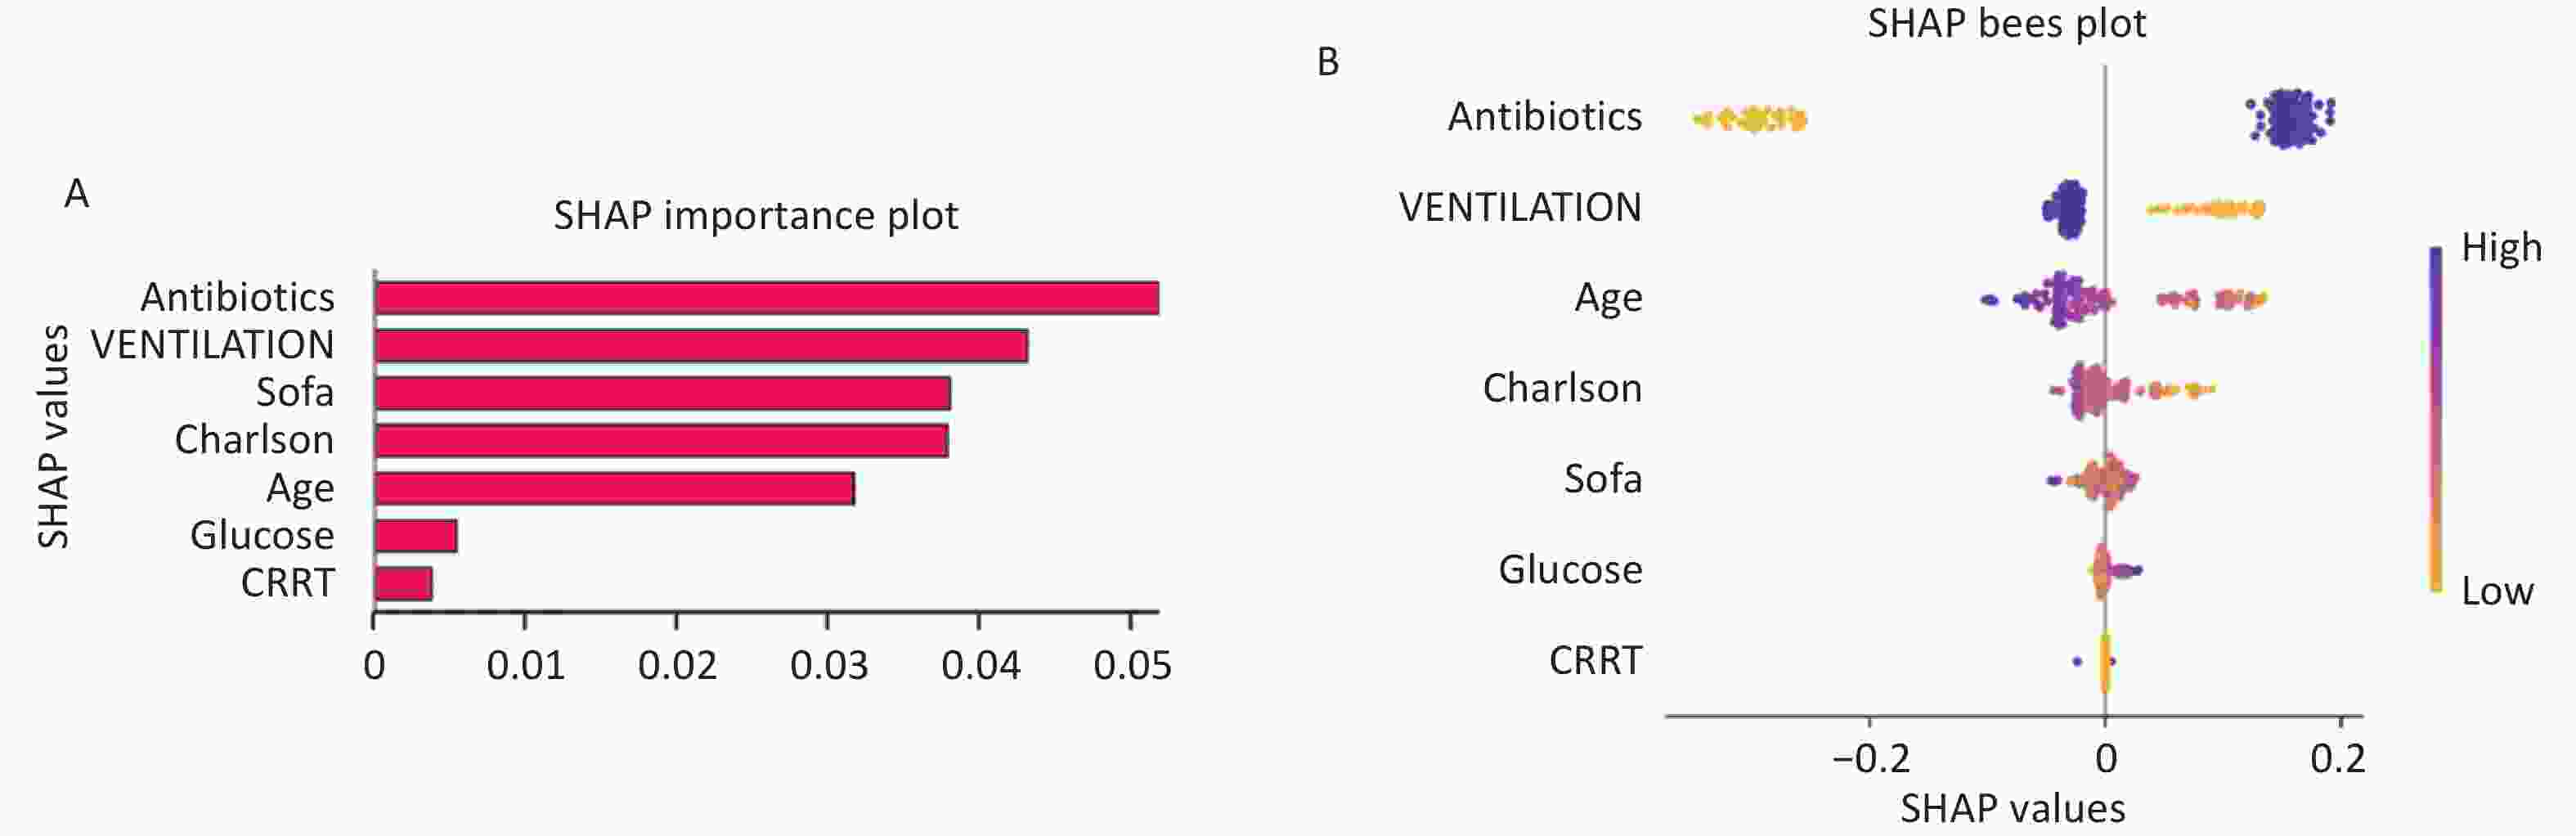
Figure 5. SHAP-based interpretation of the machine-learning model for predicting ICU-acquired weakness (ICU-AW) in patients with sepsis. (A) SHAP feature importance plot showing the mean absolute SHAP values of each feature, reflecting their overall contribution to the prediction of ICU-AW. Features are ranked in descending order of importance, with antibiotics and mechanical ventilation being the most influential predictors. (B) SHAP beeswarm plot illustrating the distribution of SHAP values for each feature across all samples. Each point represents an individual patient, with color indicating the feature value (yellow for low, purple for high). The horizontal position reflects the impact of the feature on the model output, where positive SHAP values indicate increased risk of ICU-AW and negative values indicate decreased risk.SHAP, SHapley Additive exPlanations; SOFA, Sequential Organ Failure Assessment; CRRT, continuous renal replacement therapy; ICU-AW, intensive care unit-acquired weakness.
The SHAP feature importance plot measures the overall impact of each feature on model predictions by summing the absolute SHAP values. The analysis revealed that antibiotic use (antibiotics) was the most influential predictor, with a total SHAP value of approximately 0.05, which was significantly higher than that of all other features. This indicates that antibiotic use is a core driver of the ICU-AW risk in patients with sepsis. The next most important predictors were mechanical ventilation (VENTILATION) (SHAP value ~0.043), SOFA score (SOFA) (~0.038), and Charlson comorbidity index (Charlson) (~0.037), which had similar contributions and significantly affected the model predictions. Age (Age) had a slightly lower contribution (~0.032), while glucose (glucose) (~0.006) and CRRT use (CRRT) (~0.004) had the smallest SHAP values, indicating minimal impact on model predictions.
Further analysis using the SHAP beeswarm plot (Figure 5B) revealed that higher antibiotic use and mechanical ventilation (represented by purple points) corresponded to more positive SHAP values, suggesting that higher levels of these features increased the risk of ICU-AW. In contrast, features such as SOFA score, Charlson index, and age displayed more complex distribution patterns, with their impact on risk varying depending on the feature values.
-
ICU-AW significantly prolongs mechanical ventilation and ICU stay, increases long-term functional impairment and mortality risk, severely affecting the prognosis of patients[1]. The pathophysiology of ICU-AW is complex, with the inflammatory response and metabolic disturbances induced by sepsis at the core and is also affected by clinical intervention measures, such as mechanical ventilation and antimicrobial therapy, which reflect disease severity and treatment exposure[2,3,19]. Therefore, accurately identifying high-risk patients early in their ICU stay and implementing targeted management strategies are critical issues in critical care medicine, as multiple clinical factors have been shown to influence ICU-AW occurrence and prognosis[19,20]
In this study, using the MIMIC-IV v3.1 database, we employed a two-step feature selection process combining LASSO regression for initial screening and the Boruta algorithm validation to identify core predictive features. Seven machine-learning models were compared, and the random forest model demonstrated the best overall performance and stability in both the internal and external validation sets. Unlike in previous studies, in this study, all predictive variables were strictly limited to data available within the first 48 h of ICU admission and reconstructed treatment-related variables; thus, time-dependent bias and data leakage issues were effectively avoided. This approach allowed the model to align more closely with real-world clinical scenarios.
Notably, the outcome variable in this study was based on ICD codes to identify CIP and CIM, which reflect the severe forms of ICU-AW. This definition focuses on patients with clearly identifiable clinical manifestations and structural damage. The incidence of ICU-AW in this study was relatively low (5.28%), significantly lower than that reported in other studies. However, this outcome definition helped center the model on patients with severe neuromuscular complications, which are more clinically recognized.
In the external validation set, the model demonstrated consistent performance when tested against ICU-AW, as defined by the MRC score. This indicates that the pathophysiological mechanisms of CIP-CIM and generalized ICU-AW may be continuous and may potentially represent different stages within the same disease spectrum[15]. Therefore, the results of this study are applicable for identifying high-risk patients who may develop severe neuromuscular complications in sepsis.
-
The core predictive features identified in this study included antibiotic use, mechanical ventilation, age, Charlson comorbidity index, SOFA score, glucose level, and CRRT use. These variables reflect the underlying risk factors for neuromuscular complications in patients with sepsis from different perspectives, and can be broadly categorized into two dimensions: treatment exposure and biological vulnerability.
Antibiotic use emerged as one of the most important predictors in this study, demonstrating its importance in both internal and external SHAP analyses. This finding suggests that antibiotic treatment not only reflects the infection burden and disease severity but may also be closely associated with the occurrence of neuromuscular complications[7-9]. Antibiotic use often signifies a more severe or clearly defined infectious state linked to prolonged inflammation and increased physiological stress. On the other hand, broad-spectrum antibiotics may disturb the gut microbiome, alter host metabolic environment, and immune microecology, further influencing systemic inflammatory responses and muscle tissue homeostasis[13,16]. Although this study highlighted an association rather than a direct causal relationship, the consistent inclusion of this feature in the model underscores its significance in identifying the risk of sepsis-associated neuromuscular damage.
Mechanical ventilation was also a key predictor in this model. Mechanical ventilation not only reflects respiratory dysfunction and disease severity but is also closely related to prolonged immobilization, altered respiratory muscle load, sedation use, and diaphragm dysfunction. Previous studies have demonstrated that prolonged mechanical ventilation can lead to disuse muscle atrophy, affect the balance between muscle protein synthesis and breakdown, and exacerbate muscle weakness through neuromuscular dysfunction[7,21,22]. In this study, mechanical ventilation also showed high importance in the SHAP analysis of the external validation set, highlighting its strong potential as an early clinical signal for risk prediction.
Age, Charlson comorbidity index, and SOFA score represented baseline vulnerability, chronic disease burden, and acute organ dysfunction, respectively. Theoretically, higher values of these indices often reflect poorer system reserves and higher risk of complications. In the external validation cohort, older age and increased comorbidity burden were consistently associated with an elevated predicted risk, in line with the traditional clinical understanding. However, note that in the MIMIC internal validation set, these features sometimes showed "high values corresponding to negative contributions" in univariate analysis and SHAP interpretation. At first glance, this finding seems inconsistent with clinical experience but can be reasonably explained by the outcome definition in this study. In the MIMIC cohort, the outcome was defined using ICD codes for CIP and CIM rather than standardized muscle strength assessments for all patients. Consequently, the event group comprised patients with "clinically recognized and coded severe neuromuscular complications." Patients with more severe baseline conditions may experience earlier mortality or remain under deep sedation or consciousness impairment, thus lacking opportunities for neuromuscular complication identification. Therefore, these patients may not have been recorded as events and were classified in the non-event group. In other words, the model in the MIMIC cohort learned not only "who is more likely to develop weakness" but also "who is more likely to be recognized as CIP/CIM." This discrepancy between the internal and external SHAP feature contributions can, in part, be explained by this definition.
Glucose, a key metabolic marker, was included in the final model, indicating the potential role of metabolic disturbances in sepsis-associated neuromuscular damage. Hyperglycemia can exacerbate oxidative stress, affect mitochondrial energy metabolism, and disturb muscle protein turnover, negatively affecting muscle tissue homeostasis. CRRT use reflects severe renal dysfunction and the need for systemic organ support[18], highlighting that the occurrence of neuromuscular complications is not confined to single-organ injury. Rather, it is likely a result of the combined effects of systemic inflammation, metabolic imbalance, and organ failure.
Overall, the core features selected in this study were not isolated from one another but jointly created a comprehensive risk profile for patients with sepsis in the early ICU period. These variables collectively reflect the interplay between disease severity, treatment exposure, and underlying biological vulnerability of the patient, providing a more holistic understanding of the factors contributing to neuromuscular complications in sepsis.
-
In this study, seven machine-learning models were developed and compared. The results showed that while the gradient-boosting models demonstrated strong fitting ability in the training set, the random forest model exhibited superior overall performance and better stability in both the internal and external validation sets. Notably, in the external validation cohort, the random forest model achieved the highest AUC of 0.753, outperforming all other models, and showed strong potential in clinical applications, as evidenced by its accuracy, F1-Score, and decision curve analysis.
These findings have several methodological implications. First, compared to the initial model, the performance drop observed after restricting predictive variables, narrowing the time window, and excluding cumulative variables throughout the hospitalization process was both expected and more credible. In the original model, the use of cumulative treatment variables introduced strong posterior information, which could have led to an overestimation of model performance. By using only early ICU admission variables, this study enhanced the authenticity and clinical applicability of the model.
Second, the random forest model outperformed the gradient-boosting models in the external validation set, suggesting greater robustness in scenarios with small sample sizes, low event rates, and high data heterogeneity[17]. Unlike models that prioritize a high training performance, clinical prediction models require stable performance and generalizability across different data sources. From this perspective, while the optimal model identified in this study has a lower discriminative ability than the initial version, it more accurately reflects the realistic performance expected in clinical predictive research and is more adaptable for broader applications.
Additionally, the differences in SHAP results between internal and external validation sets also highlight that the "explanatory structure" of different models or the same model across data sets is not fixed, but is influenced by the outcome definition, sample composition, and clinical recognition process. This phenomenon does not indicate the instability of the model; rather, it suggests that the model learns a comprehensive pattern driven by the interplay of variables, outcomes, and recognition processes in real-world data. Therefore, when evaluating machine-learning models, it is essential not only to consider discriminative metrics such as AUC but also to focus on the consistency of model explanations and their clinical interpretability across different data environments.
-
The core value of this study is translating machine learning into a clinically actionable early risk assessment tool for sepsis-induced ICU-AW, which relies solely on routine clinical indicators (antibiotic use, mechanical ventilation, age, Charlson comorbidity index, SOFA score, glucose, and CRRT use) within 48 h of ICU admission. Without the need for complex dynamic monitoring or high-cost biomarkers, this tool has high feasibility and scalability for early sepsis risk stratification in ICUs. Several core features are clinically modifiable and can serve as risk signals to guide clinical management. SHAP analysis enhances the model’s interpretability, enabling clinicians to understand feature-driven individual risks. Differences in internal and external validation reveal the impact of outcome definitions on model interpretation, providing methodological insights for real-world clinical prediction models. This study has limitations: MIMIC-IV’s reliance on ICD codes instead of standardized muscle strength assessments may underestimate ICU-AW incidence and introduce bias, the small external validation sample and inter-center differences limit generalizability, static 48-h variables overlook dynamic disease changes, SHAP analysis lacks systematic exploration of feature interactions and causality, and the retrospective design also necessitates prospective validation of clinical applicability. Future research should integrate multi-center data with standardized muscle strength assessments; incorporate inflammatory, nutritional, and dynamic time-series data to build real-time models; explore feature interactions and causality; integrate the model into ICU information systems for bedside application; and conduct prospective studies to verify the model’s clinical impact on patient outcomes.
-
We utilized the MIMIC-IV v3.1 database, LASSO regression, and Boruta algorithm to identify seven core predictive features: antibiotic use, mechanical ventilation, age, Charlson comorbidity index, SOFA score, glucose level, and CRRT use. A risk-prediction model for severe neuromuscular complications in patients with sepsis was developed and validated. The results demonstrated that the random forest model exhibited strong discriminative ability, stability, and clinical applicability in both the internal and external validation sets. This model, which utilizes routine clinical information available early during ICU admission, can effectively identify high-risk patients and provide interpretable and individualized risk information through SHAP analysis.
These findings offer a new tool for the early risk assessment of sepsis-related neuromuscular complications and highlight that outcome definitions and clinical recognition mechanisms significantly impact the model’s learning structures and interpretation results in real-world data. This study provides empirical evidence for the future development and application of ICU-related predictive models.
doi: 10.3967/bes2026.063
Development and Validation of a Predictive Model for ICU-acquired Weakness in Sepsis Patients: An Interpretable Machine-learning Approach
-
Abstract:
Objective Intensive-care-unit–acquired weakness (ICU-AW), including critical illness polyneuropathy (CIP), critical illness myopathy (CIM), and critical illness neuromyopathy, is a common neuromuscular complication of sepsis. An interpretable machine-learning model for the early prediction of ICU-AW in patients with sepsis was developed and validated using the Medical Information Market for Intensive Care (MIMIC)-IV v3.1 database and local hospital data. Methods A total of 3,842 adult patients who met the Sepsis-3 criteria were enrolled to create the MIMIC-IV database. ICU-AW was defined as per International Classification of Diseases codes in the MIMIC cohort and with a Medical Research Council score of ≤ 48 in the external cohort. Baseline demographics, vital signs, severity scores, and laboratory data within the first 48 h of intensive care unit (ICU) admission were recorded. Features were selected using least absolute shrinkage and selection operator (LASSO) regression and the Boruta algorithm. The dataset was split into training and validation sets in a 7:3 ratio. Seven machine-learning models were constructed: LightGBM, XGBoost, logistic regression, Naïve Bayes, random forest, CatBoost, and a support vector machine. Model performance was assessed in terms of the area under the receiver operating characteristic curve (AUC), accuracy, sensitivity, specificity, calibration curves, and decision curve analysis. SHapley Additive explanations (SHAP) analysis was used to interpret the optimal model. Results Among 3,842 patients, 203 (5.28%) were diagnosed with CIM/CIP. Seven key features were selected using the LASSO and Boruta methods. The random forest model performed the best, with an AUC of 0.772 in the validation set and 0.753 in the external cohort. It exhibited good calibration and the highest net benefit. The SHAP analysis revealed that early antibiotic use, early mechanical ventilation, sequential organ failure assessment scores, and age were the main predictors of ICU-AW. Conclusion A random forest model using early ICU data could effectively predict the risk of ICU-AW in patients with sepsis and offer interpretation via SHAP. Thus, it may serve as a clinical decision-making tool for early risk identification and optimized prevention. -
Key words:
- Sepsis /
- ICU-acquired weakness /
- Machine learning /
- Explainable artificial intelligence /
- MIMIC-IV
The retrospective analysis based on the MIMIC-IV v3.1 database was approved by the Institutional Review Board of Massachusetts Institute of Technology (Approval No.: PRO13183446). All raw data of MIMIC-IV had been fully de-identified, therefore individual informed consent was waived by the institutional ethics committee. The external validation cohort study was approved by the Ethics Committee of Beijing Hospital of Traditional Chinese Medicine, Capital Medical University (Approval No.: 2025BL02-017-01). All clinical data from the local hospital were anonymized before statistical analysis to protect patient privacy.
Study design, data curation, statistical analysis, manuscript drafting: Yuan Du. literature retrieval, raw data preprocessing, partial result collation: Yuhong Guo, Haoran Ye, Ziheng Gao. Project supervision, research scheme revision, critical revision of manuscript content: Qingquan Liu#. Concept formulation,final manuscript review and submission administration: Shuo Wang#. All authors read and approved the final version of the submitted manuscript.
The MIMIC-IV v3.1 raw dataset supporting internal validation is publicly available on the PhysioNet repository . Restrictions apply to the local real-world clinical dataset from Beijing Hospital of Traditional Chinese Medicine owing to hospital patient privacy regulations; relevant anonymized aggregate data are available from the corresponding author upon reasonable written request after institutional permission approval. The supplementary materials will be available in www.besjournal.com.
注释:1) Competing Interests: 2) Ethics: 3) Authors’ Contributions: 4) Data Sharing: -
Figure 1. Least absolute shrinkage and selection operator (LASSO) regression for variable selection in the MIMIC cohort. (A) Cross-validation plot for LASSO regression, showing the relationship between log (lambda) and cross-validation mean (CVM). The red dashed line denotes the minimum CVM lambda, and the blue dashed line represents the 1-standard-error lambda. (B) Coefficient profiles of variables across different log(lambda) values, demonstrating the shrinkage of coefficients to zero with increasing lambda.
Figure 2. Feature importance ranks based on the Boruta algorithm. Variables are ranked as per their importance scores, with higher values representing stronger predictive power.
Figure 3. Performance evaluation of machine-learning models for predicting ICU-acquired weakness (ICU-AW) in patients with sepsis in the training set. (A) Receiver operating characteristic (ROC) curves of seven machine-learning models: Bayes, CatBoost, LightGBM, logistic regression, random forest, support vector machine (SVM), and XGBoost, for discrimination of ICU-AW. The area under the curve (AUC) for each model is presented in the legend. (B) Decision curve analysis (DCA) showing the clinical net benefit of each model across a range of threshold probabilities. The solid black line represents the strategy of treating all patients, and the dashed gray line represents the strategy of treating none. (C) Calibration curves of the seven models, comparing predicted probabilities with observed proportions of ICU-AW. The diagonal dashed line indicates perfect agreement between predicted and observed risk. Values in parentheses represent the corresponding calibration errors for each model.ROC, receiver operating characteristic; AUC, area under the curve; DCA, decision curve analysis; SVM, support vector machine; ICU-AW, intensive care unit-acquired weakness.
Figure 4. Performance evaluation of machine-learning models for predicting ICU-acquired weakness (ICU-AW) in sepsis patients in the internal validation and external test sets.
(A, B) Receiver operating characteristic (ROC) curves of seven machine-learning models: Bayes, CatBoost, LightGBM, logistic regression, random forest, support vector machine (SVM), and XGBoost. Panel (A) represents the internal validation set, and panel (B) represents the external test set. The area under the curve (AUC) for each model is shown in the legend. (C, D) Decision curve analysis (DCA) showing the clinical net benefit of each model across a range of threshold probabilities. Panel (C) corresponds to the internal validation set, and panel (D) corresponds to the external test set. The solid black line indicates the “treat all” strategy, and the dashed gray line indicates the “treat none” strategy. (E, F) Calibration curves comparing predicted probabilities with observed proportions of ICU-AW. Panel (E) represents the internal validation set, and panel (F) represents the external test set. The diagonal dashed line indicates perfect agreement between predicted and observed risk. Values in parentheses represent calibration errors for each model.
Figure 5. SHAP-based interpretation of the machine-learning model for predicting ICU-acquired weakness (ICU-AW) in patients with sepsis. (A) SHAP feature importance plot showing the mean absolute SHAP values of each feature, reflecting their overall contribution to the prediction of ICU-AW. Features are ranked in descending order of importance, with antibiotics and mechanical ventilation being the most influential predictors. (B) SHAP beeswarm plot illustrating the distribution of SHAP values for each feature across all samples. Each point represents an individual patient, with color indicating the feature value (yellow for low, purple for high). The horizontal position reflects the impact of the feature on the model output, where positive SHAP values indicate increased risk of ICU-AW and negative values indicate decreased risk.SHAP, SHapley Additive exPlanations; SOFA, Sequential Organ Failure Assessment; CRRT, continuous renal replacement therapy; ICU-AW, intensive care unit-acquired weakness.
Table 1. Baseline Characteristics of the Study Population Stratified as per Outcome (MIMIC Cohort)
Variable Levels N Overall Sepsis ICU-AW P-value N = 3,842 N = 3,639 N = 203 Age 3,842 66.17 (15.39) 66.40 (15.41) 62.10 (14.60) < 0.001 SOFA score 3,842 8.50 (3.81) 8.52 (3.81) 8.00 (3.74) 0.057 Charlson comorbidity index 3,842 5.86 (3.05) 5.91 (3.06) 4.87 (2.78) < 0.001 Albumin 3,842 2.71 (0.63) 2.71 (0.63) 2.74 (0.65) 0.485 White blood cells 3,842 15.41 (12.99) 15.41 (12.76) 15.47 (16.60) 0.959 Creatinine 3,842 2.08 (1.88) 2.09 (1.88) 1.87 (1.84) 0.098 Potassium 3,842 4.26 (0.84) 4.26 (0.84) 4.32 (0.87) 0.35 Sodium 3,842 137.67 (6.62) 137.63 (6.65) 138.30 (6.01) 0.128 Urea nitrogen 3,842 39.06 (29.41) 39.24 (29.46) 35.82 (28.37) 0.097 Glucose 3,842 8.78 (5.28) 8.75 (5.18) 9.46 (6.84) 0.147 HR 3,842 97.92 (21.94) 97.90 (21.85) 98.20 (23.56) 0.861 NBPM 3,842 78.44 (19.54) 78.11 (19.50) 84.23 (19.46) < 0.001 RR 3,842 21.74 (6.94) 21.71 (6.92) 22.35 (7.37) 0.225 SpO2 3,842 95.94 (4.82) 95.96 (4.84) 95.65 (4.50) 0.337 Temperature 3,842 36.89 (0.89) 36.88 (0.90) 37.09 (0.73) < 0.001 Platelet 3,842 205.12 (132.09) 204.75 (132.92) 211.83 (116.41) 0.404 Lactate 3,842 2.77 (2.39) 2.79 (2.39) 2.50 (2.22) 0.07 APACHE Ⅱ 3,842 23.68 (7.33) 23.71 (7.28) 23.07 (8.17) 0.278 Sex 3,842 0.726 0 1,639.00 (42.66%) 1,550.00 (42.59%) 89.00 (43.84%) 1 2,203.00 (57.34%) 2,089.00 (57.41%) 114.00 (56.16%) CRRT 3,842 0.4 0 3,419.00 (88.99%) 3,242.00 (89.09%) 177.00 (87.19%) 1 423.00 (11.01%) 397.00 (10.91%) 26.00 (12.81%) Ventilation 3,842 < 0.001 0 1,584.00 (41.23%) 1,469.00 (40.37%) 115.00 (56.65%) 1 2,258.00 (58.77%) 2,170.00 (59.63%) 88.00 (43.35%) Antibiotics 3,842 < 0.001 0 3,607.00 (93.88%) 3,496.00 (96.07%) 111.00 (54.68%) 1 235.00 (6.12%) 143.00 (3.93%) 92.00 (45.32%) Glucocorticoids 3,842 0.503 0 3,308.00 (86.10%) 3,130.00 (86.01%) 178.00 (87.68%) 1 534.00 (13.90%) 509.00 (13.99%) 25.00 (12.32%) Note. For categorical variables, a score of 0 indicates non-use/non-administration of the intervention and 1 indicates use/administration of the intervention (sex: 0 = female, 1 = male; CRRT/Ventilation/Antibiotics/Glucocorticoids: 0 = not used, 1 = used). ICU-AW = intensive-care-unit-acquired weakness; CRRT = continuous renal replacement therapy; HR = heart rate; NBPM = mean arterial pressure; RR = respiratory rate; SpO2 = oxygen saturation; SOFA = sequential organ failure assessment; APACHE II = acute physiology and chronic health evaluation II.  下载: 导出CSV
Table 2. Baseline Characteristics of the Study Population as per Outcome Group (Hospital Database)
Variable Levels N Overall Sepsis ICU-AW P-value N = 119 N = 59 N = 60 Age, mean 119 77.64 (10.93) 76.37 (11.81) 78.88 (9.92) 0.212 Glucose 119 8.89 (1.39) 8.33 (1.23) 9.46 (1.33) < 0.001 SOFA score 119 8.03 (2.21) 7.12 (1.90) 8.93 (2.12) < 0.001 Charlson 119 7.65 (2.19) 7.15 (2.21) 8.13 (2.08) 0.014 CRRT 119 0.098 0 113.00 (94.96%) 58.00 (98.31%) 55.00 (91.67%) 1 6.00 (5.04%) 1.00 (1.69%) 5.00 (8.33%) Ventilation 119 < 0.001 0 40.00 (33.61%) 36.00 (61.02%) 4.00 (6.67%) 1 79.00 (66.39%) 23.00 (38.98%) 56.00 (93.33%) Antibiotics 119 < 0.001 0 38.00 (31.93%) 38.00 (64.41%) 0.00 (0.00%) 1 81.00 (68.07%) 21.00 (35.59%) 60.00 (100.00%) Note. Codes for categorical variables: CRRT, Ventilation, Antibiotics (0 = not used, 1 = used). ICU-AW = intensive-care-unit–acquired weakness; CRRT = continuous renal replacement therapy; SOFA = sequential organ failure assessment; Charlson = Charlson comorbidity index. This cohort served as the external validation set from Beijing Hospital of Traditional Chinese Medicine, Capital Medical University, where ICU-AW was diagnosed using a Medical Research Council (MRC) muscle strength score of ≤ 48.
下载: 导出CSV
-
[1] Fan E, Cheek F, Chlan L, et al. An official American thoracic society clinical practice guideline: the diagnosis of intensive care unit-acquired weakness in adults. Am J Respir Crit Care Med, 2014; 190, 1437−46. doi: 10.1164/rccm.201411-2011ST [2] Chen J, Huang M. Intensive care unit-acquired weakness: recent insights. J Intensive Med, 2024; 4, 73−80. doi: 10.1016/j.jointm.2023.07.002 [3] Gu B, Zhou Y, Shi R, et al. Use of muscular ultrasound to detect intensive care unit-acquired weakness: a systematic review and meta-analysis. Shock, 2025; 63, 19−29. doi: 10.1097/SHK.0000000000002484 [4] Boelens YFN, Melchers M, van Zanten ARH. Poor physical recovery after critical illness: incidence, features, risk factors, pathophysiology, and evidence-based therapies. Curr Opin Crit Care, 2022; 28, 409−16. doi: 10.1097/mcc.0000000000000955 [5] Meyer-Frießem CH, Malewicz NM, Rath S, et al. Incidence, time course and influence on quality of life of intensive care unit-acquired weakness symptoms in long-term intensive care survivors. J Intensive Care Med, 2021; 36, 1313−22. doi: 10.1177/0885066620949178 [6] Bellaver P, Schaeffer AF, Leitao CB, et al. Association between neuromuscular blocking agents and the development of intensive care unit-acquired weakness (ICU-AW): a systematic review with meta-analysis and trial sequential analysis. Anaesth Crit Care Pain Med, 2023; 42, 101202. doi: 10.1016/j.accpm.2023.101202 [7] Peñuelas O, Keough E, López-Rodríguez L, et al. Ventilator-induced diaphragm dysfunction: translational mechanisms lead to therapeutical alternatives in the critically ill. Intensive Care Med Exp, 2019; 7, 48. doi: 10.1186/s40635-019-0259-9 [8] Schefold JC, Bierbrauer J, Weber-Carstens S. Intensive care unit-acquired weakness (ICUAW) and muscle wasting in critically ill patients with severe sepsis and septic shock. J Cachexia Sarcopenia Muscle, 2010; 1, 147−57. doi: 10.1007/s13539-010-0010-6 [9] Mankowski RT, Laitano O, Darden D, et al. Sepsis-induced myopathy and gut microbiome dysbiosis: mechanistic links and therapeutic targets. Shock, 2022; 57, 15−23. doi: 10.1097/SHK.0000000000001843 [10] Pierre A, Favory R, Brassart B, et al. Sepsis induces long-term muscle and mitochondrial dysfunction due to autophagy disruption amenable by urolithin A. J Cachexia Sarcopenia Muscle, 2025; 16, e70041. doi: 10.1002/jcsm.70041 [11] Zhou Y, Sun YJ, Pan YF, et al. Risk prediction models for intensive care unit-acquired weakness in critically ill patients: a systematic review. Aust Crit Care, 2025; 38, 101066. doi: 10.1016/j.aucc.2024.05.003 [12] Guo Y, Shan WP, Xiang J. Predictive modeling of ICU-AW inflammatory factors based on machine learning. BMC Neurol, 2024; 24, 483. doi: 10.1186/s12883-024-03981-w [13] Zhang YM, Wang Y, Yang JR, et al. Development and validation of machine learning-based risk prediction models for ICU-acquired weakness: a prospective cohort study. Eur J Med Res, 2025; 30, 666. doi: 10.1186/s40001-025-02930-8 [14] Mușat F, Păduraru DN, Bolocan A, et al. Machine learning models in sepsis outcome prediction for ICU patients: integrating routine laboratory tests-a systematic review. Biomedicines, 2024; 12, 2892. doi: 10.3390/biomedicines12122892 [15] Yang J, Yan CH, Chen SL, et al. The possible mechanisms of ferroptosis in sepsis-associated acquired weakness. Front Physiol, 2024; 15, 1380992. doi: 10.3389/fphys.2024.1380992 [16] Ojima M, Shimizu K, Motooka D, et al. Gut dysbiosis associated with antibiotics and disease severity and its relation to mortality in critically Ill patients. Dig Dis Sci, 2022; 67, 2420−32. doi: 10.1007/s10620-021-07000-7 [17] Tran A, Walsh CJ, Batt J, et al. A machine learning-based clinical tool for diagnosing myopathy using multi-cohort microarray expression profiles. J Transl Med, 2020; 18, 454. doi: 10.1186/s12967-020-02630-3 [18] Bian L, Wang FB, Yang Y, et al. Monotropein alleviates sepsis-induced spleen injury by inhibiting the NF-κB/NLRP3 axis and activating the Nrf2 pathway. Biomed Environ Sci, 2025; 38, 270−6. [19] Fuentes-Aspe R, Gutierrez-Arias R, González-Seguel F, et al. Which factors are associated with acquired weakness in the ICU? An overview of systematic reviews and meta-analyses. J Intensive Care, 2024; 12, 33. doi: 10.1186/s40560-024-00744-0 [20] Ding M, Yang CF, Qin YL, et al. Risk factors and 6-month outcomes of paediatric intensive care unit-acquired weakness. Aust Crit Care, 2025; 38, 101294. doi: 10.1016/j.aucc.2025.101294 [21] Yang Z, Wang XH, Wang FY, et al. A systematic review and meta-analysis of risk factors for intensive care unit acquired weakness. Medicine (Baltimore), 2022; 101, e31405. doi: 10.1097/MD.0000000000031405 [22] Liu YY, Li LF. Ventilator-induced diaphragm dysfunction in critical illness. Exp Biol Med (Maywood), 2018; 243, 1329−37. -

 点击查看大图
计量
- 文章访问数: 18
- HTML全文浏览量: 6
- PDF下载量: 0
- 被引次数: 0

 Quick Links