-
Occupational noise is among the most common risks associated with the wellbeing of employees. Occupational exposure to noise causes disabling hearing loss in 16% of adults worldwide[1]. It has been acknowledged that noise-induced hearing loss (NIHL) is a multifactorial disease, having both genetic and environmental factors. NIHL continues to be permanent as well as irreversible, but NIHL can be prevented. As demonstrated by the latest research, excessive oxidative stress in the cochlea has a close link with the pathogenesis of NIHL[2], which highlights the fact that appropriate control of oxidative stress is a productive strategy for preventing the increase in prevalence and progression of NIHL.
The transcription factor, NRF2, is considered to be the primary regulator of detoxifying and antioxidant genes, and provides feedback to oxidative and electrophilic stress[3]. Different NRF2-activating reagents have been identified, followed by application of ischemia-reperfusion damage (IRI) in animal trials, which revealed productive enhancement of pathologic states in most cases[4]. Furthermore, high NRF2 activity benefits the cochlea against noise-induced damage, suggesting that NRF2 can serve as a major target for the prevention of NIHL.
As previously reported, single nucleotide polymorphisms (SNPs) exist in CDH23, and the HSP70, EYA4, GRHL2, and DFNA5 genes[5] are linked with genetic vulnerability to NIHL. Growing evidence supports the viewpoint that suggests SNPs perform substantial functions in human ailments; however, no research has been conducted involving NIHL with SNPs and the functional relevance to the human NRF2 locus. A number of SNPs exhibit linkage disequilibrium (LD) or correlated genotypes, which indicates that a subset of SNPs (tagSNPs) requires genotyping to study the illness links. Therefore, a case-control study was conducted to elucidate the associations between four NRF2 tagSNPs (rs6721961, rs1962142, rs6726395, and rs77684420) with genetic vulnerability for NIHL.
The subjects in the current study were industrial workers who received annual health examinations performed at the Jiangsu Provincial Center for Disease Prevention and Control. An aggregate number of 2, 971 persons took part in the health examinations. Subject information was collected by questionnaire, which was administered by face-to-face interviews with trained interviewers. Prior to the investigation, informed consent was also obtained from each participant. This research received approval of the Institutional Review Board of Jiangsu Provincial Centre for Disease Prevention and Control.
Noise exposure levels were assessed with sound pressure individual noise meters (Noise-Pro, Quest, USA), three times a year of each workplace. To evaluate the actual noise exposure level, the result was recorded by Lex, 8 h (normalization of equivalent continuous A weighted sound pressure to a nominal 8 h a day). The noise level for each subject was steady. Audiometry was performed by experienced physicians in a soundproof room using a Madsen Voyager 522 audiometer (Kastrup, Denmark). We clearly defined noise exposure, hearing loss, and standard hearing by comprehensive consideration of ISO 2013: 1999 (acoustics-estimation of NIHL).
The participants in the current study were exposed to > 85 dB(A) for 8 h a day (time-weighted average). Hearing loss was defined as binaural hearing limits (all > 25 dB) at high frequencies (3, 000, 4, 000, and 6, 000 Hz), in addition to the speech frequencies (500, 1, 000, and 2, 000 Hz). The high frequency hearing threshold was in the range of 3-6 kHz. Similarly, standard hearing indicated that the binaural hearing limits were all < 25 dB at high frequencies, together with the speech frequencies. Achievement of the hearing limits was made from the findings of PTA. The participants were divided into two groups [NIHL and control (noise-exposed individuals with standard hearing)]. We selected the NIHL workers and then controls were matched to them. The matching was based on sex, age, and personal daily noise exposure level. Eventually, 570 NIHL patients and 570 controls were selected from all eligible subjects.
Peripheral blood (5 mL) was collected in EDTA, followed by DNA isolation and genotyping. DNA was extracted from the blood specimens using QIAcube HT Plasticware and a QIAamp 96 DNA QIAcube HT Kit (Qiagen, Dusseldorf, Germany) per the manufacturer's guidelines, followed by storage at a temperature of -80° until use.
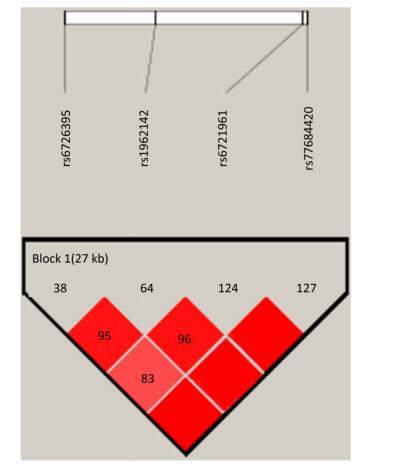
Identification of the potentially functional polymorphisms was done to meet the following criteria: situated in the 5' surrounding genes; 5' UTR; 3' UTR; or coding areas with amino acid alterations (the intron regions). The following four candidate NRF2 SNPs were confirmed following these criteria: rs6721961; rs1962142; rs6726395; and rs77684420. We then calculated the correlation coefficient (R2) for each pair of the four SNPs that were in complete linkage disequilibrium (LD; R2 > 0.80; Supplementary Figure S1 available in www.besjournal.com). We eventually chose the SNPs in the NRF2 gene (rs6721961, rs1962142, rs6726395, and rs77684420). General information of the SNPs and findings associated with the Hardy-Weinberg test are presented in Supplementary Table S1 (available in www.besjournal.com). The SNPs (rs6721961, rs1962142, rs6726395, and rs77684420) are located in the 5' near gene, together with an intron variant (upstream variant 2KB) of the NRF2 gene. Moreover, χ2 tests showed that all SNPs were in Hardy-Weinberg balance (P > 0.05).
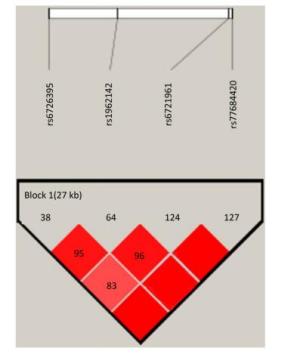
Figure Supplementary Figure S1. Reconstructed linkage disequilibrium (LD) plot for the four single-nucleotide polymorphisms (SNPs) in 570 control subjects.
Table Supplementary Table S1. General Information of Selected SNPs and Hardy-Weinberg Test
SNP Chromosome Functional Consequence MAF P for HWEb Tagsnps Regulome DB Control Databasea function annotation score rs6721961 2:177265309 5' near gene (upstream variant 2KB) 0.78 0.15 0.38 rs2001350; bhrs10497511; rs2001297 rs4243387; rs2364720; rs10188107 Protein Binding; Chromatin structure; Histone modifications 4 rs1962142 2:177248756 Intron variant 0.52 0.11 0.47 rs1962142 Chromatin structure; Histone modifications 5 rs6726395 2:177238501 Intron variant 2.74 0.43 0.1 rs10803905; rs2364717; rs2364724; rs4893819; rs236472; rs6726395; rs2886162 Protein Binding; Motifs; Histone modifications 5 rs77684420 2:177265699 5' near gene (upstream variant 2KB) 0.8 0.06 0.37 rs77684420 Protein Binding; Chromatin structure; Histone modifications 4 Genotyping was carried out using the TaqMan SNP Genotyping Assay with the 384-well ABI 7900HT Real-time PCR System (Applied Biosystems, Foster City, CA, USA). Arrangement of four blank controls was made in each of the plates for the purpose of ensuring the accuracy of the genotyping. Subsequent to the amplification, the use of SDS 2.3 automated software was made for allelic discrimination. Performance of the analysis was made by two blinded individuals. Ten percent of the specimens were randomly selected for the purpose of repeating the assays. The findings exhibited 100% concordance.
Statistical analysis was performed using SAS 9.2 software (SAS Institute, Cary, NC, USA). Performance of the goodness-of-fit χ2 test was made for the Hardy-Weinberg equilibrium rule of the SNPs in the NRF2 gene among the control subjects. Representation of the categorical variables has been made as the percentages. In addition, the continued variables have been stated as the mean ± SD. Odds ratios (ORs) and 95 percent confidence intervals (95% CIs) of the genotypes were obtained, subjected to the conditional logistic regression frameworks, and attenuated in accordance with the age, sex, smoking, as well as alcohol consumption. Comparison of the dissimilarities in the allele-specific promoter function and gene expression was conducted with Student's t-test or paired t-test. Computation of linkage disequilibrium between polymorphisms was approximated with the use of D' and R2. In addition, characterization of these patterns was manifested with the help of Haploview 4.1 software. Correction of the haplotype P value (Pc) was done using Sidak, Holm's correction, wherein a P < 0.05 was utilized as the cut-off for statistical significance.
The characteristics and clinical features of the NIHL cases and controls are shown in Supplementary Table S2 (available in www.besjournal.com). The findings revealed statistically significant dissimilarity between the NIHL cases and controls with respect to the high frequency hearing threshold. The average high frequency hearing limit was greater for the NIHL patients (37.4 ± 11.8) compared to the controls (14.1 ± 4.6; P < 0.001).
Table Supplementary Table S2. Demographic Characteristics and Clinical Features
Variables Cases (n = 570) Controls (n = 570) P n % n % Age (years) 0.477* Mean ± SD 40.4 ± 6.5 >40.6 ± 6.4 0.771** ≤ 40 284 49.8 272 47.7 > 40 286 50.2 298 52.3 Sex 0.907* Male 531 93.2 530 93 Female 39 6.8 40 7 Smoking 0.523* Now 331 58.1 313 54.9 Ever 13 2.3 16 2.8 Never 226 39.6 241 42.3 Drinking 0.998* Now 239 41.9 240 42.1 Ever 11 1.9 11 1.9 Never 320 56.2 319 56 All work time (years) 0.515* Mean ± SD >20.9 ± 7.2 >20.5 ± 7.3 0.377** ≤ 21 276 48.4 287 50.4 > 21 294 51.6 283 49.6 Work time with noise (years) 0.373* Mean ± SD 18.5 ± 7.8 18.0 ± 7.6 0.234** ≤ 16 255 44.7 270 47.4 > 16 315 55.3 300 52.6 Noise exposure level (dB) 0.139* Mean ± SD >87.18 ± 7.72 >87.39 ± 7.39 0.651** ≤ 85 253 44.7 249 44 85-92 109 19.3 101 17.8 > 92 204 36 216 38.2 High frequency hearing threshold (dB) < 0.001* Mean ± SD >37.4 ± 11.8 >14.1 ± 4.6 < 0.001** ≤ 26 57 10 570 100 > 26 513 90 0 0 Using earplug 0.457* Often 383 67.2 396 69.5 Sometimes 43 7.5 33 5.8 Never 144 25.3 141 24.7 Family history 285 0.060* No 441 99.3 402 97.8 Yes 3 0.7 9 2.2 In the current study a genetic association analysis involved four NRF2 tagSNPs (rs6721961, rs1962142, rs6726395, and rs77684420) in 570 NIHL patients as well as 570 controls. As highlighted by the results, the C allele in NRF2 rs77684420 had a link with a substantially greater risk of NIHL (Table 1). Moreover, the G allele in NRF2 rs6726395 had a link with a substantially lowered risk of NIHL. Greater than 84 million SNPs have been shown across humans from multiple populations. A typical genome differs from the reference human genome at 4-5 million sites, most of which (> 99.9%) consist of SNPs and short indels[6]. The NRF2 SNP influences the NRF2 transcription level, and individuals that possess the SNP that lowers NRF2 expression[7].
Table 1. Distribution of Four Polymorphisms and the Association with NIHL
Genetic Models Genotypes Cases Controls Pa Adjusted OR (95% CI) n = 570 % n = 570 % rs6721961 n = 563 n = 561 Codominant GG 287 50.4 279 48.9 1.00 (Ref.) AG 222 38.9 227 39.8 0.71 0.95 (0.74-1.22) AA 54 9.5 55 9.6 0.84 0.96 (0.64-1.45) Dominant GG 287 50.4 279 48.9 1.00 (Ref.) AG/AA 276 48.4 282 49.4 0.92 0.98 (0.66-1.46) Recessive GG/AG 509 89.3 506 88.7 1.00 (Ref.) AA 54 9.5 55 9.6 0.70 0.95 (0.75-1.21) Alleles G 796 70.7 785 70.0 1.00 (Ref.) A 330 29.3 337 30.0 0.73 1.03 (0.86-1.24) rs1962142 n = 567 n = 567 Codominant AA 332 58.2 327 57.4 1.00 (Ref.) AG 205 36.0 203 35.6 0.99 1.00 (0.78-1.27) GG 30 5.3 37 6.5 0.38 0.80 (0.48-1.32) Dominant AA 332 58.2 327 57.4 1.00 (Ref.) AG/GG 235 41.3 240 42.1 0.37 0.80 (0.48-1.31) Recessive AA/AG 537 94.2 530 93 1.00 (Ref.) GG 30 5.3 37 6.5 0.78 0.97 (0.76-1.22) Alleles A 869 76.6 857 75.6 1.00 (Ref.) G 265 23.4 277 24.4 0.57 0.95 (0.78-1.15) rs6726395 n = 559 n = 564 Codominant AA 201 35.3 153 26.8 1.00 (Ref.) AG 271 47.5 300 53.5 < 0.01 0.67 (0.52-0.88) GG 87 15.3 111 18.6 < 0.01 0.63 (0.44-0.89) Dominant AA 201 35.3 153 26.8 1.00 (Ref.) AG/GG 358 62.8 411 72.1 0.16 0.80 (0.58-1.09) Recessive AA/AG 472 82.8 453 80.3 1.00 (Ref.) GG 87 15.3 111 18.6 < 0.01 0.66 (0.51-0.85) Alleles A 673 60.2 606 53.7 1.00 (Ref.) G 445 39.8 522 46.27 < 0.01 0.78 (0.66-0.93) rs77684420 n = 562 n = 567 Codominant TT 419 73.5 445 78.1 1.00 (Ref.) TC 128 22.5 117 20.5 0.29 1.16 (0.87-1.54) CC 15 2.6 5 0.9 0.03 3.16 (1.13-8.80) Dominant TT 419 73.5 445 78.1 1.00 (Ref.) TC/CC 143 25.1 122 21.4 0.03 3.06 (1.10-8.50) Recessive TT/TC 547 96 562 98.6 1.00 (Ref.) CC 15 2.6 5 0.9 0.11 1.24 (0.94-1.64) Alleles T 966 85.9 1007 88.8 1.00 (Ref.) C 158 14.1 127 11.2 0.04 1.30 (1.00-1.66) Note. aAdjusted for age, sex, smoking, and alcohol consumption in the logistic regression model. Figure 1 highlights the key findings of the comparison of high frequency hearing threshold shifts of the rs6721961, rs1962142, rs6726395, and rs77684420 genotypes in noise-exposed workers. Individuals with the rs77684420 CC genotype were observed to have a greater high frequency hearing threshold shift compared with individuals having TC and the TT genotypes (P = 0.004 and 0.004, respectively). Individuals with the rs6726395 AA genotype exhibited a substantially greater high frequency hearing threshold shift compared with the AG and GG genotype (P = 0.008 and 0.005, respectively). Individuals with the combination of rs6726395 AA and rs77684420 CC had a substantially greater high frequency hearing threshold shift compared with rs6726395 TT and rs77684420 GG (P < 0.05) Supplementary Figure S2 (available in www.besjournal.com). The combination of 4s6721961 GG, rs1962142 AA, rs6726395 AA, and rs77684420 CC was also associated with greater high frequency hearing threshold shift compared with rs77684420 TT, rs1962142 GG, rs6721961 AG, and rs6726395 GG (P < 0.05), Supplementary Figure S3 (available in www.besjournal.com). Subsequent haplotype analysis revealed that the rs6726395 A, rs1962142 A, rs6721961 G, and rs77684420 C haplotype increased the risk of NIHL (P < 0.05). A human SNP that reduces the transcription level of the NRF2 gene was significantly associated with impaired hearing levels in a cohort of Japan Self-Defense Force (JSDF) members subjected to occupational noise exposure, which strongly supported the notion that higher NRF2 activity was beneficial for cochlear protection from the oxidative damage induced by excessive noise[8].
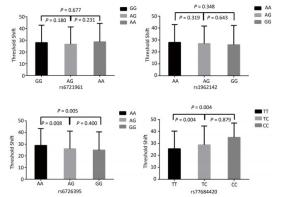
Figure 1. Comparison of high frequency hearing threshold shift of four SNPs. Comparison of high frequency hearing threshold shift of rs6721961, rs1962142, rs6726395, and rs77684420 genotypes in all subjects. Data have been presented as the mean ± SE, followed by ANOVA.
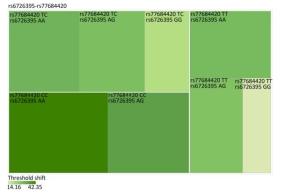
Figure Supplementary Figure S2. Heatmap based on high-frequency hearing threshold shift of the combination of rs6726395 and rs77684420.
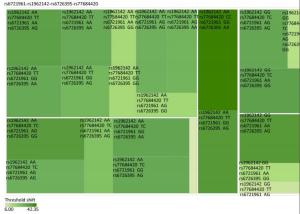
Figure Supplementary Figure S3. Heatmap based on the high frequency hearing threshold shift of the combination of rs77684420 TT, rs1962142 GG, rs6721961 AG, and rs6726395 GG.
Accordingly, the NRF2 activation is optimally used for preventing NIHL for the purpose of managing noise exposure. There are reports of numerous compounds safeguarding the internal ear from the NIHL with the help of enhancing antioxidant capacity[9], wherein some constitute the downstream objects of the KEAP1-NRF2 system or their mimetics, such as GSH, in addition to glutathione monoethylester (GSHE) and N-acetylcysteine (NAC). Although NRF2 activity is primarily regulated through protein stability by KEAP1-dependent ubiquitination, the transcription level of the NRF2 gene provides another layer of regulation of NRF2 activity. Indeed, transcriptional regulation of NRF2 has been shown to impact the susceptibility to various pathological conditions in mice and humans[10].
A haplotype is linked to SNP alleles that tend to always occur together. It is thought that identifying these statistical associations and few alleles of a specific haplotype sequence can facilitate identifying all other such polymorphic sites that are nearby on the chromosome. Such information is critical for investigating the genetics of common diseases which have been investigated in humans by the International HapMap Project. The haplotype frequencies of the four tagSNPs were analysed between NIHL cases and controls (Table 2). The protection is even more significant in comparison with the haplotype (rs6726395 G, rs1962142 A, rs6721961 G, and rs77684420 T) lowered the risk of NIHL (OR = 0.64, 95% CI = 0.50-0.83; P < 0.001). The results were consistent with our findings that NRF2 polymorphisms likely contribute to NIHL vulnerability. This was the foremost association study, highlighting that rs6726395 and rs77684420 and the haplotype, rs6726395 A, rs1962142 A, rs6721961 G, and rs77684420 C, in the NRF2 gene had a correlation with an augmented risk of NIHL in Chinese people. In the current study we demonstrated a significant association between the SNP and the susceptibility to an elevation of the hearing threshold shift in individuals who were chronically exposed to occupational noise.
Table 2. Frequencies of Inferred Haplotypes among the Cases and Controls and Their Association with Risk NIHL
Haplotypesa Case (n = 566) Control (n = 566) Pb Holm SidakSS SidakSD Adjusted OR (95% CI)c Global Pd n % n % AAGT 475 42.9 445 40 0.200 0.600 0.945 0.488 1.12 (0.94-1.32) 0.005 AAGC 148 13.3 119 10.7 0.058 0.235 0.545 0.215 1.28 (1.19-1.65) GAGT 117 10.5 172 15.4 < 0.001 0.003 0.008 0.003 0.64 (0.50-0.83) GAAT 69 6.2 73 6.5 0.728 0.794 0.999 0.728 0.94 (0.67-1.32) GGAT 215 19.4 230 20.6 0.397 0.794 0.998 0.636 0.92 (0.75-1.13) Note. aAlleles of the haplotypes were arrayed as rs6726395, rs1962142, rs6721961, and rs77684420. Haplotypes with a frequency < 0.03 were ignored. bTwo-sided χ2 test. cAdjusted for the age, gender, smoking, and alcohol consumption in the logistic regression model. dGenerated by the permutation test with 1, 000 times of simulation. The current research work had a number of potential limitations. (ⅰ) The sample size of our study was relatively larger compared to previous research; however, the power of statistical tests may not be fully sufficient due to the lower biological effects of an individual SNP. Thus, an extended sample size and group investigations are prospectively required for the purpose of confirming the impact of NRF2 polymorphisms on NIHL. (ⅱ) The study subjects of this case-control study were Chinese. Thus, our results may likely be better generalized to Chinese Han and limit external generalizability.
In brief, our current research work provided evidence that suggested persons with a G allele (NRF2 tagSNP rs6726395) in addition to rs77684420 and the rs6726395, rs1962142, rs6721961, and rs77684420 haplotype had associations with an augmented risk of NIHL. In accordance with our findings, the genetic polymorphism existing inside the NRF2 gene was likely to perform a critical function in not only the prevalence, but development of NIHL. Nevertheless, there is a need to conduct further studies for the purpose of confirming our observations using a greater sample size and diverse racial populations.
The authors thank all of the participants.
The authors declared no potential conflicts of interest with respect to the research, authorship, and/or publication of this article.
doi: 10.3967/bes2019.063
Association between NFE2L2 Gene Polymorphisms and Noise-induced Hearing Loss in a Chinese Population
-
-
Supplementary Table S1. General Information of Selected SNPs and Hardy-Weinberg Test
SNP Chromosome Functional Consequence MAF P for HWEb Tagsnps Regulome DB Control Databasea function annotation score rs6721961 2:177265309 5' near gene (upstream variant 2KB) 0.78 0.15 0.38 rs2001350; bhrs10497511; rs2001297 rs4243387; rs2364720; rs10188107 Protein Binding; Chromatin structure; Histone modifications 4 rs1962142 2:177248756 Intron variant 0.52 0.11 0.47 rs1962142 Chromatin structure; Histone modifications 5 rs6726395 2:177238501 Intron variant 2.74 0.43 0.1 rs10803905; rs2364717; rs2364724; rs4893819; rs236472; rs6726395; rs2886162 Protein Binding; Motifs; Histone modifications 5 rs77684420 2:177265699 5' near gene (upstream variant 2KB) 0.8 0.06 0.37 rs77684420 Protein Binding; Chromatin structure; Histone modifications 4 Supplementary Table S2. Demographic Characteristics and Clinical Features
Variables Cases (n = 570) Controls (n = 570) P n % n % Age (years) 0.477* Mean ± SD 40.4 ± 6.5 >40.6 ± 6.4 0.771** ≤ 40 284 49.8 272 47.7 > 40 286 50.2 298 52.3 Sex 0.907* Male 531 93.2 530 93 Female 39 6.8 40 7 Smoking 0.523* Now 331 58.1 313 54.9 Ever 13 2.3 16 2.8 Never 226 39.6 241 42.3 Drinking 0.998* Now 239 41.9 240 42.1 Ever 11 1.9 11 1.9 Never 320 56.2 319 56 All work time (years) 0.515* Mean ± SD >20.9 ± 7.2 >20.5 ± 7.3 0.377** ≤ 21 276 48.4 287 50.4 > 21 294 51.6 283 49.6 Work time with noise (years) 0.373* Mean ± SD 18.5 ± 7.8 18.0 ± 7.6 0.234** ≤ 16 255 44.7 270 47.4 > 16 315 55.3 300 52.6 Noise exposure level (dB) 0.139* Mean ± SD >87.18 ± 7.72 >87.39 ± 7.39 0.651** ≤ 85 253 44.7 249 44 85-92 109 19.3 101 17.8 > 92 204 36 216 38.2 High frequency hearing threshold (dB) < 0.001* Mean ± SD >37.4 ± 11.8 >14.1 ± 4.6 < 0.001** ≤ 26 57 10 570 100 > 26 513 90 0 0 Using earplug 0.457* Often 383 67.2 396 69.5 Sometimes 43 7.5 33 5.8 Never 144 25.3 141 24.7 Family history 285 0.060* No 441 99.3 402 97.8 Yes 3 0.7 9 2.2 Table 1. Distribution of Four Polymorphisms and the Association with NIHL
Genetic Models Genotypes Cases Controls Pa Adjusted OR (95% CI) n = 570 % n = 570 % rs6721961 n = 563 n = 561 Codominant GG 287 50.4 279 48.9 1.00 (Ref.) AG 222 38.9 227 39.8 0.71 0.95 (0.74-1.22) AA 54 9.5 55 9.6 0.84 0.96 (0.64-1.45) Dominant GG 287 50.4 279 48.9 1.00 (Ref.) AG/AA 276 48.4 282 49.4 0.92 0.98 (0.66-1.46) Recessive GG/AG 509 89.3 506 88.7 1.00 (Ref.) AA 54 9.5 55 9.6 0.70 0.95 (0.75-1.21) Alleles G 796 70.7 785 70.0 1.00 (Ref.) A 330 29.3 337 30.0 0.73 1.03 (0.86-1.24) rs1962142 n = 567 n = 567 Codominant AA 332 58.2 327 57.4 1.00 (Ref.) AG 205 36.0 203 35.6 0.99 1.00 (0.78-1.27) GG 30 5.3 37 6.5 0.38 0.80 (0.48-1.32) Dominant AA 332 58.2 327 57.4 1.00 (Ref.) AG/GG 235 41.3 240 42.1 0.37 0.80 (0.48-1.31) Recessive AA/AG 537 94.2 530 93 1.00 (Ref.) GG 30 5.3 37 6.5 0.78 0.97 (0.76-1.22) Alleles A 869 76.6 857 75.6 1.00 (Ref.) G 265 23.4 277 24.4 0.57 0.95 (0.78-1.15) rs6726395 n = 559 n = 564 Codominant AA 201 35.3 153 26.8 1.00 (Ref.) AG 271 47.5 300 53.5 < 0.01 0.67 (0.52-0.88) GG 87 15.3 111 18.6 < 0.01 0.63 (0.44-0.89) Dominant AA 201 35.3 153 26.8 1.00 (Ref.) AG/GG 358 62.8 411 72.1 0.16 0.80 (0.58-1.09) Recessive AA/AG 472 82.8 453 80.3 1.00 (Ref.) GG 87 15.3 111 18.6 < 0.01 0.66 (0.51-0.85) Alleles A 673 60.2 606 53.7 1.00 (Ref.) G 445 39.8 522 46.27 < 0.01 0.78 (0.66-0.93) rs77684420 n = 562 n = 567 Codominant TT 419 73.5 445 78.1 1.00 (Ref.) TC 128 22.5 117 20.5 0.29 1.16 (0.87-1.54) CC 15 2.6 5 0.9 0.03 3.16 (1.13-8.80) Dominant TT 419 73.5 445 78.1 1.00 (Ref.) TC/CC 143 25.1 122 21.4 0.03 3.06 (1.10-8.50) Recessive TT/TC 547 96 562 98.6 1.00 (Ref.) CC 15 2.6 5 0.9 0.11 1.24 (0.94-1.64) Alleles T 966 85.9 1007 88.8 1.00 (Ref.) C 158 14.1 127 11.2 0.04 1.30 (1.00-1.66) Note. aAdjusted for age, sex, smoking, and alcohol consumption in the logistic regression model. Table 2. Frequencies of Inferred Haplotypes among the Cases and Controls and Their Association with Risk NIHL
Haplotypesa Case (n = 566) Control (n = 566) Pb Holm SidakSS SidakSD Adjusted OR (95% CI)c Global Pd n % n % AAGT 475 42.9 445 40 0.200 0.600 0.945 0.488 1.12 (0.94-1.32) 0.005 AAGC 148 13.3 119 10.7 0.058 0.235 0.545 0.215 1.28 (1.19-1.65) GAGT 117 10.5 172 15.4 < 0.001 0.003 0.008 0.003 0.64 (0.50-0.83) GAAT 69 6.2 73 6.5 0.728 0.794 0.999 0.728 0.94 (0.67-1.32) GGAT 215 19.4 230 20.6 0.397 0.794 0.998 0.636 0.92 (0.75-1.13) Note. aAlleles of the haplotypes were arrayed as rs6726395, rs1962142, rs6721961, and rs77684420. Haplotypes with a frequency < 0.03 were ignored. bTwo-sided χ2 test. cAdjusted for the age, gender, smoking, and alcohol consumption in the logistic regression model. dGenerated by the permutation test with 1, 000 times of simulation. -
[1] Verbeek JH, Kateman E, Morata TC, et al. Interventions to prevent occupational noise-induced hearing loss. Cochrane Database Syst Rev, 2012; 10, D6396. [2] Nasezadeh P, Shahi F, Fridoni M, et al. Moderate O3/O2 therapy enhances enzymatic and non-enzymatic antioxidant in brain and cochlear that protects noise-induced hearing loss. Free Radic Res, 2017; 51, 828-37. doi: 10.1080/10715762.2017.1381695 [3] Uruno A, Motohashi H. The Keap1-Nrf2 system as an in vivo sensor for electrophiles. Nitric Oxide, 2011; 25, 153-60. doi: 10.1016/j.niox.2011.02.007 [4] Ashrafian H, Czibik G, Bellahcene M, et al. Fumarate is cardioprotective via activation of the Nrf2 antioxidant pathway. Cell Metab, 2012; 15, 361-71. doi: 10.1016/j.cmet.2012.01.017 [5] Zhang X, Liu Y, Zhang L, et al. Associations of genetic variations in EYA4, GRHL2 and DFNA5 with noise-induced hearing loss in Chinese population:a case-control study. Environ Health, 2015; 14, 77. doi: 10.1186/s12940-015-0063-2 [6] Auton A, Brooks LD, Durbin RM, et al. A global reference for human genetic variation. Nature, 2015; 526, 68-74. doi: 10.1038/nature15393 [7] Suzuki T, Shibata T, Takaya K, et al. Regulatory nexus of synthesis and degradation deciphers cellular Nrf2 expression levels. Mol Cell Biol, 2013; 33, 2402-12. doi: 10.1128/MCB.00065-13 [8] Le Prell CG, Yamashita D, Minami SB, et al. Mechanisms of noise-induced hearing loss indicate multiple methods of prevention. Hear Res, 2007; 226, 22-43. doi: 10.1016/j.heares.2006.10.006 [9] Sakurai T, Kanayama M, Shibata T, et al. Ebselen, a seleno-organic antioxidant, as an electrophile. Chem Res Toxicol, 2006; 19, 1196-204. doi: 10.1021/tx0601105 [10] Yamamoto T, Yoh K, Kobayashi A, et al. Identification of polymorphisms in the promoter region of the human NRF2 gene. Biochem Biophys Res Commun, 2004; 321, 72-9. doi: 10.1016/j.bbrc.2004.06.112 -


 下载:
下载:



 Quick Links