

 下载:
下载:

-
The coronavirus disease 2019 (COVID-19) pandemic poses a significant threat to public health and the safety of the global population. So far, the COVID-19 outbreak has caused over 6.2 million deaths globally [1]. Over the years, several severe acute respiratory syndrome coronavirus 2 (SARS-CoV-2) variants with increased transmissibility and deteriorating epidemiological conditions have appeared. The COVID-19 outbreak in some regions remains “extremely grim” [2-4].
SARS-CoV-2 is sensitive to ultraviolet rays and heat. The virus can be effectively inactivated at 56 °C for 30 min [5] and at 70 °C for 5 min [6]. Common disinfectants and classical disinfection methods can effectively kill SARS-CoV-2 at room temperature [7,8]. However, SARS-CoV-2 may survive relatively longer at low temperatures (4 °C and below) [6,9,10]. Liu et al. found that infectious SARS-CoV-2 can survive for at least 60 days on the surface of cold-chain food packages (under −18 °C) [11]. Moreover, Kwon and colleagues discovered that SARS-CoV-2 could survive under winter conditions with a survival post-contamination on most surfaces for up to 21 days, followed by spring/fall conditions for up to 7 days [12]. Also, the survival time of SARS-COV-2 in nasal mucus and sputum at 4 °C is significantly longer than at normal temperature [13]. According to existing World Health Organization (WHO) reports, some other coronaviruses are highly stable in a frozen state and can survive for up to two years at −20 °C [14].
Viruses live relatively longer on surfaces in cold environments and are also more active at low temperatures [6,15-17]. Since the outbreak at Xinfadi Market in Beijing, multiple local outbreaks related to the contaminated outer packaging of cold-chain goods occurred in China [17-19]. In October 2020, the Chinese Center for Disease Control and Prevention (China CDC) isolated the live virus from the cold-chain food packaging in Qingdao, which suggested that cold-chain goods were the potential carriers for long-distance cross-border import of SARS-CoV-2 [20].
Traditional disinfection methods are usually performed at room temperature and high-temperature conditions. Temperature has a great influence on chemical disinfectants. In cold environments below 0 ℃, the disinfection effect of commonly used chemical disinfectants decreases significantly, and even icing occurs, making disinfection impossible. Yet, in order to prevent and control the COVID-19 epidemic and solve the cryogenic disinfection challenges, China has started developing related technologies since June 2020. In February 2021, the National Institute of Environment Health of China CDC successfully developed two cryogenic disinfectants (−18 °C and −40 °C, respectively), which were freely available to the public [21]. This cryogenic disinfectant in the corresponding low temperature conditions, maintain the liquid state, with the ability to play a disinfection role to ensure effective disinfection at low temperatures. Since then, domestic cryogenic disinfection technology has rapidly developed. However, as cryogenic disinfection is a new technology, factors and key points influencing its field application are different from traditional disinfection technology. In this study, Staphylococcus aureus and Escherichia coli with higher resistance than SARS-CoV-2, were used as indicator microorganisms to study investigated the effectiveness and feasibility of cryogenic disinfectants in different cold scenarios and analyzed the key points of on-site cryogenic disinfection [22].
-
Cryogenic disinfectant is mainly used for cold chain food packaging and environmental items in alpine regions. In this study, Qingdao, Shandong Province, China, was selected as the research site to evaluate the disinfection effect of cold chain food packaging cryogenic disinfectant. The low-temperature disinfection site was divided into 3 areas: 1) centralized supervision warehouse: imported cold chain food is transported from the customs to the cold storage of the centralized supervision warehouse through cold chain containers. This link requires low-temperature disinfection of the inside of the cold chain containers and the outer packaging of the cold chain food; 2) cold chain food processing enterprises: imported cold chain food is transported from the centralized supervision warehouse to the cold storage of food processing enterprises through cold chain transport vehicles. This link requires low-temperature disinfection of the inside of the cold chain transport vehicles and the outer packaging of the cold chain food; 3) shopping malls (supermarkets): imported cold chain food is transported from the cold storage of the food processing enterprise to the refrigerator of shopping malls, supermarkets, and stores through the cold-chain transport vehicles. This link requires low-temperature disinfection of cold chain food outer packaging (small packaging) and inner packaging.
Suifenhe City, Heilongjiang Province, China, was selected as the research site for low-temperature disinfection in alpine regions. The outdoor temperature in Suifenhe City is about −15 °C in winter, so low-temperature disinfection is required for the outdoor environment and items, including containers, outer packaging, and outdoor environment.
-
Cryogenic Disinfectant The effective chlorine concentration of the −18 ℃ cryogenic disinfectant is 3,000 mg/L, and the disinfectant contained 25% calcium chloride, 9.5% ethanol, and 0.31% sodium dichloroisocyanurate. Ethanol and sodium chloride were used for anti-freeze. The formulation of cryogenic disinfectant was developed by the National Institute of Environment Health, China CDC.
Reagents and Media Reagents and media were purchased as follows: neutralizer (0.3% sodium thiosulfate, 0.1% lecithin and 1% Tween-80 in 0.03 mol/L PBS), diluent (0.03 mol/L PBS solution of 0.1% Tween 80), tryptic soy broth (TSB), and tryptic soy agar (TSA).
Bacterial Carrier Staphylococcus aureus (S. aureus, ATCC 6538) and Escherichia coli (E. coli, 8099) bacteria were cultured on a TSA medium. A TSB medium was used for bacterial carrier tests to dilute the bacteria cultured overnight (18 h–24 h). Then, 10 μL of fresh bacteria were applied to cloth carriers (1 cm × 1 cm), which were left at room temperature for approximately 20 min to dry. After drying, samples were placed at −18 ℃ for more than 30 min to ensure that the surface temperature of the carriers reached −18 ℃ [22].
In field tests, three samples for each bacterium were used as a positive control group without disinfection, while other conditions were the same as in the test group. The concentration of the positive control group was 5 × 10⁵ − 5 × 10⁶ CFU/tablet.
-
Qingdao From January 5 to February 5, 2021, on-site experiments were carried out in centralized supervision warehouses, food processing enterprises, and shopping malls (supermarkets) in Qingdao. The temperature of disinfected objects in each scenario was about −18 ℃.
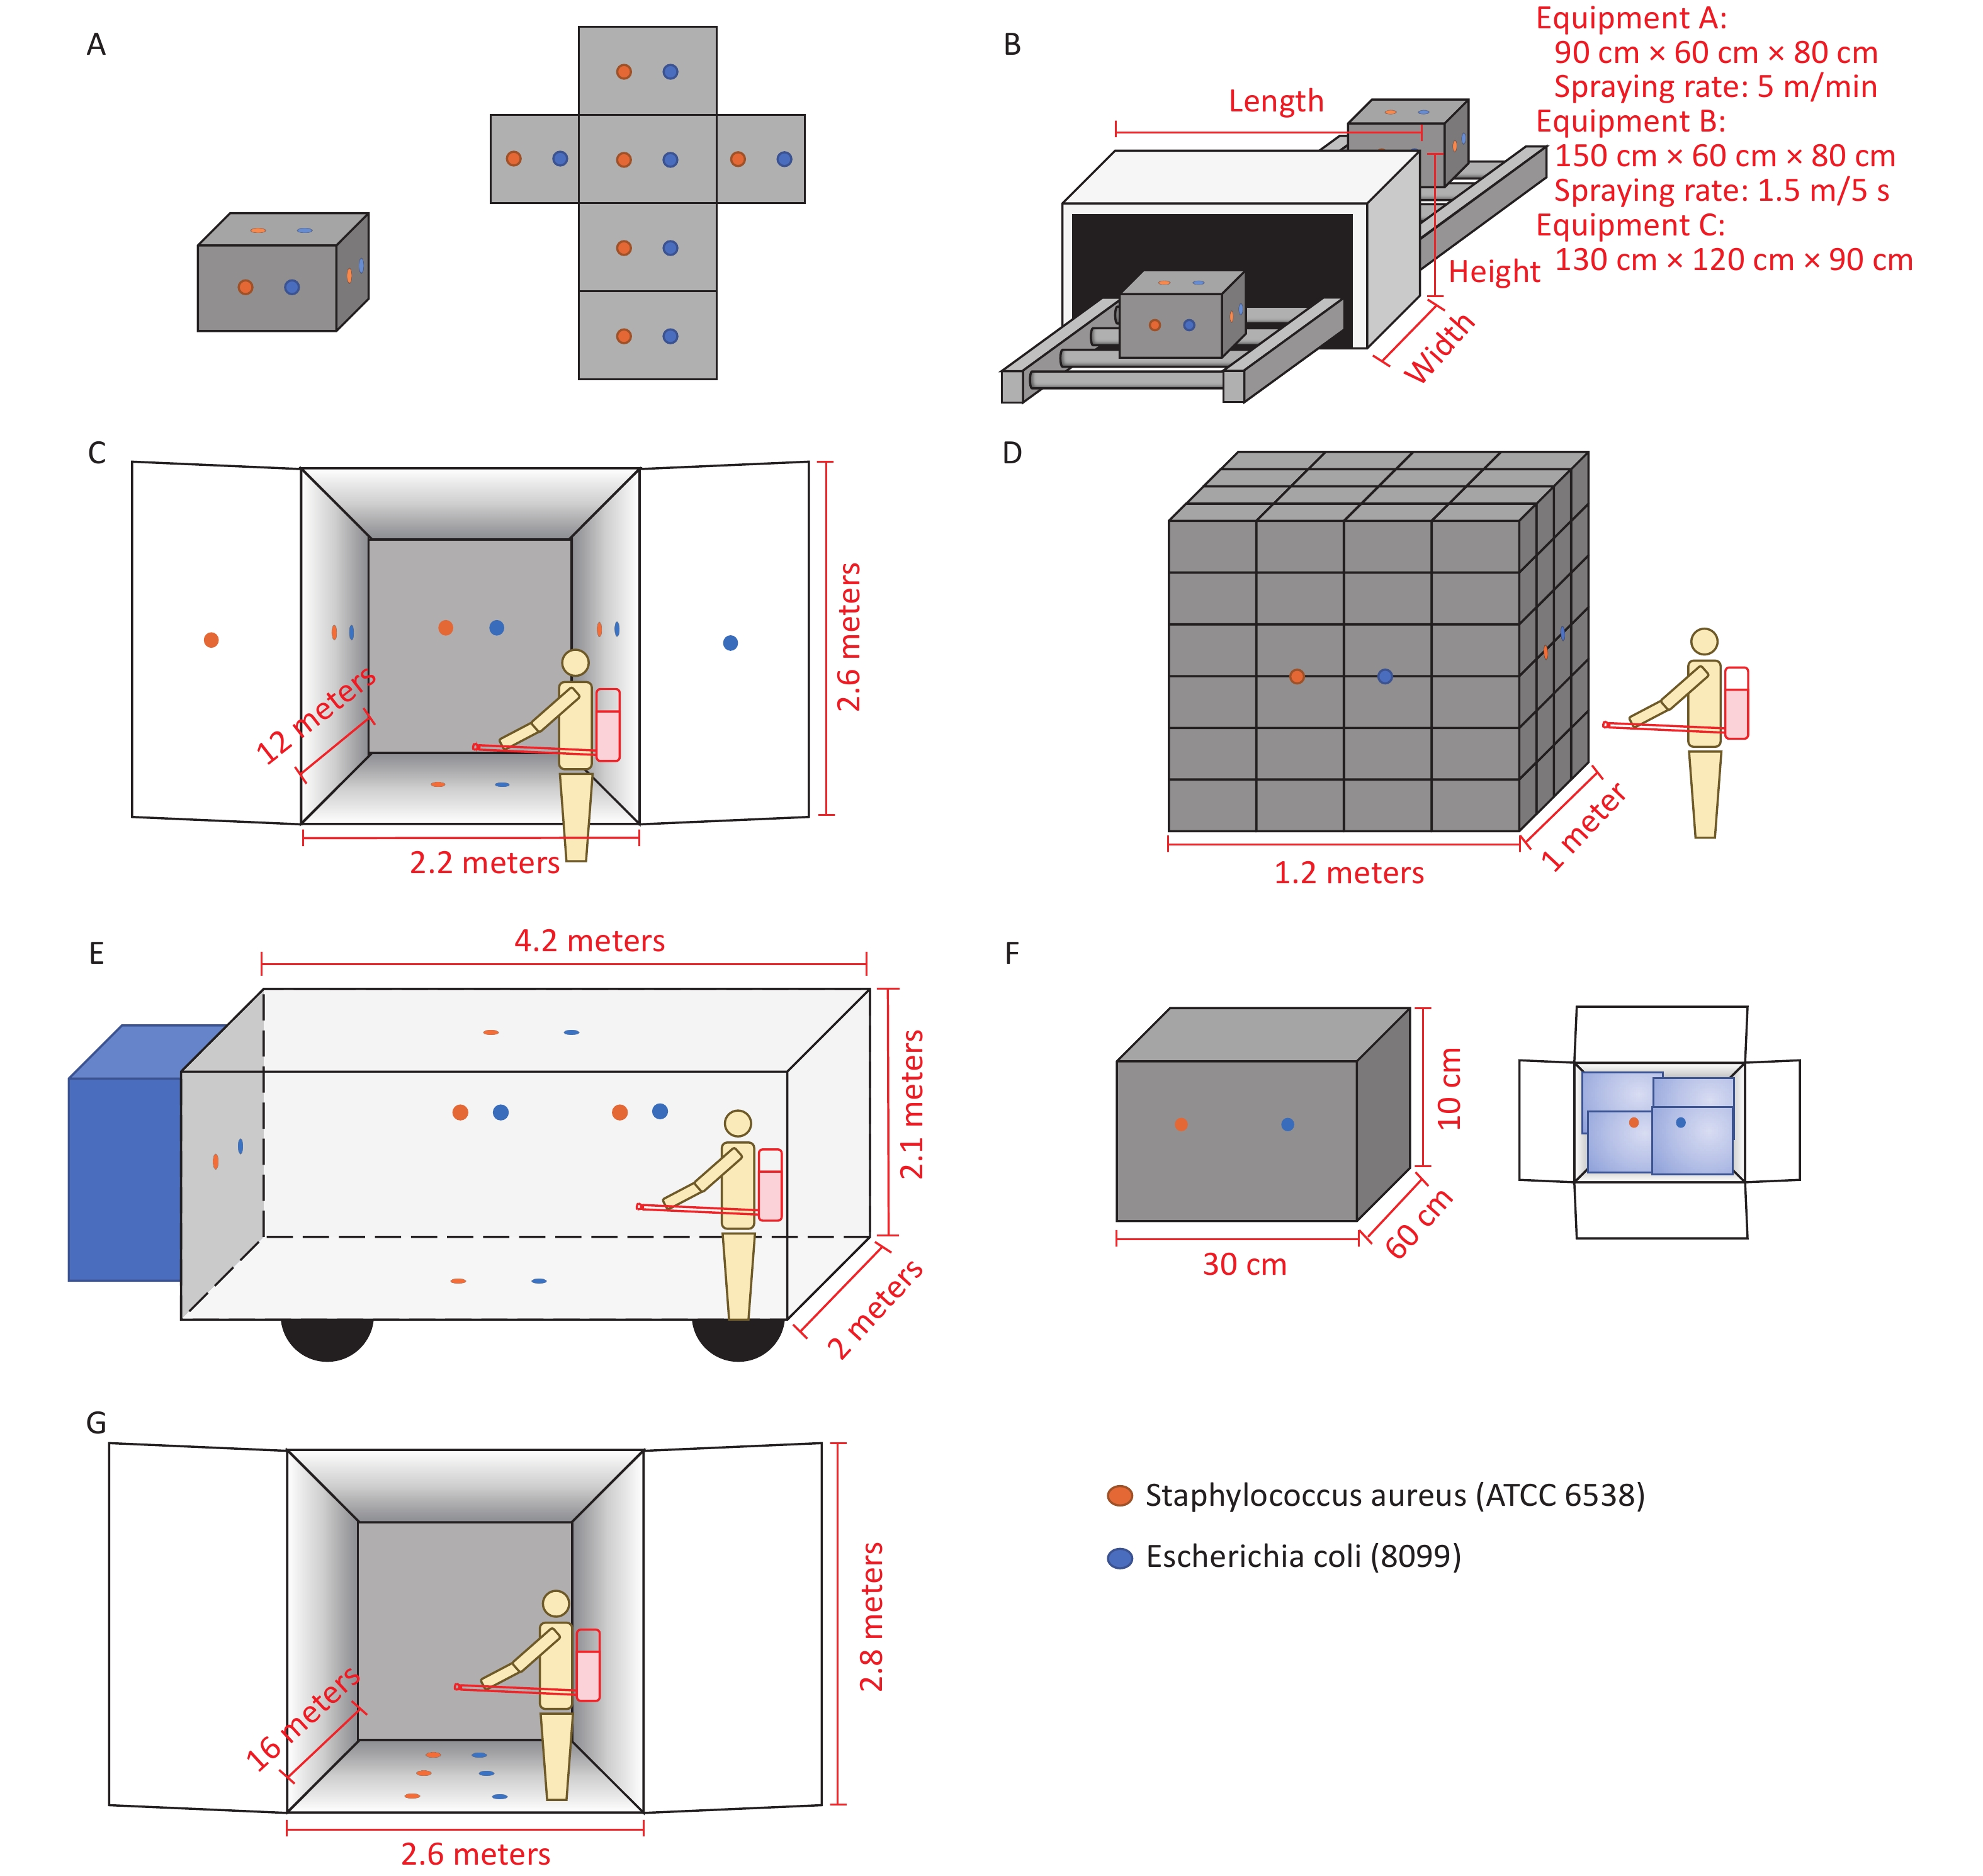
Centralized Supervision Warehouse The six sides of the cold chain food packaging were pasted with bacterial carriers (Figure 1A) and placed at −18 ℃ for more than 30 minutes to ensure that the temperature of the outer packaging and the bacteria carriers reached −18 ℃. A handheld infrared thermometer was used to ensure temperature has reached. The cryogenic disinfectant was loaded into two six-sided sprayers used to disinfect the surface of the carton (Figure 1B). The spraying time of device A (90 cm × 60 cm × 80 cm, spraying rate: 5 m/min) to the carton was 3−4 s, and for device B (150 cm × 60 cm × 80 cm, spraying rate: 1.5 m/5 s) was 7−8 s. The spraying devices A and B are original to the site; no adjustments or modifications were made to the original devices during the study. After spraying, the cartons were left for 10 min. Then the bacterial carriers were placed into test tubes containing 10 mL of neutralizing agent and sent to the laboratory for further analysis within 4 hours. Five cartons were sprayed and disinfected by each spray device, with a total sample size of 120.
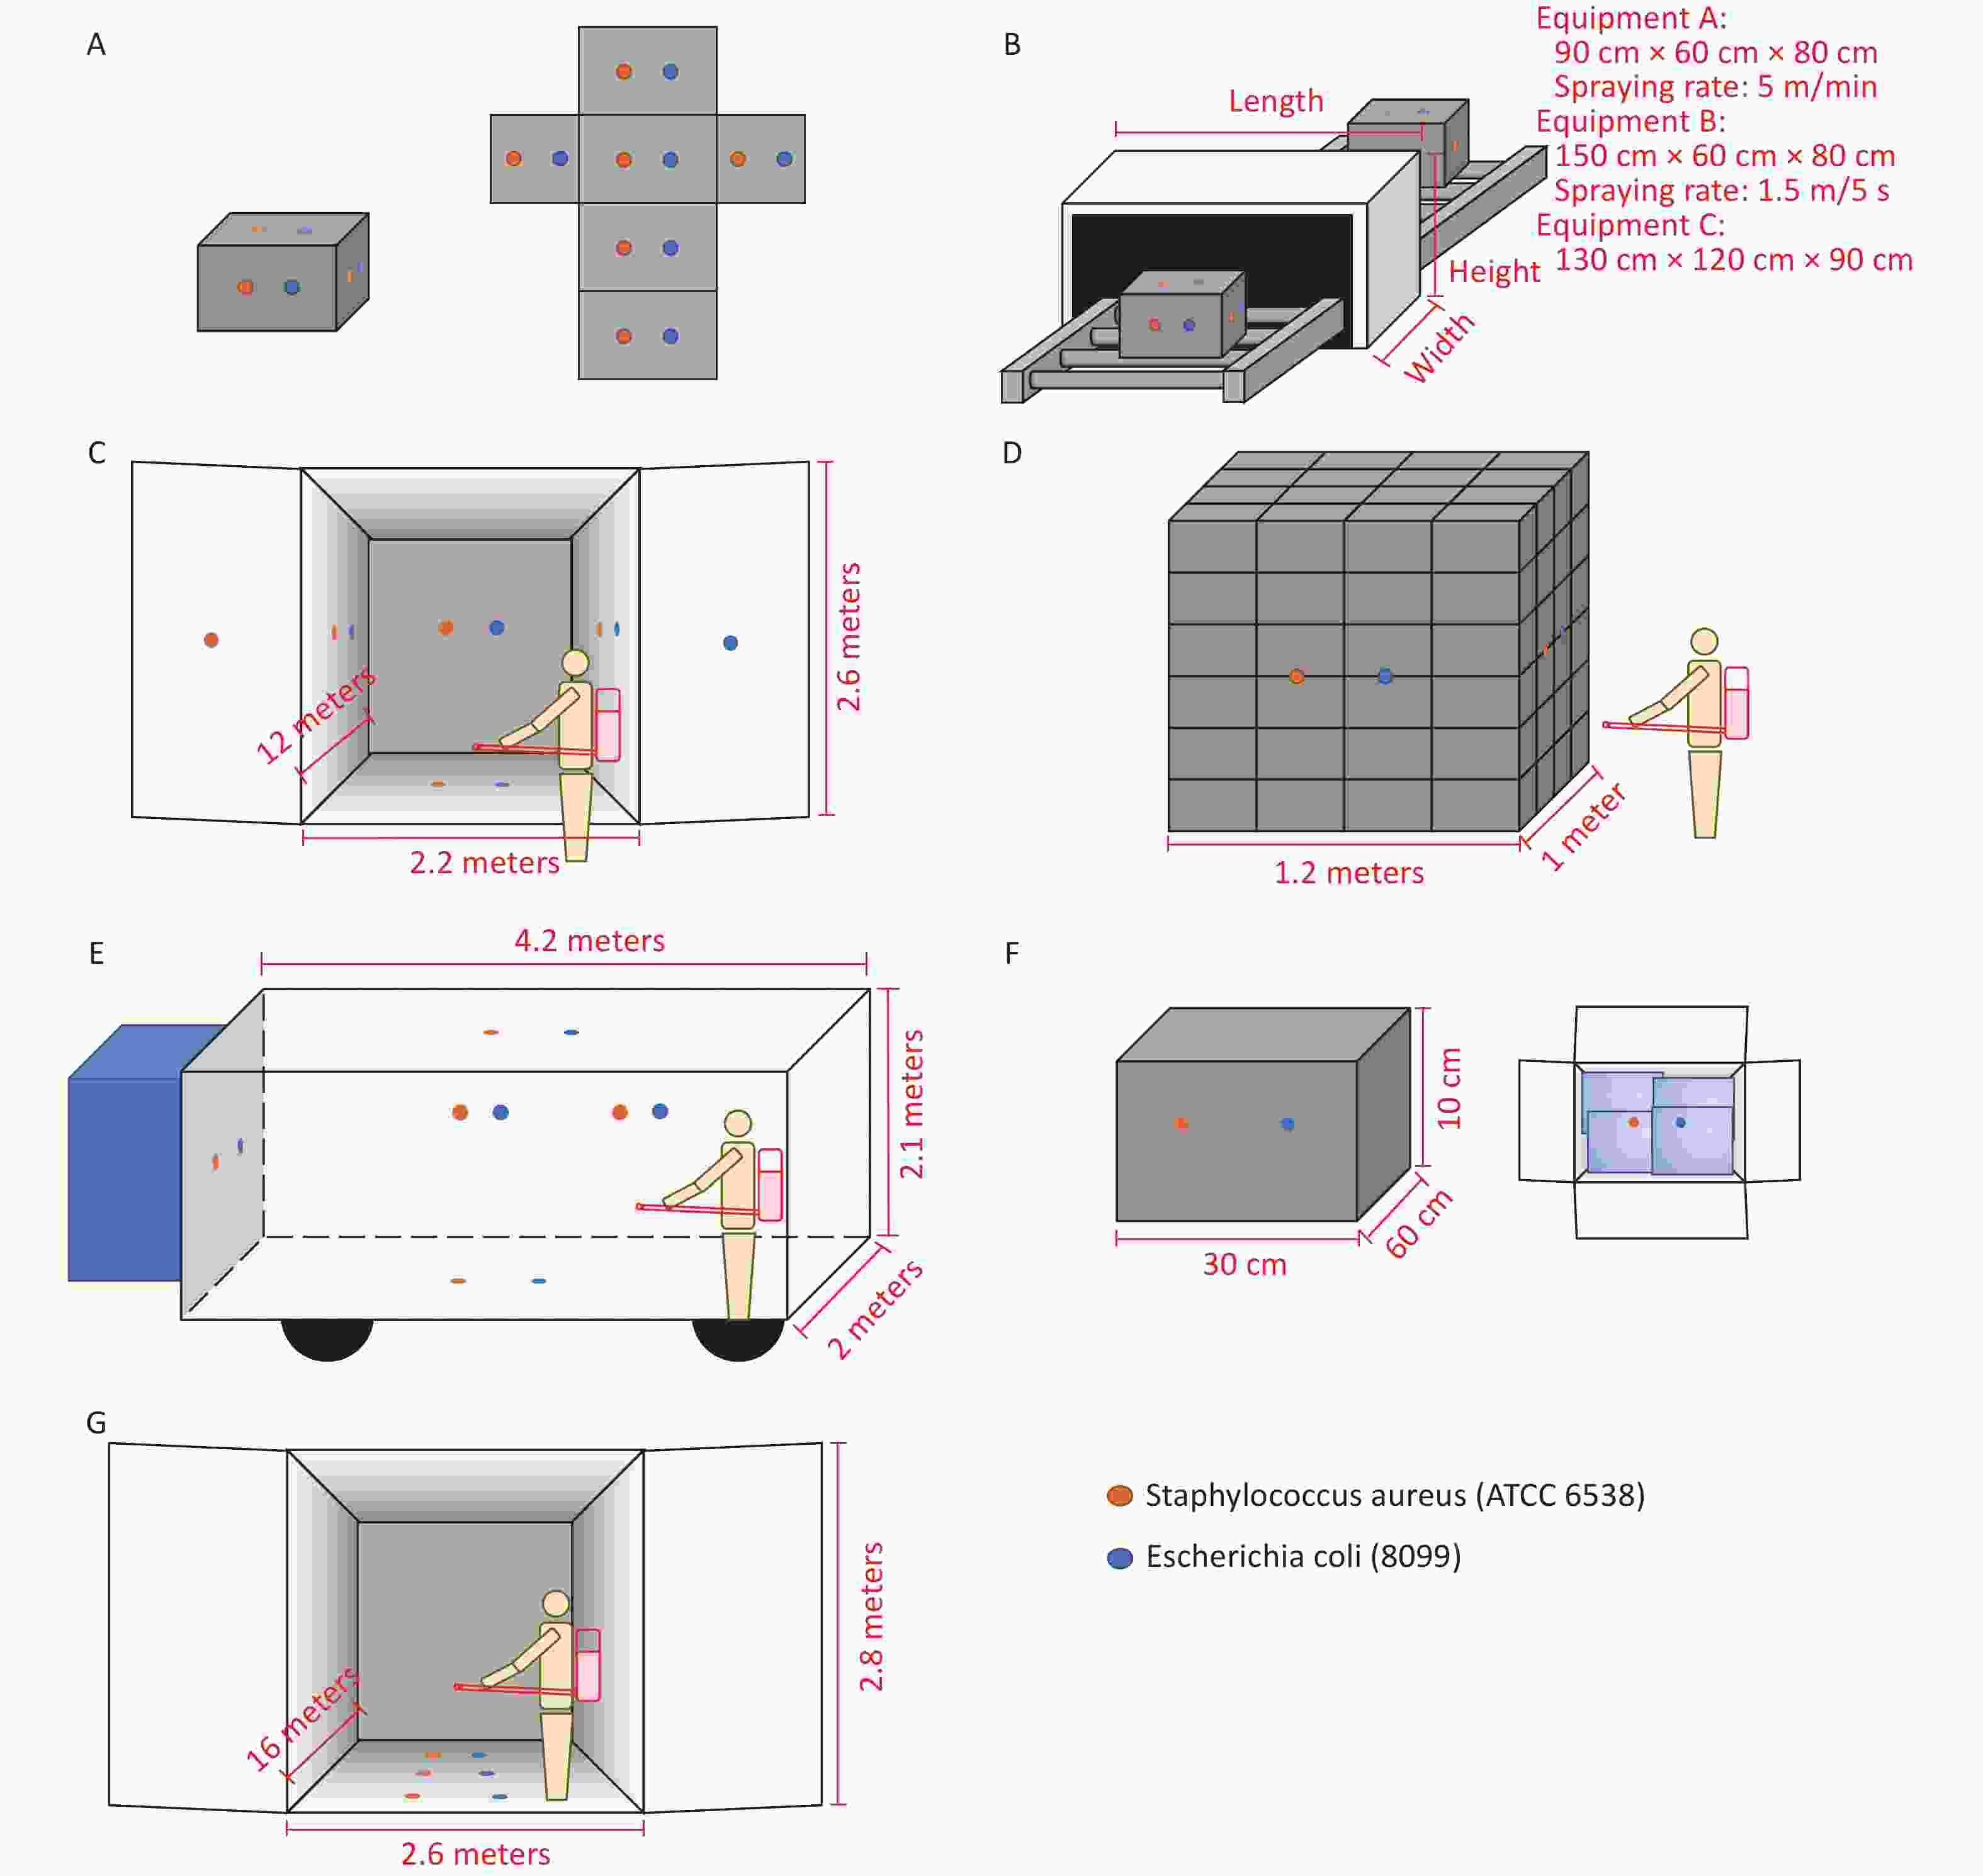
Figure 1. Schematic illustration of the location of bacteria carriers for different disinfection objects. (A) The six sides of the cold chain food packaging with bacterial carriers; (B) six-sided equipment; (C) cold chain container; (D) cold chain food outer packaging (stacked); (E) cold chain transporter vehicles; (F) the outer packaging (minimum packaging) and inner packaging of cold chain food; (G) empty container placed outdoors
Cold Chain Container Three cold-chain containers (12 m × 2.2 m × 2.6 m) were selected as objects of disinfection. After the containers were emptied, the bacteria carriers were respectively attached to the inner side (3 points), front wall (1 point), and bottom (1 point) of the container, and 2 bacteria carriers were attached to each point (one S. aureus carrier and one E. coli) (Figure 1C), with a total sample size of 30. Next, the researcher placed the cryogenic disinfectant into a constant sprayer and sprayed the inner wall of the container. The spraying volume was about 200−300 mL/m2. After 10 min, the bacterial carriers were put into test tubes containing 10 mL of neutralizing agent and sent for analysis.
Cold Chain Food Processing Enterprises The outer packaging of 15 piles of cold chain food (chassis: 1.2 m × 1 m, cold chain food packaging box: 30 cm × 60 cm × 10 cm) was selected as the object of disinfection, and the prepared bacteria carriers were respectively pasted on the front, back, left, and right sides of the outer packaging of cold chain food (piles) (Figure 1D), with one S. aureus carrier and one E. coli carrier on each side, with a total sample size of 120. The disinfection staff of the enterprises placed the cryogenic disinfectant into a constant sprayer and sprayed the piles of cold chain food outer packaging. The disinfection operation was consistent with the daily disinfection operation of the enterprise. The research team did not provide special technical training for the disinfection staff of the enterprise. After spraying, the cold chain food was left for 10 minutes. Then, the bacterial carriers were put into test tubes containing 10 mL of neutralizing agent and sent for analysis.
Cold Chain Transport Vehicles Three cold chain transport vehicles (4.2 m × 2 m × 2.1 m) were selected as disinfection objects. After the goods were emptied, the bacteria carriers were attached to the inner side (2 points), front wall (1 point), above (1 point), and below (1 point) of the cold chain transport vehicle, and 2 bacteria carriers were attached to each point (one S. aureus carrier and one piece of E. coli carrier) (Figure 1E), with a total sample size of 30. The disinfection staff of the enterprises placed the cryogenic disinfectant into a constant sprayer and sprayed the inner wall of the cold chain transport vehicle for disinfection. After spraying, vehicles were left for 10 min. Then, the bacterial carriers were put into test tubes containing 10 mL of neutralizing agent and sent for analysis.
On the first day, the disinfection staff of the enterprise did not receive training. The next day, professionals from the research team performed a demonstration in the field, telling the disinfection staff in enterprises that the spray disinfection operation should ensure that all surfaces are covered with low-temperature disinfectant and that these surfaces remain wet for half an hour (In this study, the time of disinfection was 30 min). On the second and third days, the research team carried out special technical training for disinfection staff in enterprises, requiring them to spray 200–300 mL/m2 to ensure enough low-temperature disinfectant to cover the inner wall.
Shopping Malls and Supermarkets Twenty cold chain foods were selected as objects for disinfection, and the bacteria carriers were respectively pasted on the outer packaging (minimum packaging) and inner packaging of cold chain food (Figure 1F), amounting to a total of 80 samples. Briefly, the cryogenic disinfectant was placed into a manual pressure watering can, and the salesman sprayed the outer packaging (minimum packaging) and inner packaging surface of the cold chain food (30 cm × 60 cm × 10 cm, spraying amount of 200−300 mL/m2). After spraying, the cold chain food was left for 10 minutes. Then, the bacterial carriers were put into test tubes containing 10 mL of neutralizing agent and were sent for analysis.
Suifenhe City From January 10 to February 10, 2021, the outdoor temperature in Suifenhe during the day was about −5 ℃ to −15 ℃, and the surface of the storage warehouse (without heating), empty containers, and outer packaging of items were selected for low-temperature disinfection research. The researchers themselves did all disinfection operations.
Storage Warehouse The bacteria carriers were placed in sterile plates and scattered on the floor of the storage warehouse; ten sites were placed at each time, with 2 bacterial carriers per site (one piece of S. aureus carrier and one piece of E. coli). The experiment was repeated three times with a total of 60 samples. During the test, the indoor temperature was about −13 ℃ to −15 ℃. A disinfectant sprayer equipped with the cryogenic disinfectant was used to disinfect the ground, and the spraying volume was about 200−300 mL/m2. After spraying, it was left for 10 minutes. Then the bacterial carriers were put into test tubes containing 10 mL of neutralizing agent and sent for analysis.
Containers Ten empty containers (16 m × 2.6 m × 2.8 m) placed outdoors were selected as disinfection objects, and the internal temperature during the experiment was about –5 ℃ to –9 ℃. The microbes were placed at the inner, middle, and outer points at the bottom of the container, with 2 bacteria carriers (one S. aureus carrier and one E. coli) at each point (Figure 1G), with a total sample size of 60. A disinfectant sprayer equipped with the cryogenic disinfectant was used to disinfect the inner wall of the container; the spraying volume was about 200−300 mL/m2. After spraying, the containers were left for 10 minutes. Then the bacterial carriers were put into test tubes containing 10 mL of neutralizing agent and sent for analysis.
Outer Packaging of Items Five items were selected as objects of disinfection, and the surface temperature of the outer packaging of the items was about −7 ℃ to −10 ℃ during the experiment. The point distribution method and disinfection method were the same as above (Figure 1A and Figure 1B). The spraying time of the six-sided spray equipment C (130 cm × 120 cm × 90 cm, disinfected box: 65 cm × 53 cm × 45 cm) is about 30−40 s. The spraying device C is original to the site; no adjustments or modifications were made to the original devices during the study. After spraying, those items were left for 10 minutes. Then the bacterial carriers were put into test tubes containing 10 mL of neutralizing agent and sent for analysis.
-
After mixing, samples were transferred to a sterile plate (each sample was inoculated into 2 plates in parallel). The culture medium was added and evenly shaken while pouring. After the culture medium was solidified, samples were placed at 36 ± 1 ℃ for 48 h, after which the number of colonies was counted. Positive control samples were properly diluted with diluent, then cultured and counted following the same method. The
following formula was used to calculate the killing log value of each sample: $$ KL={N}_{\mathrm{o}} - {N}_{\mathrm{x}} $$ where
$ KL $ is the killing log,$ {N}_{\mathrm{o}} $ is the log value of average viable bacteria concentration (CFU/tablet) in the positive control group and$ {N}_{\mathrm{x}} $ is the log value of viable bacteria concentration (CFU/tablet) in the experimental group. The log kill value ≥ 3.00 indicted a good level of disinfection[22]. -
Centralized Supervision Warehouse After disinfection with equipment A (spray for 3−4 s), six sides of the outer packaging were not wet, and 60 bacteria carriers pasted on the surfaces could not be counted (grown as bacterial lawn); the qualified disinfection rate was 0%.
After disinfection with equipment B (spray for 7−8 s), the bottom surface of the cold chain food outer packaging was relatively wet, while the other five surfaces (the top, front, back, left, and right sides) were unevenly wet. The average killing logarithm of E. coli carriers pasted on the outer packaging of cold chain food by cryogenic disinfectants was 2.36 (0.85−5.51), [The killing log values 2.36 (0.85−5.51) means that the average killing log value of the 30 samples in this test was 2.36, of which the lowest value was 0.85 and the highest value was 5.51.] and the qualified disinfection rate was 20% (6/30). The average killing logarithm value of S. aureus carriers was 2.52 (1.22−4.62), and the qualified disinfection rate was 30% (9/30). Only 15 out of the 60 samples were adequately disinfected and were distributed on the bottom (9), top (3), back (2), and left (1) surfaces (Table 1).
Table 1. Disinfection effectiveness in different parts of the cold chain food outer packaging (Equipment B)
Item number Position of the
tablet on the
packaging surfaceE. coli killing
log valueS. aureus
killing log
value1 Top surface* 2.33 2.37 Bottom surface* 3.05 2.86 Left surface* 1.68 1.28 Right surface* 1.98 1.72 Front surface* 1.91 2.27 Back surface* 0.85 3.22 2 Top surface* 2.12 4.62 Bottom surface 3.87 4.44 Left surface* 1.27 1.53 Right surface* 1.44 2.50 Front surface* 1.54 2.01 Back surface* 2.54 2.71 3 Top surface* 2.50 3.20 Bottom surface 4.25 3.96 Left surface* 2.22 2.09 Right surface* 1.99 1.22 Front surface* 1.58 2.07 Back surface* 2.37 1.36 4 Top surface* 2.79 2.60 Bottom surface 5.51 3.14 Left surface* 1.57 3.89 Right surface* 1.99 1.87 Front surface* 1.82 1.93 Back surface* 2.03 3.50 5 Top surface* 3.13 2.28 Bottom surface 4.23 4.35 Left surface* 1.82 1.33 Right surface* 2.10 1.88 Front surface* 2.10 1.87 Back surface* 2.25 1.47 Note. The mean log value of E. coli in the positive control group was 5.91 and the mean log value of S. aureus was 5.79. *Indicates that the surface disinfection failed (the surface of Staphylococcus aureus or Escherichia coli any piece of bacteria failed to pass then marked as unqualified). Cold Chain Container After disinfection, all parts of the inner surfaces of the cold chain container were wet, and the low-temperature disinfectant completely covered the inner wall surfaces. The average killing logarithm of E. coli carriers pasted on the inner surfaces of the cold chain container by cryogenic disinfectants was 3.52 (3−4.59), and the average killing logarithm of S. aureus carriers was 3.63 (3.02−5.02). All samples were adequately disinfected, and the qualified rate was 100% (30/30) (Table 2).
Table 2. Disinfection effectiveness in different parts of the cold chain container (Constant Sprayer)
Container number Positioning of the tablets in the container E. coli killing log value S. aureus killing log value 1 Front wall 3.12 3.07 Bottom 3.88 4.08 Side wall1 3.01 3.76 Side wall2 4.37 4.43 Side wall3 3.92 4.04 2 Front wall 3.03 3.04 Bottom 3.05 3.02 Side wall1 3.26 3.05 Side wall2 3.07 4.2 Side wall3 3.23 3.09 3 Front wall 3.95 5.02 Bottom 3.74 3.61 Side wall1 4.59 3.27 Side wall2 3.00 3.47 Side wall3 3.54 3.36 Note. The mean log value of E. coli in the positive control group was 6.07 and the mean log value of S. aureus was 5.74. Cold Chain Food Processing Enterprises After disinfectant was sprayed, the surfaces of the stacked cold chain food's outer packaging were unevenly wet. The average killing logarithm of E. coli carriers pasted on the outer packaging surfaces by cryogenic disinfectants was 3.44 (1.91−5.28), and the qualified disinfection rate was 80% (48/60); the average killing logarithm of S. aureus carriers was 3.90 (2.45−5.44), and the qualified disinfection rate was 81.67% (49/60). Among the 120 samples, the disinfection result of 23 samples was unsatisfying, including 6 samples from the front, 4 samples from the back, 8 samples from the left, and 5 samples from the right surfaces (Table 3).
Table 3. Disinfection effectiveness in different parts of the outer surface of the cold chain food pile (Constant Sprayer)
Item
numberPositioning of the
tablets on the surfaceE. coli killing
log valueS. aureus killing
log value1 Front surface* 3.12 2.81 Back surface* 3.15 2.82 Left surface* 3.18 2.45 Right surface 3.96 5.14 2 Front surface 3.28 4.54 Back surface 3.22 3.73 Left surface 3.07 3.62 Right surface 5.19 5.44 3 Front surface 3.34 4.44 Back surface 3.19 3.78 Left surface 3.07 3.53 Right surface 4.58 5.44 4 Front surface 3.01 4.96 Back surface 3.09 3.18 Left surface 3.21 3.99 Right surface 4.36 5.44 5 Front surface 3.19 4.84 Back surface 3.07 3.76 Left surface* 2.97 3.77 Right surface 3.25 5.14 6 Front surface 3.60 4.94 Back surface 3.33 3.11 Left surface 3.49 4.37 Right surface* 2.29 2.65 7 Front surface 3.05 4.05 Back surface* 2.54 4.21 Left surface* 2.28 3.03 Right surface* 2.41 4.80 8 Front surface* 2.60 3.73 Back surface 3.52 3.23 Left surface* 1.91 2.46 Right surface 3.35 3.53 9 Front surface* 3.12 2.49 Back surface 3.01 3.13 Left surface 3.01 4.54 Right surface* 2.65 5.07 10 Front surface* 2.37 3.64 Back surface 3.34 5.15 Left surface* 2.12 2.57 Right surface 3.03 4.33 11 Front surface 5.28 4.91 Back surface 4.06 3.32 Left surface 3.76 4.83 Right surface 3.95 4.23 12 Front surface 4.88 4.76 Back surface 3.47 3.11 Left surface 4.98 3.29 Right surface 3.56 3.61 13 Front surface 3.89 3.10 Back surface* 3.86 2.95 Left surface 4.02 4.05 Right surface 4.58 4.25 14 Front surface* 3.40 2.80 Back surface* 2.96 3.21 Left surface 3.00 4.66 Right surface* 4.37 2.92 15 Front surface* 4.46 2.93 Back surface 4.07 3.98 Left surface* 2.94 4.91 Right surface 5.28 4.61 Note. The mean log value of E. coli in the positive control group was 6.07 (5.98−6.17) and the mean log value of S. aureus was 5.74 (5.84−6.24). *Indicates that the surface disinfection failed (the surface of S. aureus or Escherichia coli any piece of bacteria failed to pass then marked as unqualified). Cold Chain Transport Vehicles The average killing logarithm of E. coli carriers pasted on the inner walls of the cold chain transport vehicle by cryogenic disinfectants was 3.96 (2.71−5.9), and the qualified disinfection rate was 86.67% (13/15). The average killing logarithm of S. aureus carriers was 3.88 (2.60−4.85), and the qualified disinfection rate was 93.33% (14/15) (Table 4).
Table 4. Disinfection effectiveness in different parts of the cold chain transport vehicle compartment (Constant Sprayer)
Item number Positioning of the tablets in the carriage E. coli killing log value S. aureus killing log value 1 Top surface* 2.82 3.02 Front wall* 3.58 2.60 Bottom surface* 2.71 3.01 Side wall1 4.07 3.56 Side wall2 3.62 3.06 2 Top surface 3.35 4.21 Front wall 4.22 3.25 Bottom surface 3.67 4.85 Side wall1 4.79 4.53 Side wall2 4.18 4.85 3 Top surface 5.90 4.42 Front wall 3.67 4.23 Bottom surface 4.41 4.60 Side wall1 4.19 4.53 Side wall2 4.22 3.44 Note. The mean log value of E. coli in the positive control group was 5.90 and the mean log value of S. aureus was 5.94. *Indicates that the surface disinfection failed (the surface of S. aureus or E. coli any piece of bacteria failed to pass then marked as unqualified). The enterprise staff disinfected the inner surfaces of the cold chain transport vehicle by spray. On the first day, the inner surfaces were not fully covered, and the disinfection qualified rate of the bacteria carriers was 70% (7/10). On the second and third days, after professional and technical training, the low-temperature disinfectant was evenly sprayed on the inner surfaces of the cold chain transport vehicle, and all surfaces were fully covered. The disinfection qualified rate of the bacterial carriers was 100% (20/20).
Shopping Malls and Supermarkets After disinfection, the cold chain food outer packaging surfaces were wet. The average killing logarithm of E. coli carriers pasted on the outer packaging surfaces by cryogenic disinfectants was 3.93 (3.00−5.77); the average killing logarithm of S. aureus carriers was 4.77 (3.00−5.00). All test samples were adequately disinfected, and the qualified disinfection rate was 100% (80/80) (Table 5).
Table 5. Disinfection effectiveness in different parts of the inner and outer packaging of cold chain foods (Manual Pressure Watering Can)
Item
numberPositioning of
the tabletsE. coli killing
log valueS. aureus killing
log value1 Outer surface 3.68 5.80 Inner surface 3.97 3.51 2 Outer surface 3.06 5.80 Inner surface 3.68 3.18 3 Outer surface 3.00 5.80 Inner surface 3.75 3.11 4 Outer surface 3.01 5.80 Inner surface 4.39 5.49 5 Outer surface 3.63 5.80 Inner surface 3.06 3.75 6 Outer surface 3.08 5.40 Inner surface 3.25 4.11 7 Outer surface 3.03 5.80 Inner surface 3.18 4.97 8 Outer surface 3.09 5.80 Inner surface 3.01 4.19 9 Outer surface 3.22 5.80 Inner surface 3.06 5.49 10 Outer surface 3.19 5.80 Inner surface 3.68 5.37 11 Outer surface 3.53 3.00 Inner surface 4.90 4.23 12 Outer surface 3.05 4.00 Inner surface 5.77 5.80 13 Outer surface 3.40 4.02 Inner surface 5.77 5.40 14 Outer surface 3.80 3.07 Inner surface 5.77 5.40 15 Outer surface 3.12 3.05 Inner surface 5.77 5.80 16 Outer surface 3.13 3.13 Inner surface 5.77 5.80 17 Outer surface 3.47 3.04 Inner surface 5.77 5.10 18 Outer surface 3.16 4.21 Inner surface 5.37 5.80 19 Outer surface 3.82 3.20 Inner surface 5.77 5.80 20 Outer surface 3.19 4.45 Inner surface 5.77 5.80 Note. The mean log value of E. coli in the positive control group was 5.77 and the mean log value of S. aureus was 5.80. -
The floor of the storage warehouse and empty containers placed outdoors were spray-disinfected by researchers, with low-temperature disinfectant covering all surfaces. After sprayed disinfection, a test group of the bacterial carriers placed on the storage floor and in the container did not show any signs of growth. The average killing logarithm of E. coli carriers was 5.89 (5.82−5.93), and that of S. aureus carriers was 6.20 (5.92−6.35). All the test samples were adequately disinfected, and the qualified disinfection rate was 100% (120/120).
After disinfection with equipment C (spray for 30−40 s), the surfaces of the outer packaging of items were wet. The average killing logarithm of E. coli carriers pasted on the outer packaging of items by cryogenic disinfectants was 5.45 (3.25−6.16), and the average killing logarithm of S. aureus carriers was 5.37 (3.00−6.31). All the test samples were adequately disinfected, and the qualified disinfection rate was 100% (60/60) (Table 6).
Table 6. Disinfection effectiveness in different parts of frozen goods outer packaging in alpine regions (Equipment C)
Item
numberPosition of the
tablet on the
packaging surfaceE. coli
killing log valueS. aureus
killing log value1 Top surface 4.18 6.31 Bottom surface 6.16 3.52 Left surface 4.98 6.31 Right surface 3.77 6.31 Front surface 6.16 4.29 Back surface 6.16 5.92 2 Top surface 6.16 6.31 Bottom surface 3.80 3.00 Left surface 6.16 5.01 Right surface 6.16 6.31 Front surface 6.16 6.31 Back surface 6.16 6.31 3 Top surface 6.16 5.62 Bottom surface 6.16 3.01 Left surface 3.25 6.31 Right surface 6.16 6.31 Front surface 6.16 3.58 Back surface 3.40 5.92 4 Top surface 6.16 6.31 Bottom surface 6.16 5.62 Left surface 3.34 6.31 Right surface 6.16 3.79 Front surface 6.16 5.43 Back surface 6.16 6.31 5 Top surface 6.16 6.31 Bottom surface 6.16 3.00 Left surface 3.76 6.31 Right surface 3.74 3.99 Front surface 6.16 6.31 Back surface 6.16 4.63 Note. The mean log value of E. coli in the positive control group was 6.16 and the mean log value of Staphylococcus aureus was 6.31. -
The prevention and control of the novel coronavirus pneumonia have resulted in a new demand for disinfection, i.e., low-temperature disinfection. At present, scientific research reports on low-temperature disinfection have been mainly based on laboratory research data, which proved that different types of cryogenic disinfectants are effective for disinfection under low-temperature conditions in the laboratory [23-27]. Still, no field application research on cryogenic disinfectants has been applied in the real world. In this study, in accordance with China’s low-temperature disinfection site evaluation criteria[22], Staphylococcus aureus (ATCC6538) and Escherichia coli (8099), which have higher resistance than SARS-CoV-2, were used as indicator microorganisms for field research, and the results and conclusions obtained from the study have good significance for the on-site low-temperature disinfection of COVID-19 epidemic prevention and control. Low-temperature disinfection is mainly used for the disinfection of high-risk cold chain food packaging and environmental items in alpine areas. In this study, we performed an on-site assessment of a cryogenic disinfectant for the alpine environment and outer packaging of frozen items. Suifenhe and Qingdao (the entry and exit port of cold chain food) were selected as the research field. The main methods of low-temperature disinfection included manual spraying of cryogenic disinfectants and mechanized six-sided spraying. Our results showed that the correct use of cryogenic disinfectants could effectively disinfect the outer packaging of cold chain food, the inner surfaces of cold chain transport vehicles, and the surfaces of items in alpine areas. However, improper, mechanized operation or manual spraying can lead to unqualified disinfection.
In this study, all six sides of the outer packaging of items were disinfected by mechanical spraying. The cryogenic disinfectant was loaded into the equipment and sprayed on the six sides of the packaging when the items passed through the equipment. The three types of equipment were sprayed for different durations, and the amount of cryogenic disinfectant was different. The spraying time of equipment A was 3−4 s. After disinfection, all six sides of the item were almost dry. There was no disinfectant left on the surface, and the qualified disinfection rate was 0%. For equipment B, the spraying time of each item was 7−8 s. After disinfection, several surfaces of the outer package were wet, but most of the surfaces were not wet (no disinfectant left). The disinfection qualified rate was 25%. The spraying time of equipment C was 30−40 s. After disinfection, all sides of the items were wet, and the qualified rate was 100%. In the process of mechanized low-temperature disinfection, a sufficient spraying dose of cryogenic disinfectant is the key factor. The relevant parameters of the equipment should be adjusted to ensure that after spraying, the six sides of the outer package are wet in order to ensure that the low-temperature disinfection is effective.
Next, we examined scenarios involving manual spraying. The cold chain containers in Qingdao, the storage warehouses, and containers in Suifenhe were manually disinfected by researchers using standardized low-temperature disinfection operations, and the disinfection qualified rate was 100%. The staff of the enterprises disinfected the surfaces of the outer packaging of the stacked cold chain food. Due to the incomplete spraying and disinfection, some surfaces were not sprayed with low-temperature disinfectant, and the disinfection qualified rate was 81.67%. The staff of the enterprises also disinfected cold chain transport vehicles in Qingdao. For the same reason, the disinfection qualified rate on the first day was only 70%. After professional technical training, the low-temperature disinfectant was more evenly sprayed on the inner surfaces of the cold chain transport vehicle covering all the surfaces, and that these surfaces remain wet for half an hour (observed by the naked eye), the disinfection qualified rate reached 100%. Although manual spraying of cryogenic disinfectants is simple and convenient, the improper operation of disinfection personnel can easily lead to unqualified disinfection. Standardized disinfection operations and spraying a sufficient disinfectant are essential to ensure qualified disinfection. Therefore, the technical training of disinfection staff should be strengthened for manual spraying and disinfection. Also, it is necessary to standardize the disinfection operation to ensure the disinfection effect.
-
Cryogenic disinfectants are effective in disinfecting alpine environments and the outer packaging of frozen items. The application of cryogenic disinfectants should be regulated to ensure that they cover all surfaces of the disinfected object, thus ensuring effective cryogenic disinfection.
-
We thank Suifenhe Center for Disease Control and Prevention for providing the alpine region site and the Qingdao Municipal Center for Disease Control and Prevention for providing the imported cold chain items site. We also thank Heilongjiang suifa disinfection service Co LTD, Mudanjiang xinxing chemical Co LTD, Qingdao yizhihang Refrigeration Co LTD (EIMSKIP), Qingdao huitong fengyuan supply chain management Co LTD, Qingdao Yihexing Foods Co LTD, Huangdao District Dashaotou branch of Xiehong food store.
-
All authors (the name of the author) declare that they have no conflict of interest or financial conflicts to disclose.
-
The data that support the findings of this study are available from the corresponding author, upon reasonable request.
doi: 10.3967/bes2023.019
On-Site Assessment of a Cryogenic Disinfectant for the Alpine Environment and Outer Packaging of Frozen Items
-
Abstract:
Objective To study the effectiveness and feasibility of cryogenic disinfectants in different cold scenarios and analyze the key points of on-site cryogenic disinfection. Methods Qingdao and Suifenhe were selected as application sites for the manual or mechanical spraying of cryogenic disinfectants. The same amount of disinfectant (3,000 mg/L) was applied on cold chain food packaging, cold chain containers, transport vehicles, alpine environments, and article surfaces. The killing log value of the cryogenic disinfectant against the indicator microorganisms (Staphylococcus aureus and Escherichia coli) was used to evaluate the on-site disinfection effect. Results When using 3,000 mg/L with an action time of 10 min on the ground in alpine regions, the surface of frozen items, cold-chain containers, and cold chain food packaging in supermarkets, all external surfaces were successfully disinfected, with a pass rate of 100%. The disinfection pass rates for cold chain food packaging and cold chain transport vehicles of centralized supervised warehouses and food processing enterprises were 12.5% (15/120), 81.67% (49/60), and 93.33% (14/15), respectively; yet, the surfaces were not fully sprayed. Conclusion Cryogenic disinfectants are effective in disinfecting alpine environments and the outer packaging of frozen items. The application of cryogenic disinfectants should be regulated to ensure that they cover all surfaces of the disinfected object, thus ensuring effective cryogenic disinfection. -
Key words:
- Cryogenic disinfectant /
- COVID-19 /
- An alpine environment /
- Disinfection /
- Outer packaging of frozen items
注释:1) AUTHOR CONTRIBUTIONS: -
Figure 1. Schematic illustration of the location of bacteria carriers for different disinfection objects. (A) The six sides of the cold chain food packaging with bacterial carriers; (B) six-sided equipment; (C) cold chain container; (D) cold chain food outer packaging (stacked); (E) cold chain transporter vehicles; (F) the outer packaging (minimum packaging) and inner packaging of cold chain food; (G) empty container placed outdoors
Table 1. Disinfection effectiveness in different parts of the cold chain food outer packaging (Equipment B)
Item number Position of the
tablet on the
packaging surfaceE. coli killing
log valueS. aureus
killing log
value1 Top surface* 2.33 2.37 Bottom surface* 3.05 2.86 Left surface* 1.68 1.28 Right surface* 1.98 1.72 Front surface* 1.91 2.27 Back surface* 0.85 3.22 2 Top surface* 2.12 4.62 Bottom surface 3.87 4.44 Left surface* 1.27 1.53 Right surface* 1.44 2.50 Front surface* 1.54 2.01 Back surface* 2.54 2.71 3 Top surface* 2.50 3.20 Bottom surface 4.25 3.96 Left surface* 2.22 2.09 Right surface* 1.99 1.22 Front surface* 1.58 2.07 Back surface* 2.37 1.36 4 Top surface* 2.79 2.60 Bottom surface 5.51 3.14 Left surface* 1.57 3.89 Right surface* 1.99 1.87 Front surface* 1.82 1.93 Back surface* 2.03 3.50 5 Top surface* 3.13 2.28 Bottom surface 4.23 4.35 Left surface* 1.82 1.33 Right surface* 2.10 1.88 Front surface* 2.10 1.87 Back surface* 2.25 1.47 Note. The mean log value of E. coli in the positive control group was 5.91 and the mean log value of S. aureus was 5.79. *Indicates that the surface disinfection failed (the surface of Staphylococcus aureus or Escherichia coli any piece of bacteria failed to pass then marked as unqualified).  下载: 导出CSV
Table 2. Disinfection effectiveness in different parts of the cold chain container (Constant Sprayer)
Container number Positioning of the tablets in the container E. coli killing log value S. aureus killing log value 1 Front wall 3.12 3.07 Bottom 3.88 4.08 Side wall1 3.01 3.76 Side wall2 4.37 4.43 Side wall3 3.92 4.04 2 Front wall 3.03 3.04 Bottom 3.05 3.02 Side wall1 3.26 3.05 Side wall2 3.07 4.2 Side wall3 3.23 3.09 3 Front wall 3.95 5.02 Bottom 3.74 3.61 Side wall1 4.59 3.27 Side wall2 3.00 3.47 Side wall3 3.54 3.36 Note. The mean log value of E. coli in the positive control group was 6.07 and the mean log value of S. aureus was 5.74.
下载: 导出CSV
Table 3. Disinfection effectiveness in different parts of the outer surface of the cold chain food pile (Constant Sprayer)
Item
numberPositioning of the
tablets on the surfaceE. coli killing
log valueS. aureus killing
log value1 Front surface* 3.12 2.81 Back surface* 3.15 2.82 Left surface* 3.18 2.45 Right surface 3.96 5.14 2 Front surface 3.28 4.54 Back surface 3.22 3.73 Left surface 3.07 3.62 Right surface 5.19 5.44 3 Front surface 3.34 4.44 Back surface 3.19 3.78 Left surface 3.07 3.53 Right surface 4.58 5.44 4 Front surface 3.01 4.96 Back surface 3.09 3.18 Left surface 3.21 3.99 Right surface 4.36 5.44 5 Front surface 3.19 4.84 Back surface 3.07 3.76 Left surface* 2.97 3.77 Right surface 3.25 5.14 6 Front surface 3.60 4.94 Back surface 3.33 3.11 Left surface 3.49 4.37 Right surface* 2.29 2.65 7 Front surface 3.05 4.05 Back surface* 2.54 4.21 Left surface* 2.28 3.03 Right surface* 2.41 4.80 8 Front surface* 2.60 3.73 Back surface 3.52 3.23 Left surface* 1.91 2.46 Right surface 3.35 3.53 9 Front surface* 3.12 2.49 Back surface 3.01 3.13 Left surface 3.01 4.54 Right surface* 2.65 5.07 10 Front surface* 2.37 3.64 Back surface 3.34 5.15 Left surface* 2.12 2.57 Right surface 3.03 4.33 11 Front surface 5.28 4.91 Back surface 4.06 3.32 Left surface 3.76 4.83 Right surface 3.95 4.23 12 Front surface 4.88 4.76 Back surface 3.47 3.11 Left surface 4.98 3.29 Right surface 3.56 3.61 13 Front surface 3.89 3.10 Back surface* 3.86 2.95 Left surface 4.02 4.05 Right surface 4.58 4.25 14 Front surface* 3.40 2.80 Back surface* 2.96 3.21 Left surface 3.00 4.66 Right surface* 4.37 2.92 15 Front surface* 4.46 2.93 Back surface 4.07 3.98 Left surface* 2.94 4.91 Right surface 5.28 4.61 Note. The mean log value of E. coli in the positive control group was 6.07 (5.98−6.17) and the mean log value of S. aureus was 5.74 (5.84−6.24). *Indicates that the surface disinfection failed (the surface of S. aureus or Escherichia coli any piece of bacteria failed to pass then marked as unqualified).
下载: 导出CSV
Table 4. Disinfection effectiveness in different parts of the cold chain transport vehicle compartment (Constant Sprayer)
Item number Positioning of the tablets in the carriage E. coli killing log value S. aureus killing log value 1 Top surface* 2.82 3.02 Front wall* 3.58 2.60 Bottom surface* 2.71 3.01 Side wall1 4.07 3.56 Side wall2 3.62 3.06 2 Top surface 3.35 4.21 Front wall 4.22 3.25 Bottom surface 3.67 4.85 Side wall1 4.79 4.53 Side wall2 4.18 4.85 3 Top surface 5.90 4.42 Front wall 3.67 4.23 Bottom surface 4.41 4.60 Side wall1 4.19 4.53 Side wall2 4.22 3.44 Note. The mean log value of E. coli in the positive control group was 5.90 and the mean log value of S. aureus was 5.94. *Indicates that the surface disinfection failed (the surface of S. aureus or E. coli any piece of bacteria failed to pass then marked as unqualified).
下载: 导出CSV
Table 5. Disinfection effectiveness in different parts of the inner and outer packaging of cold chain foods (Manual Pressure Watering Can)
Item
numberPositioning of
the tabletsE. coli killing
log valueS. aureus killing
log value1 Outer surface 3.68 5.80 Inner surface 3.97 3.51 2 Outer surface 3.06 5.80 Inner surface 3.68 3.18 3 Outer surface 3.00 5.80 Inner surface 3.75 3.11 4 Outer surface 3.01 5.80 Inner surface 4.39 5.49 5 Outer surface 3.63 5.80 Inner surface 3.06 3.75 6 Outer surface 3.08 5.40 Inner surface 3.25 4.11 7 Outer surface 3.03 5.80 Inner surface 3.18 4.97 8 Outer surface 3.09 5.80 Inner surface 3.01 4.19 9 Outer surface 3.22 5.80 Inner surface 3.06 5.49 10 Outer surface 3.19 5.80 Inner surface 3.68 5.37 11 Outer surface 3.53 3.00 Inner surface 4.90 4.23 12 Outer surface 3.05 4.00 Inner surface 5.77 5.80 13 Outer surface 3.40 4.02 Inner surface 5.77 5.40 14 Outer surface 3.80 3.07 Inner surface 5.77 5.40 15 Outer surface 3.12 3.05 Inner surface 5.77 5.80 16 Outer surface 3.13 3.13 Inner surface 5.77 5.80 17 Outer surface 3.47 3.04 Inner surface 5.77 5.10 18 Outer surface 3.16 4.21 Inner surface 5.37 5.80 19 Outer surface 3.82 3.20 Inner surface 5.77 5.80 20 Outer surface 3.19 4.45 Inner surface 5.77 5.80 Note. The mean log value of E. coli in the positive control group was 5.77 and the mean log value of S. aureus was 5.80.
下载: 导出CSV
Table 6. Disinfection effectiveness in different parts of frozen goods outer packaging in alpine regions (Equipment C)
Item
numberPosition of the
tablet on the
packaging surfaceE. coli
killing log valueS. aureus
killing log value1 Top surface 4.18 6.31 Bottom surface 6.16 3.52 Left surface 4.98 6.31 Right surface 3.77 6.31 Front surface 6.16 4.29 Back surface 6.16 5.92 2 Top surface 6.16 6.31 Bottom surface 3.80 3.00 Left surface 6.16 5.01 Right surface 6.16 6.31 Front surface 6.16 6.31 Back surface 6.16 6.31 3 Top surface 6.16 5.62 Bottom surface 6.16 3.01 Left surface 3.25 6.31 Right surface 6.16 6.31 Front surface 6.16 3.58 Back surface 3.40 5.92 4 Top surface 6.16 6.31 Bottom surface 6.16 5.62 Left surface 3.34 6.31 Right surface 6.16 3.79 Front surface 6.16 5.43 Back surface 6.16 6.31 5 Top surface 6.16 6.31 Bottom surface 6.16 3.00 Left surface 3.76 6.31 Right surface 3.74 3.99 Front surface 6.16 6.31 Back surface 6.16 4.63 Note. The mean log value of E. coli in the positive control group was 6.16 and the mean log value of Staphylococcus aureus was 6.31.
下载: 导出CSV
-
[1] World Health Organization (WHO). WHO coronavirus (COVID-19) dashboard.https://covid19.who.int/. [2022-04-11]. [2] Galloway SE, Paul P, MacCannell DR, et al. Emergence of SARS-CoV-2 B. 1.1. 7 lineage - United States, December 29, 2020-January 12, 2021. MMWR Morb Mortal Wkly Rep, 2021; 70, 95−9. doi: 10.15585/mmwr.mm7003e2 [3] European Centre for Disease Prevention and Control. Risk assessment on COVID-19, 21 January 2021. [4] Yamasoba D, Kimura I, Nasser H, et al. Virological characteristics of SARS-CoV-2 BA. 2 variant.https://doi.org/10.1101/2022.02.14.480335. [5] National Health Commission of the People's Republic of China. Diagnosis and treatment of COVID-19(trial 9th edition). http://www.nhc.gov.cn/yzygj/s7653p/202203/b74ade1ba4494583805a3d2e40093d88.shtml. [2022-03-15]. (In Chinese) [6] Chin AWH, Chu JTS, Perera MRA, et al. Stability of SARS-CoV-2 in different environmental conditions. Lancet Microbe, 2020; 1, e10. doi: 10.1016/S2666-5247(20)30003-3 [7] Kampf G. Potential role of inanimate surfaces for the spread of coronaviruses and their inactivation with disinfectant agents. Infect Prev Pract, 2020; 2, 100044. doi: 10.1016/j.infpip.2020.100044 [8] National Health Commission of the People's Republic of China. Guidelines for use of disinfectants. http://www.nhc.gov.cn/cms-search/xxgk/getManuscriptXxgk.htm?id=b9891e8c86d141a08ec45c6a18e21dc2. [2020-02-07]. (In Chinese) [9] Chan KH, Sridhar S, Zhang RR, et al. Factors affecting stability and infectivity of SARS-CoV-2. J Hosp Infect, 2020; 106, 226−231. doi: 10.1016/j.jhin.2020.07.009 [10] Harbourt DE, Haddow AD, Piper AE, et al. Modeling the stability of severe acute respiratory syndrome coronavirus 2 (SARS-CoV-2) on skin, currency, and clothing. PLoS Negl Trop Dis, 2020; 14, e0008831. doi: 10.1371/journal.pntd.0008831 [11] Liu H, Fei CN, Chen YL, et al. Investigating SARS-CoV-2 persistent contamination in different indoor environments. Environ Res, 2021; 202, 111763. doi: 10.1016/j.envres.2021.111763 [12] Kwon T, Gaudreault NN, Richt JA. Environmental stability of SARS-CoV-2 on different types of surfaces under indoor and seasonal climate conditions. Pathogens, 2021; 10, 227. doi: 10.3390/pathogens10020227 [13] Matson MJ, Yinda CK, Seifert SN, et al. Effect of environmental conditions on SARS-CoV-2 stability in human nasal mucus and sputum. Emerg Infect Dis, 2020; 26, 2276−8. doi: 10.3201/eid2609.202267 [14] World Health Organization (WHO). Coronavirus disease 2019 (COVID-19) situation report-32.20200221-sitrep-32-covid-19.pdf (who.int). [2020-02-21]. [15] Biryukov J, Boydston JA, Dunning RA, et al. Increasing temperature and relative humidity accelerates inactivation of SARS-CoV-2 on surfaces. mSphere, 2020; 5, e00441−20. [16] Mohan SV, Hemalatha M, Kopperi H, et al. SARS-CoV-2 in environmental perspective: occurrence, persistence, surveillance, inactivation and challenges. Chem Eng J, 2021; 405, 126893. doi: 10.1016/j.cej.2020.126893 [17] Pang XH, Ren LL, Wu SS, et al. Cold-chain food contamination as the possible origin of COVID-19 resurgence in Beijing. Natl Sci Rev, 2020; 7, 1861−4. doi: 10.1093/nsr/nwaa264 [18] Health Commission of Dalian. The twenty-ninth concentrated press conference on the prevention and control of COVID-19 epidemic.https://www.dl.gov.cn/vipchat/home/site/11/644/article.html. [2020-08-03]. (In Chinese) [19] The Paper. Press conference of epidemic prevention and control in Qingdao (October 16, 2020).https://www.thepaper.cn/newsDetail_forward_9588989. [2020-10-16]. (In Chinese) [20] Chinese Center for Disease Control and Prevention. The China CDC has isolated live SARS-CoV-2 in cold chain food packaging.https://www.chinacdc.cn/jkzt/crb/zl/szkb_11803/jszl_2275/202010/t20201017_222144.html. [2020-10-17]. (In Chinese) [21] Sun HH, Duan HY, Zhang W, et al. Development of cryogenic disinfectants using in –18 °C and –40 °C environments — worldwide, 2021. China CDC Wkly, 2021; 3, 285−9. doi: 10.46234/ccdcw2021.079 [22] National Health Commission of the People’s Republic of China. WST 774-2021 Standard of field disinfection evaluation during COVID-19 epidemic. 2021. (In Chinese) [23] Zhang XL, Li J, Zhang LL, et al. Study on the disinfection effect of common disinfectants on surface of objects in low temperature environment. Chin J Disinfect, 2021; 38, 801−3,806. (In Chinese [24] Cai R, Lu LX, Wei LF, et al. Physicochemical properties and germicidal efficacy of a low-temperature hydrogen peroxide disinfectant. Chin J Disinfect, 2022; 39, 1−3. (In Chinese [25] Wu XS, Chen Y, Wang L, et al. Effectiveness of disinfectants suitable for inactivating SARS-CoV-2 at cold-chain temperature. Food Environ Virol, 2022; 14, 101−4. doi: 10.1007/s12560-022-09509-0 [26] Pang XM, Xie SY, Lu D, et al. Antifreezing protection and disinfection effect of concentrated glutaraldehyde antifreeze disinfectant. China Anim Health Insp, 2022; 39, 120−4. (In Chinese [27] Yin FZ, Zhang XL, Zhang LL. Evaluation of disinfection effect of low temperature hydrogen peroxide disinfectant. Chin J Disinfect, 2022; 39, 94−7. (In Chinese -

 点击查看大图
计量
- 文章访问数: 537
- HTML全文浏览量: 245
- PDF下载量: 69
- 被引次数: 0


 Quick Links