

 下载:
下载:


-
Nabothian cysts are commonly observed in post-pubertal females and arise from the obstruction of squamous epithelium-covered columnar epithelium secretions in the uterine cervix[1]. Nabothian cysts can be caused by multiple conditions including inflammation, cervical trauma, pregnancy, and hormonal imbalance. The size of the cyst ranges from 2 to 10 mm and can occur as single or multiple cysts. Nabothian cysts are usually asymptomatic unless they become very large or present as numerous cysts on the cervix, which can cause hematometra and pelvic pain due to compression of the urethra or bladder neck[2-4]. Hysterectomy is often considered the best treatment option, particularly in participants with large nabothian cysts and unusual symptoms[2-4].
Nicotinamide adenine dinucleotide (NAD+), a co-substrate for Poly (ADP-ribose) polymerases, sirtuins, and cyclic ADP-ribose synthases, is a coenzyme of many dehydrogenases in the body that are involved in the tricarboxylic acid cycle and the respiratory chain. It regulates cellular signal transduction by affecting the activity of NAD+-consuming enzymes. Additionally, it plays an important role in a wide range of processes, including metabolism, oxidative stress, inflammation, and aging[5-8]. Uterine trauma significantly affects NAD kinase activity and NAD metabolism[9]. Sirtuin 1 encoded by the SIRT1 gene is the most conserved mammalian NAD+ dependent histone deacetylase[10,11]. Activation of the β4/SNAI1/SIRT3 signaling pathway could promote epithelial cell migration in cervical cancer[12]. SIRT1 and SIRT7 show low levels of positive in the basal layer of the non-neoplastic squamous epithelium of the cervix[13,14]. In addition, some studies have demonstrated that SIRT1 is overexpressed in squamous intraepithelial neoplasia and squamous cell carcinoma[14]. Our previous study found that whole-blood NAD+ was associated with aging and its levels decreased in women aged 18–49 years[15]. However, little is known about the association between whole-blood NAD+ levels and nabothian cysts. Therefore, we aimed to investigate the association between NAD+ and total nabothian cysts as well as single or multiple cysts in a relatively large-scale community-based population.
-
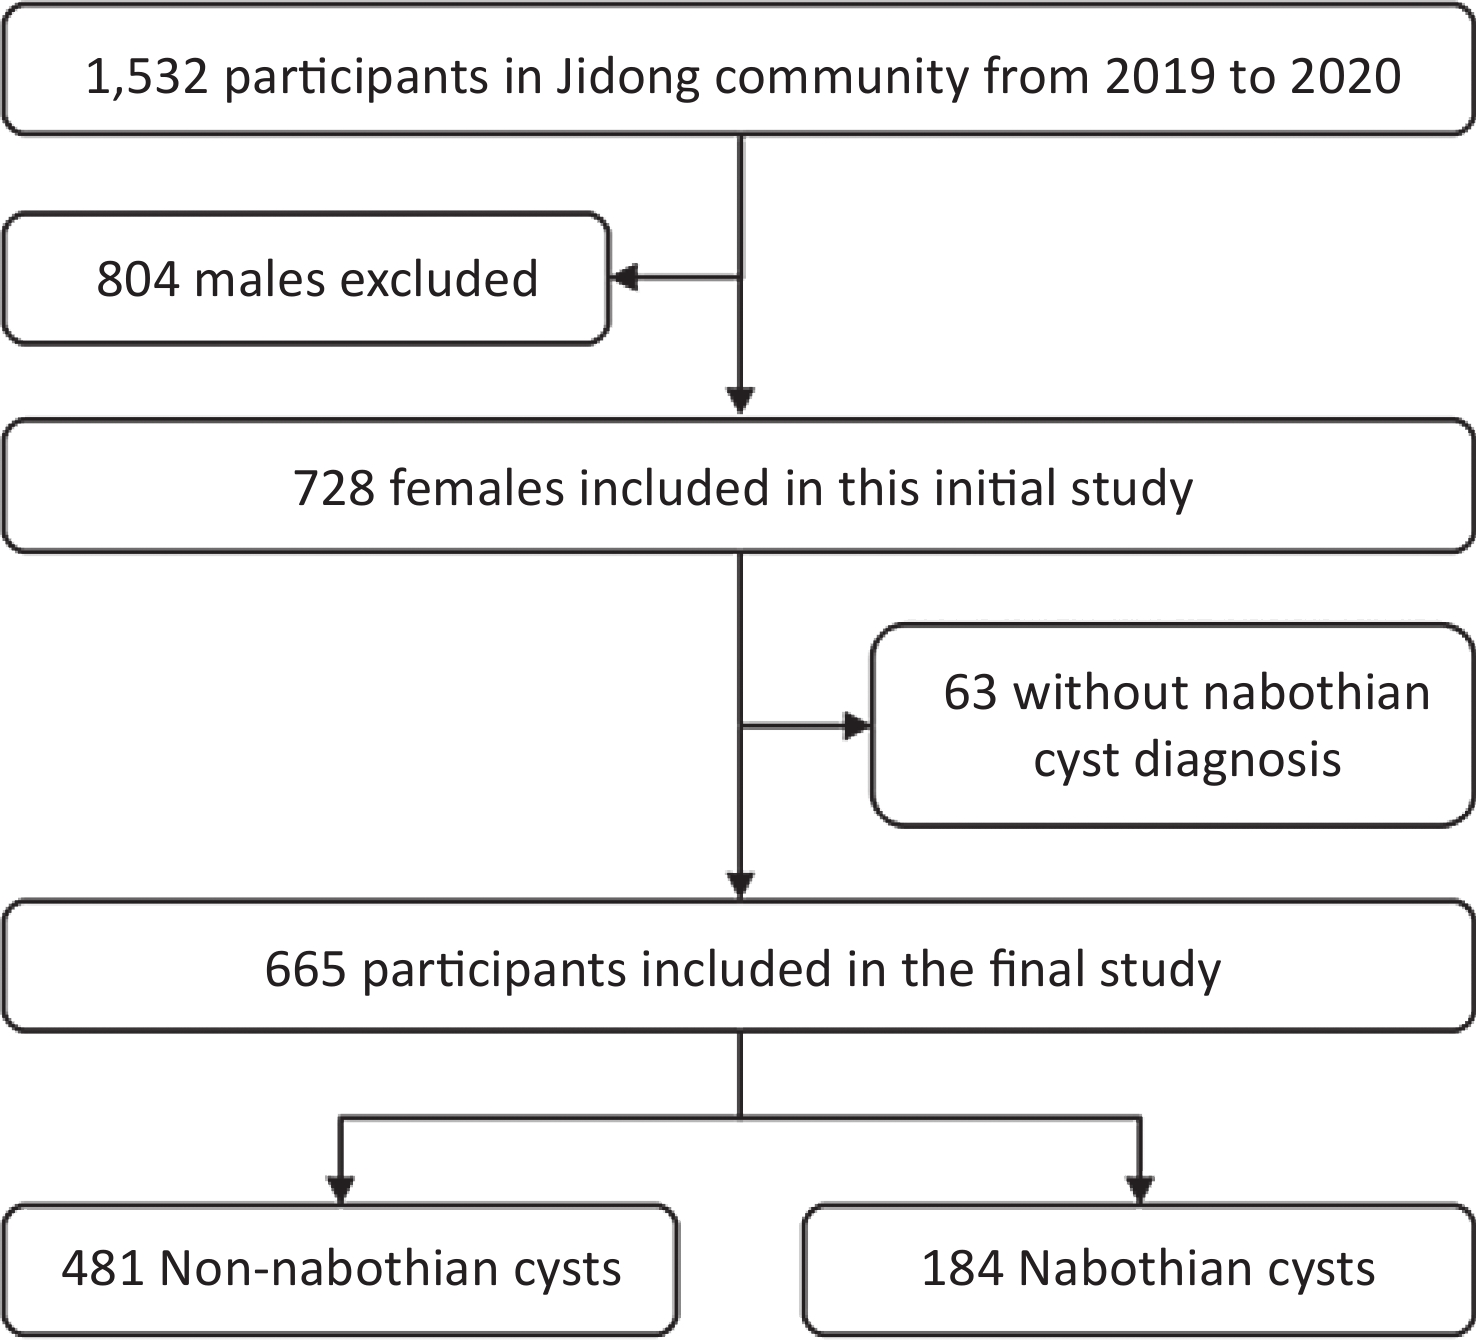
Data used in this study were obtained from the Jidong community in Tangshan, northern China. A total of 1,532 participants aged 18–99 years were recruited for this study between August 2019 and January 2020. We analyzed 665 women after excluding 804 men and 63 women with missing data on nabothian cyst diagnosis (Figure 1). The study was conducted according to the guidelines of the Helsinki Declaration, and the study protocol was approved by the Ethics Committee of the Staff Hospital of the Jidong Oil-Field of Chinese National Petroleum (approval number 2018 YILUNZI 1). All participants provided written informed consent before participating in the study.
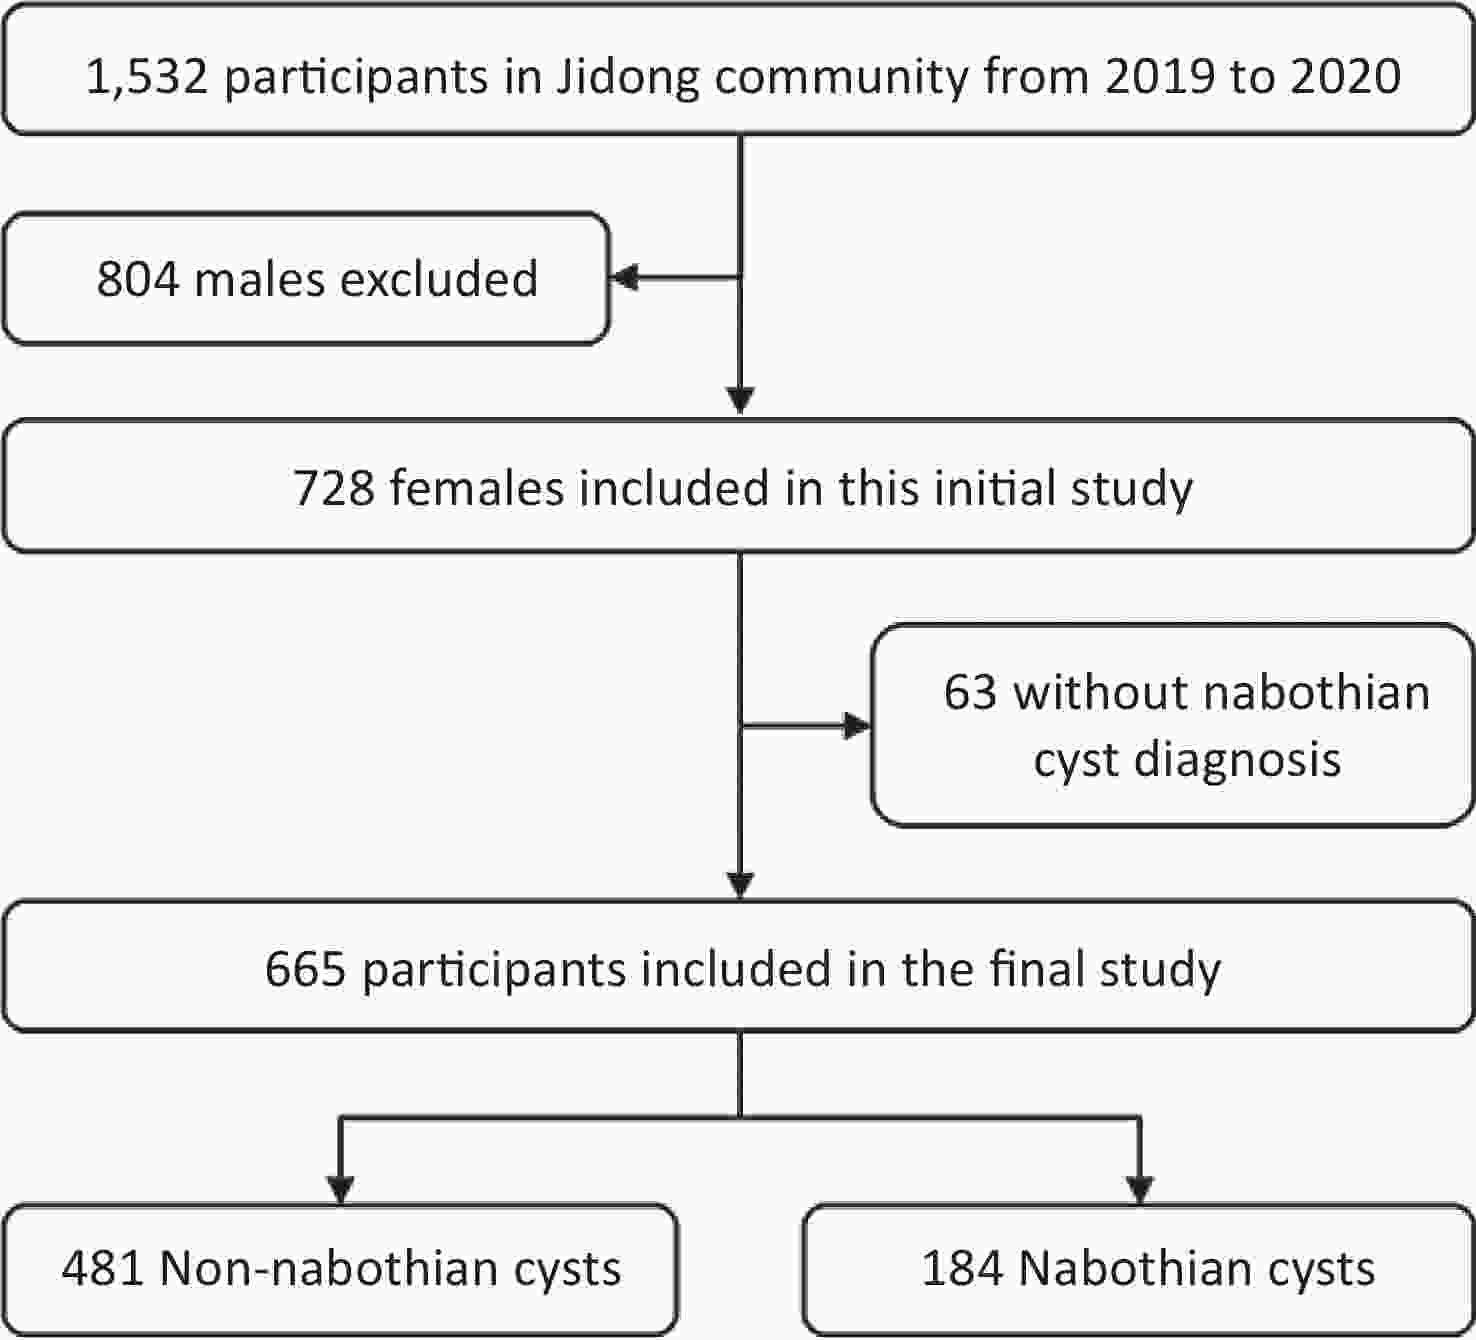
Figure 1. Flowchart of the inclusion and exclusion criteria of this study.
-
Baseline data were collected by well-trained research coordinators using standardized questionnaires. The baseline data included participant demographics, education, physical activity, medical conditions, and other relevant factors. Height and weight were measured using standard anthropometric techniques, and the body mass index (BMI) was calculated by dividing the measured weight (kg) by the square of the measured height (m2). Systolic and diastolic blood pressures (SBP and DBP, respectively) were measured using an automatic digital blood pressure monitor. Blood samples were collected in ethylenediaminetetraacetic acid (EDTA)-coated tubes, and laboratory measurements were performed in the central laboratory of the Staff Hospital of the Jidong Oil-Field, as previously described[15,16]. Alanine transaminase, aspartate transaminase, high-density lipoprotein cholesterol, low-density lipoprotein cholesterol, triglyceride (TG), total cholesterol, and red blood cells (RBC) were performed with an auto-analyzer (Hitachi 747; Hitachi, Tokyo, Japan)[15,16]. Medical conditions included hypertension and dyslipidemia according to documented or self-reported history, medication for corresponding diseases, or clinical or laboratory examinations.
-
After overnight fasting, blood samples were collected from the large antecubital vein and placed in vacuum tubes containing EDTA. Cycling assays and liquid chromatography tandem mass spectrometry (LC-MS/MS) analyses were used to measure NAD+ levels in the laboratory using methods described previously[15,16].
-
Nabothian cysts are diagnosed based on gynecological ultrasound examination and are classified into single and multiple cysts based on the number of cysts in the cervix. Multiple nabothian cysts were defined as the presence of more than two cysts. All reports and ultrasound images were obtained by an experienced gynecologist.
-
The participants were separated into four groups according to NAD+ level quartiles. The quartiles were as follows: Q1, < 27.6 μmol/L (n = 166); Q2, 27.6–30.9 μmol/L (n = 165); Q3, 30.9–34.4 μmol/L (n = 167); and Q4, ≥ 34.4 μmol/L (n = 167). Values for categorical variables were presented by the frequency and percentage and tested using the chi-square (χ2) test. Values for continuous variables were expressed as mean ± standard deviation and tested using t-test or one-way analysis of variance (ANOVA).
Logistic regression analyses were used to assess the association of NAD+ levels with total nabothian cysts and single or multiple cysts. The multivariate model was adjusted for age, BMI, history of dyslipidemia, SBP, TG level, and number of RBCs. Associations were measured using odds ratios (OR) and the corresponding 95% confidence intervals (CI). In addition, restricted cubic splines with four knots (5th, 35th, 65th, and 95th percentiles) were used to assess the association between continuous whole-blood NAD+ levels and nabothian cysts after adjusting for confounders. P < 0.05 was considered statistically significant. All statistical data were analyzed using SAS 9.4.4 (SAS Institute Inc., Cary, NC, USA), R 4.1.0, and GraphPad Prism (version 8).
-
Table 1 shows the baseline characteristics of the participants according to NAD+ quartile. The mean age of participants was 43.0 ± 11.5 years, and the mean level of NAD+ in the whole population was 31.3 ± 5.3 μmol/L. The mean levels of NAD+ were 25.0 ± 2.6, 29.3 ± 0.9, 32.5 ± 1.0, and 38.3 ± 3.5 μmol/L for the Q1, Q2, Q3, and Q4 groups, respectively. Participants with high NAD+ levels were more likely to have many more RBC, higher SBP, higher TG levels, and a history of dyslipidemia than those with low NAD+ levels. There were no significant differences in the other variables of interest, such as age and BMI, across the NAD+ quartile groups.
Table 1. Baseline characteristics of the study population within quartiles of NAD+ level
Characteristics Overall (n = 665) NAD+ groups P-value Q1 (< 27.6)
(n = 166)Q2 (27.6–30.9)
(n = 165)Q3 (30.9–34.4)
(n = 167)Q4 (≥ 34.4)
(n = 167)NAD+ (μmol/L) 31.3 ± 5.3 25.0 ± 2.6 29.3 ± 0.9 32.5 ± 1.0 38.3 ± 3.5 < 0.01 Age (y) 43.0 ± 11.5 41.0 ± 9.4 43.9 ± 12.8 43.9 ± 11.8 43.4 ± 11.6 0.06 Age at menarche (y) 13.9 ± 1.5 13.8 ± 1.3 13.9 ± 1.6 14.1 ± 1.7 13.8 ± 1.2 0.11 Age at menopausal (y) 50.0 ± 3.7 50.2 ± 3.7 50.6 ± 3.3 49.9 ± 3.3 49.5 ± 4.5 0.54 Body mass index (N, %) 0.39 < 24 kg/m2 414 (62.3) 109 (65.7) 104 (63.0) 106 (63.5) 95 (56.9) ≥ 24 kg/m2 251 (37.7) 57 (34.3) 61 (37.0) 61 (36.5) 73 (43.1) Education level (N, %) 0.39 Middle school or below 206 (31.0) 46 (27.7) 59 (35.8) 48 (28.7) 53 (31.7) College or above 459 (69.0) 120 (72.3) 106 (64.2) 119 (71.3) 114 (68.3) Physical activity (N, %) 0.17 Inactive 188 (30.1) 52 (33.1) 38 (24.5) 41 (26.5) 57 (36.7) Moderate active 116 (18.6) 32 (20.4) 31 (19.6) 27 (17.4) 26 (16.8) Active 321 (51.4) 73 (46.5) 89 (56.3) 87 (56.1) 72 (46.5) Hypertension (N, %) 106 (17.2) 18 (11.6) 28 (17.7) 28 (18.1) 33 (21.4) 0.14 Dyslipidemia (N, %) 254 (38.2) 47 (28.3) 64 (38.8) 66 (39.5) 77 (46.1) 0.01 SBP (mmHg) 121.1 ± 17.3 117.5 ± 14.8 121.9 ± 19.4 122.5 ± 16.2 122.3 ± 18.3 0.04 DBP (mmHg) 75.3 ± 12.0 74.0 ± 11.1 75.2 ± 11.7 75.7 ± 11.2 76.6 ± 13.6 0.26 RBC (1012/L) 4.4 ± 0.3 4.3 ± 0.4 4.4 ± 0.3 4.4 ± 0.3 4.5 ± 0.3 < 0.01 LDL-C (mmol/L) 2.2 ± 0.7 2.1 ± 0.7 2.2 ± 0.6 2.3 ± 0.8 2.2 ± 0.8 0.22 HDL-C (mmol/L) 1.3 ± 0.3 1.4 ± 0.3 1.3 ± 0.3 1.3 ± 0.3 1.3 ± 0.3 0.48 TG (mmol/L) 1.4 ± 0.9 1.3 ± 0.8 1.5 ± 1.0 1.3 ± 0.7 1.6 ± 1.0 < 0.01 TC (mmol/L) 5.1 ± 1.0 4.9 ± 0.9 5.1 ± 0.8 5.2 ± 1.0 5.2 ± 1.0 0.08 ALT (U/L) 26.4 ± 21.8 24.2 ± 17.6 27.0 ± 27.2 28.2 ± 24.8 26.2 ± 16.0 0.38 AST (U/L) 24.3 ± 14.1 22.8 ± 8.6 24.6 ± 15.2 25.9 ± 20.9 23.7 ± 7.8 0.24 Note. ALT, alanine aminotransferase; AST, aspartate aminotransferase; DBP, diastolic blood pressure; HDL-C, high-density lipoprotein cholesterol; LDL-C, low-density lipoprotein cholesterol; NAD+, nicotinamide adenine dinucleotide; RBC, red blood cell; SBP, systolic blood pressure; TC, total cholesterol; TG, triglycerides. Data are shown as frequency and percentage for categorical variables and mean ± standard deviation for continuous variables. -
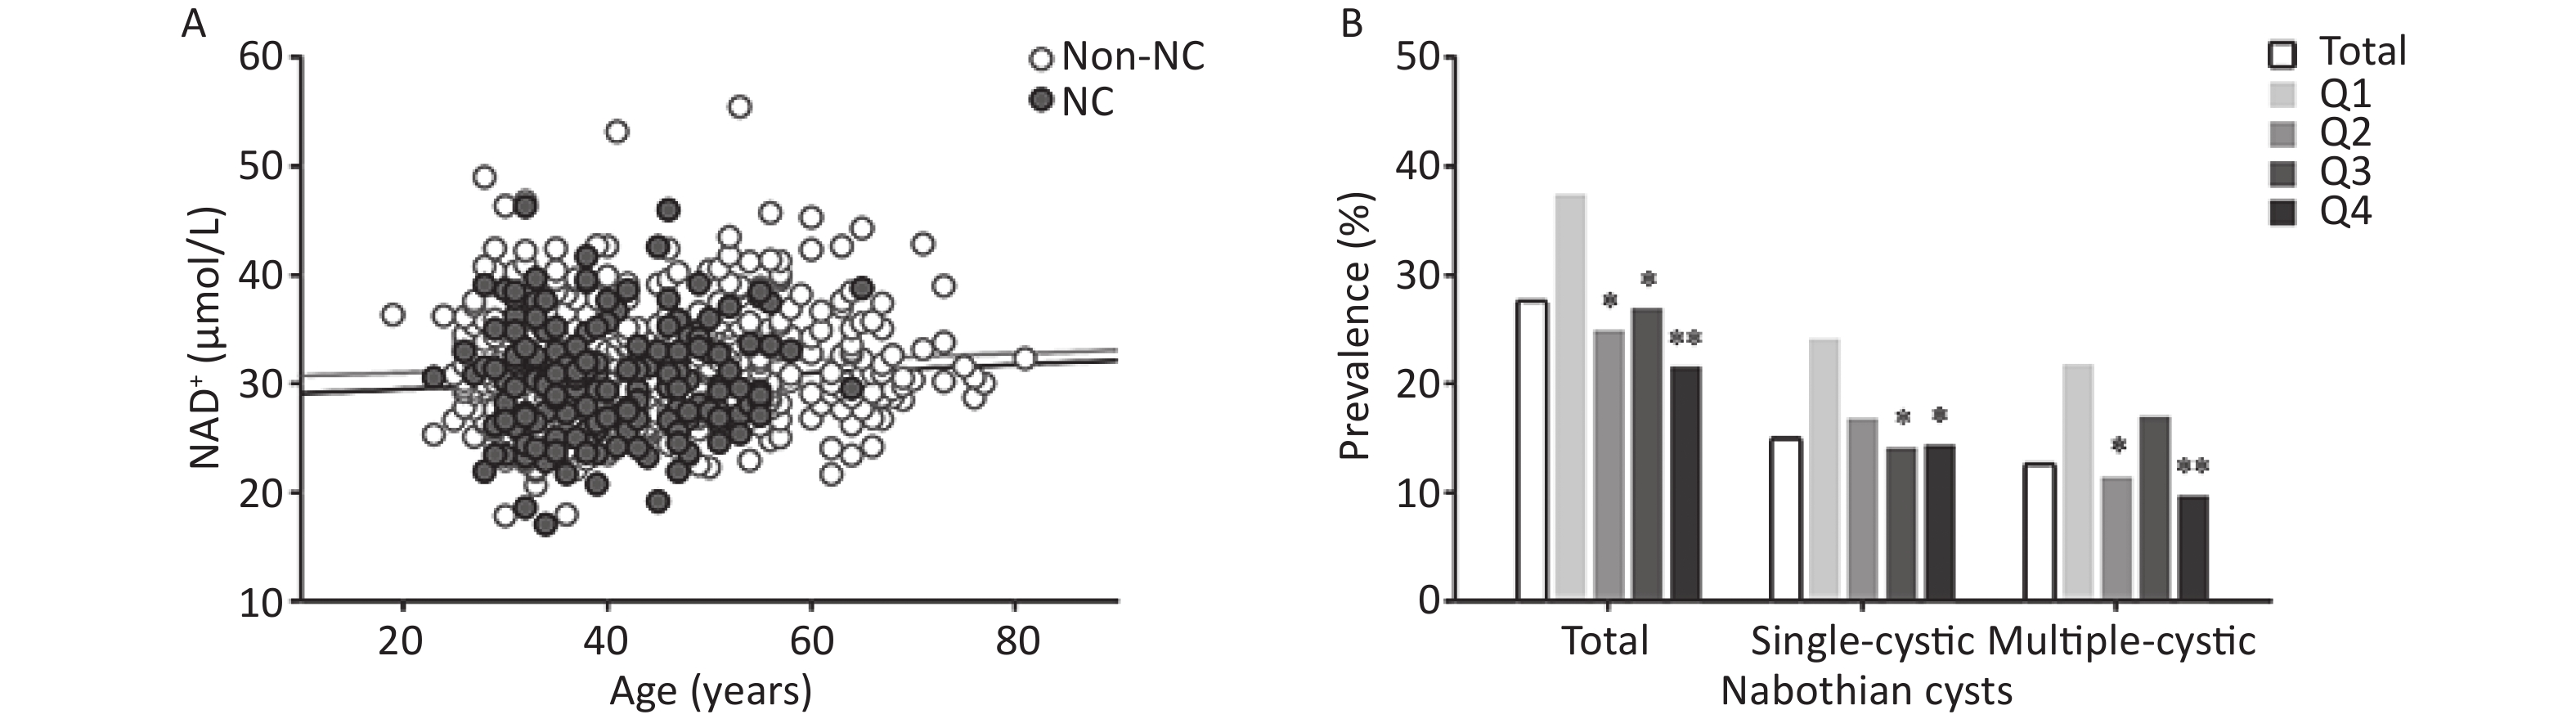
Among the 665 eligible participants, nabothian cysts occurred in 184 (27.7%) participants with, single cysts in 100 (15.0%), and multiple cysts in 84 (12.6%) (Supplementary Table S1, available in www.besjournal.com). The prevalence of nabothian cysts showed a decreasing trend across NAD+ quartiles (P for trend = 0.09). Figure 2A does not show a significant correlation between age and whole-blood NAD+ levels in participants with nabothian cysts (r = 0.04) and in those without nabothian cysts (r = 0.07). Figure 2B shows the prevalence of nabothian cysts according to NAD+ quartiles. The prevalence of total nabothian cysts among participants in the NAD+ quartiles Q1, Q2, Q3, and Q4 were 37.4%, 24.9%, 27.0%, and 21.6%, respectively. The lowest NAD+ level group (Q1) had the highest percentage of total nabothian cysts as well as single and multiple nabothian cysts (P < 0.05).
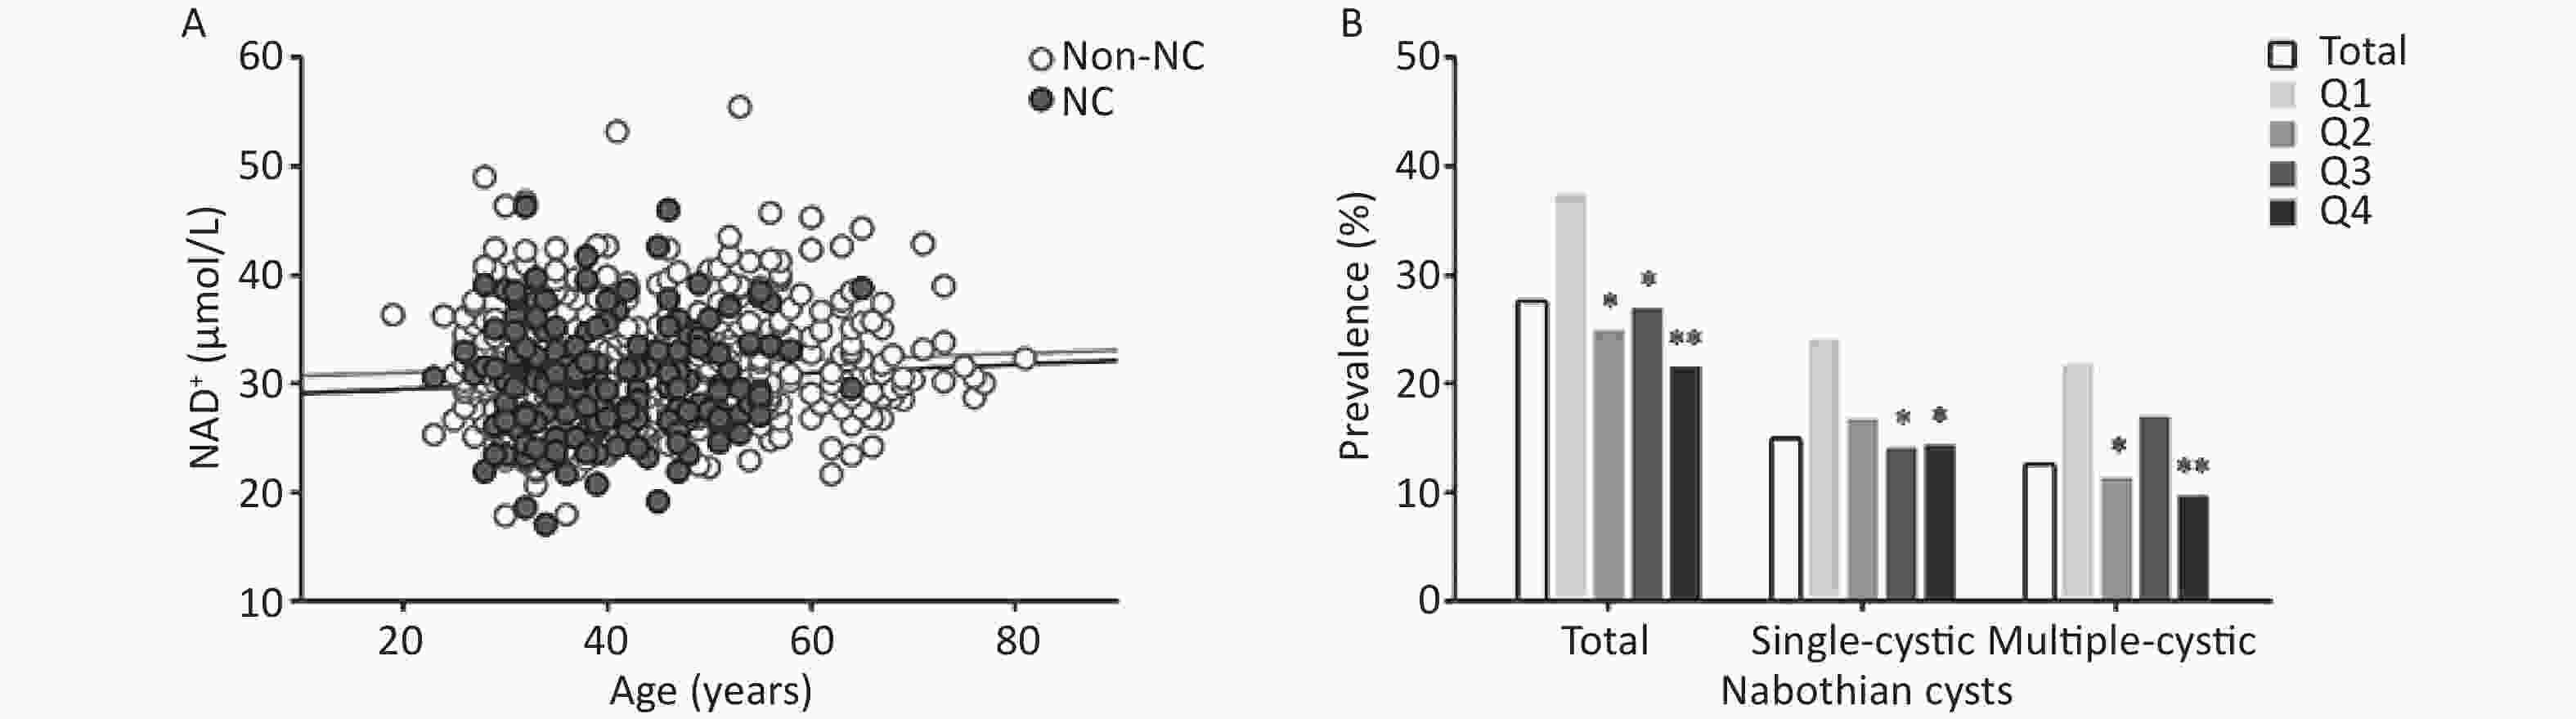
Figure 2. Association between whole-blood NAD+ levels and nabothian cysts in the study population. (A) Correlation between age and NAD+ levels in non-nabothian or nabothian cysts. (B) Comparison of the prevalence of nabothian cysts among the NAD+ quartile groups. NAD+, nicotinamide adenine dinucleotide; Non-NC, non-nabothian cyst; NC, nabothian cyst; Q1, first quartile; Q2, second quartile; Q3, third quartile; Q4, fourth quartile. *indicates statistical difference between the quartile of interest and the first quartile of NAD+ levels. *P < 0.05, **P < 0.01.
Table S1. Descriptive statistics of the characteristics of eligible participants with or without nabothian cysts
Characteristic Non-nabothian cysts
(n = 481)Nabothian cysts P value Total
(n = 184)Single-cystic
(n = 100)Multiple-cystic
(n = 84)NAD+ (μmol/L) 31.7 ± 5.4 30.3 ± 5.1 30.1 ± 5.1 30.5 ± 5.0 0.002 Age (y) 43.9 ± 12.4 40.8 ± 8.2 40.2 ± 8.5 41.4 ± 8.0 < 0.001 Age at menarche (y) 13.9 ± 1.5 13.7 ± 1.3 13.6 ± 1.3 13.7 ± 1.2 0.01 Age at menopausal (y) 49.9 ± 3.9 50.8 ± 3.0 50.7 ± 3.3 50.7 ± 2.9 0.26 Body mass index (N, %) 0.02 < 24 kg/m2 286 (59.5) 128 (69.6) 75 (75.0) 53 (63.1) ≥ 24 kg/m2 195 (40.5) 56 (30.4) 25 (25.0) 31 (36.9) Education level (N, %) 0.01 Middle school or below 161 (33.9) 43 (23.4) 14 (13.2) 23 (30.3) College or above 318 (66.1) 141 (76.6) 63 (81.8) 53 (69.7) Physical activity (N, %) 0.15 Inactive 128 (28.7) 60 (33.5) 24 (32.0) 27 (37.0) Moderate active 78 (17.5) 38 (21.2) 20 (26.7) 13 (17.8) Active 240 (53.8) 81 (45.3) 31 (41.3) 33 (45.2) Hypertension (N, %) 89 (18.9) 25 (13.7) 5 (6.5) 14 (18.7) 0.111 Dyslipidemia (N, %) 206 (42.8) 48 (26.1) 18 (23.4) 22 (29.0) < 0.001 SBP (mmHg) 122.3 ± 18.0 117.7 ± 15.2 115.3 ± 13.5 120.5 ± 16.7 0.003 DBP (mmHg) 75.6 ± 11.6 74.7 ± 12.6 73.1 ± 12.5 76.6 ± 12.7 0.38 RBC (1012/L) 4.4 ± 0.3 4.4 ± 0.4 4.4 ± 0.3 4.5 ± 0.4 0.31 LDL-C (mmol/L) 2.2 ± 0.7 2.1 ± 0.8 2.0 ± 0.8 2.2 ± 0.7 0.03 HDL-C (mmol/L) 1.3 ± 0.3 1.4 ± 0.3 1.3 ± 0.3 1.4 ± 0.2 0.12 TG (mmol/L) 1.5 ± 1.0 1.2 ± 0.7 1.1 ± 0.5 1.3 ± 0.8 < 0.001 TC (mmol/L) 5.2 ± 1.0 4.9 ± 0.9 4.8 ± 0.9 5.0 ± 0.8 0.002 ALT (U/L) 27.1 ± 23.9 24.3 ± 14.8 22.7 ± 13.5 26.3 ± 16.1 0.07 AST (U/L) 24.6 ± 15.9 23.3 ± 8.0 22.4 ± 7.1 24.3 ± 9.0 0.16 Note. ALT, alanine aminotransferase; AST, asparate aminotransferase; DBP, diastolic blood pressure; HDL-C, high-density lipoprotein cholesterol; LDL-C, low-density lipoprotein cholesterol; NAD+, nicotinamide adenine dinucleotide; RBC, red blood cell; SBP, systolic blood pressure; TC, total cholesterol; TG, triglycerides. Data are shown as frequency and percentage for categorical variables and mean ± standard deviation for continuous variables. -
Analysis of the association between NAD+ and nabothian cysts is shown in Table 2. In the unadjusted model, as compared with the NAD+ Q4, ORs with 95% CI of NAD+ Q1 was 2.17 (1.34–3.52) for total nabothian cysts, 1.89 (1.04–3.44) for the single cyst, and 2.61 (1.31–5.19) for multiple cysts. In the multivariate model, as compared with the NAD+ Q4, ORs with 95% CI of NAD+ Q1 was 2.02 (1.21–3.40) for total nabothian cysts, 1.56 (0.82–2.97) for the single cyst, and 2.98 (1.44–6.18) for multiple cysts.
Table 2. Association of whole-blood NAD+ levels with nabothian cysts in all participants
Nabothian cysts Events, N (%) Odds ratios (95% CI) Unadjusted Adjusted Total 184 (27.7) 
Q1 62 (37.4) 2.17 (1.34, 3.52) 2.02 (1.21, 3.40) Q2 41 (24.9) 1.20 (0.72, 2.00) 1.13 (0.66, 1.95) Q3 45 (27.0) 1.34 (0.81, 2.22) 1.26 (0.74, 2.14) Q4 36 (21.6) Ref Ref Single-cystic 100 (17.2) Q1 33 (24.1) 1.89 (1.04, 3.44) 1.56 (0.82, 2.97) Q2 25 (16.8) 1.20 (0.64, 2.24) 1.04 (0.54, 2.02) Q3 20 (14.1) 0.98 (0.51, 1.88) 0.88 (0.44, 1.75) Q4 22 (14.4) Ref Ref Multiple-cystic 84 (14.9) Q1 29 (21.8) 2.61 (1.31, 5.19) 2.98 (1.44, 6.18) Q2 16 (11.4) 1.21 (0.57, 2.58) 1.26 (0.57, 2.80) Q3 25 (17.0) 1.92 (0.95, 3.86) 2.02 (0.97, 4.22) Q4 14 (9.7) Ref Ref Note. CI, confidence interval; Ref, reference; Q1, first quartile; Q2, second quartile; Q3, third quartile; Q4, fourth quartile. Adjustments were made for age, body mass index, history of dyslipidemia, systolic blood pressure, triglyceride level, and number of red blood cells. Subgroup analysis showed associations of NAD+ levels with nabothian cyst in participants stratified by age (< 40 vs. ≥ 40 years), BMI (< 24 vs. ≥ 24 kg/m2), SBP (< 120 vs. ≥ 120 mmHg), and dyslipidemia as see Supplementary Table S2 (available in www.besjournal.com). Age, BMI, SBP, and history of dyslipidemia had no impact on the association between whole-blood NAD+ levels and nabothian cysts (P > 0.05 for interaction).
Table S2. Association of whole blood NAD+ contents with nabothian cysts in each subgroup
Nabothian cysts Age Body Mass Index Systolic Blood Pressure Dyslipidemia Adjusted OR
(95% CI)P for inter-action Adjusted OR
(95% CI)P for inter-action Adjusted OR
(95% CI)P for inter-action Adjusted OR
(95% CI)P for inter-action < 40 y
(n = 302)≥ 40 y
(n = 363)< 24 kg/m2
(n = 414)≥ 24 kg/m2
(n = 251)<120 mmHg
(n = 377)≥ 120 mmHg
(n = 288)Yes
(n = 254)No
(n = 411)Total Q1 1.95
(0.93, 4.11)1.99
(0.96, 4.11)0.93 1.53
(0.81, 2.89)3.69
(1.51, 9.00)0.81 2.03
(1.05, 3.92)2.52
(1.12, 5.69)0.58 2.04
(1.10, 3.82)2.05
(0.81, 5.18)0.53 Q2 0.98
(0.45, 2.13)1.21
(0.57, 2.59)1.19
(0.62, 2.26)0.88
(0.30, 2.54)1.50
(0.77, 2.92)0.82
(0.33, 2.01)1.26
(0.65, 2.43)0.88
(0.32, 2.38)Q3 1.41
(0.65, 3.05)1.09
(0.52, 2.28)1.11
(0.58, 2.11)1.52
(0.58, 3.98)1.80
(0.91, 3.56)1.02
(0.45, 2.32)1.14
(0.59, 2.20)1.40
(0.57, 3.44)Q4 Ref Ref Ref Ref Ref Ref Ref Ref Single-cystic Q1 1.55
(0.65, 3.70)1.47
(0.55, 3.95)0.76 1.17
(0.55, 2.47)4.04
(1.10, 14.84)0.37 1.58
(0.74, 3.38)2.61
(0.84, 8.14)0.82 1.43
(0.67, 3.03)2.20
(0.63, 7.73)0.74 Q2 0.97
(0.40, 2.33)1.08
(0.38, 3.02)1.02
(0.48, 2.15)0.97
(0.20, 4.68)1.42
(0.66, 3.03)0.70
(0.18, 2.73)1.08
(0.50, 2.33)0.87
(0.22, 3.47)Q3 0.74
(0.27, 2.02)1.02
(0.38, 2.72)0.63
(0.28, 1.42)1.98
(0.50, 7.88)1.05
(0.45, 2.46)1.08
(0.33, 3.54)0.70
(0.31, 1.61)1.43
(0.41, 5.06)Q4 Ref Ref Ref Ref Ref Ref Ref Ref Multiple-cystic Q1 3.23
(1.02, 10.34)2.62
(1.02, 6.76)0.83 2.62
(0.98, 7.02)3.68
(1.24, 10.89)0.67 3.66
(1.21, 11.05)2.48
(0.90, 6.80)0.52 3.77
(1.46, 9.69)1.82
(0.53, 6.25)0.36 Q2 0.96
(0.26, 3.57)1.41
(0.51, 3.88)1.51
(0.64, 4.21)0.83
(0.22, 3.15)1.96
(0.62, 6.24)0.91
(0.30, 2.72)1.66
(0.59, 4.63)0.85
(0.22, 3.27)Q3 3.41
(1.10, 10.57)1.24
(0.46, 3.37)2.39
(0.92, 6.24)1.27
(0.37, 4.38)4.56
(1.52, 13.67)1.06
(0.37, 2.99)2.32
(0.88, 6.13)1.44
(0.44, 4.77)Q4 Ref Ref Ref Ref Ref Ref Ref Ref Note. OR, odds ratio; CI, confidence interval; Ref, reference. Adjustments made for age, body mass index, history of dyslipidemia, systolic blood pressure, triglyceride level, and number of red blood cells. -
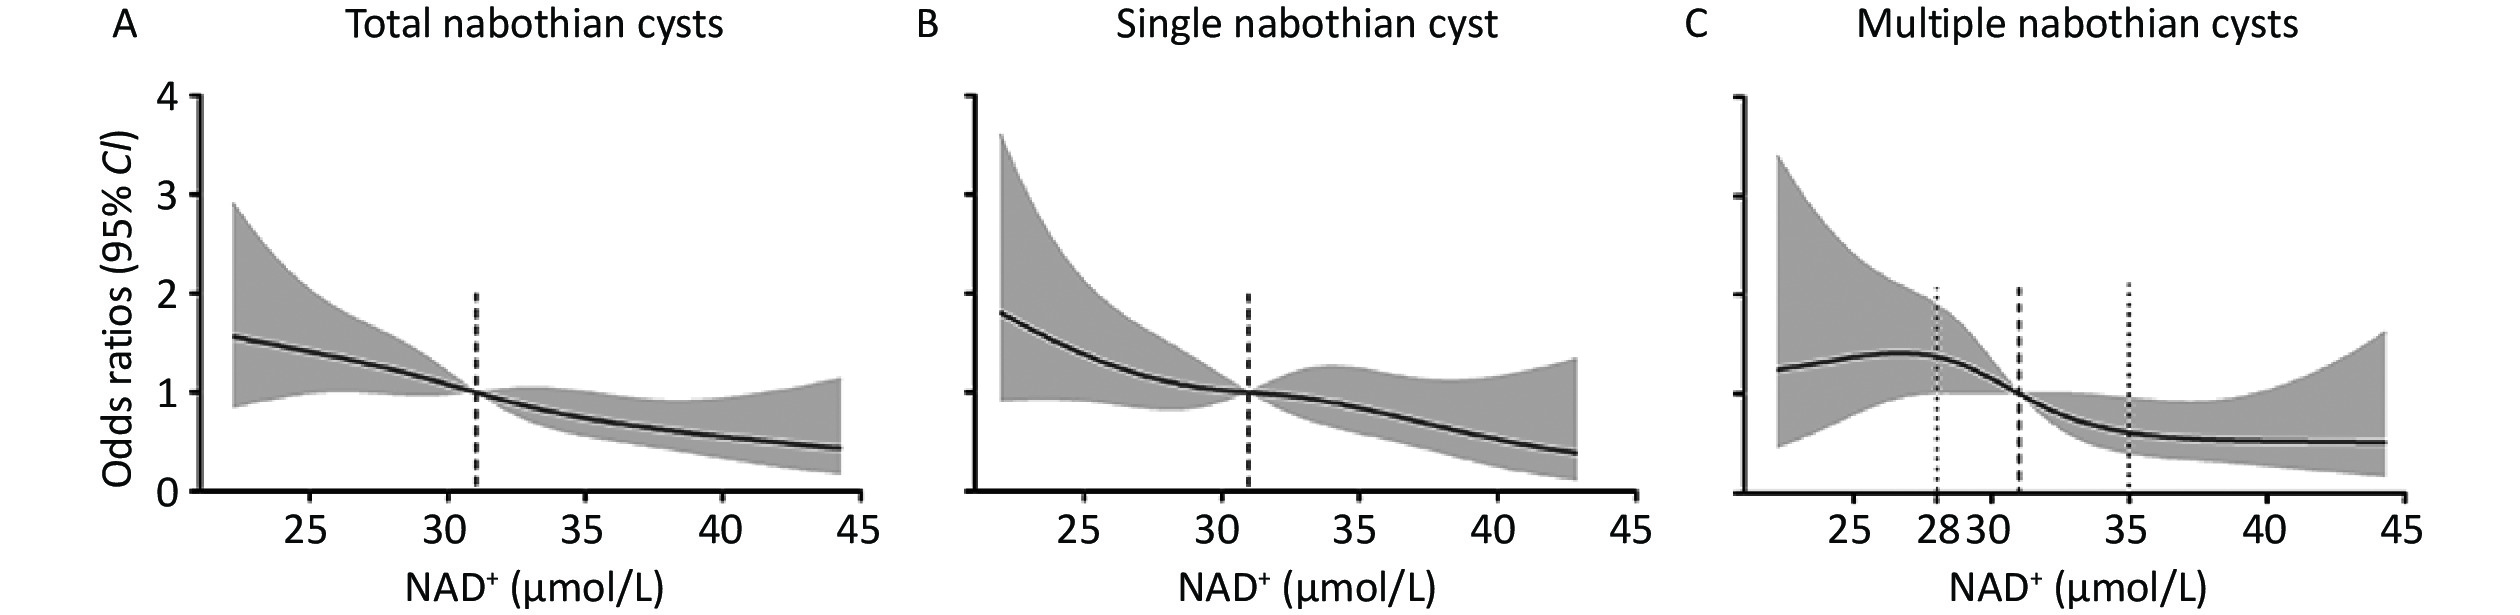
Figure 3 shows the adjusted dose-response association of whole-blood NAD+ levels with nabothian cysts. The risk of total and single nabothian cysts decreased linearly with increasing NAD+ levels (Figure 3A and B). The occurrence of multiple cysts showed non-linear decline along with the NAD+ level (Figure 3C). The risk of multiple nabothian cysts was stable before NAD+ levels of < 28 μmol/L, after which it linearly declined at NAD+ levels of 28 to 35 μmol/L, and then became stable after NAD+ levels of > 35 μmol/L.
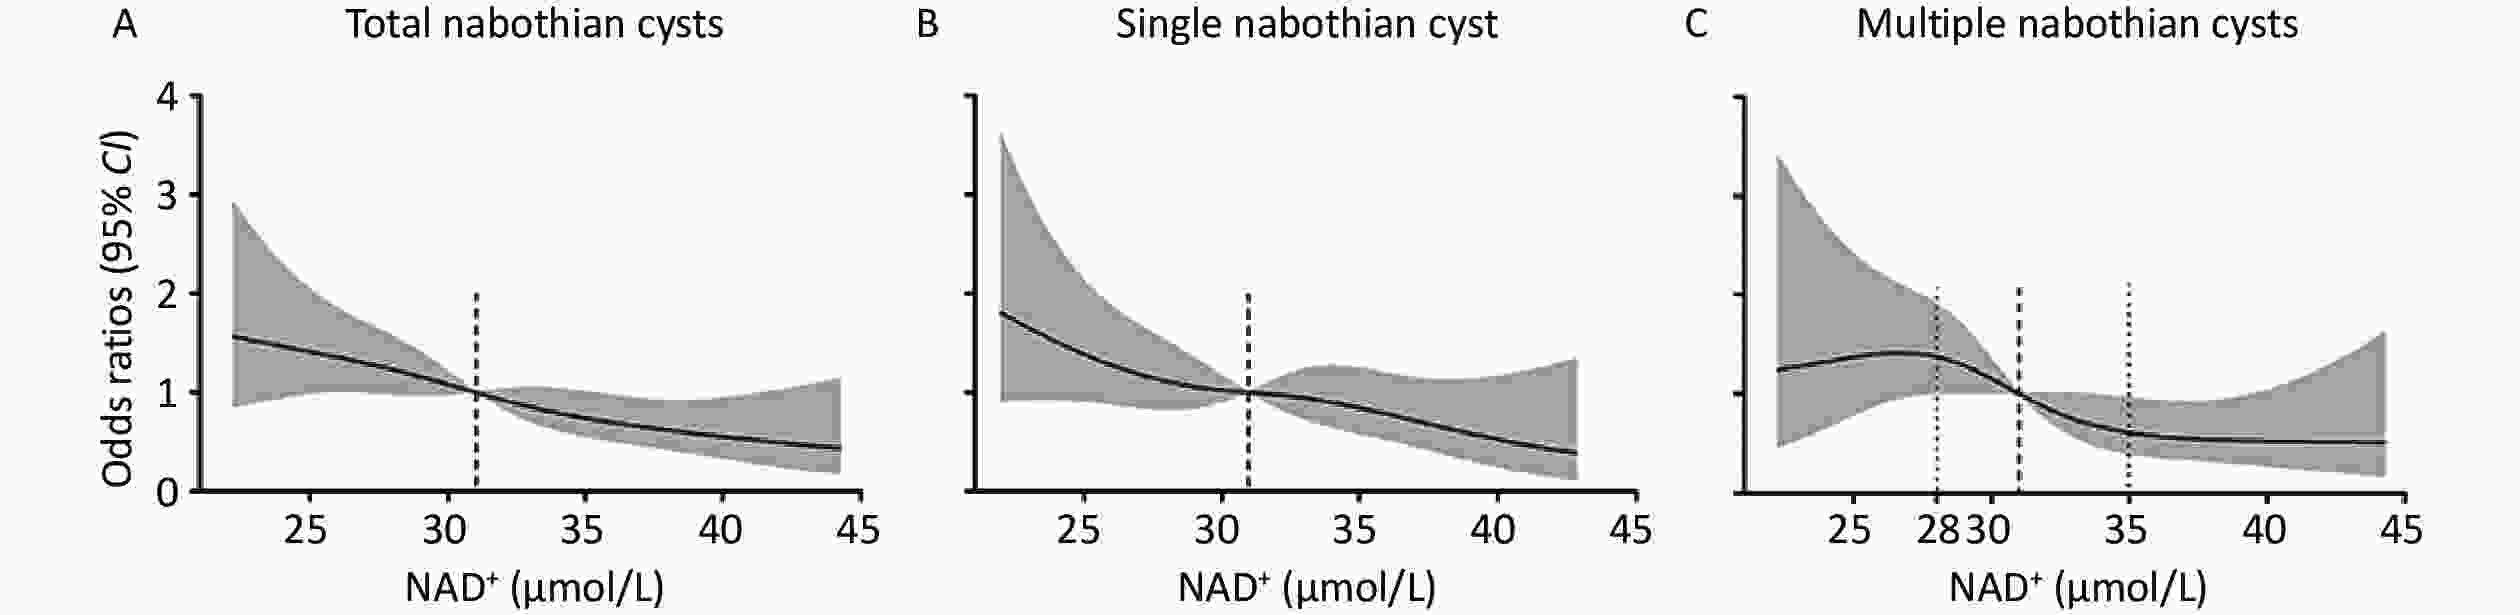
Figure 3. Dose-response association of whole-blood NAD+ levels with nabothian cysts. (A) Restricted cubic spline curves for the association of NAD+ levels with total nabothian cysts; (B) single nabothian cyst; and (C) multiple nabothian cysts. The model was adjusted for age, body mass index, history of dyslipidemia, systolic blood pressure, triglyceride level, and number of red blood cells. The black line represents the odds ratios and the gray shaded area represents the 95% CI. NAD+, nicotinamide adenine dinucleotide; CI, confidence interval.
-
In the current study, we found that approximately 28.0% of the participants had nabothian cysts among the entire study population. Low levels of whole-blood NAD+ are associated with an increased risk of total and multiple nabothian cysts. The risk of total and single nabothian cysts linearly decreased with increasing NAD+ levels. The risk of multiple nabothian cysts decreased more rapidly at NAD+ levels of 28.0 to 35.0 μmol/L. The effect of NAD+ levels on nabothian cysts was not altered by age, BMI, SBP, or history of dyslipidemia.
Our study showed that the prevalence of nabothian cysts among the participants was as high as 28%. Yilmaz et al. reported that the percentage of nabothian cysts in patients without adenomyosis was approximately 28%[17], which is consistent with our findings. Bajo et al. reported that 20% of all specimens had nabothian cysts, which is similar to our results[18]. However, Zidan et al. reported that the prevalence of nabothian cysts in Sudan is 2%[19]. The very low prevalence in this study was mainly due to discrepancies in the study population. The previous study recruited patients complaining of recurrent back or thoracic pain with a period of symptoms, whereas our study population comprised community-based women. Therefore, the prevalence of nabothian cysts should be evaluated in future large-scale cohort studies.
In the present study, low NAD+ levels were associated with an increased risk of total and multiple nabothian cysts. Chronic uterine inflammation is likely to be the main reason for the development of nabothian cysts. These cysts are filled with mucus and may contain proteinaceous material, neutrophils, or neutrophil debris[20]. Furthermore, uterine trauma affects NAD kinase activity and NAD metabolism[21]. Mounting evidence has shown that NAD+ and SIRT play essential roles in inflammation[8,22,23]. Previous studies showed that cervical non-neoplastic squamous epithelium showed weak positivity of SIRT1, SIRT2, and SIRT7[13,14]. SIRT1 has shown potential therapeutic effects in patients with polycystic ovary syndrome by regulating oxidative stress, mitochondrial function, and glucose and lipid metabolism[24]. Another study showed that inhibiting SIRT3 promoter activity promotes the transition between epithelial and mesenchymal cervical cancer cells[12]. Further research has suggested that SIRT1 inhibits the phosphorylation of p66Shc, regulates the activation of fibrogenic factors, enhances ovarian morphology, and diminishes ovarian oxidative stress[25]. These results emphasize the possibility of targeting SIRT1 as a therapeutic strategy for many gynecological diseases. Our data suggest that NAD+ insufficiency is a common characteristic of nabothian cysts. We did not find any association between whole-blood NAD+ levels and nabothian cysts, which were altered by age, BMI, SBP, and a history of dyslipidemia. Epidemiological studies have reported that nabothian cyst lesions enlarge in approximately 30% of patients during a long follow-up period[26,27]. Generally, the prevalence of cystic lesions increases with age; intracellular NAD+ and NAD-dependent dehydrogenase (15-PGDH) levels decrease with aging at a cellular, tissue, and organismal level[28-30]. Supplementation with NAD+ precursors delays aging[7]. SIRT1 mRNA expression decreased in uteri of aged mice, and uterine-specific deletion of SIRT1 results in premature uterine aging[29,31]. We did not find any correlation between age and nabothian cystic lesions in the current study. It is necessary to conduct further studies with a larger cohort of participants to confirm the association between aging and nabothian cysts.
Dose–response analyses showed that NAD+ levels were inversely associated with total and single nabothian cysts in all participants. We found that the risk of multiple nabothian cyst declined non-linearly with whole-blood NAD+ levels, while it declined linearly at NAD+ levels of 28 to 35 μmol/L. This phenomenon may be attributable to multigravid pregnancy. Tunnel clusters, a specific type of multiple nabothian cysts, are commonly observed in multigravid women[32]. In addition, systemic changes, such as metabolic dysfunction and dramatic changes in hormone levels during and after pregnancy, might also be major factors associated with NAD+ levels and nabothian cysts. A recent study found that patients with tunnel clusters and nabothian cysts also had inflammation[33]. It is necessary to further elucidate the detailed biochemical and molecular mechanisms of NAD+ in nabothian cysts in future experimental studies.
Our study had several limitations. First, there was a lack of nabothian cyst size records in our study, although clinical studies have shown that the large size of nabothian cysts can cause many complications. Second, whole-blood NAD+ may not adequately reflect the NAD+ level in nabothian cysts, because it is distributed in all tissues. Finally, we analyzed the association between NAD+ levels and nabothian cyst using cross-sectional data. Therefore, there was no causal effect of NAD+ on nabothian cysts in our study.
In conclusion, we found a negative association between whole-blood NAD+ levels and nabothian cysts, particularly multiple cysts. NAD+ would be considered as a biological marker for nabothian cysts development. Our findings provide new evidence for the association of blood NAD+ levels and nabothian cysts.
全文HTML
Study Design and Participants
Data Collection
Measurement of NAD+ Levels
Outcome Measure
Statistical Analysis
Characteristics of Participants at Baseline
Nabothian Cyst Prevalence among NAD+ Quartiles
Association of Whole-blood NAD+ Levels with Nabothian Cysts
Restricted Cubic Spline Curves for the Associations of NAD+ with Nabothian Cyst
 23239-S.pdf
|

|

 Quick Links