

 下载:
下载:


-
Preterm birth (PTB) is defined as delivery before 37 weeks of gestation. PTB is associated with increased cardiovascular risk, neurodevelopmental disorders, and other diseases in infancy, childhood, and adulthood[1]. Globally, approximately 15 million PTB cases are reported annually, posing a huge burden on individual families and the community economy[2]. In the context of climate warming, O3 pollution has continuously increased in many countries in recent years, including China; therefore, scientific communities and government agencies must strive to mitigate ozone pollution.
This retrospective study was conducted in Xinxiang, China. Distributed lag models incorporating Cox proportional hazard models were used to (1) investigate the association between weekly O3 exposure and PTB, (2) examine the susceptibility windows to O3 exposure, and (3) identify the vulnerable and sensitive groups.
Inpatient records were collected from January 1, 2015, to September 30, 2021, from the Gynecology and Obstetrics Department of Xinxiang Center Hospital. The Xinxiang Center Hospital is the largest comprehensive hospital in Xinxiang, China. Information including maternal age, date of birth, gestational age, home address, occupation (self-employed workers; persons working in government departments or institutions; farmer, worker; and others), ethnicity (Han and others), marital status (married and others), medical payment method (urban resident basic medical insurance/urban employee basic medical insurance; new rural cooperative medical schema; self-paid and others), medical conditions during pregnancy (e.g., premature rupture of membranes, gestational diabetes, preeclampsia, eclampsia, oligohydramnios, and hypertension during pregnancy), and season of conception (spring, defined as March to May; summer, June to August; autumn, September to November; and winter, December to February) were extracted.
The date of pregnancy and gestational age were calculated based on the last menstrual cycle. PTB was defined as birth at < 37 weeks of gestation[3]. They were further divided into three categories: moderate preterm birth (MPTB; gestational age, 35–36 weeks), very preterm birth (VPTB; gestational age, 32–34 weeks), and extreme preterm birth (ExPTB; gestational age, < 32 weeks)[4]. Four exposure windows were explored in this study: (1) the entire gestational period (1st gestational week to the week of delivery), (2) first trimester (gestational weeks 1–13), (3) second trimester (gestational weeks 14–26), and (4) third trimester (gestational week 27 to the week of delivery).
Xinxiang is a prefecture-level city in northern Henan Province. The hourly O3 concentration was obtained from January 1, 2015, to September 30, 2021, from six fixed air quality monitoring stations in Xinxiang. Among them, five monitoring stations were close to the Xinxiang Center Hospital, and one was located southwest of the hospital, slightly away from the hospital. Data from the closest monitor were used as proxies for each woman, based on their home residence. The daily maximum 8-hour O3 (O3-8 h) exposure concentration for each participant was then calculated. The weekly exposure concentrations were then calculated. Finally, the average exposure concentrations for the entire gestational period and the three specific periods were estimated. The daily concentrations of other air pollutants, including PM10, PM2.5, NO2, SO2, and CO. The daily mean temperature (°C) and relative humidity (%) were collected from the Xinxiang Meteorological Service (http://ha.cma.gov.cn/xinxiang/index.html). The same approach was employed to assign temperature and humidity exposure levels to the air pollutants for each participant.
Spearman’s correlation analysis was performed to investigate the association between air pollutants, temperature, and relative humidity because they were not normally distributed. Cox proportional hazard models are commonly used in longitudinal epidemiological studies to analyze the association between risk factors and time-related dichotomous events[5]. Distributed lag models were combined with Cox proportional hazards models to examine the association between weekly O3 exposure and PTB risk, as previously reported. Distributed lag models can eliminate the impact of seasonal trends in pollutants, describe the exposure-lag relationship, and provide reliable susceptible exposure windows. Model 1 was adjusted for covariates including maternal age at delivery (as a continuous variable), marital status (married and others), ethnicity (Han and others), medical payment method (urban resident basic medical insurance or urban employee basic medical insurance, new rural cooperative medical schema, self-paid, and others), maternal occupation (self-employed workers, persons working in government departments or institutions, farmer or worker, and others), and season of conception (warm and cold season). Model 2 was additionally controlled for temperature and humidity based on Model 1. The average temperature and humidity during the entire pregnancy period were measured using natural cubic splines with three degrees of freedom. This model was also used to identify susceptible windows, with gestational weeks 0–36 as the exposure matrix. Finally, a linear function was employed to estimate the exposure-response relationship between O3 and PTB risk.
To explore the potential effect modifiers, stratified analyses were further conducted by maternal age (≤ 24, 25–29, ≥ 30) and the season of conception (warm season, May to October; cold season, November to April). In addition, two pollutant models were used to assess the robustness of the model.
All analyses were performed using packages “dlnm,” “splines,” and “survival” in R 4.1.3 (R Foundation for Statistical Computing, Vienna, Austria). The effects of O3 on PTB are presented as hazard ratios (HRs) and 95% CIs associated with every 10 μg/m3 increase in O3 concentrations during a specific period. All tests were two-sided, and P < 0.05 was considered statistically significant.
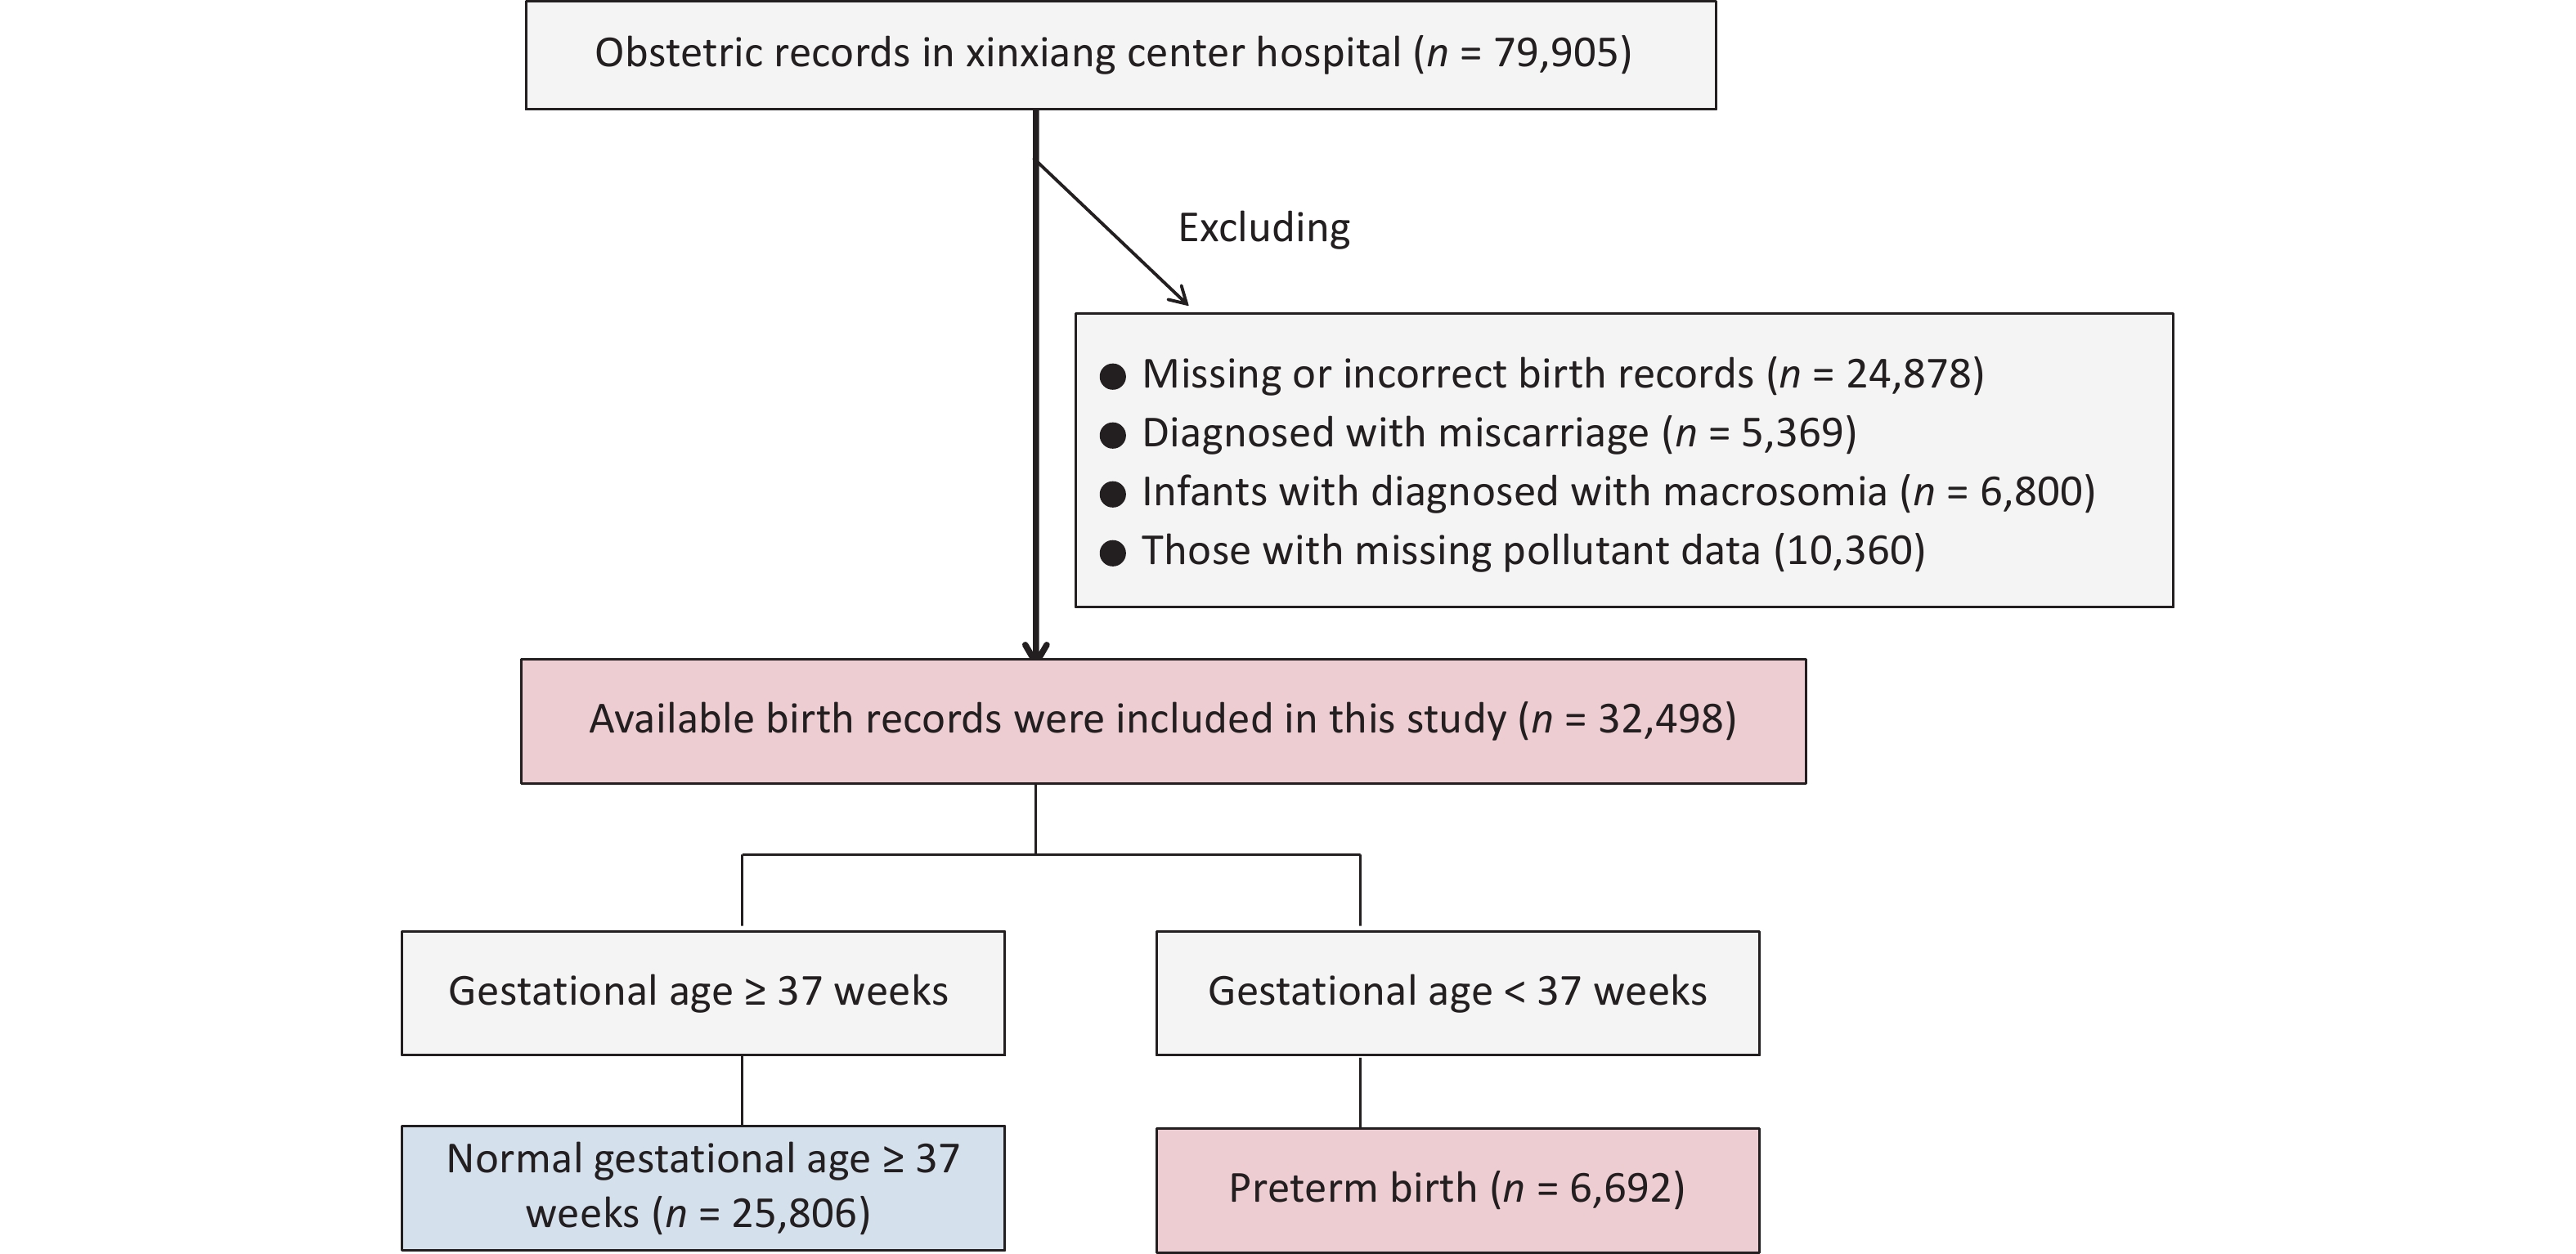
Initially, 69,545 inpatient records were extracted from the gynecology and obstetrics departments from January 1, 2015, to September 30, 2021. Women with missing or incorrect records, such as those without gestational age or unreasonable gestational age (n = 24,878), those diagnosed with miscarriage (n = 5,369), and infants diagnosed with macrosomia (n = 6,800), were excluded. Finally, 32,498 eligible newborns were included in the study (Supplementary Figure S1). Among all the births recorded, 6,692 (8.37%) were PTBs. Among these PTBs, MPTB, VPTB, and ExPTB accounted for 48.30% (3,232), 33.16% (2,219), and 18.54% (1,241) of the cases, respectively.
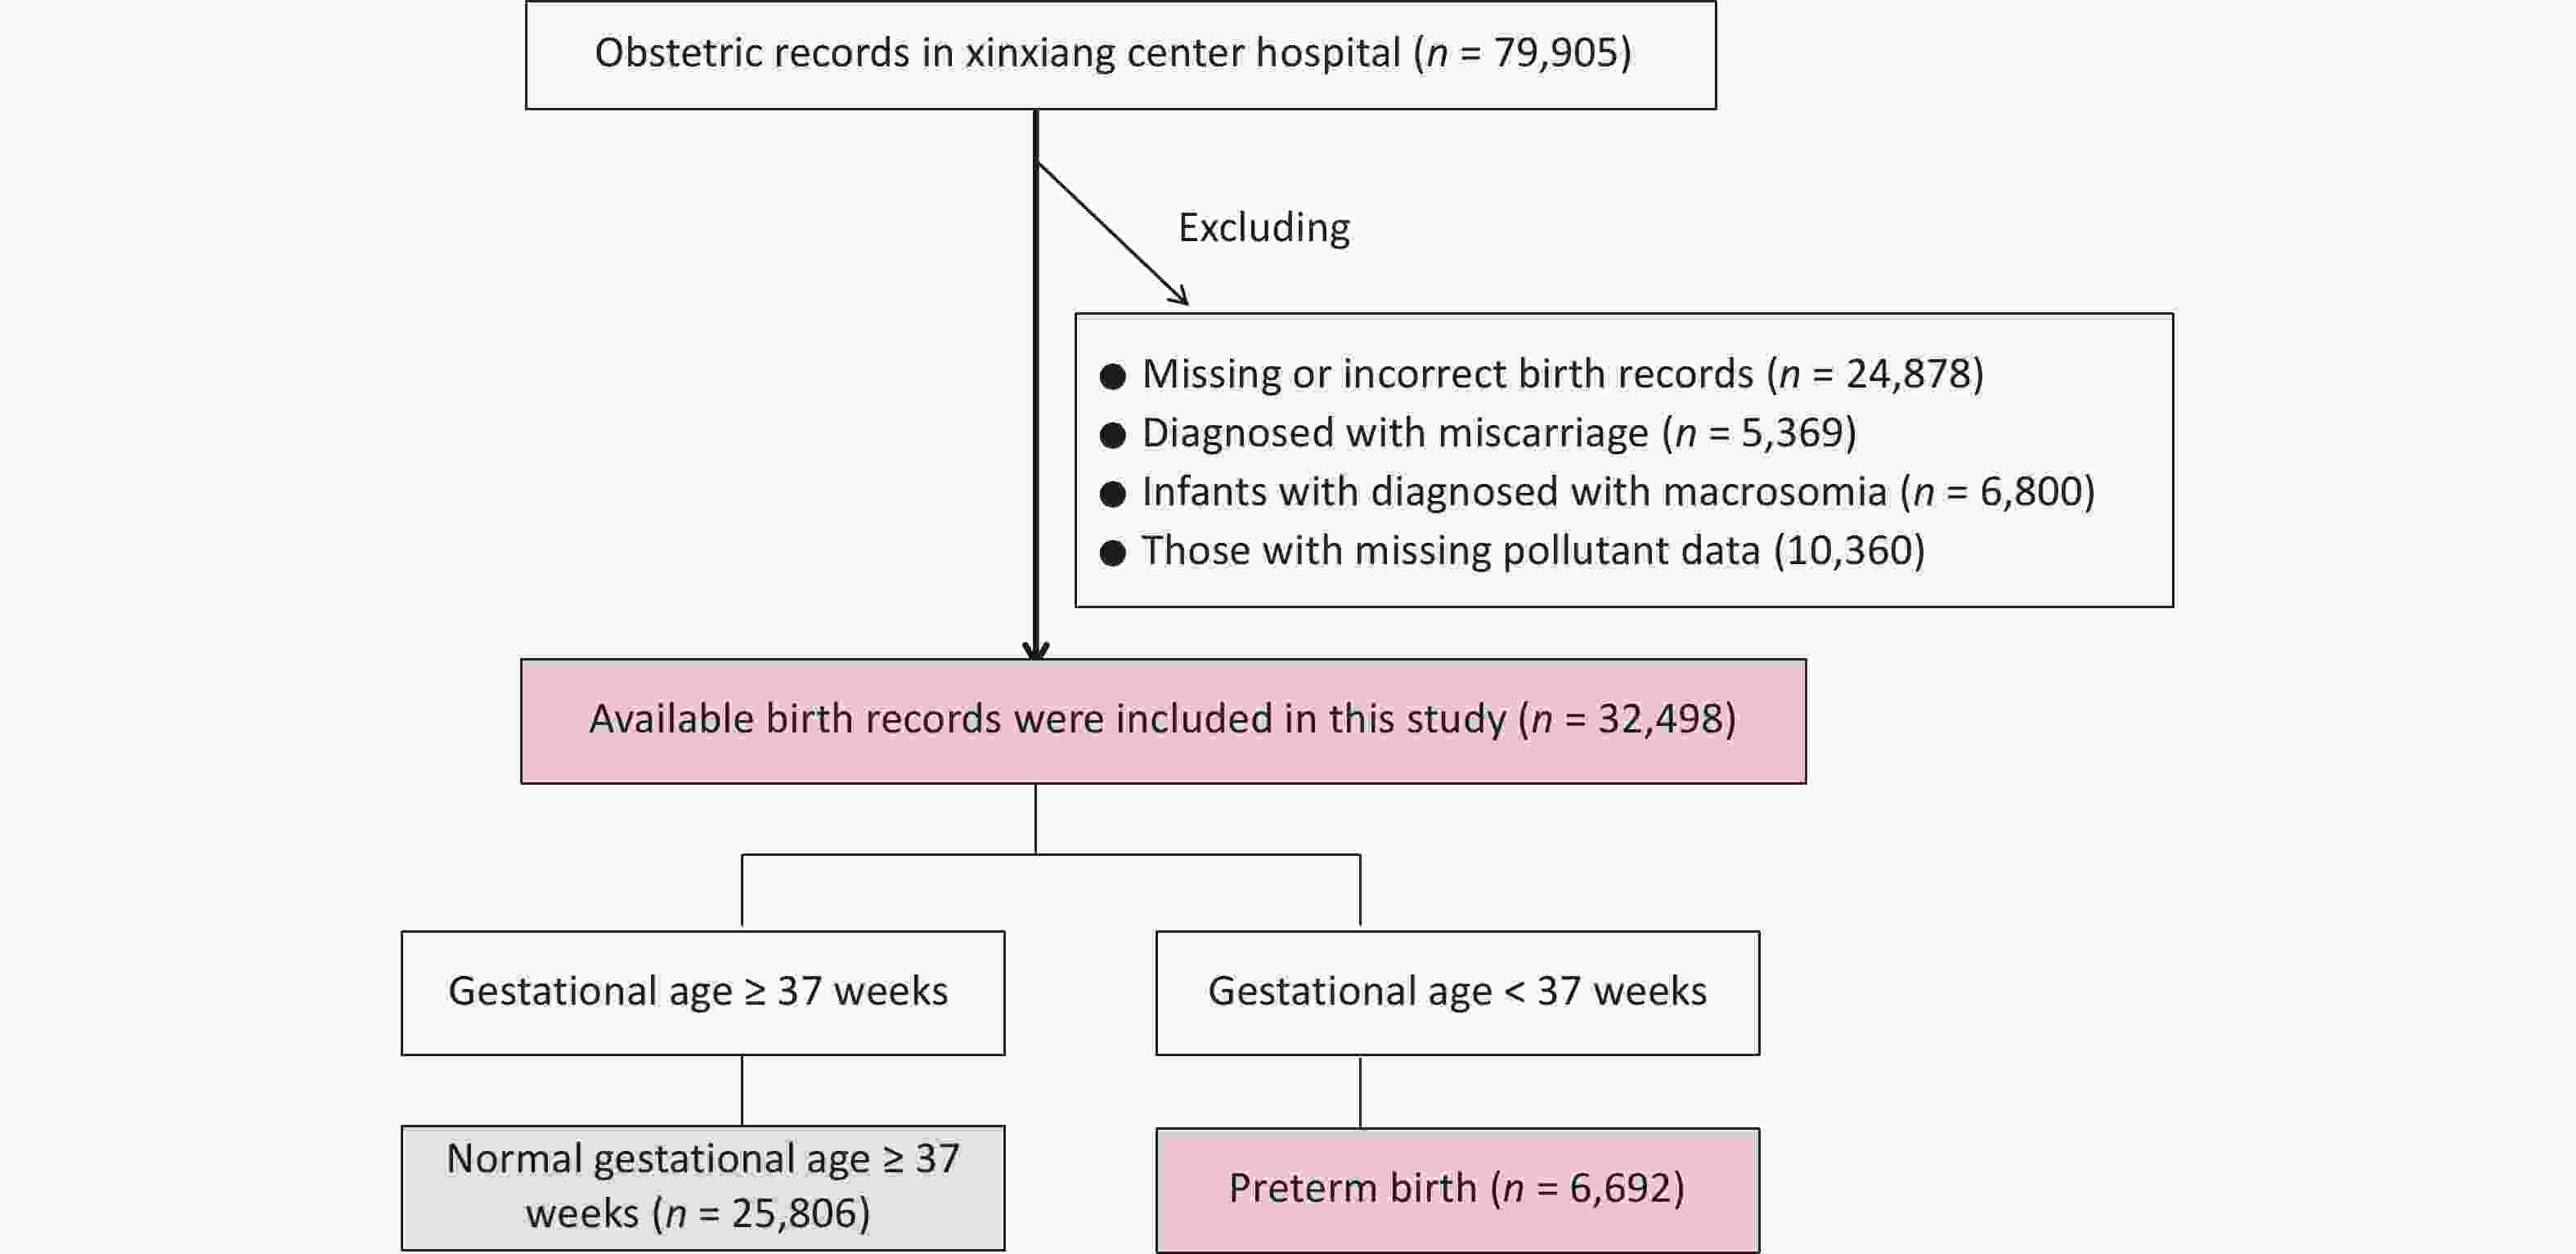
Figure S1. Flowchart of data cleaning for birth records.
Table 1 presents the distribution of the mothers’ sociodemographic characteristics. Mothers with PTBs were a little younger than non-PTBs (29.00 ± 5.16 vs. 29.14 ± 4.49, P < 0.001). Farmers and workers were also more likely to have preterm deliveries (P < 0.001). In addition, compared to term births, PTBs were more frequent among mothers who conceived in spring or winter (P < 0.001).
Table 1. Characteristics of mothers in this study in Xinxiang from 2015 to 2021
Characteristics Preterm birth (< 37 weeks)
n = 6,692Term birth (≥ 37 weeks)
n = 25,806Total births
n = 32,498P value Gestational age [weeks, mean (SD)] 33.64 (2.53) 39.01 (1.16) 37.90 (2.66) < 0.001a Maternal age [years, mean (SD)] 29.00 (5.16) 29.14 (4.49) 29.11 (4.64) < 0.001a Marital status, n (%) Married 6,542 (97.76) 25,682 (99.52) 32,224 (99.16) < 0.001b Other 150 (2.24) 124 (0.48) 274 (0.84) Nationality, n (%) Han 6,672 (99.70) 25,714 (99.64) 32,386 (99.66) 0.473b Others 20 (0.30) 92 (0.36) 112 (0.34) Medical payment method, n (%) Urban resident basic medical insurance/
urban employee basic medical insurance359 (5.36) 4,249 (16.47) 4,608 (14.18) < 0.001b New rural cooperative medical schema 1,421 (21.23) 5,463 (21.17) 6,884 (21.18) Self-paid 4,909 (73.36) 16,082 (62.32) 20,991 (64.59) Other 3 (0.04) 12 (0.05) 15 (0.05) Maternal occupation, n (%) Self-employed workers 224 (3.35) 1,223 (4.74) 1,447 (4.45) < 0.001b Persons working in government
departments or institutions1,122 (16.77) 7,033 (27.25) 8,155 (25.09) Farmer/worker 2,108 (31.50) 4,748 (18.40) 6,856 (21.10) Other 3,238 (48.39) 12,802 (49.61) 16,040 (49.36) Season of conception, n (%) Spring 1,659 (24.49) 5,961 (23.10) 7,620 (23.45) < 0.001b Summer 1,559 (23.30) 6,778 (25.88) 8,337 (25.65) Fall 1,661 (24.82) 6,876 (26.64) 8,537 (26.27) Winter 1,813 (27.09) 6,191 (23.99) 8,004 (24.63) Note. aWilcoxon rank-sum test was used to compare the differences between pregnant women with preterm and term births; bChi-square test was used to compare the differences between pregnant women with preterm birth and term birth. Supplementary Table S1 presents the O3 concentrations and their correlation, with the correlation coefficients ranging from −0.81 to 0.87. Overall, the average O3 exposure during the entire pregnancy was 57.95 μg/m3, with a range of 11.33–99.13 μg/m3. Supplementary Table S2 presents the correlations between ozone and the co-pollutants, temperature, and humidity.
Table S1. Description of O3 concentration in three trimesters and the whole pregnancy and their correlation during 2015–2020
O3 (μg/m3) Mean SD Min 25th Median 75th Max IQR 1st trimester 2nd trimester 3rd trimester The entire pregnancy 1st trimester 56.73 28.12 0.97 31.91 53.46 77.90 119.26 45.99 1.00 2nd trimester 58.21 27.91 0.97 33.64 57.04 79.14 119.26 45.50 0.07 1.00 3rd trimester 60.89 27.96 9.00 35.62 59.79 82.03 140.40 46.41 −0.81 0.12 1.00 The entire pregnancy 57.95 14.15 11.33 49.90 56.71 67.99 99.13 18.09 0.20 0.87 0.19 1.00 Note. SD: standard deviation; Min: minimum; 25th: 25 percentile; 75th: 75 percentile; IQR: interquartile range; 1st trimester: the first trimester (gestational weeks 1–13); 2nd trimester: the second trimester (gestational weeks 14–26); 3rd trimester: the third trimester (gestational weeks 27 to the week of delivery). Table S2. The correlation correlations of ozone to co–pollutants
Air pollutants PM2.5 PM10 CO NO2 O3 SO2 Temperature Humidity PM10 0.977 1.000 CO 0.885 0.821 1.000 NO2 0.827 0.775 0.865 1.000 O3 –0.815 –0.780 –0.662 –0.749 1.000 SO2 0.857 0.861 0.731 0.639 –0.598 1.000 Temperature –0.705 –0.687 –0.644 –0.693 0.837 –0.459 1.000 Humidity –0.322 –0.394 –0.215 –0.297 0.175 –0.440 0.431 1.000 The HRs (95% CIs) for PTB associated with per 10 μg/m3 increase of O3 exposure during each trimester are shown in Table 2. After adjusting for maternal age, marital status, maternal occupation, season of conception, medical payment method, nationality, ambient temperature, and relative humidity, the HR for PTB were 1.037 (95% CI: 1.034–1.040), 1.005 (95% CI: 1.002–1.009), 1.028 (95% CI: 1.025–1.031), and 1.058 (95% CI: 1.053–1.063) per 10 μg/m3 increase in O3 exposure in the first, second, and third trimesters, and all pregnancies, respectively (Table 2). The effects of O3 on PTB subtypes were similar to those on PTB, with the strongest effect observed in the first trimester. Several studies have focused on exploring the relationship between exposure to air pollution and PTB[6]. This study, conducted in Xinxiang, China, indicated that maternal exposure to O3 is associated with an increased risk of PTB, which is consistent with previous findings. For example, a Canadian time-to-event analysis reported that a 13.3 ppb increase in O3 before delivery (0–3 days) was associated with an HR of 1.036 (95% CI: 1.005–1.067) for PTB[7]. Similarly, a case-crossover study in California found that O3 levels were associated with an increased risk of VPTB, MPTB, and ExPTB. A birth cohort of 6,640 mothers in Jinan, China observed that high-level O3 exposure (> 173.64 μg/m3) increased the risk of PTB, with HR of 1.92 (95% CI: 1.38–2.66). However, contrasting results have been reported in other studies[8]. Notably, the inconsistent PTB results between these two studies in Henan might be partly due to the sample size, population, exposure assessment, and statistical methods.
Table 2. Estimated effects of O3 on PTB at different exposure periods
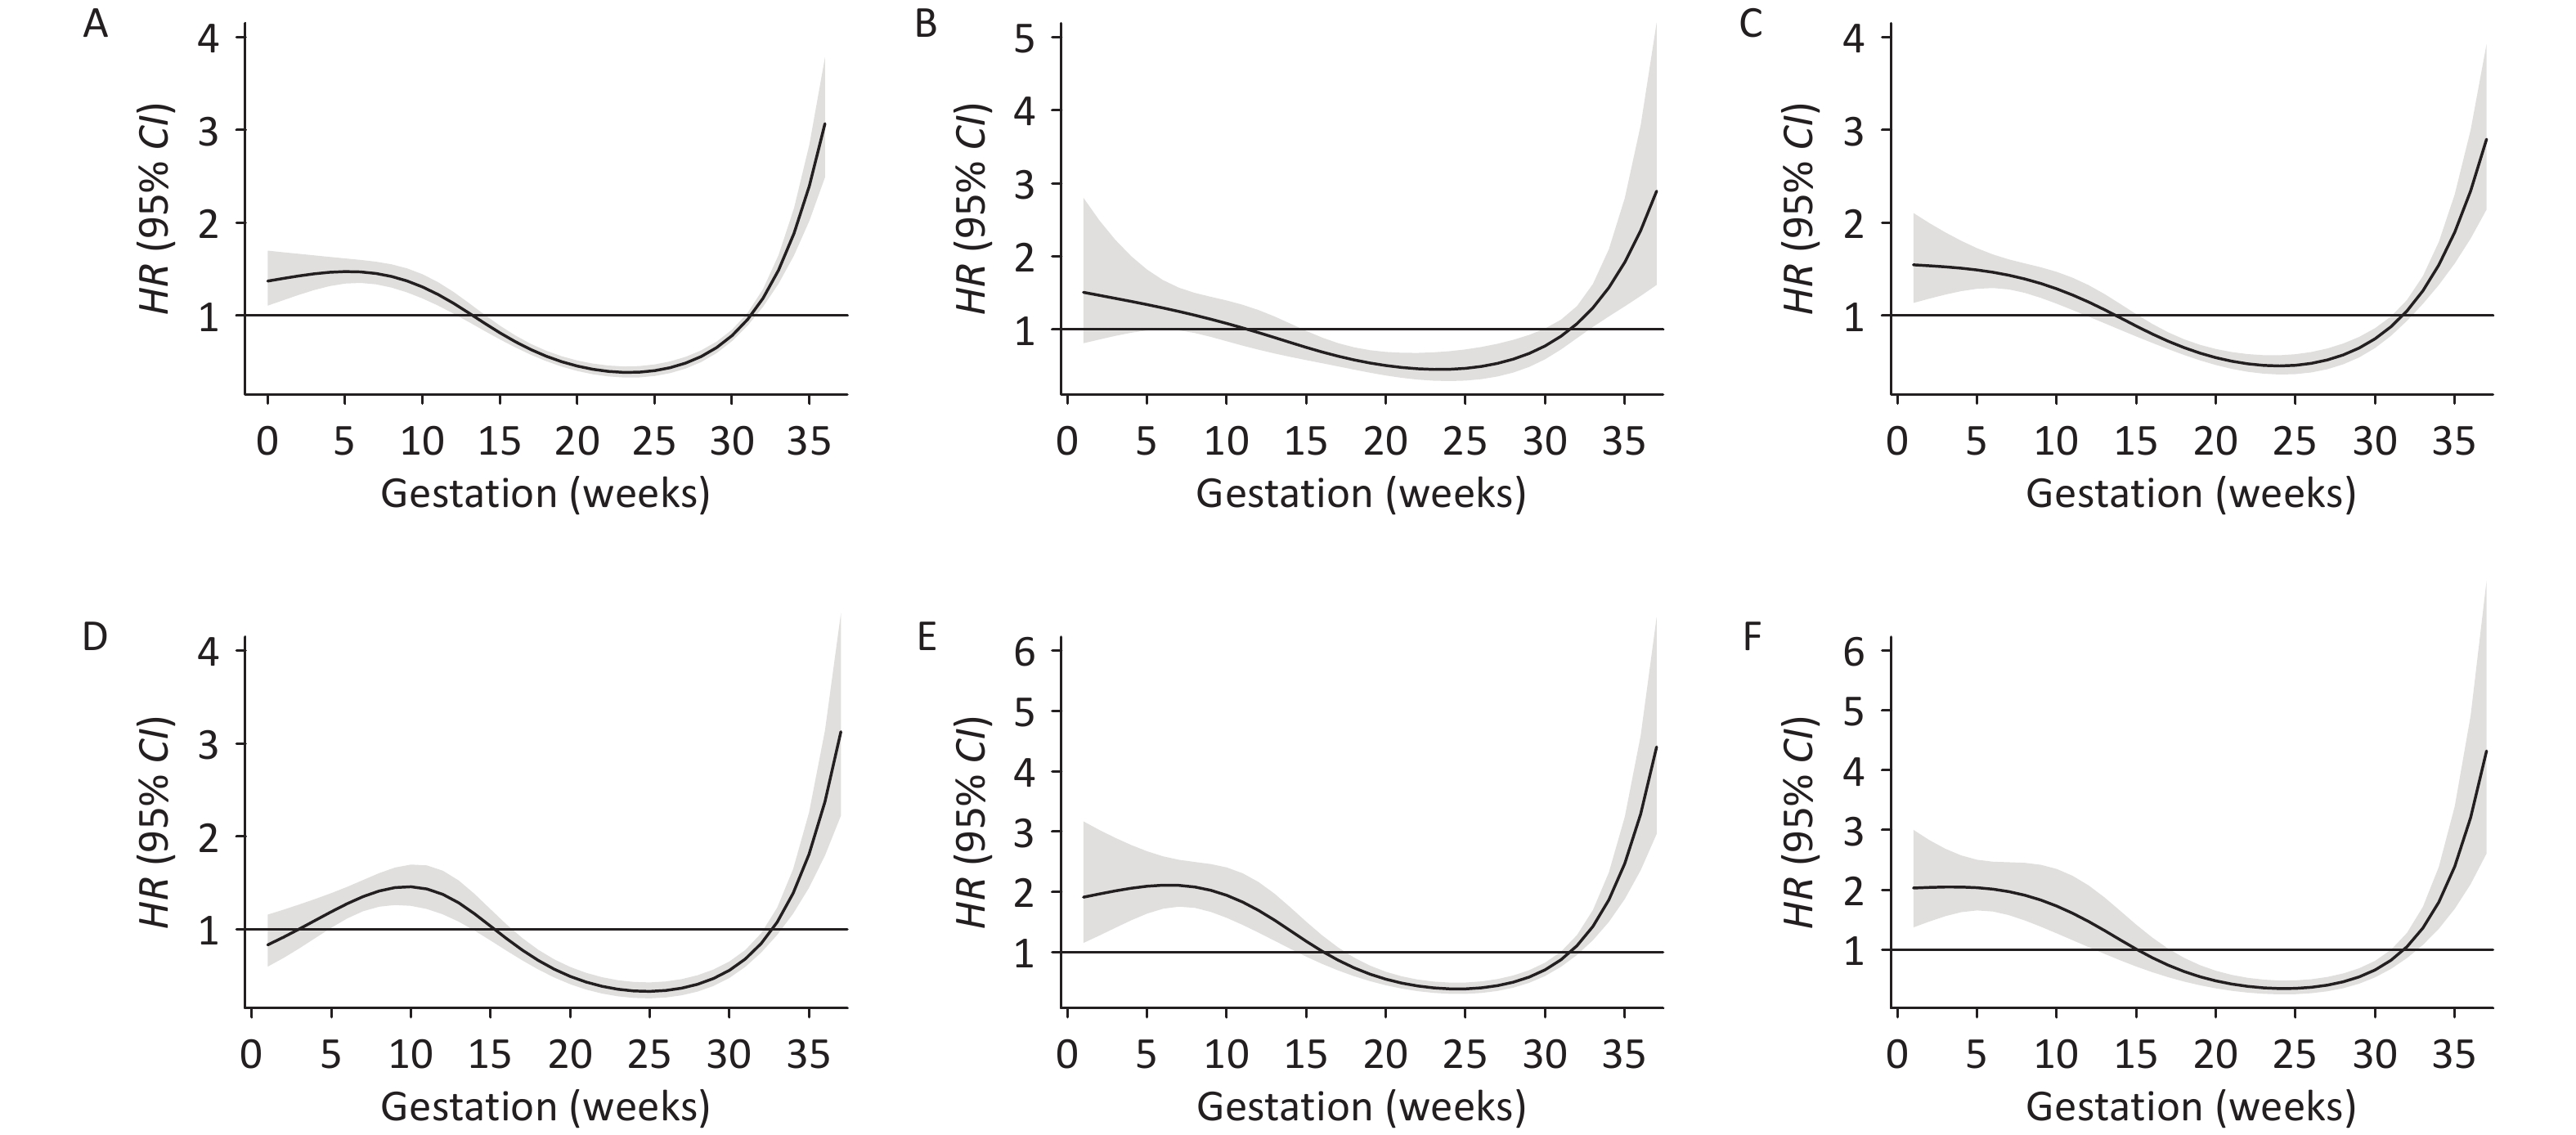
Gestational period Model 1a Model 2b HR 95% CI HR 95% CI PTB 1st trimester 1.002 1.001−1.003 1.037 1.034−1.040 2nd trimester 1.004 1.003−1.005 1.005 1.002−1.009 3rd trimester 1.002 1.001−1.003 1.028 1.025−1.031 The entire pregnancy 1.008 1.006−1.010 1.058 1.053−1.063 MPTB 1st trimester 1.003 1.001−1.004 1.030 1.026−1.034 2nd trimester 1.004 1.003−1.006 1.022 1.017−1.027 3rd trimester 1.001 1.000−1.003 1.019 1.014−1.023 The entire pregnancy 1.008 1.005−1.011 1.064 1.057−1.071 VPTB 1st trimester 1.001 1.000−1.003 1.041 1.035−1.046 2nd trimester 1.004 1.002−1.006 0.999 0.994−1.005 3rd trimester 1.003 1.001−1.005 1.033 1.027−1.039 The entire pregnancy 1.007 1.003−1.010 1.052 1.043−1.060 ExPTB 1st trimester 1.001 0.999−1.004 1.044 1.037−1.051 2nd trimester 1.005 1.003−1.007 0.991 0.983−0.998 3rd trimester 1.003 1.001−1.005 1.030 1.023−1.037 The entire pregnancy 1.009 1.005−1.014 1.046 1.035−1.056 Note. HR, hazard ratio; CI, confidence interval. HRs (95% CIs) were estimated for per 10 µg/m3 increase in O3. aAdjusted for maternal age, marriage, maternal occupation, season of conception, medical payment method, and nationality; bAdjusted for maternal age, marital status, maternal occupation, season of conception, medical payment method, nationality, ambient temperature, and relative humidity. The effects of weekly O3 exposure during pregnancy on the risk are shown in Figure 1A and Supplementary Table S3. Two susceptibility–exposure windows were observed. A 10 μg/m3 increase in O3 exposure from gestational weeks 2 to 13 was positively associated with PTB risk, with the strongest effect observed at gestational week 7 (HR: 1.371, 95% CI: 1.269–1.482). The second susceptibility window for the effect of O3 exposure on PTB risk was at gestational weeks 33–36, with the strongest effect observed at gestational week 36 (HR: 2.454, 95% CI: 2.073–2.906). Previous studies have shown varying critical windows: the first trimester, third trimester, and specific gestational weeks, such as weeks 2–8, 13–18, and 23–31. Our study identified weeks 2–13 and 33–36 as particularly vulnerable periods, with notably high hazard ratios at weeks 35–36. These differences across studies may stem from variations in the O3 levels, exposure measurements, and individual susceptibilities.

Figure 1. Hazard ratios (HRs) of PTB associated with weekly-specific O3 exposure stratified by maternal age and conception season; A, all; B, maternal age ≤ 24 years; C, 25–29 years; D, ≥ 30 years; E, warm season; F, cold season. Distributed lag models (DLMs) incorporating Cox proportional hazard models were used to calculate the HRs (95% CIs) per 10 µg/m3 increase for O3 during the study period. All models were adjusted for maternal age, marriage, maternal occupation, season of conception, medical payment method, nationality, ambient temperature, and relative humidity.
When stratified by maternal age, the association between O3 exposure during each gestational trimester and PTB was similar (Supplementary Table S4). Women who were > 30 years old and conceived in the cold season were more likely to have PTB risk. For pregnant women aged ≤ 24 years, O3 exposure was positively associated with PTB in the first and third trimesters, with a susceptible exposure window at gestational weeks 6 and 33–36 (Figure 1B and Supplementary Table S4). Similarly, gestational weeks 1–11 was a susceptible exposure window for pregnant women aged 25–29 years (Figure 1C and Supplementary Table S4,). For pregnant women aged ≥ 30 years, the susceptible exposure window was during gestational weeks 513 and 34–36 (Figure 1D and Table S4). The susceptibility exposure windows were gestational weeks 1–13 and 33–36 in the warm season (Figure 1E and Supplementary Table S4), and weeks 1–12 and 33–36 in the cold season (Figure 1F and Supplementary Table S4).
Table S4. Hazard ratios of preterm birth associated with weekly ozone exposure, stratified by age
Weeks ≤ 24 years 25–29 years ≥ 30 years HR 95% CI HR 95% CI HR 95% CI 1 1.511 0.814–2.803 1.549 1.139–2.107 0.834 0.600–1.160 2 1.469 0.865–2.494 1.539 1.185–1.999 0.918 0.694–1.213 3 1.428 0.915–2.229 1.527 1.228–1.899 1.007 0.798–1.270 4 1.386 0.958–2.004 1.513 1.266–1.807 1.099 0.909–1.329 5 1.342 0.990–1.820 1.494 1.291–1.728 1.191 1.019–1.392 6 1.297 1.003–1.677 1.469 1.299–1.330 1.278 1.119–1.459 7 1.249 0.991–1.574 1.437 1.284–1.607 1.35 1.197–1.533 8 1.197 0.954–1.502 1.39 1.247–1.564 1.414 1.245–1.606 9 1.143 0.901–1.449 1.348 1.193–1.523 1.451 1.263–1.667 10 1.285 0.841–1.399 1.291 1.130–1.473 1.460 1.254–1.699 11 1.024 0.782–1.340 1.224 1.062–1.410 1.436 1.220–1.690 12 0.959 0.726–1.268 1.149 0.992–1.331 1.378 1.163–1.633 13 0.892 0.675–1.181 1.066 0.921–1.235 1.287 1.084–1.527 14 0.824 0.628–1.082 0.978 0.849–1.128 1.168 0.987–1.381 15 0.757 0.584–0.982 0.890 0.778–1.017 1.035 0.881–1.217 16 0.694 0.541–0.891 0.805 0.709–0.914 0.902 0.772–1.054 17 0.637 0.497–0.815 0.727 0.642–0.823 0.777 0.666–0.907 18 0.587 0.453–0.758 0.658 0.579–0.748 0.666 0.569–0.781 19 0.544 0.411–0.719 0.599 0.521–0.688 0.572 0.483–0.678 20 0.509 0.373–0.695 0.550 0.470–0.642 0.495 0.411–0.596 21 0.483 0.341–0.684 0.511 0.429–0.610 0.434 0.353–0.533 22 0.465 0.317–0.683 0.484 0.398–0.588 0.388 0.310–0.486 23 0.457 0.302–0.690 0.466 0.377–0.577 0.357 0.280–0.454 24 0.458 0.297–0.706 0.461 0.368–0.578 0.338 0.263–0.435 25 0.471 0.304–0.730 0.467 0.372–0.587 0.334 0.259–0.430 26 0.497 0.324–0.764 0.488 0.391–0.611 0.343 0.268–0.440 27 0.539 0.360–0.807 0.525 0.425–0.648 0.368 0.291–0.466 28 0.597 0.414–0.861 0.579 0.478–0.702 0.410 0.332–0.507 29 0.675 0.491–0.929 0.654 0.553–0.773 0.472 0.392–0.569 30 0.778 0.595–1.016 0.753 0.654–0.867 0.560 0.479–0.656 31 0.911 0.730–1.137 0.883 0.785–0.994 0.682 0.898–0.779 32 1.081 0.884–1.322 1.052 0.946–1.170 0.850 0.752–0.960 33 1.299 1.038–1.625 1.269 1.128–1.427 1.079 0.942–1.235 34 1.574 1.180–2.099 1.546 1.332–1.796 1.389 1.170–1.650 35 1.921 1.319–2.798 1.899 1.563–2.307 1.810 1.450–2.259 36 2.355 1.461–3.796 2.344 1.831–3.000 2.375 1.795–3.141 After adjusting for co-pollutants (Supplementary Table S5), the estimated effects changed slightly, but remained statistically significant. One possible reason is that the aging of blood vessels in the reproductive system causes a lower rate of placental vasoconstriction, further leading to hypoxia in the fetus, while air pollutants may interfere with pregnancy progression, ultimately increasing the risk of PTB[9]. Furthermore, the current study found that the effects of weekly O3 exposure on different subgroups were analogous to the overall results, with similar susceptibility windows.
Table S5. Hazard ratios of preterm birth associated with ozone exposure in two–pollutant model
Trimester HR 95% CI Trimester 1 O3 1.037 1.034–1.040 +PM2.5 1.045 1.042–1.049 +PM10 1.045 1.042–1.049 +NO2 1.033 1.030–1.036 +SO2 1.059 1.055–1.062 +CO 1.035 1.032–1.038 Trimester 2 O3 1.005 1.002–1.009 +PM2.5 1.009 1.006–1.012 +PM10 1.008 1.005–1.012 +NO2 1.006 1.002–1.009 +SO2 1.010 1.007–1.013 +CO 1.005 1.002–1.009 Trimester 3 O3 1.028 1.025–1.031 +PM2.5 1.034 1.030–1.037 +PM10 1.033 1.029–1.036 +NO2 1.018 1.015–1.021 +SO2 1.042 1.039–1.046 +CO 1.026 1.023–1.030 Several plausible biological mechanisms have been proposed to explain the relationship between air pollution and PTB. First, O3 exposure may trigger systemic inflammation and oxidative stress by activating sensory nerves in the respiratory tract, potentially altering thyroid function, cardiovascular health, and the intrauterine environment[10]. Elevated levels of inflammatory cytokines, such as C-reactive protein, may impair uterine artery vascularity, hinder trophoblast function, and lead to premature placental aging[11]. Additionally, O3 pollution can weaken the immune system and increase susceptibility to infections, which are known risk factors for PTB[12].
This study had several limitations that need to be considered. First, the O3 exposure measurements were based on six fixed-site monitoring stations, and exposure misclassification may have occurred. Moreover, information on the time-activity patterns of pregnant women and their residential mobility during pregnancy is not available. However, pregnant mothers are less likely to walk during pregnancy. Second, the generalizability of this study may be limited because it was conducted in a single city with a relatively small sample size. Third, the relatively large number of excluded women owing to the lack of gestational age information (n = 24,878) may have led to bias. Fourth, it should be noted that some information on some potential confounders, such as maternal lifestyle and socioeconomic status, were not collected. Fifth, gestational age was determined using the last menstrual period in the medical records rather than ultrasound examination, which may have led to errors. Finally, owing to a lack of information, we did not explore the potential modification effects on fetal sex. Nevertheless, this might not have substantially influenced the present results, as previous studies did not observe an effect of sex on PTB.
This study provides a comprehensive understanding of the relationship between O3 exposure and PTB. These results demonstrate the adverse effects of O3 on PTB, with a stronger association in the 1st trimester. Specifically, the critical window periods of O3 exposure for PTB were 2–13 and 33–36 weeks of gestation. Elderly pregnant women who conceived in the winter appeared to be more susceptible to infection. Therefore, public health policies should be developed to prevent the adverse effects of air pollution in pregnant women.
-
Table S3. The effects of weekly ozone exposure during pregnancy on the risk of preterm birth
Weeks HR 95% CI 1 1.185 0.963–1.458 2 1.226 1.028–1.463 3 1.266 1.093–1.467 4 1.303 1.155–1.471 5 1.335 1.209–1.475 6 1.359 1.249–1.478 7 1.371 1.269–1.482 8 1.371 1.267–1.483 9 1.355 1.245–1.474 10 1.321 1.025–1.449 11 1.270 1.151–1.401 12 1.201 1.085–1.330 13 1.116 1.007–1.236 14 1.017 0.921–1.123 15 0.914 0.831–1.005 16 0.812 0.742–0.889 17 0.719 0.658–0.785 18 0.635 0.580–0.696 19 0.564 0.511–0.622 20 0.505 0.453–0.563 21 0.459 0.406–0.518 22 0.424 0.371–0.485 23 0.402 0.348–0.464 24 0.391 0.336–0.454 25 0.393 0.337–0.458 26 0.410 0.353–0.476 27 0.442 0.384–0.509 28 0.492 0.433–0.560 29 0.564 0.504–0.630 30 0.662 0.603–0.727 31 0.794 0.734–0.858 32 0.970 0.903–1.042 33 1.205 1.112–1.305 34 1.515 1.367–1.678 35 1.922 1.682–2.197 36 2.454 2.073–2.906
doi: 10.3967/bes2025.007
Susceptible Windows of Prenatal Ozone Exposure and Preterm Birth: A Hospital-Based Observational Study
-
Conceptualization: Jie Song. Methodology: Rongrong Qu, Dongqin Zhang, Hanying Li, Weidong Wu. Software: Rongrong Qu, Dongqin Zhang, Hanying Li, Jiayin Zhi, Yanxi Chen, Weidong Wu. Data curation: Rongrong Qu, Jiayin Zhi, Jie Song. Formal analysis: Rongrong Qu. Writing-original draft: Rongrong Qu. Writing-review and editing: Dongqin Zhang, Jiayin Zhi, Ling Chao, Zhenzhen Liang, Chenguang Zhang, Weidong Wu, Jie Song. Supervision: Jie Song. Funding acquisition: Jie Song.
The authors declare that they have no conflict of interest.
This study was approved by the Medical Ethics Committee of the Xinxiang Medical University (approval no.: XYLL-2021081). The data used in this study were anonymized without individually identifiable information.
注释:1) Authors’ Contributions: 2) Competing Interests: 3) Ethics: -
Figure 1. Hazard ratios (HRs) of PTB associated with weekly-specific O3 exposure stratified by maternal age and conception season; A, all; B, maternal age ≤ 24 years; C, 25–29 years; D, ≥ 30 years; E, warm season; F, cold season. Distributed lag models (DLMs) incorporating Cox proportional hazard models were used to calculate the HRs (95% CIs) per 10 µg/m3 increase for O3 during the study period. All models were adjusted for maternal age, marriage, maternal occupation, season of conception, medical payment method, nationality, ambient temperature, and relative humidity.
Table 1. Characteristics of mothers in this study in Xinxiang from 2015 to 2021
Characteristics Preterm birth (< 37 weeks)
n = 6,692Term birth (≥ 37 weeks)
n = 25,806Total births
n = 32,498P value Gestational age [weeks, mean (SD)] 33.64 (2.53) 39.01 (1.16) 37.90 (2.66) < 0.001a Maternal age [years, mean (SD)] 29.00 (5.16) 29.14 (4.49) 29.11 (4.64) < 0.001a Marital status, n (%) Married 6,542 (97.76) 25,682 (99.52) 32,224 (99.16) < 0.001b Other 150 (2.24) 124 (0.48) 274 (0.84) Nationality, n (%) Han 6,672 (99.70) 25,714 (99.64) 32,386 (99.66) 0.473b Others 20 (0.30) 92 (0.36) 112 (0.34) Medical payment method, n (%) Urban resident basic medical insurance/
urban employee basic medical insurance359 (5.36) 4,249 (16.47) 4,608 (14.18) < 0.001b New rural cooperative medical schema 1,421 (21.23) 5,463 (21.17) 6,884 (21.18) Self-paid 4,909 (73.36) 16,082 (62.32) 20,991 (64.59) Other 3 (0.04) 12 (0.05) 15 (0.05) Maternal occupation, n (%) Self-employed workers 224 (3.35) 1,223 (4.74) 1,447 (4.45) < 0.001b Persons working in government
departments or institutions1,122 (16.77) 7,033 (27.25) 8,155 (25.09) Farmer/worker 2,108 (31.50) 4,748 (18.40) 6,856 (21.10) Other 3,238 (48.39) 12,802 (49.61) 16,040 (49.36) Season of conception, n (%) Spring 1,659 (24.49) 5,961 (23.10) 7,620 (23.45) < 0.001b Summer 1,559 (23.30) 6,778 (25.88) 8,337 (25.65) Fall 1,661 (24.82) 6,876 (26.64) 8,537 (26.27) Winter 1,813 (27.09) 6,191 (23.99) 8,004 (24.63) Note. aWilcoxon rank-sum test was used to compare the differences between pregnant women with preterm and term births; bChi-square test was used to compare the differences between pregnant women with preterm birth and term birth.  下载: 导出CSV
S1. Description of O3 concentration in three trimesters and the whole pregnancy and their correlation during 2015–2020
O3 (μg/m3) Mean SD Min 25th Median 75th Max IQR 1st trimester 2nd trimester 3rd trimester The entire pregnancy 1st trimester 56.73 28.12 0.97 31.91 53.46 77.90 119.26 45.99 1.00 2nd trimester 58.21 27.91 0.97 33.64 57.04 79.14 119.26 45.50 0.07 1.00 3rd trimester 60.89 27.96 9.00 35.62 59.79 82.03 140.40 46.41 −0.81 0.12 1.00 The entire pregnancy 57.95 14.15 11.33 49.90 56.71 67.99 99.13 18.09 0.20 0.87 0.19 1.00 Note. SD: standard deviation; Min: minimum; 25th: 25 percentile; 75th: 75 percentile; IQR: interquartile range; 1st trimester: the first trimester (gestational weeks 1–13); 2nd trimester: the second trimester (gestational weeks 14–26); 3rd trimester: the third trimester (gestational weeks 27 to the week of delivery).
下载: 导出CSV
S2. The correlation correlations of ozone to co–pollutants
Air pollutants PM2.5 PM10 CO NO2 O3 SO2 Temperature Humidity PM10 0.977 1.000 CO 0.885 0.821 1.000 NO2 0.827 0.775 0.865 1.000 O3 –0.815 –0.780 –0.662 –0.749 1.000 SO2 0.857 0.861 0.731 0.639 –0.598 1.000 Temperature –0.705 –0.687 –0.644 –0.693 0.837 –0.459 1.000 Humidity –0.322 –0.394 –0.215 –0.297 0.175 –0.440 0.431 1.000
下载: 导出CSV
Table 2. Estimated effects of O3 on PTB at different exposure periods
Gestational period Model 1a Model 2b HR 95% CI HR 95% CI PTB 1st trimester 1.002 1.001−1.003 1.037 1.034−1.040 2nd trimester 1.004 1.003−1.005 1.005 1.002−1.009 3rd trimester 1.002 1.001−1.003 1.028 1.025−1.031 The entire pregnancy 1.008 1.006−1.010 1.058 1.053−1.063 MPTB 1st trimester 1.003 1.001−1.004 1.030 1.026−1.034 2nd trimester 1.004 1.003−1.006 1.022 1.017−1.027 3rd trimester 1.001 1.000−1.003 1.019 1.014−1.023 The entire pregnancy 1.008 1.005−1.011 1.064 1.057−1.071 VPTB 1st trimester 1.001 1.000−1.003 1.041 1.035−1.046 2nd trimester 1.004 1.002−1.006 0.999 0.994−1.005 3rd trimester 1.003 1.001−1.005 1.033 1.027−1.039 The entire pregnancy 1.007 1.003−1.010 1.052 1.043−1.060 ExPTB 1st trimester 1.001 0.999−1.004 1.044 1.037−1.051 2nd trimester 1.005 1.003−1.007 0.991 0.983−0.998 3rd trimester 1.003 1.001−1.005 1.030 1.023−1.037 The entire pregnancy 1.009 1.005−1.014 1.046 1.035−1.056 Note. HR, hazard ratio; CI, confidence interval. HRs (95% CIs) were estimated for per 10 µg/m3 increase in O3. aAdjusted for maternal age, marriage, maternal occupation, season of conception, medical payment method, and nationality; bAdjusted for maternal age, marital status, maternal occupation, season of conception, medical payment method, nationality, ambient temperature, and relative humidity.
下载: 导出CSV
S4. Hazard ratios of preterm birth associated with weekly ozone exposure, stratified by age
Weeks ≤ 24 years 25–29 years ≥ 30 years HR 95% CI HR 95% CI HR 95% CI 1 1.511 0.814–2.803 1.549 1.139–2.107 0.834 0.600–1.160 2 1.469 0.865–2.494 1.539 1.185–1.999 0.918 0.694–1.213 3 1.428 0.915–2.229 1.527 1.228–1.899 1.007 0.798–1.270 4 1.386 0.958–2.004 1.513 1.266–1.807 1.099 0.909–1.329 5 1.342 0.990–1.820 1.494 1.291–1.728 1.191 1.019–1.392 6 1.297 1.003–1.677 1.469 1.299–1.330 1.278 1.119–1.459 7 1.249 0.991–1.574 1.437 1.284–1.607 1.35 1.197–1.533 8 1.197 0.954–1.502 1.39 1.247–1.564 1.414 1.245–1.606 9 1.143 0.901–1.449 1.348 1.193–1.523 1.451 1.263–1.667 10 1.285 0.841–1.399 1.291 1.130–1.473 1.460 1.254–1.699 11 1.024 0.782–1.340 1.224 1.062–1.410 1.436 1.220–1.690 12 0.959 0.726–1.268 1.149 0.992–1.331 1.378 1.163–1.633 13 0.892 0.675–1.181 1.066 0.921–1.235 1.287 1.084–1.527 14 0.824 0.628–1.082 0.978 0.849–1.128 1.168 0.987–1.381 15 0.757 0.584–0.982 0.890 0.778–1.017 1.035 0.881–1.217 16 0.694 0.541–0.891 0.805 0.709–0.914 0.902 0.772–1.054 17 0.637 0.497–0.815 0.727 0.642–0.823 0.777 0.666–0.907 18 0.587 0.453–0.758 0.658 0.579–0.748 0.666 0.569–0.781 19 0.544 0.411–0.719 0.599 0.521–0.688 0.572 0.483–0.678 20 0.509 0.373–0.695 0.550 0.470–0.642 0.495 0.411–0.596 21 0.483 0.341–0.684 0.511 0.429–0.610 0.434 0.353–0.533 22 0.465 0.317–0.683 0.484 0.398–0.588 0.388 0.310–0.486 23 0.457 0.302–0.690 0.466 0.377–0.577 0.357 0.280–0.454 24 0.458 0.297–0.706 0.461 0.368–0.578 0.338 0.263–0.435 25 0.471 0.304–0.730 0.467 0.372–0.587 0.334 0.259–0.430 26 0.497 0.324–0.764 0.488 0.391–0.611 0.343 0.268–0.440 27 0.539 0.360–0.807 0.525 0.425–0.648 0.368 0.291–0.466 28 0.597 0.414–0.861 0.579 0.478–0.702 0.410 0.332–0.507 29 0.675 0.491–0.929 0.654 0.553–0.773 0.472 0.392–0.569 30 0.778 0.595–1.016 0.753 0.654–0.867 0.560 0.479–0.656 31 0.911 0.730–1.137 0.883 0.785–0.994 0.682 0.898–0.779 32 1.081 0.884–1.322 1.052 0.946–1.170 0.850 0.752–0.960 33 1.299 1.038–1.625 1.269 1.128–1.427 1.079 0.942–1.235 34 1.574 1.180–2.099 1.546 1.332–1.796 1.389 1.170–1.650 35 1.921 1.319–2.798 1.899 1.563–2.307 1.810 1.450–2.259 36 2.355 1.461–3.796 2.344 1.831–3.000 2.375 1.795–3.141
下载: 导出CSV
S5. Hazard ratios of preterm birth associated with ozone exposure in two–pollutant model
Trimester HR 95% CI Trimester 1 O3 1.037 1.034–1.040 +PM2.5 1.045 1.042–1.049 +PM10 1.045 1.042–1.049 +NO2 1.033 1.030–1.036 +SO2 1.059 1.055–1.062 +CO 1.035 1.032–1.038 Trimester 2 O3 1.005 1.002–1.009 +PM2.5 1.009 1.006–1.012 +PM10 1.008 1.005–1.012 +NO2 1.006 1.002–1.009 +SO2 1.010 1.007–1.013 +CO 1.005 1.002–1.009 Trimester 3 O3 1.028 1.025–1.031 +PM2.5 1.034 1.030–1.037 +PM10 1.033 1.029–1.036 +NO2 1.018 1.015–1.021 +SO2 1.042 1.039–1.046 +CO 1.026 1.023–1.030
下载: 导出CSV
S3. The effects of weekly ozone exposure during pregnancy on the risk of preterm birth
Weeks HR 95% CI 1 1.185 0.963–1.458 2 1.226 1.028–1.463 3 1.266 1.093–1.467 4 1.303 1.155–1.471 5 1.335 1.209–1.475 6 1.359 1.249–1.478 7 1.371 1.269–1.482 8 1.371 1.267–1.483 9 1.355 1.245–1.474 10 1.321 1.025–1.449 11 1.270 1.151–1.401 12 1.201 1.085–1.330 13 1.116 1.007–1.236 14 1.017 0.921–1.123 15 0.914 0.831–1.005 16 0.812 0.742–0.889 17 0.719 0.658–0.785 18 0.635 0.580–0.696 19 0.564 0.511–0.622 20 0.505 0.453–0.563 21 0.459 0.406–0.518 22 0.424 0.371–0.485 23 0.402 0.348–0.464 24 0.391 0.336–0.454 25 0.393 0.337–0.458 26 0.410 0.353–0.476 27 0.442 0.384–0.509 28 0.492 0.433–0.560 29 0.564 0.504–0.630 30 0.662 0.603–0.727 31 0.794 0.734–0.858 32 0.970 0.903–1.042 33 1.205 1.112–1.305 34 1.515 1.367–1.678 35 1.922 1.682–2.197 36 2.454 2.073–2.906
下载: 导出CSV
-
[1] Vogel JP, Chawanpaiboon S, Moller AB, et al. The global epidemiology of preterm birth. Best Pract Res Clin Obstet Gynaecol, 2018; 52, 3−12. doi: 10.1016/j.bpobgyn.2018.04.003 [2] Greer C, Troughton RW, Adamson PD, et al. Preterm birth and cardiac function in adulthood. Heart, 2022; 108, 172−7. doi: 10.1136/heartjnl-2020-318241 [3] Goldenberg RL, Culhane JF, Iams JD, et al. Epidemiology and causes of preterm birth. Lancet, 2008; 371, 75−84. doi: 10.1016/S0140-6736(08)60074-4 [4] Fell DB, Dimanlig-Cruz S, Regan AK, et al. Risk of preterm birth, small for gestational age at birth, and stillbirth after covid-19 vaccination during pregnancy: population based retrospective cohort study. BMJ, 2022; 378, e071416. [5] Annesi I, Moreau T, Lellouch J. Efficiency of the logistic regression and cox proportional hazards models in longitudinal studies. Stat Med, 1989; 8, 1515−21. doi: 10.1002/sim.4780081211 [6] Gong YX, Sun PP, Fu XL, et al. The type of previous abortion modifies the association between air pollution and the risk of preterm birth. Environ Res, 2022; 212, 113166. doi: 10.1016/j.envres.2022.113166 [7] Stieb DM, Lavigne E, Chen L, et al. Air pollution in the week prior to delivery and preterm birth in 24 Canadian cities: a time to event analysis. Environ Health, 2019; 18, 1. doi: 10.1186/s12940-018-0440-8 [8] Zhou GY, Wu JJ, Yang M, et al. Prenatal exposure to air pollution and the risk of preterm birth in rural population of Henan Province. Chemosphere, 2022; 286, 131833. doi: 10.1016/j.chemosphere.2021.131833 [9] Onoda A, Takeda K, Umezawa M. Dose-dependent induction of astrocyte activation and reactive astrogliosis in mouse brain following maternal exposure to carbon black nanoparticle. Part Fibre Toxicol, 2017; 14, 4. doi: 10.1186/s12989-017-0184-6 [10] Vadillo-Ortega F, Osornio-Vargas A, Buxton MA, et al. Air pollution, inflammation and preterm birth: a potential mechanistic link. Med Hypotheses, 2014; 82, 219−24. doi: 10.1016/j.mehy.2013.11.042 [11] Rappazzo KM, Nichols JL, Rice RB, et al. Ozone exposure during early pregnancy and preterm birth: a systematic review and meta-analysis. Environ Res, 2021; 198, 111317. doi: 10.1016/j.envres.2021.111317 [12] Baqui AH, Lee ACC, Koffi AK, et al. Prevalence of and risk factors for abnormal vaginal flora and its association with adverse pregnancy outcomes in a rural district in north-east Bangladesh. Acta Obstet Gynecol Scand, 2019; 98, 309−19. doi: 10.1111/aogs.13492 -
 24218+Supplementary Materials.pdf

-

 点击查看大图
计量
- 文章访问数: 8729
- HTML全文浏览量: 4302
- PDF下载量: 44
- 被引次数: 0

 Quick Links