

 下载:
下载:


-
Tuberculosis (TB) remains one of the leading infectious causes of mortality worldwide, with an estimated one-quarter of the global population harboring Mycobacterium TB (Mtb) infection[1,2]. According to the 2024 World Health Organization (WHO) report, there were 10.8 million new TB cases and 1.25 million deaths in 2023[3]. A proportion of patients experience chronic respiratory sequelae following treatment, termed post TB lung disease (PTLD), characterized by persistent respiratory symptoms, radiological abnormalities, and pulmonary dysfunction[4,5].
The First International PTLD Symposium in 2019 defined PTLD as chronic respiratory abnormalities attributable to prior pulmonary TB, regardless of the presence of current symptoms[6]. The pathogenesis of PTLD involves the direct damage caused by Mtb, immune-mediated injury, and environmental exposures, leading to airway remodeling, reduced lung elasticity, and vascular injury[7-9]. Pathological examinations have indicated that PTLD is characterized by granulomatous inflammation and fibrosis predominantly concentrated around the small bronchovascular bundles, accompanied by significant perilesional fibrosis, which directly damages small airway structures and consequently impairs lung function[8,10]. Lung function impairment in PTLD may manifest as obstructive, restrictive, or mixed patterns[9,11]. A longitudinal study from Malawi involving 405 TB patients found that 34.2% had impaired lung function at treatment completion, with the impairment persisting in 27.9% of patients after three years[11,12]. In recent years, pulmonary TB has been increasingly recognized as an independent and significant risk factor for the development of chronic obstructive pulmonary disease (COPD), termed TB-associated COPD (TB-COPD)[8,13]. Moreover, individuals with a history of TB are approximately 4-fold higher risk to develop COPD compared to those without TB (25.7% vs. 8.3%)[14]. TB-COPD is a distinct phenotype of airflow obstruction that develops as a sequela of pulmonary TB, characterized by persistent airflow limitation and radiological signs of small airway involvement[15]. In China, a cross-sectional study involving 8680 individuals revealed that 21.3% of participants with radiologic evidence of prior TB exhibited airflow obstruction[16]. However, prospective data on the development and long-term progression of TB-COPD following anti-TB treatment remain limited.
China has a high burden of tuberculosis, but no prospective cohort studies have yet been conducted to evaluate lung function models in pulmonary TB patients. This study aimed to assess longitudinal changes in lung function over a 5-year period and to identify predictors of airflow obstruction in a cohort of patients treated for active pulmonary TB[17].
-
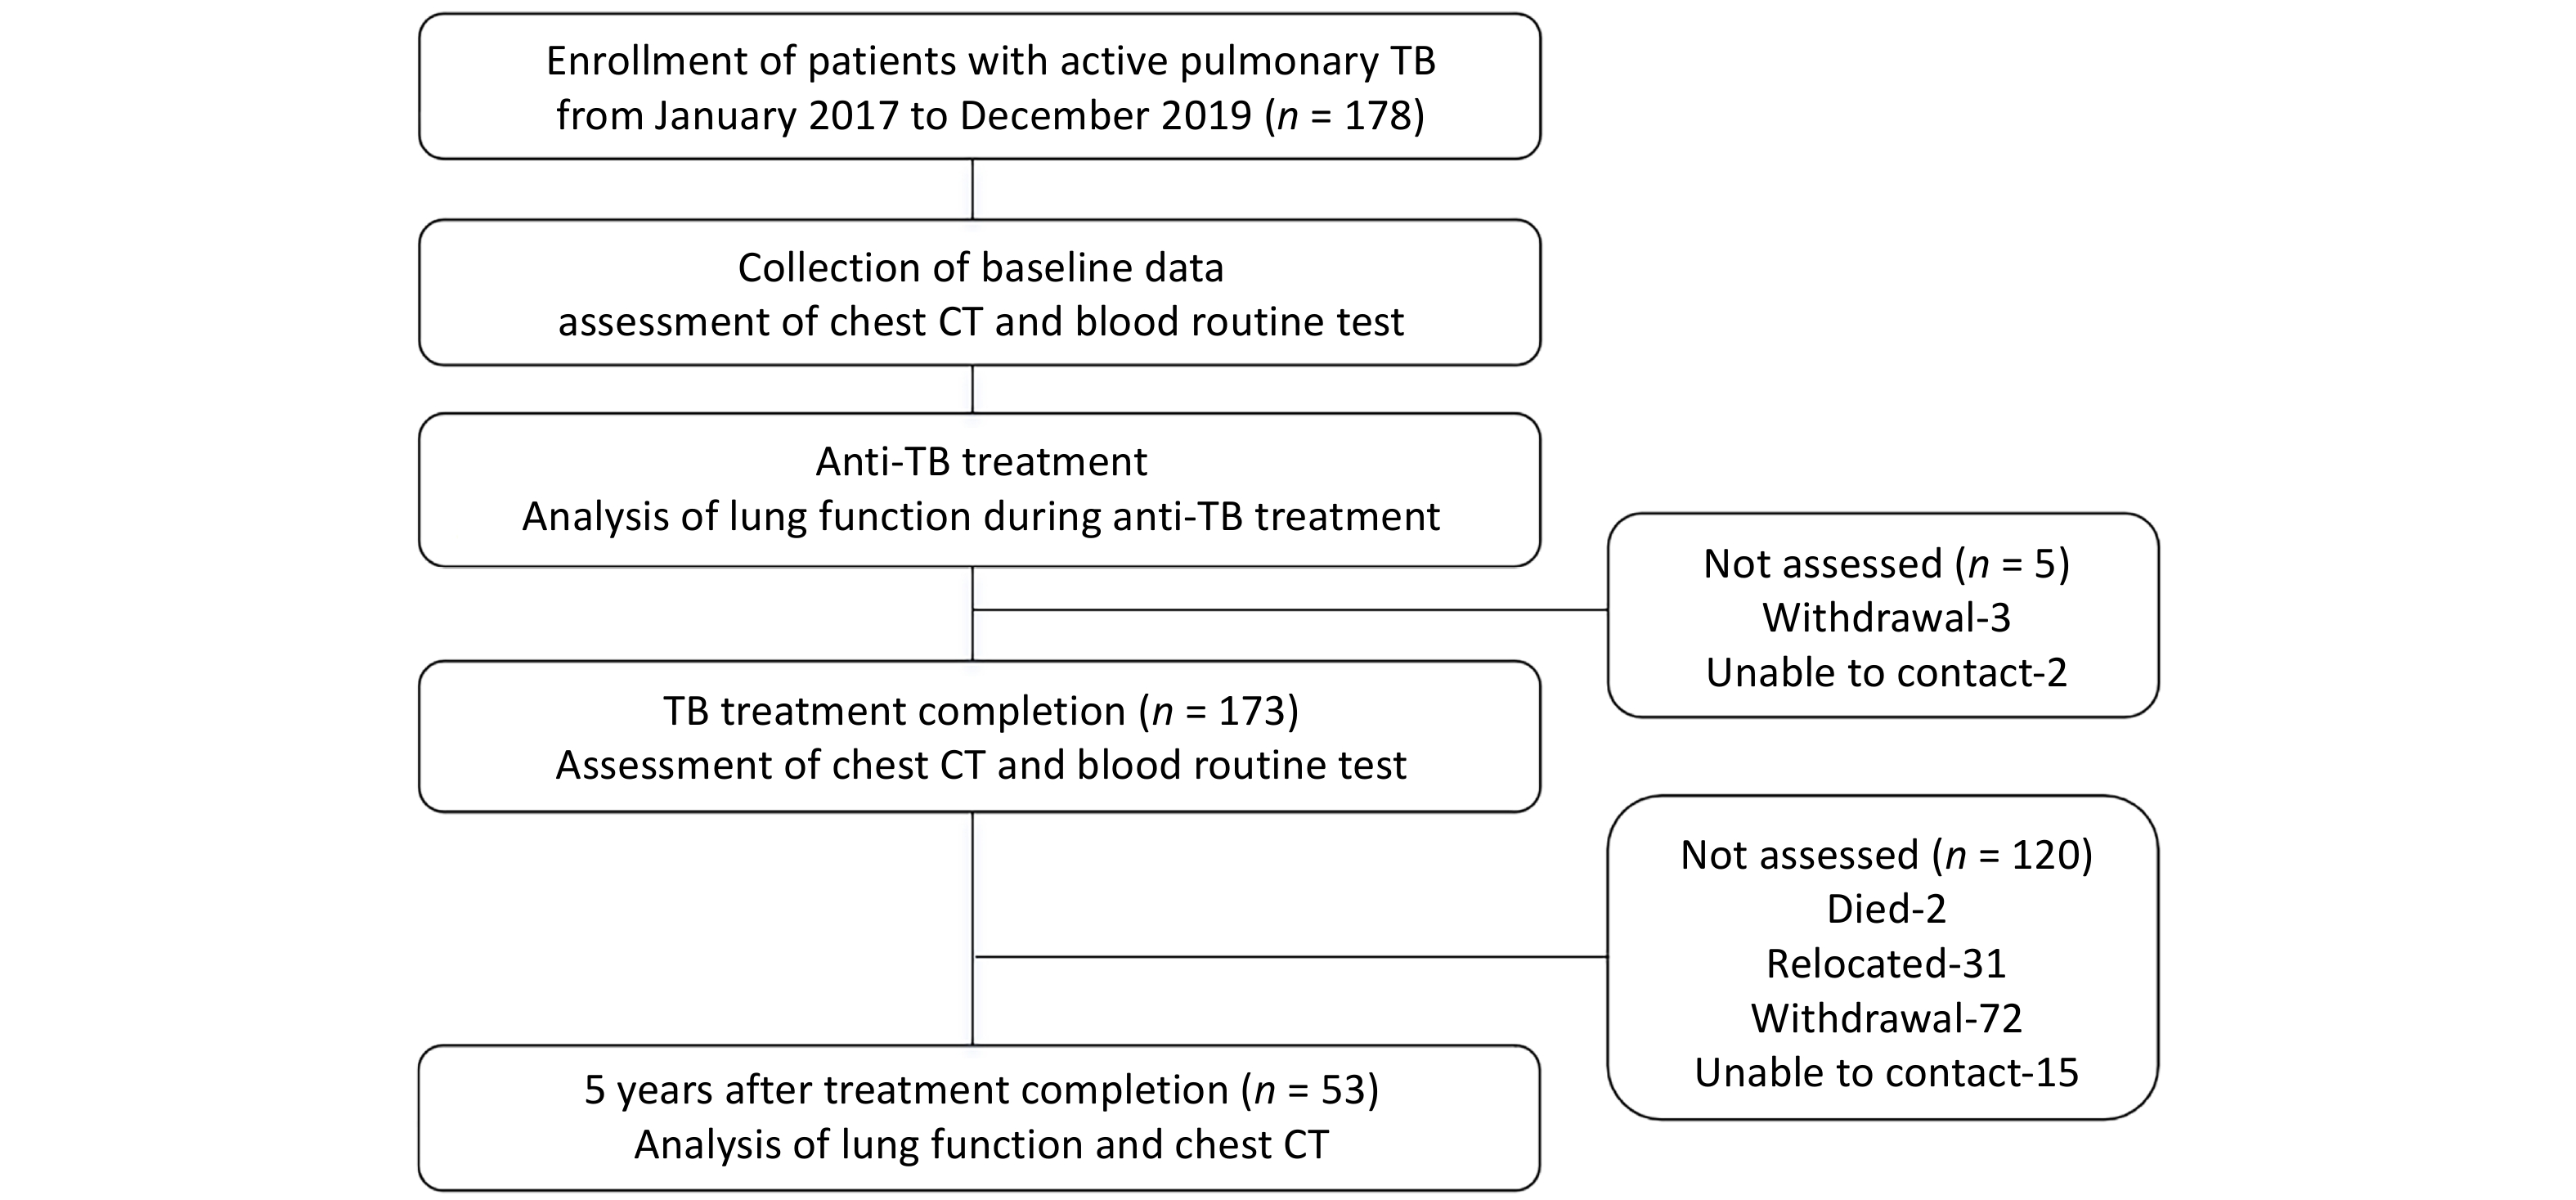
In this prospective cohort study, we enrolled 178 patients diagnosed with active pulmonary TB from the TB Outpatient Clinic of Beijing Geriatric Hospital between 1 January 2017 to 31 December 2019. Follow-up evaluations were conducted after anti-TB treatment to assess the development of TB-COPD. The diagnosis of pulmonary TB was confirmed by microbiological detection of Mtb in bodily fluids (e.g., sputum, bronchoalveolar lavage fluid, or pleural effusion) or histopathological confirmation from lung or pleural biopsy in patients with clinical symptoms and chest CT findings [1]. Inclusion Criteria: (1) Age 18 to 70 years; (2) Permanent residency in Beijing or surrounding areas to ensure long-term follow-up compliance; (3) Willingness to undergo serial lung function testing. Exclusion Criteria: (1) HIV positivity, malignancies (e.g., lung cancer), or severe cardiovascular / cerebrovascular diseases; (2) Inability to complete long-term follow-up. TB-COPD should be considered when airflow limitation (FEV1/FVC < 70%) develops in patients with prior TB, along with imaging findings suggestive of small airway disease (typically manifested as air trapping, mosaic attenuation, fibrotic scars, etc)[15,18,19].
At enrollment, baseline data were collected, including age, gender, height, weight, comorbidities, smoking history, as well as initial imaging and laboratory results (chest CT, blood routine test, and serum albumin). Based on lung function test results, patients were categorized into three groups: normal airflow group, low FVC group and airflow obstruction group.
Clinical follow-up was conducted at Beijing Geriatric Hospital at two time points: (1) At completion of anti-TB treatment: primary follow-up assessments included chest CT and blood routine test. (2) Five years after treatment completion (5-year follow-up): comprehensive follow-up evaluations were performed, including: updated baseline data (age, BMI, newly developed comorbidities), respiratory symptom assessments [St. George’s Respiratory Questionnaire (SGRQ), COPD Assessment Test (CAT), modified Medical Research Council (mMRC) dyspnea scale], lung function test, Chest CT scan, and blood routine test (Figure 1). A total of 53 patients completed the 5-year follow-up.
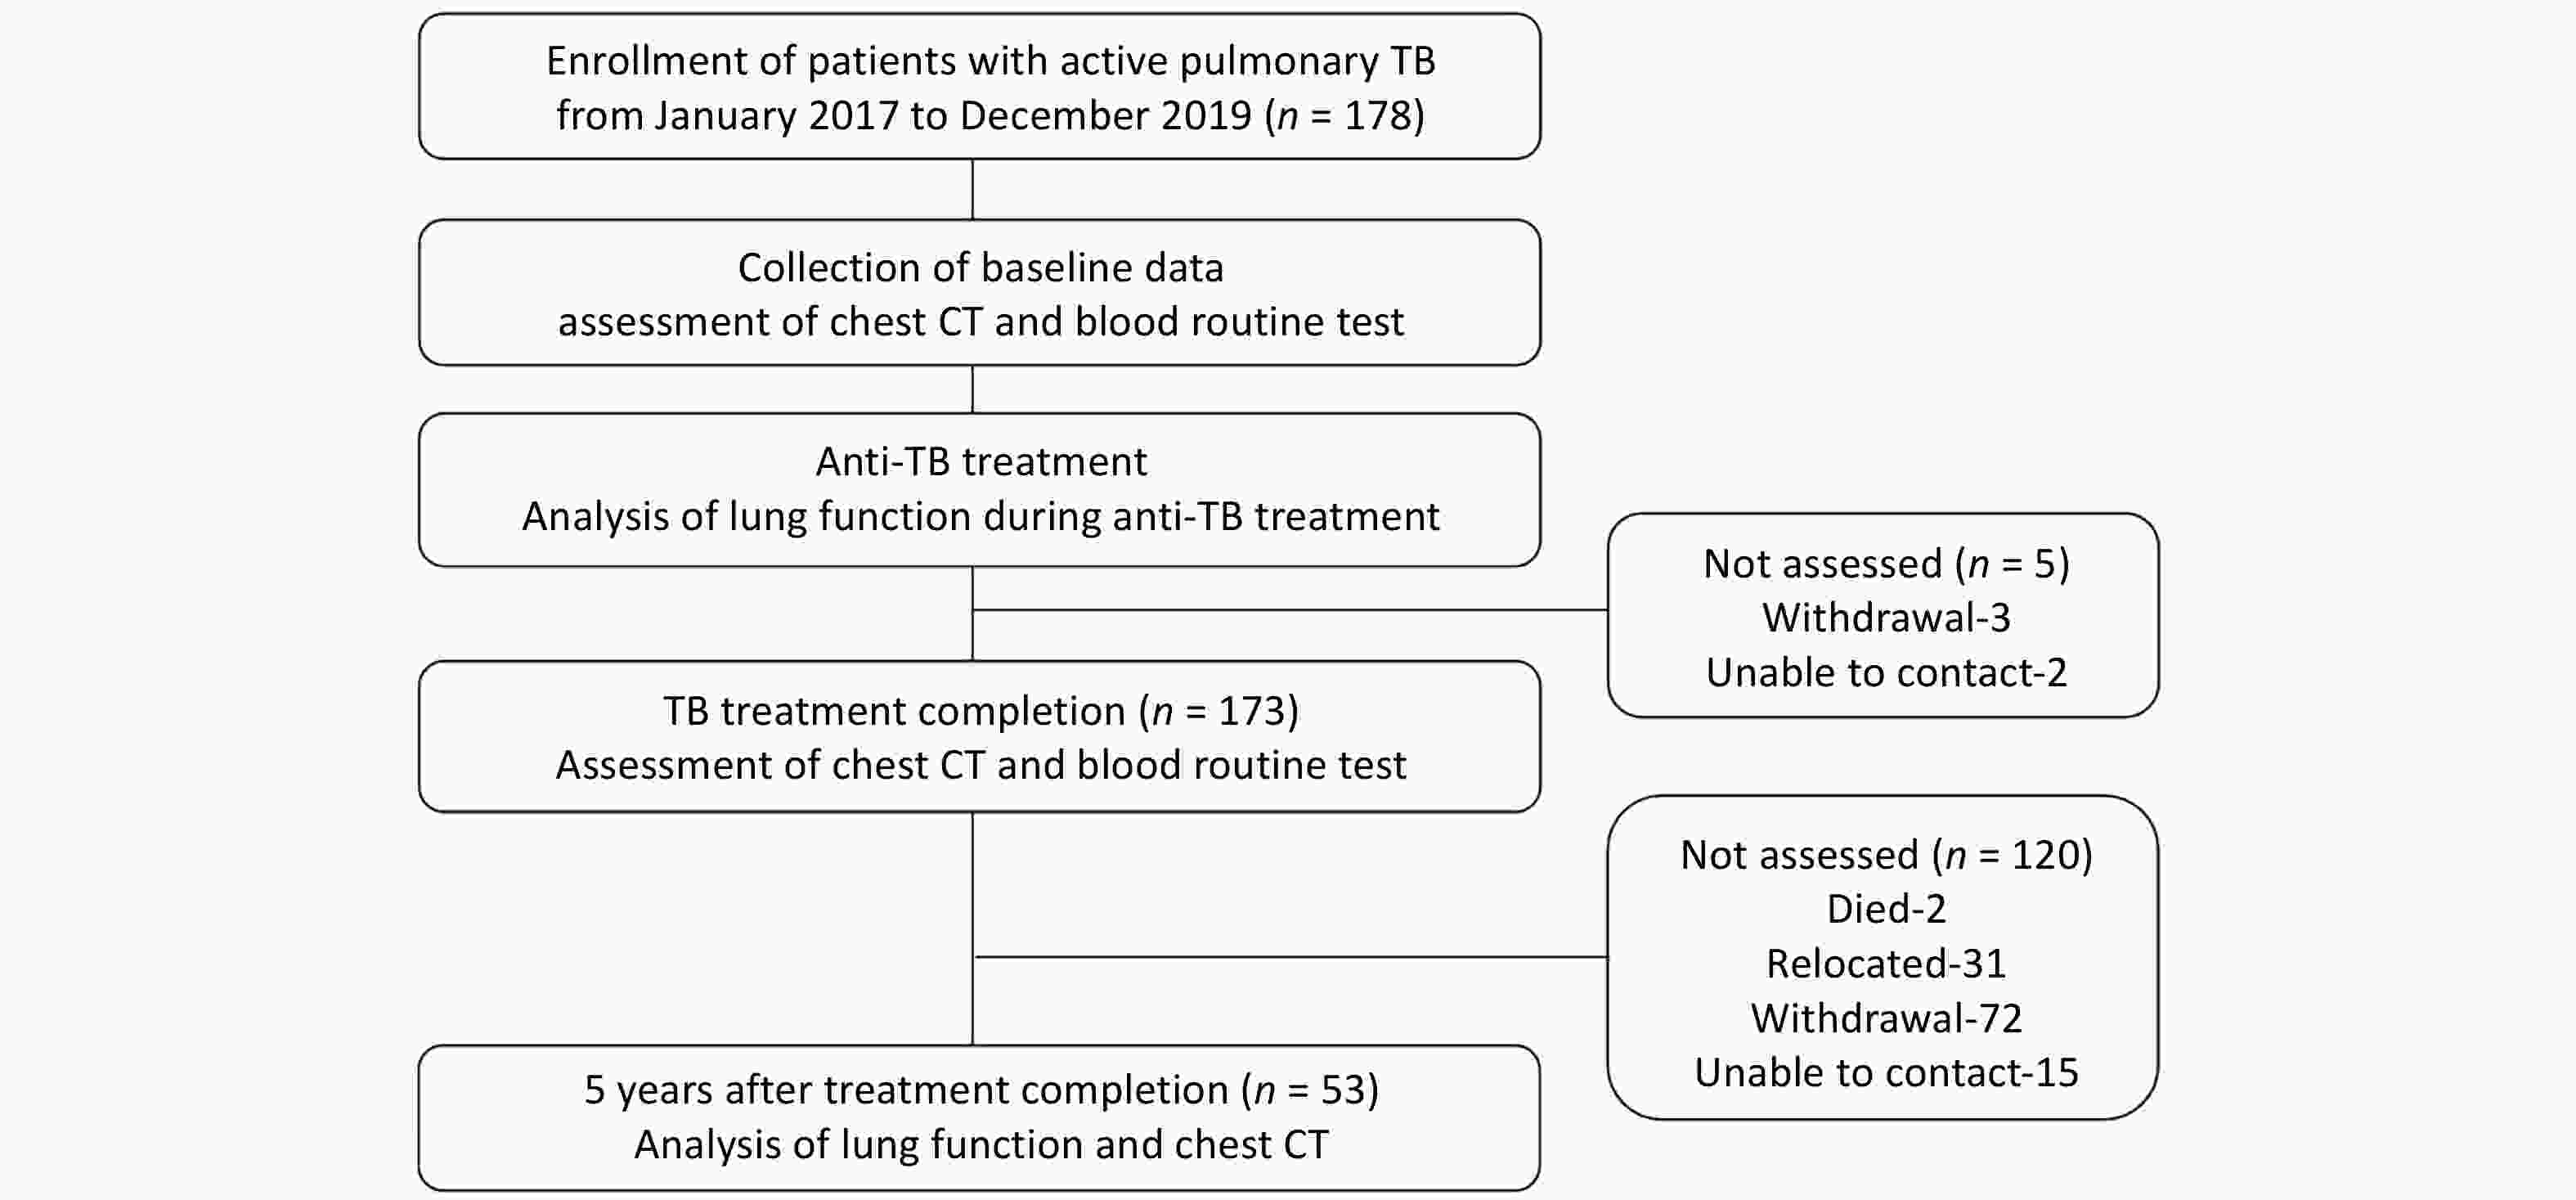
Figure 1. Flowchart of Study Design.
This prospective cohort study has been registered with ClinicalTrials.gov (NCT 05426720). Written informed consent was obtained from all participating patients.
-
Lung function test was performed by experienced technicians according to internationally standardized protocol[20]. Parameters assessed included: forced expiratory volume in 1 second (FEV1), forced vital capacity (FVC), FEV1/FVC, forced expiratory flow at 25%-75% (FEF25-75), forced expiratory flow at 50% (FEF50), and forced expiratory flow at 75% (FEF75); lung volume parameters: total lung capacity (TLC), residual volume (RV) and RV/TLC; diffusion function parameter: diffusing capacity of the lungs for carbon monoxide (DLCO). % predicted (% pred) is expressed as a percentage of predicted values[9]. All testing was performed in accordance with ATS/ERS guidelines[21].
Airway patterns were categorized as follows: normal airflow group (post-bronchodilator FEV1/FVC ≥ 70% and FVC % pred ≥ 80%); airflow obstruction group (post-bronchodilator FEV1/FVC < 70%); low FVC group (FEV1/FVC ≥ 70% but FVC % pred < 80%); TLC % pred <80% was defined as low TLC; small airway dysfunction have been defined as ≥ 2 of FEF25-75 % pred, FEF50 % pred or FEF75 % pred < 65%. Additionally, DLCO % pred < 80% was defined as low DLCO[22].
-
Longitudinal chest CT examinations were performed for all pulmonary TB patients at three critical time points: (1) Baseline phase; (2) At treatment completion; (3) At the 5-year follow-up. Based on validated TB imaging scoring systems[11,23,24], CT evaluation was conducted to assess the characteristics and severity of imaging findings:
(1) Extent scoring: Each lung is divided into three zones (upper, middle, lower), with the lingula counted separately. Each zone is scored on a 0-4 scale based on the degree of parenchymal involvement. The total score ranged from 0 (no disease) to 24 (extensive bilateral involvement), see Supplementary Data 1[23].
(2) Feature-based scoring: Quantitative assessments were performed for specific pathological features, including fibrosis, calcification, emphysema, bronchiectasis, cavitation, micronodules, consolidation, infiltrates, mosaic attenuation, collapse, and volume loss. Additional findings such as pleural thickening or effusion and mediastinal lymphadenopathy were documented. Moreover, the extent of disease involvement (i.e., unilateral vs. bilateral) was recorded (Supplementary Data 1)[11,24]. All three serial chest CT examinations were reported independently by a radiologist, pulmonologist, and TB specialist. Where there were disagreements in the presence or type of radiological abnormality, discrepancies were resolved by consensus read. CT scoring and lung function assessments were performed in a blinded manner.
-
Data were analyzed using SPSS version 25 (IBM Corp., Armonk, NY). Normally distributed continuous variables were presented as mean ± standard deviation, while non-normally distributed variables were expressed as median (inter-quartile range). Continuous variables were compared using student’s t-tests or non-parametric tests. Categorical variables were expressed as frequencies and percentages and compared using χ2test.
Patients were stratified by lung function status, focusing on comparisons between the normal airflow and airflow obstruction groups. Univariable and multivariable logistic regression analyses were conducted to identify predictors of airflow obstruction. Based on previous studies, we selected potential influencing factors on lung function as independent variables, including age, sex, BMI, smoking history, previous TB, multidrug Resistance (MDR)[8,25]. The odds ratio (OR), 95% confidence interval (CI) and p value were reported. A P value < 0.05 was considered statistically significant.
-
A total of 178 patients were initially enrolled in this study, with a mean age of 37.5 ± 15.0 years, 108 (60.7%) were male. At baseline, the radiological score was 4.8 (IQR 3.0-8.0), the mean FEV1 was 3.05L ± 0.98L, FVC was 3.74L ± 1.04L, and FEV1/FVC ratio was 81.08% ± 11.50%. However, only 53 patients completed the 5-year follow-up. Therefore, the primary analysis focused on these 53 patients, evaluating changes in lung function over the 5-year period. A comparison of baseline characteristics between these 53 patients and the 125 who were lost to 5-year follow-up revealed no significant differences in sex, age, radiological score, or lung function parameters (Supplementary Table S1), suggesting that the follow-up group was representative of the overall cohort.
The baseline characteristics of the 53 patients were as follows: The mean age at initial treatment was 36.9 ± 13.9 years, and 34 patients (64.2%) were male. Seven patients (13.2%) had a TB history and had received prior anti-TB treatment. Comorbidities included diabetes mellitus in two patients (3.8%), and hypertension in five (9.4%). Among male patients, 18 (34.0%) had a long-term smoking history. The overall smoking pack-years were 0 (IQR 0-3.3) across all patients, and 7.4 (IQR 2.3-35.0) among smokers. None of the female patients had a history of smoking. All patients underwent sputum smear and culture tests at baseline. 7 (13.2%) had positive sputum smears, and 11 (20.8%) had positive sputum cultures. The baseline radiological score was 4.0 ( IQR 2.8-6.3) (Table 1).
Table 1. Baseline characteristics of patients with pulmonary TB at initial test
Items (n = 53) Baseline characteristic Male (%) 34 (64.2) Age (years) 36.9 ± 13.9 BMI (kg/m2) 21.41 ± 2.79 Smoking status Never smoker (%) 35 (66.0) Smoker (%) 18 (34.0) Pack-years of smoking for all patients (median, IQR) 0 (0–3.3) Pack-years of smoking for smokers (median, IQR) 7.4 (2.3–35.0) Occupational dust exposure (%) 1 (0.6) Comorbidities Diabetes (%) 2 (3.8) Hypertension (%) 5 (9.4) Previous TB (%) 7 (13.2) MDR (%) 3 (5.7) IGRA positive (%) 35 (66.0) Sputum smear (+) (%) 7 (13.2) Sputum culture (+) (%) 11 (20.8) Radiological score (median, IQR) 4.0 (2.8-6.3) Note. BMI, Body Mass Index; TB, tuberculosis; MDR, Multidrug Resistance; IGRA, Interferon Gamma Release Assay. -
The first lung function test was performed in all 53 patients during anti-TB treatment after sputum smear conversion to negative, serving as baseline lung function (initial test). The time from treatment initiation to first spirometry was 5.5 (3.8-7.6) months. The mean FEV1 was 3.06L ± 1.01 L, FVC was 3.76L ± 1.03 L, and FEV1/FVC ratio was 80.23% ± 11.02% (Table 2). Based on spirometric pattern, 43 (81.1%) patients had normal airflow, 7 (13.2%) had airflow obstruction, and 3 (5.7%) had low FVC. Among the 7 patients with airflow obstruction, 5 (71.4%) were male, and 2 were smokers (both male). Patients with airflow obstruction had significantly higher radiological score at baseline compared to those with normal airflow [8.0 (5.0-16.5) vs. 3.5 (2.0-5.0), P = 0.002]. No significant differences were observed in other baseline characteristics (all P > 0.05) (Supplementary Table S2).
Table 2. Longitudinal lung function changes in patients over 5 years
Parameters Initial test (n = 53) 5-year follow-up (n = 53) Mean difference (95% CI) P value Spirometry FEV1 (L) 3.06 ± 1.01 2.97 ± 1.09 −0.09 (−0.17,−0.01) 0.035* FEV1 % pred (%) 88.36 ± 20.28 86.70 ± 21.65 −1.66 (−9.75,6.42) 0.684 FVC (L) 3.76 ± 1.03 3.83 ± 1.16 0.07 (−0.02,0.16) 0.107 FVC % pred (%) 102.19 ± 18.93 94.23 ± 18.11 −7.97 (−15.10,0.83) 0.029* FEV1/FVC (%) 80.23 ± 11.02 76.27 ± 12.04 −3.97 (−5.38,−2.55) < 0.001* FEF25−75 % pred (%) 63.70 ± 25.12 64.16 ± 28.80 0.46 (−3.51,4.44) 0.816 FEF50 % pred (%) 58.91 ± 22.70 68.25 ± 31.18 9.33 (−1.21,19.88) 0.082 FEF75 % pred (%) 49.46 ± 23.39 75.54 ± 30.97 26.08 (15.43−36.72) < 0.001* Plethysmography TLC (L) 6.42 ± 1.63 7.61 ± 12.66 1.19 (−2.29,4.67) 0.504 TLC % pred (%) 119.81 ± 20.04 96.64 ± 22.22 −23.17 (−31.43,−14.91) < 0.001* RV (L) 2.79 ± 1.16 2.23 ± 0.93 −0.56 (−0.97,−0.15) 0.001* RV/TLC (%) 42.65 ± 10.39 41.68 ± 21.37 −0.97 (−7.48,5.53) 0.728 Diffusion capacity DLCO % pred (%) 75.84 ± 26.94 84.17 ± 18.92 9.24 (1.97,16.50) 0.014* Note. FEV1, forced expiratory volume in 1 second; FVC, forced vital capacity; FEF25−75, forced expiratory flow at 25%−75%; FEF50, forced expiratory flow at 50%; FEF75, forced expiratory flow at 75%; TLC, total lung capacity; RV, residual volume; DLCO, diffusing capacity of the lungs for carbon monoxide; % pred, % predicted; *P < 0.05. -
At the 5-year follow-up, 53 patients underwent a second lung function test. The mean FEV1 was 2.97L ± 1.09L, FVC was 3.83L ± 1.16L, and FEV1/FVC ratio was 76.27% ± 12.04% (Table 2). Forty-one patients had normal airflow, 9 (17.0%) exhibited airflow obstruction, 3 (5.7%) had low FVC, 26 (49.1%) had small airway dysfunction, 9 (17.0%) had low TLC and 14 (26.4%) had low DLCO . Patients in the airflow obstruction group were significantly older than those with normal airflow (54.7 ± 13.5 years old vs. 40.1 ± 12.7 years old, P = 0.003). Quality of life scores were significantly worse in the airflow obstruction group, with higher median scores on the SGRQ [29.0 (13.0–36.5) vs. 3.0 (0–6.0)], CAT [22.0 (12.0–24.5) vs. 10.0 (8.0–12.5)], and mMRC [2.0 (1.5–3.0) vs. 0 (0–1.0)] (all P < 0.05). Although pack-years of smoking, IGRA positivity, sputum smear positivity, and sputum culture positivity, were slightly higher in the airflow obstruction group, the differences were not statistically significant. Additionally, the radiological score at the 5-year follow-up was significantly higher in the airflow obstruction group compared to the normal airflow function group [5.8 (2.5–12.3) vs. 1.5 (1.0–2.8), P = 0.008] (Table 3).
Table 3. Comparison between normal airflow and airflow obstruction groups at 5-year follow-up
Items Total (n = 53) Normal airflow (n = 41) Airflow obstruction (n = 9) P value Male (%) 34 (64.2) 28 (68.3) 6 (66.7) 1.000 Age (years) 43.2 ± 13.8 40.1 ± 12.7 54.7 ± 13.5 0.003* BMI (kg/m2) 22.00 ± 2.95 21.97 ± 2.92 22.64 ± 3.11 0.541 Smoking history (%) 18 (34.0) 14 (34.1) 4 (44.4) 0.842 pack−years of smoking 0 (0−5.5) 0 (0−4.5) 0 (0−35.0) 0.343 Diabetes history (%) 2 (3.8) 1 (2.4) 1 (11.1) 0.414 Hypertension history (%) 5 (9.4) 3 (7.3) 1 (11.1) 0.492 Newly Diagnosed Diabetes (%) 3 (5.7) 3 (7.3) 0 (0) 0.267 Newly Diagnosed Hypertension (%) 2 (3.8) 2 (4.9) 0 (0) 0.368 Previous TB (%) 7 (13.2) 4 (9.8) 1 (11.1) 0.904 MDR (%) 3 (5.7) 3 (7.3) 0 (0) 0.267 IGRA positive (%) 35 (66.0) 29 (70.7) 5 (55.6) 0.625 Sputum smear (+) (%) 7 (13.2) 5 (12.2) 2 (22.2) 0.799 Sputum culture (+) (%) 11 (20.8) 8 (19.5) 3 (33.3) 0.644 Quality of life SGRQ score (median, IQR) 4.0 (0−9.5) 3.0 (0−6.0) 29.0 (13.0−36.5) < 0.001* CAT score (median, IQR) 8.0 (10.0−16.0) 10.0 (8.0−12.5) 22.0 (12.0−24.5) < 0.001* mMRC (median, IQR) 0 (0−1.0) 0 (0−1.0) 2.0 (1.5−3.0) < 0.001* Radiological score 1.5 (1.0−3.0) 1.5 (1.0−2.8) 5.8 (2.5−12.3) 0.008* Lung function parameters FEV1/FVC (%) 76.27 ± 12.04 80.31 ± 7.19 56.26 ± 9.23 — FEV1 (L) 2.97 ± 1.09 3.37 ± 0.85 1.65 ± 0.75 < 0.001* FEV1 % pred (%) 86.70 ± 21.65 95.35 ± 11.64 55.98 ± 25.50 < 0.001* FVC (L) 3.83 ± 1.16 4.20 ± 0.96 2.84 ± 0.98 < 0.001* FVC % pred (%) 94.23 ± 18.11 99.89 ± 10.40 78.31 ± 28.02 < 0.001* RV (L) 2.23 ± 0.95 2.15 ± 0.96 2.59 ± 0.90 0.211 TLC (L) 5.83 ± 1.39 6.10 ± 1.31 5.29 ± 1.46 0.111 TLC % pred (%) 97.37 ± 22.54 98.86 ± 20.78 91.12 ± 29.50 0.361 RV/TLC (%) 40.99 ± 21.83 39.09 ± 23.33 49.03 ± 11.56 0.223 DLCO % pred (%) 84.17 ± 18.92 85.31 ± 17.69 74.90 ± 23.92 0.162 Note. BMI, Body Mass Index; TB, tuberculosis; MDR, Multidrug Resistance; IGRA, Interferon Gamma Release Assay; SGRQ, St. George’s Respiratory Questionnaire; CAT, COPD Assessment Test; mMRC, modified Medical Research Council; The definition of lung function parameters are consistent with the above mentioned; *P < 0.05. -
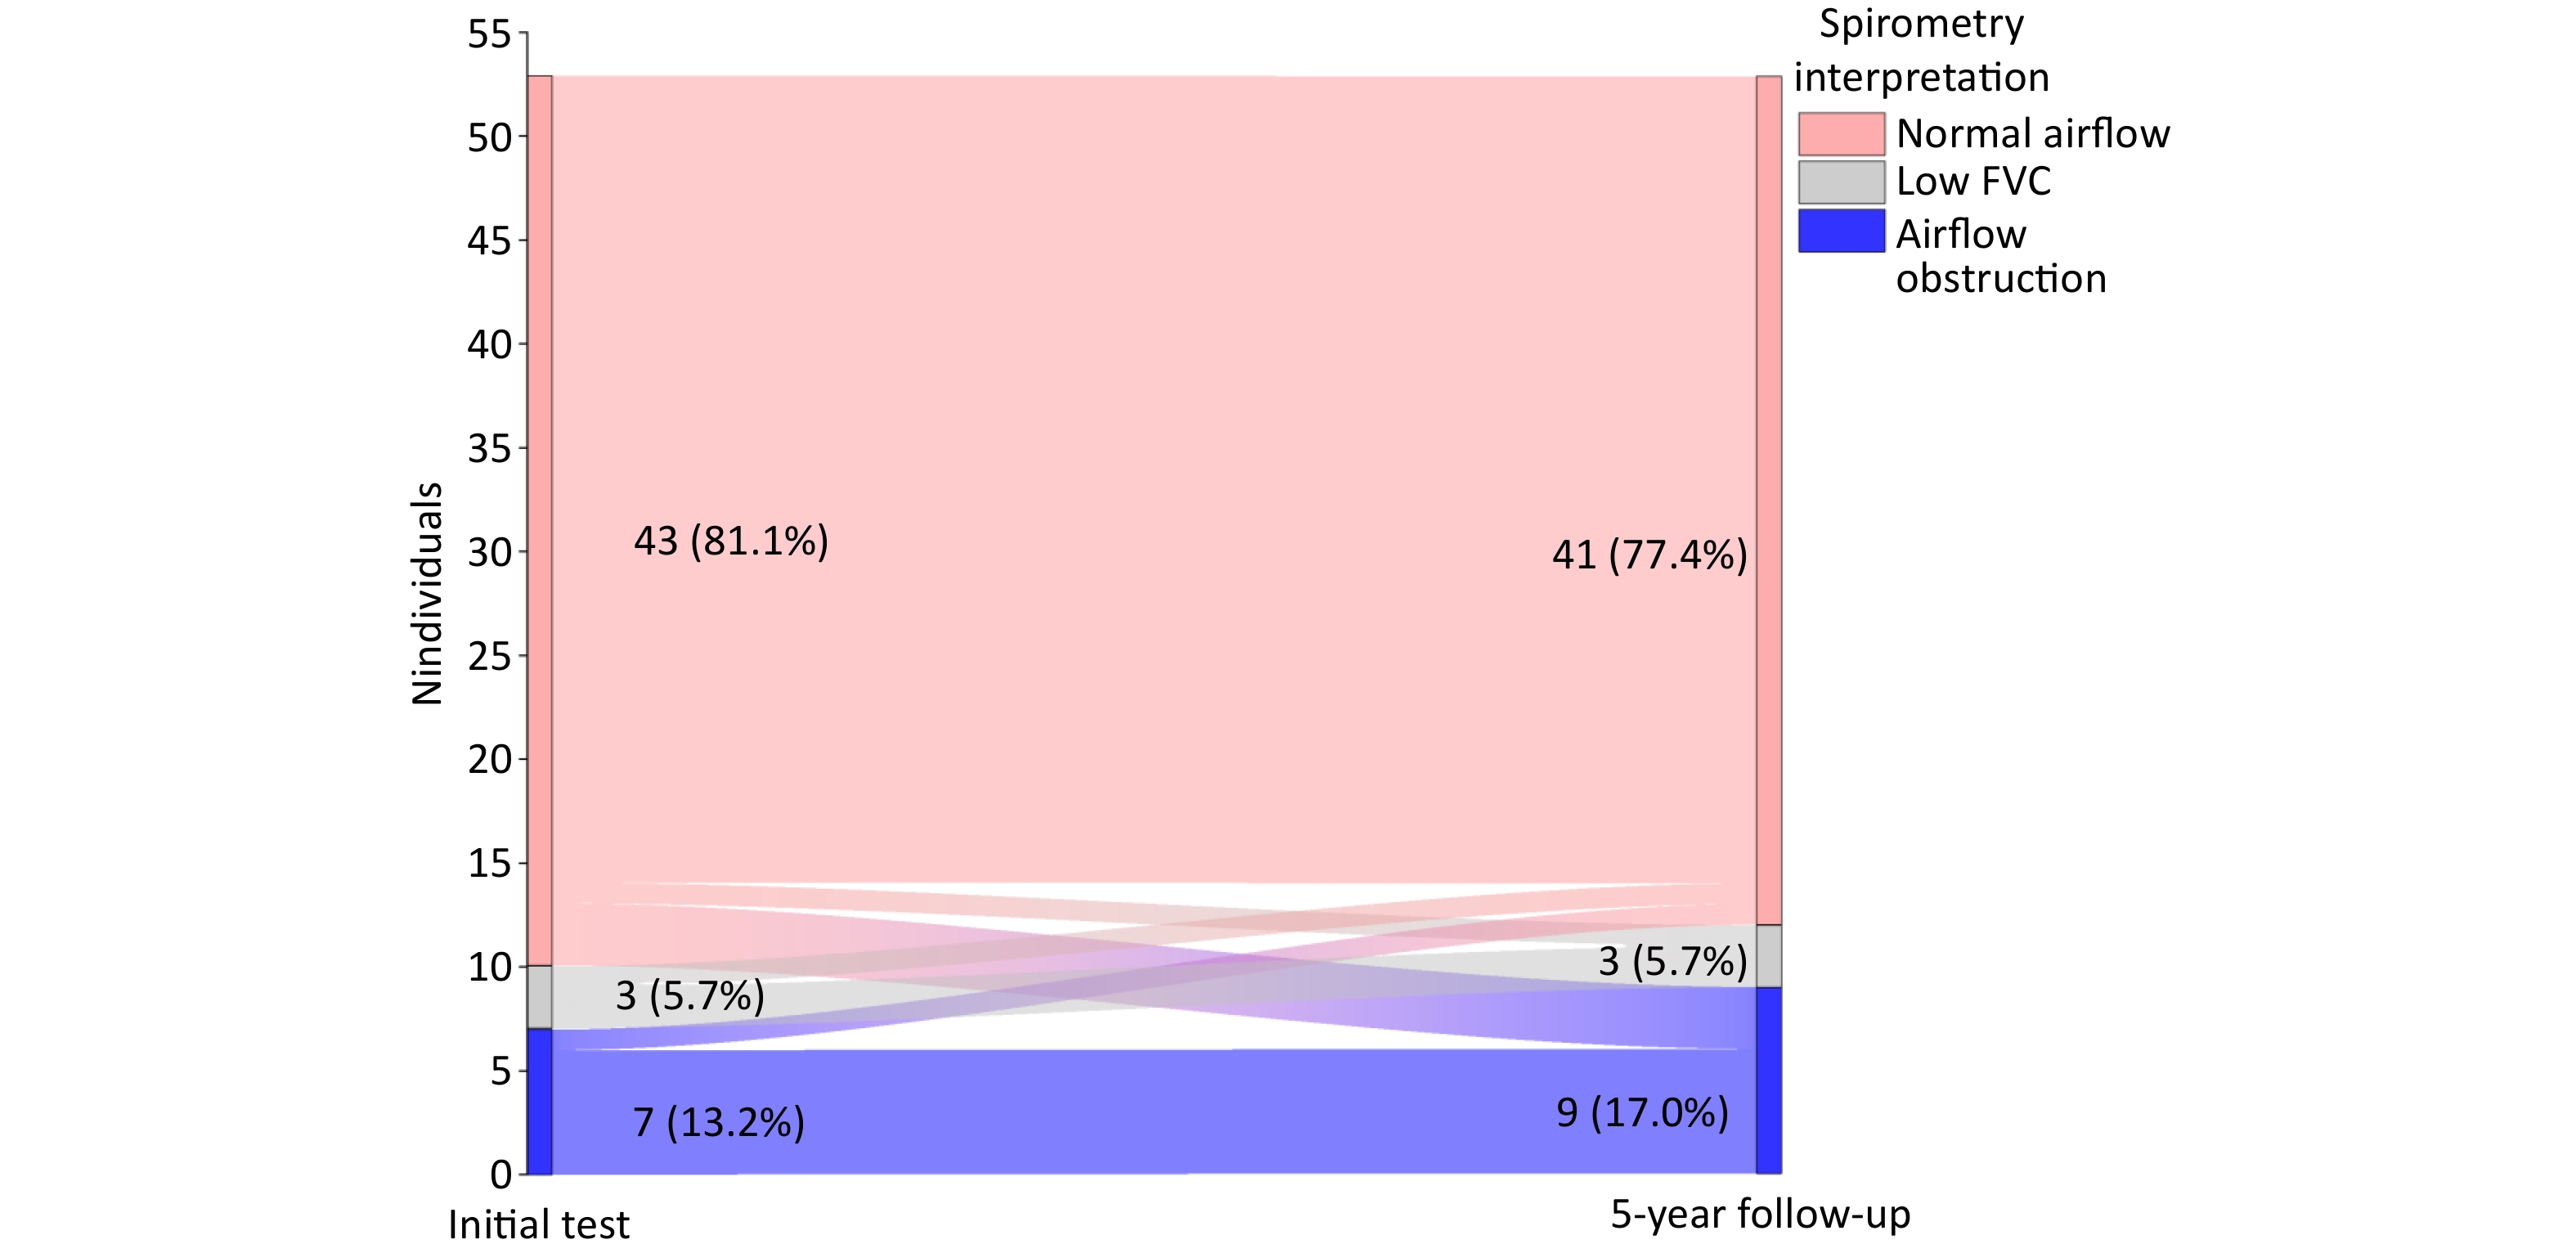
Over the 5-year period, the number of patients with normal airflow decreased from 43 to 41 cases, while those with airflow obstruction increased from 7 to 9 cases; the number with low FVC remained unchanged (n = 3). Four initially normal patients have developed dysfunction, 1 progressed to low FVC, 3 developed airflow obstruction, 1 patient each from low FVC and airflow obstruction groups normalized (Figure 2).
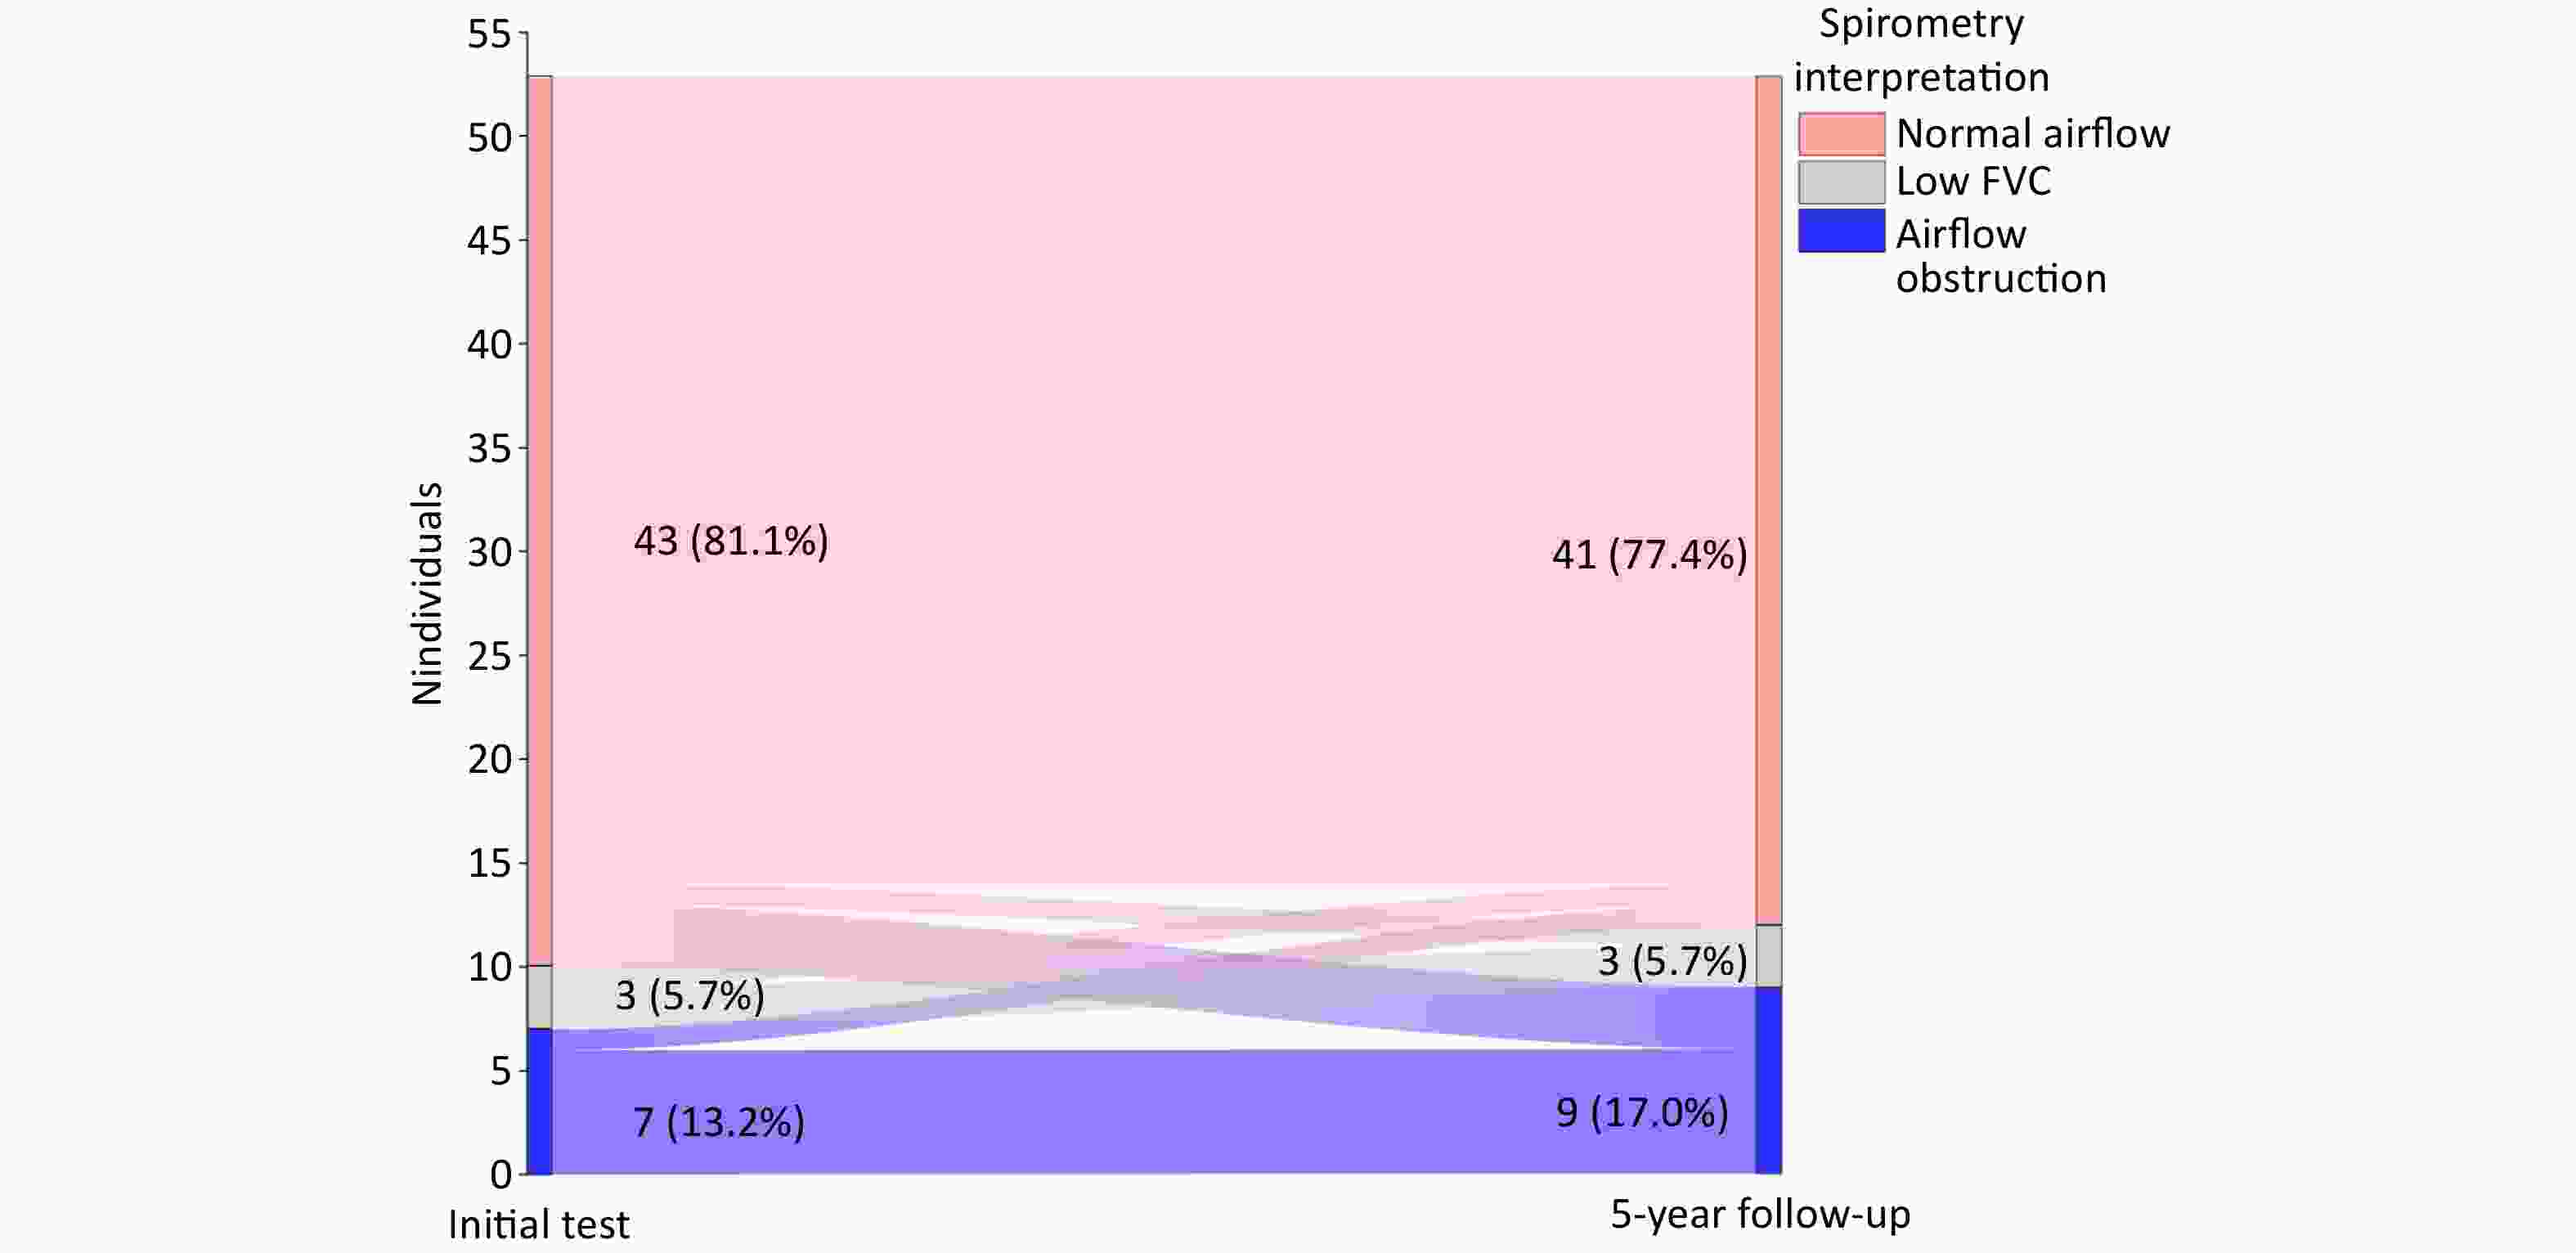
Figure 2. Sankey Plot Showing Change of Spirometry Pattern.
Lung airflow function analysis: Compared to baseline, there was a significant reduction in FEV1 (2.97L ± 1.09L vs. 3.06L ± 1.01L, P = 0.035), FVC % pred (94.23% ± 18.11% vs. 102.19% ± 18.93%, P = 0.029) and FEV1/FVC Ratio (76.27% ± 12.04% vs. 80.23%±11.02%, P < 0.001), with a non-significant increase in FVC (3.83L ± 1.16L vs. 3.76L ± 1.03L, P = 0.107) (Figure 3A-C).
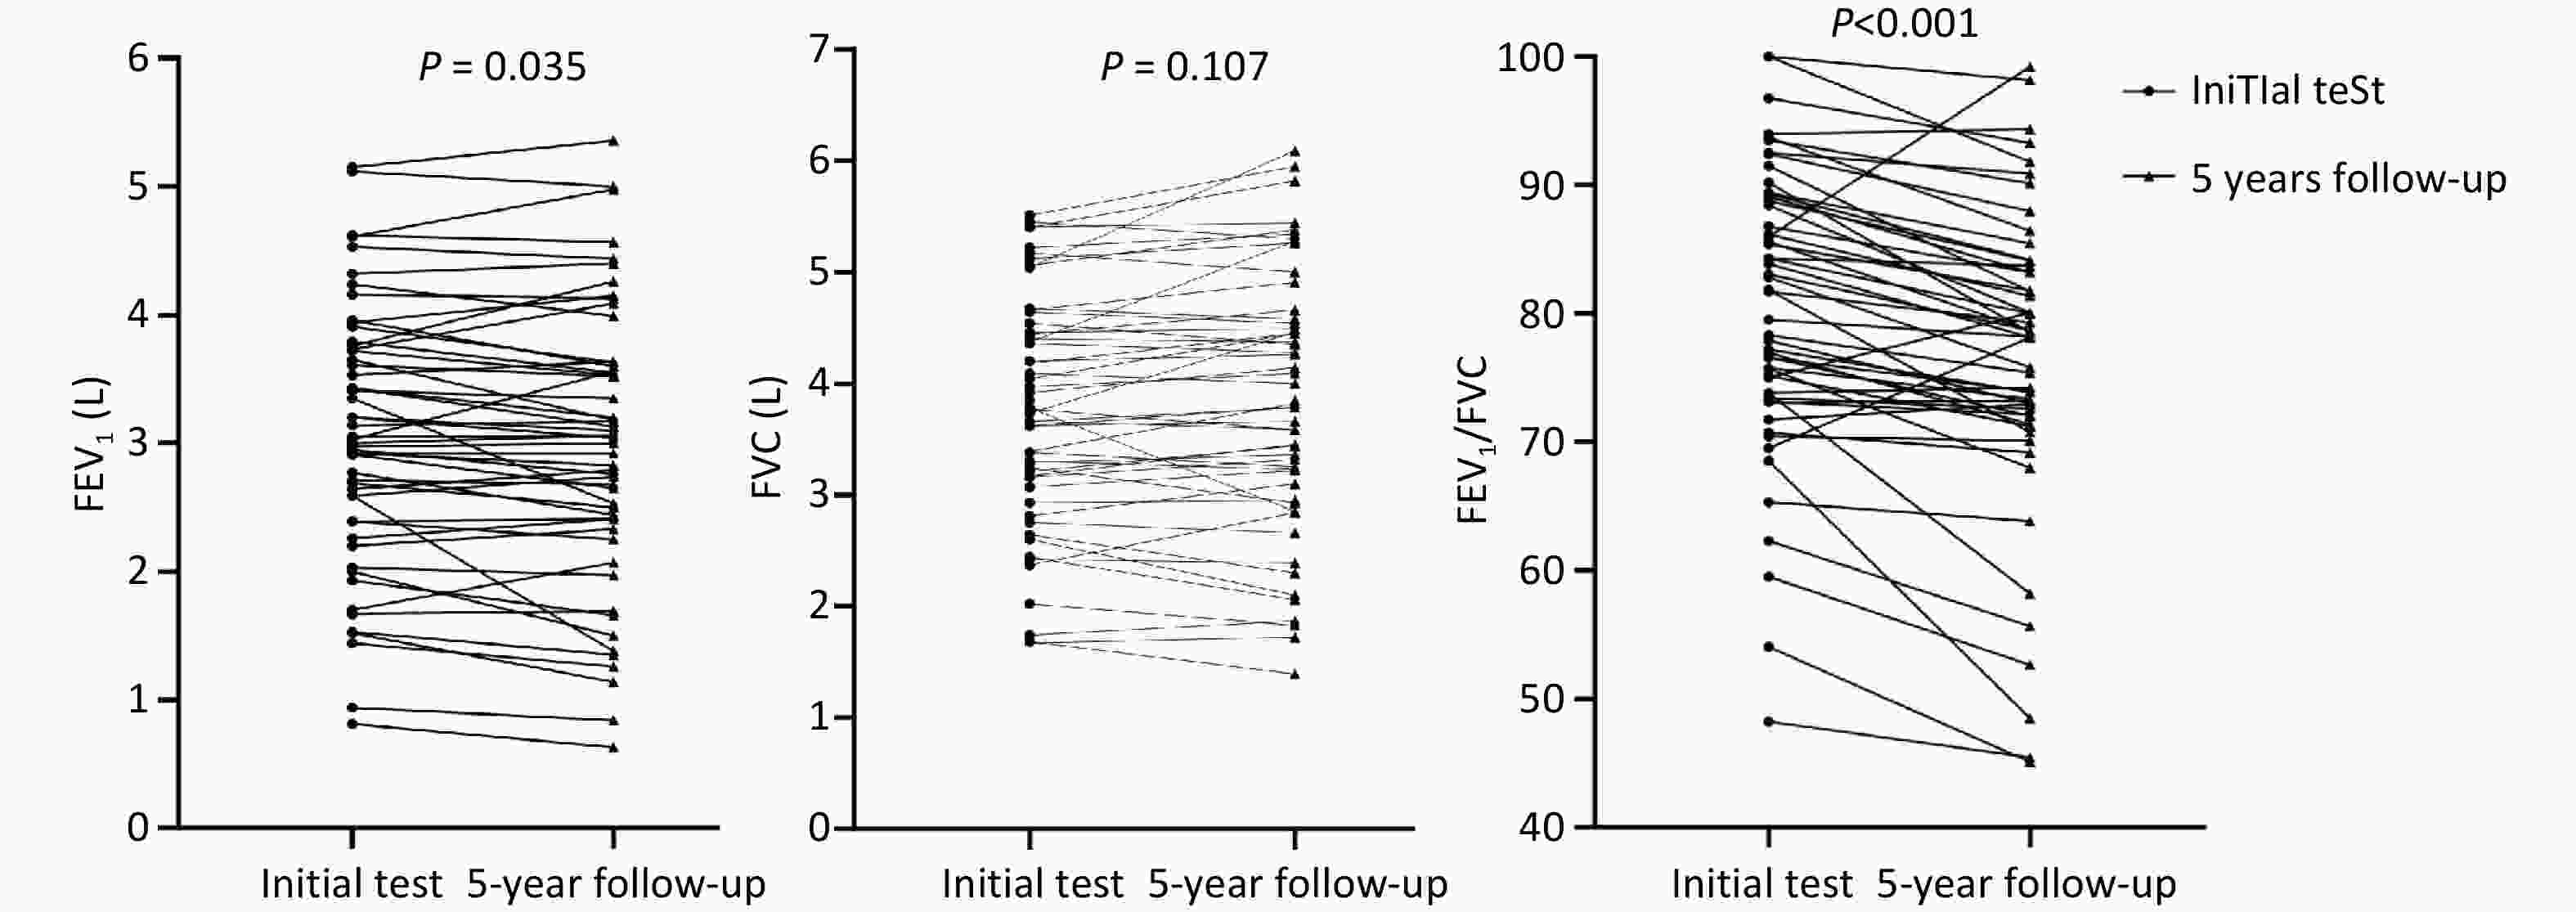
Figure 3. (A) Comparison of FEV1 Initial Test and 5-year follow-up. (B) Comparison of FVC Initial Test and 5-year follow-up. (C) Comparison of FEV1/FVC Initial Test and 5-year follow-up.
Lung volume analysis: RV significantly decreased (2.23L ± 0.93L vs. 2.79L ± 1.16L, P = 0.001), and TLC % pred decreased significantly (96.64% ± 22.22% vs. 119.81% ± 20.04%, P < 0.001).
Small airway function: A marked improvement in small airway function was observed, particularly in FEF75 % pred (75.54% ± 30.97% vs. 49.46% ± 23.39%, P < 0.001) (Table 2).
-
At baseline, 34 (64.2%) patients exhibited reduced DLCO. The low DLCO group had significantly lower FEV1/FVC (77.81% ± 11.42% vs. 84.57% ± 8.99%, P = 0.031).
At the 5-year follow-up, 14 (26.4%) patients maintained reduced DLCO impairment. Patients with persistent DLCO impairment had significantly lower absolute FVC values (3.33L ± 1.07L vs. 4.04L ± 1.08L, P = 0.042), but not lower FEV1/FVC Ratio (Supplementary Table S3). Overall, DLCO% pred improved over the 5 years (84.17% ± 18.92% vs. 75.84% ± 26.94%, P = 0.014) (Table 2).
-
Across the three time points, the airflow obstruction group consistently showed significantly higher radiological score compared to the normal airflow group. At the 5-year follow-up, the airflow obstruction group had greater extent of emphysema, bronchiectasis, and mosaic attenuation (all P < 0.05). In the airflow obstruction group, 100% of patients had bilateral disease at baseline and 83.3% had bilateral disease at 5-year follow-up, compared with 46.6% (P = 0.023) and 43.8% (P = 0.136) in the normal airflow group, respectively (Supplementary Tables S4–6). Additionally, we compared radiological scores between small airway dysfunction and normal small airway function groups at the 5-year follow-up. The results revealed that small airway dysfunction group had greater extent of emphysema, micronodules, mosaic attenuation and radiological score (Supplementary Table S7).
-
Univariable logistic regression identified age (OR: 1.079, 95% CI: 1.019–1.142, P = 0.009) , and radiological score (OR: 1.445, 95% CI: 1.063–1.966, P = 0.019) at 5-year follow-up were associated with airflow obstruction. However, these associatations were no longer significant on multivariable analysis (Table 4). Additionally, when patients were stratified by the median age and the median radiological score at 5-year follow-up, the older age and high radiological score groups exhibited significantly worse lung function compared to the younger age and low radiological score groups (Supplementary Tables S8-9).
Table 4. Univariable and multivariable analyses of factors influencing airflow obstruction at 5-year follow-up
Items Univariable analysis Multivariable analysis OR (95% CI) P value aOR (95% CI) P value Basic characteristics Age (years) 1.079 (1.019−1.142) 0.009* 1.099 (0.986−1.225) 0.088 Sex 0.929 (0.200−4.306) 0.925 0.789 (0.029−21.701) 0.889 BMI (kg/m2) 1.086 (0.838−1.407) 0.533 0.725 (0.425−1.237) 0.238 Smoking history 1.543 (0.357−6.675) 0.562 0.371 (0.002−66.581) 0.708 Previous TB 1.156 (0.114−11.774) 0.902 0.487 (0.004−65.859) 0.774 MDR — 0.999 — 0.999 Radiological score 1.445 (1.063−1.966) 0.019* 1.539 (0.869−2.724) 0.139 Note. BMI, Body Mass Index; TB, tuberculosis; MDR, Multidrug Resistance; *P < 0.05. -
At the 5-year follow-up, the 9 patients with airflow obstruction had a mean age of 54.7 ± 13.5 years, including 6 males. Among them, four (all male) had a smoking history, with a median smoking exposure of 35.0 pack-years (IQR: 26.3-62.5). The mean FEV1/FVC ratio was 56.26% ± 9.23%, with mean FEV1 and FVC of 1.65L ± 0.75L, and 2.84L ± 0.98L, respectively. Chest CT imaging of these 9 patients revealed a variety of abnormalities: one female patient with a destroyed left lung and underwent lobectomy, and one male patient with a long-term history of coal dust exposure, presenting typical pneumoconiotic micronodular lesions (Cases 8-9). The remaining 7 cases predominantly exhibited imaging features such as air trapping, emphysema, and small airway disease. Three non-smoking middle-aged patients (Cases 1-3) primarily exhibited significant air trapping on chest CT without other notable abnormalities, suggesting that their airflow obstruction was mainly caused by small airway disease secondary to TB. Meanwhile, the other four older patients with long-term smoking histories (Cases 4-7) showed coexisting emphysema and small airway disease on imaging, indicating that their airflow obstruction likely resulted from the combined effects of smoking and prior TB infection. Representative chest CT images of a middle-aged non-smoking female (Case 1) and an older smoking male (Case 4) are presented in Figure 4. Notably, four of these patients (aged < 60 years) maintained persistent airflow obstruction over the 5-year follow-up period (Table 5).
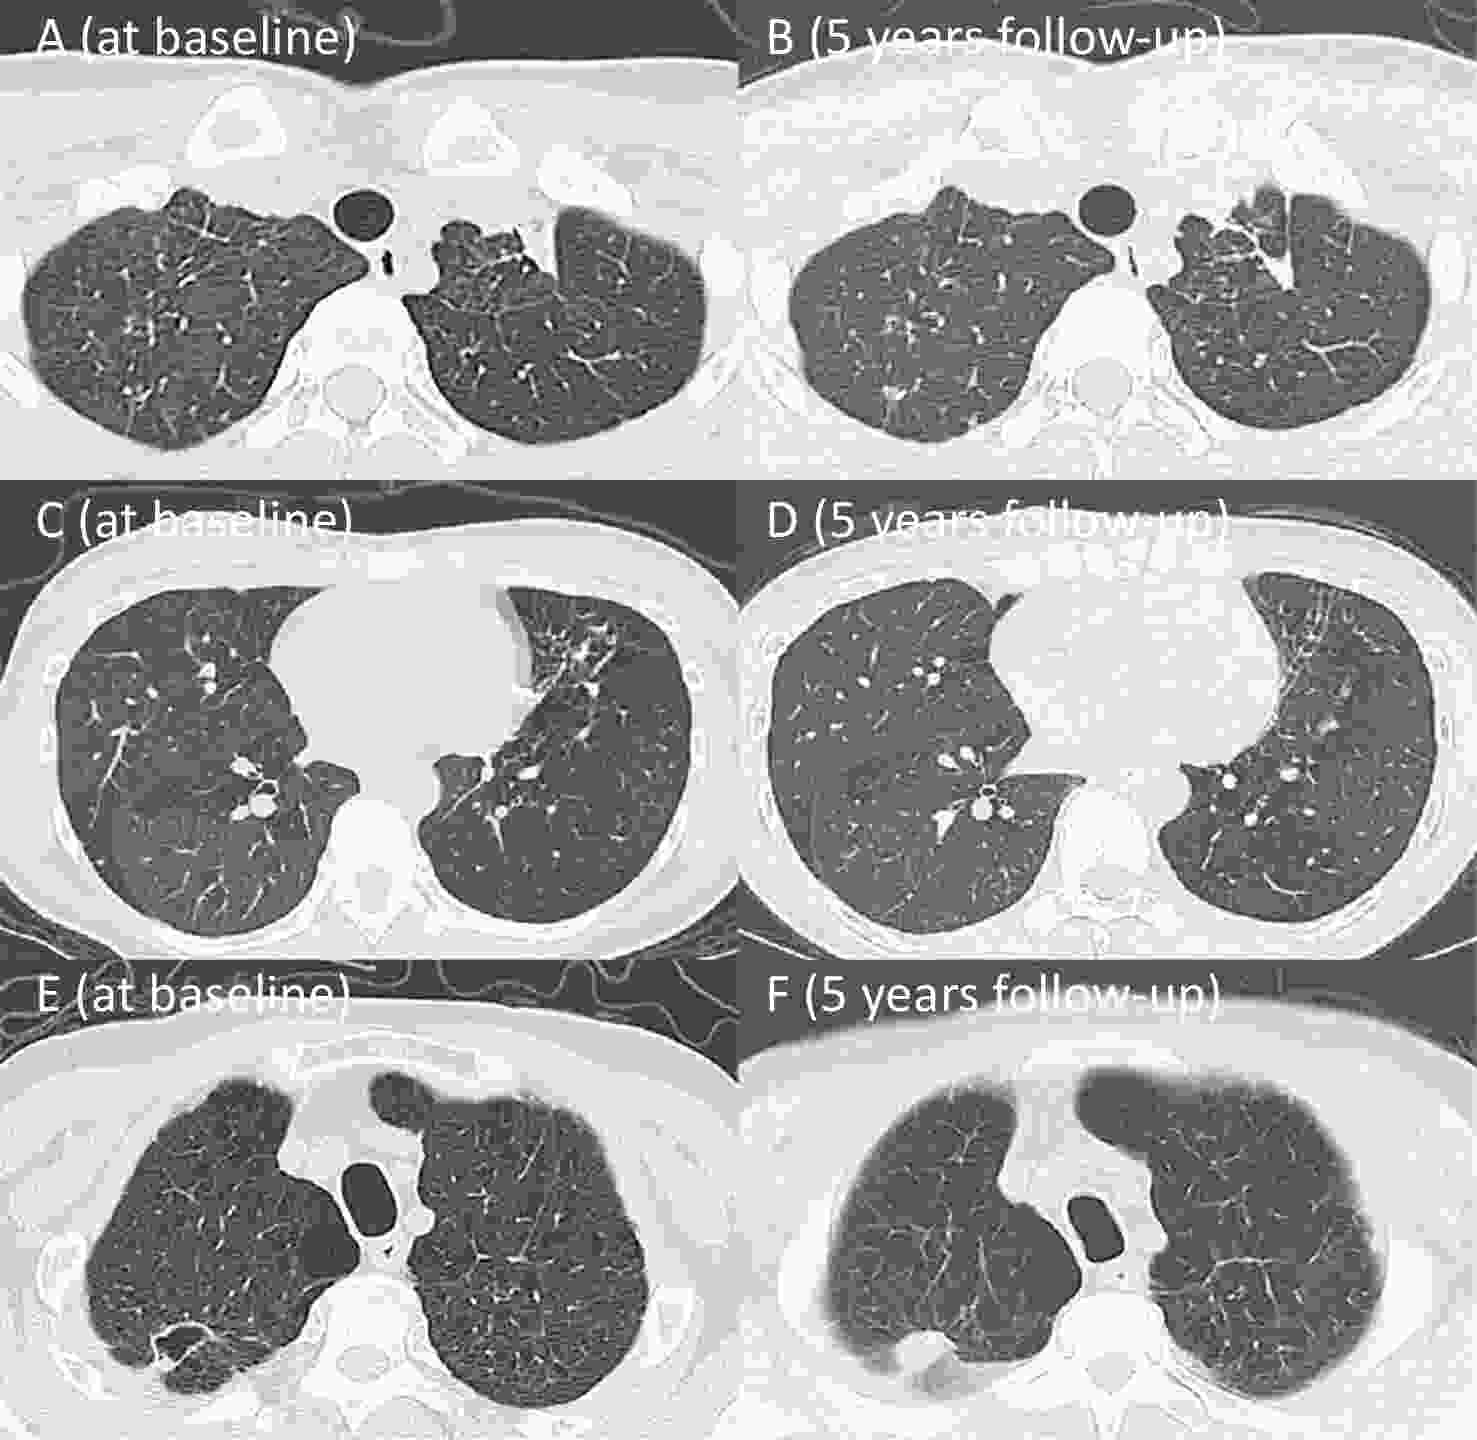
Figure 4. (A-F). Two Representative Cases of Airflow Obstruction: Non-Smoker and Smoker.
Table 5. Baseline characteristics and clinical features of 9 patients with airflow obstruction
Number of patients Sex Age (years) Pack-
years of smokingPrevious
TBFEV1(L)
(Initial test /5-year follow-up)FVC(L)
(Initial test /5-year follow-up)FEV1 /FVC(%)
(Initial test /5-year follow-up)DLCO % pred(%)
(Initial test /5-year follow-up)Radiological
score
(Initial test /Treatment completion/5-year follow-up)TB-COPD
(Yes/No)Case 1 female 37 0 No 1.44/1.26 2.42/2.39 59.50/52.63 69.90/73.50 5.0/3.5/3.0 Yes Case 2 female 39 0 No 2.77/2.44 3.66/3.59 75.68/67.96 45.40/110.10 0.5/0.7/0.7 Yes Case 3 male 47 0 No 2.39/2.41 3.66/3.78 65.30/63.81 75.80/66.40 8.0/3.0/1.0 Yes Case 4 male 63 70 No 0.94/0.84 1.74/1.87 54.02/45.08 22.90/26.40 4.0/3.0/3.6 Yes Case 5 male 75 25 No 2.39/2.25 3.38/3.25 70.71/69.15 57.90/83.30 10.0/7.5/8.0 Yes Case 6 male 69 40 No 3.35/2.53 4.54/4.35 73.78/58.19 70.70/68.40 3.5/0.5/0.5 Yes Case 7 male 63 30 No 2.59/1.38 3.78/2.85 68.51/48.45 60.20/84.80 16.5/11.0/11.0 Yes Case 8 female 46 0 Yes 0.81/0.63 1.68/1.39 48.21/45.40 49.10/— 12.0/10.0/10.0 No Case 9 male 53 0 No 1.52/1.14 2.44/2.06 62.29/55.64 77.60/86.30 16.5/18.0/19.0 No Note. TB, tuberculosis; TB-COPD, tuberculosis-associated chronic obstructive pulmonary disease; The definition of lung function parameters are consistent with the above mentioned; Case 8 had missing DLCO. Case 1: A female patient with no smoking history was diagnosed with pulmonary TB at 30 years of age. Initial chest CT demonstrated multiple patchy opacities with diffuse mosaic attenuation in both lungs. Lung function test revealed airflow obstruction, with FEV1 % pred of 50.20%, FEV1/FVC ratio of 59.50%, and DLCO % pred of 69.90%. At the 5-year follow-up, chest CT demonstrated scattered residual fibrocalcific nodules in both lungs, with no significant improvement in the diffuse mosaic attenuation. Lung function showed a decline in FEV1 % pred to 46.4%, and FEV1/FVC ratio to 52.63% (A-D).
Case 4: A male patient with a 67 pack-year smoking history was diagnosed with pulmonary TB at the age of 56. Initial chest CT revealed a cavitary lesion in the right upper lobe accompanied by bilateral emphysema. Lung function tests demonstrated airflow obstruction, with FEV1 % pred of 29.70%, FEV1/FVC ratio of 54.02%, and DLCO % pred of 22.90%. At the 5-year follow-up, the cavity had resolved, but bilateral emphysema remained. Lung function further declined, with FEV1 % pred of 26.20%, FEV1/FVC ratio of 45.08% (E-F).
-
This prospective cohort study represents the first long-term follow-up of TB patients in China over 5-year period, using post-TB treatment lung function at the 5-year mark as the primary outcome[4]. At baseline, during active TB, 13.2% (7/53) of patients exhibited airflow obstruction, a proportion comparable to the 14.2% (52/365) reported in Malawi[11]. However, at the 5-year follow-up, the proportion of patients with airflow obstruction increased to 17.0% (9/53). This study highlights that, even after receiving standardized, full-course anti-TB treatment, TB patients showed no significant improvement in lung function over the long-term. Furthermore, among the nine patients presenting with airflow obstruction at the 5-year follow-up, seven met the clinical criteria for TB-COPD[8,15,17]. Notably, four of these patients were under 60 years old, and exhibited persistent airflow obstruction throughout the 5-year period, warranting heightened clinical attention.
Studies have indicated that up to 50% of TB patients continue to exhibit some form of persistent lung dysfunction after completing treatment[26]. A recent retrospective cohort study from South Korea in 2025 evaluated lung function in 351 individuals with prior pulmonary TB, demonstrating that 20.2% developed COPD during follow-up, a progression rate comparable to our observed results[27]. Small airway dysfunction, characterized by premature airway closure, air trapping, airflow limitation, and regional ventilation heterogeneity, is considered a key pathophysiological feature of TB-COPD[28]. A prior case report documented a 23-year-old non-smoking male TB patient who developed severe chronic airflow limitation. Pathological examination revealed only residual TB lesions in the bilateral upper lobes, but pathological examination confirmed granulomatous inflammation in multiple lung areas, predominantly around small bronchovascular bundles, along with significant perilesional fibrosis[29]. The aforementioned cross-sectional study from China found that 48.9% of patients with a TB history had small airway dysfunction—significantly higher than those without prior TB—further supporting the link between TB and small airway disease[16]. A 2023 study from South Korea reported that 13.4% of TB patients exhibited airflow obstruction on spirometry post-treatment, despite no detectable residual lesions on CXR, suggesting that small airway and microvascular pathology are often undetectable by CXR, and may underlie functional impairment[30]. Thus, while imaging is important for evaluating PTLD, lung function provides essential complementary information that imaging alone cannot capture[31].
Previous studies have shown that TB patients who are older, long-term smokers, have severe/extensive lesions, receive irregular treatment, or experience recurrent infections are more prone to lung function decline[21,31-33]. In our study, the nine patients with airflow obstruction were older and had greater smoking exposure than those with normal airflow function, which suggests that age and smoking are significant contributing factors to airflow obstruction[34]. Although Multivariable analysis did not identify age, smoking history, or radiological score as independent risk factors, this may be related to the small sample size. A recent meta-analysis reported that drug-sensitive TB patients had significantly higher FVC and FEV1 post-treatment compared to drug-resistant TB[15]. In our cohort, only 3 patients had drug-resistant TB, yet their lung function remained normal throughout treatment and follow-up. This may be attributed to their younger age (< 50 years), male sex, limited lesion extent, absence of cavitary lesions, and the small sample size of drug-resistant cases, which may limit the conclusions of this observation. Additionally, 64.2% of patients in our study exhibited reduced diffusing capacity during the stable phase of anti-TB treatment, aligning with prior reports (62.2%)[35]. Mechanistically, TB infection triggers granulomatous inflammation and fibrotic repair. Post-TB pulmonary fibrosis can thicken alveolar walls, disrupt alveolar structure, and reduce the effective surface area for gas-exchange, thereby impairing diffusing capacity. Vascular inflammation or alveolar destruction may further contribute to the loss of diffusion surface area, exacerbating the dysfunction[35,36].
-
This study has several limitations: First, the study has a relatively high loss to follow-up over the 5-year period. Due to the COVID-19 pandemic, many patients were unable to undergo pulmonary function testing as scheduled, which also affected follow-up in the later stages of the study, potentially compromising statistical power. Nevertheless, there were no significant differences in baseline characteristics—including sex, age, radiological score, and lung function—between the 53 patients who completed follow-up and those lost to follow-up, suggesting that the follow-up group remained representative of the overall cohort. Second, the study enrolled outpatients with relatively mild TB. We speculate that hospitalized TB patients might exhibit a higher prevalence of airflow obstruction, which may not reflect the higher prevalence in hospitalized cohorts of airflow obstruction compared to hospitalized patients. Third, as a single-center study, these results may lack generalizability.
-
In summary, this study demonstrates that pulmonary TB patients show no significant improvement in overall lung function during 5-year follow-up following the completion of anti-TB treatment. The initial test revealed that 13.2% of patients presented with airflow obstruction. By the 5-year follow-up, this proportion had increased to 17.0%, with most cases attributable to TB-COPD. Notably, the development of airflow obstruction in young-to-middle-aged individuals highlights the need for greater clinical awareness. These findings underscore the importance of long-term monitoring for TB patients and support the routine assessment of lung function to enable early detection and intervention of pulmonary impairment. Future studies with expanded sample sizes will be conducted to further validate these findings.
doi: 10.3967/bes2025.121
Airflow Obstruction in Post-Tuberculosis Lung Disease: A 5- Year Prospective Cohort Study
-
Abstract:
Objective Post tuberculosis lung disease (PTLD) manifests in various forms, including tuberculosis-associated chronic obstructive pulmonary disease (TB-COPD), yet the clinical features of PTLD remain undercharacterized. This study aimed to assess longitudinal changes in lung function over a 5-year period and to identify predictors of airflow obstruction in a cohort of patients treated for active pulmonary TB. Methods Patients with active pulmonary TB were enrolled in this study and were followed during treatment, at treatment completion and five years post-treatment. Assessments included lung function and chest CT, analyzing longitudinal trends and airflow obstruction risk factors. Results Among 53 patients (mean age 36.9 ± 13.9 years; 64.2% male), 7 patients (13.2%) exhibited airflow obstruction. At the 5-year follow-up, the mean FEV1/FVC declined significantly (76.27% ± 12.04% vs. 80.23% ± 11.02%, P < 0.001) and 9 patients (17.0%) exhibited airflow obstruction. Seven of these patients predominantly showed air trapping consistent with small airway disease on chest CT, aligning with TB-COPD phenotype. Notably, four young-to-middle-aged patients (< 60 years old) had persistent obstruction over the five years. Conclusion The initial test revealed that 13.2% of patients presented with airflow obstruction. By the 5-year follow-up, this proportion had increased to 17.0%, with most cases demonstrating imaging findings aligning with TB-COPD, even among younger, non-smoking individuals. These findings emphasize the importance of long-term follow-up and routine lung function assessments in TB survivors. -
Key words:
- Post tuberculosis /
- TB-associated COPD /
- Lung function /
- Airflow obstruction /
- Chest CT
There are no conflicts of interest to declare.
&These authors contributed equally to this work.
注释:1) Authors’ Contributions: 2) Competing Interests: -
Figure 3. (A) Comparison of FEV1 Initial Test and 5-year follow-up. (B) Comparison of FVC Initial Test and 5-year follow-up. (C) Comparison of FEV1/FVC Initial Test and 5-year follow-up.
Figure 4. (A-F). Two Representative Cases of Airflow Obstruction: Non-Smoker and Smoker.
Table 1. Baseline characteristics of patients with pulmonary TB at initial test
Items (n = 53) Baseline characteristic Male (%) 34 (64.2) Age (years) 36.9 ± 13.9 BMI (kg/m2) 21.41 ± 2.79 Smoking status Never smoker (%) 35 (66.0) Smoker (%) 18 (34.0) Pack-years of smoking for all patients (median, IQR) 0 (0–3.3) Pack-years of smoking for smokers (median, IQR) 7.4 (2.3–35.0) Occupational dust exposure (%) 1 (0.6) Comorbidities Diabetes (%) 2 (3.8) Hypertension (%) 5 (9.4) Previous TB (%) 7 (13.2) MDR (%) 3 (5.7) IGRA positive (%) 35 (66.0) Sputum smear (+) (%) 7 (13.2) Sputum culture (+) (%) 11 (20.8) Radiological score (median, IQR) 4.0 (2.8-6.3) Note. BMI, Body Mass Index; TB, tuberculosis; MDR, Multidrug Resistance; IGRA, Interferon Gamma Release Assay.  下载: 导出CSV
Table 2. Longitudinal lung function changes in patients over 5 years
Parameters Initial test (n = 53) 5-year follow-up (n = 53) Mean difference (95% CI) P value Spirometry FEV1 (L) 3.06 ± 1.01 2.97 ± 1.09 −0.09 (−0.17,−0.01) 0.035* FEV1 % pred (%) 88.36 ± 20.28 86.70 ± 21.65 −1.66 (−9.75,6.42) 0.684 FVC (L) 3.76 ± 1.03 3.83 ± 1.16 0.07 (−0.02,0.16) 0.107 FVC % pred (%) 102.19 ± 18.93 94.23 ± 18.11 −7.97 (−15.10,0.83) 0.029* FEV1/FVC (%) 80.23 ± 11.02 76.27 ± 12.04 −3.97 (−5.38,−2.55) < 0.001* FEF25−75 % pred (%) 63.70 ± 25.12 64.16 ± 28.80 0.46 (−3.51,4.44) 0.816 FEF50 % pred (%) 58.91 ± 22.70 68.25 ± 31.18 9.33 (−1.21,19.88) 0.082 FEF75 % pred (%) 49.46 ± 23.39 75.54 ± 30.97 26.08 (15.43−36.72) < 0.001* Plethysmography TLC (L) 6.42 ± 1.63 7.61 ± 12.66 1.19 (−2.29,4.67) 0.504 TLC % pred (%) 119.81 ± 20.04 96.64 ± 22.22 −23.17 (−31.43,−14.91) < 0.001* RV (L) 2.79 ± 1.16 2.23 ± 0.93 −0.56 (−0.97,−0.15) 0.001* RV/TLC (%) 42.65 ± 10.39 41.68 ± 21.37 −0.97 (−7.48,5.53) 0.728 Diffusion capacity DLCO % pred (%) 75.84 ± 26.94 84.17 ± 18.92 9.24 (1.97,16.50) 0.014* Note. FEV1, forced expiratory volume in 1 second; FVC, forced vital capacity; FEF25−75, forced expiratory flow at 25%−75%; FEF50, forced expiratory flow at 50%; FEF75, forced expiratory flow at 75%; TLC, total lung capacity; RV, residual volume; DLCO, diffusing capacity of the lungs for carbon monoxide; % pred, % predicted; *P < 0.05.
下载: 导出CSV
Table 3. Comparison between normal airflow and airflow obstruction groups at 5-year follow-up
Items Total (n = 53) Normal airflow (n = 41) Airflow obstruction (n = 9) P value Male (%) 34 (64.2) 28 (68.3) 6 (66.7) 1.000 Age (years) 43.2 ± 13.8 40.1 ± 12.7 54.7 ± 13.5 0.003* BMI (kg/m2) 22.00 ± 2.95 21.97 ± 2.92 22.64 ± 3.11 0.541 Smoking history (%) 18 (34.0) 14 (34.1) 4 (44.4) 0.842 pack−years of smoking 0 (0−5.5) 0 (0−4.5) 0 (0−35.0) 0.343 Diabetes history (%) 2 (3.8) 1 (2.4) 1 (11.1) 0.414 Hypertension history (%) 5 (9.4) 3 (7.3) 1 (11.1) 0.492 Newly Diagnosed Diabetes (%) 3 (5.7) 3 (7.3) 0 (0) 0.267 Newly Diagnosed Hypertension (%) 2 (3.8) 2 (4.9) 0 (0) 0.368 Previous TB (%) 7 (13.2) 4 (9.8) 1 (11.1) 0.904 MDR (%) 3 (5.7) 3 (7.3) 0 (0) 0.267 IGRA positive (%) 35 (66.0) 29 (70.7) 5 (55.6) 0.625 Sputum smear (+) (%) 7 (13.2) 5 (12.2) 2 (22.2) 0.799 Sputum culture (+) (%) 11 (20.8) 8 (19.5) 3 (33.3) 0.644 Quality of life SGRQ score (median, IQR) 4.0 (0−9.5) 3.0 (0−6.0) 29.0 (13.0−36.5) < 0.001* CAT score (median, IQR) 8.0 (10.0−16.0) 10.0 (8.0−12.5) 22.0 (12.0−24.5) < 0.001* mMRC (median, IQR) 0 (0−1.0) 0 (0−1.0) 2.0 (1.5−3.0) < 0.001* Radiological score 1.5 (1.0−3.0) 1.5 (1.0−2.8) 5.8 (2.5−12.3) 0.008* Lung function parameters FEV1/FVC (%) 76.27 ± 12.04 80.31 ± 7.19 56.26 ± 9.23 — FEV1 (L) 2.97 ± 1.09 3.37 ± 0.85 1.65 ± 0.75 < 0.001* FEV1 % pred (%) 86.70 ± 21.65 95.35 ± 11.64 55.98 ± 25.50 < 0.001* FVC (L) 3.83 ± 1.16 4.20 ± 0.96 2.84 ± 0.98 < 0.001* FVC % pred (%) 94.23 ± 18.11 99.89 ± 10.40 78.31 ± 28.02 < 0.001* RV (L) 2.23 ± 0.95 2.15 ± 0.96 2.59 ± 0.90 0.211 TLC (L) 5.83 ± 1.39 6.10 ± 1.31 5.29 ± 1.46 0.111 TLC % pred (%) 97.37 ± 22.54 98.86 ± 20.78 91.12 ± 29.50 0.361 RV/TLC (%) 40.99 ± 21.83 39.09 ± 23.33 49.03 ± 11.56 0.223 DLCO % pred (%) 84.17 ± 18.92 85.31 ± 17.69 74.90 ± 23.92 0.162 Note. BMI, Body Mass Index; TB, tuberculosis; MDR, Multidrug Resistance; IGRA, Interferon Gamma Release Assay; SGRQ, St. George’s Respiratory Questionnaire; CAT, COPD Assessment Test; mMRC, modified Medical Research Council; The definition of lung function parameters are consistent with the above mentioned; *P < 0.05.
下载: 导出CSV
Table 4. Univariable and multivariable analyses of factors influencing airflow obstruction at 5-year follow-up
Items Univariable analysis Multivariable analysis OR (95% CI) P value aOR (95% CI) P value Basic characteristics Age (years) 1.079 (1.019−1.142) 0.009* 1.099 (0.986−1.225) 0.088 Sex 0.929 (0.200−4.306) 0.925 0.789 (0.029−21.701) 0.889 BMI (kg/m2) 1.086 (0.838−1.407) 0.533 0.725 (0.425−1.237) 0.238 Smoking history 1.543 (0.357−6.675) 0.562 0.371 (0.002−66.581) 0.708 Previous TB 1.156 (0.114−11.774) 0.902 0.487 (0.004−65.859) 0.774 MDR — 0.999 — 0.999 Radiological score 1.445 (1.063−1.966) 0.019* 1.539 (0.869−2.724) 0.139 Note. BMI, Body Mass Index; TB, tuberculosis; MDR, Multidrug Resistance; *P < 0.05.
下载: 导出CSV
Table 5. Baseline characteristics and clinical features of 9 patients with airflow obstruction
Number of patients Sex Age (years) Pack-
years of smokingPrevious
TBFEV1(L)
(Initial test /5-year follow-up)FVC(L)
(Initial test /5-year follow-up)FEV1 /FVC(%)
(Initial test /5-year follow-up)DLCO % pred(%)
(Initial test /5-year follow-up)Radiological
score
(Initial test /Treatment completion/5-year follow-up)TB-COPD
(Yes/No)Case 1 female 37 0 No 1.44/1.26 2.42/2.39 59.50/52.63 69.90/73.50 5.0/3.5/3.0 Yes Case 2 female 39 0 No 2.77/2.44 3.66/3.59 75.68/67.96 45.40/110.10 0.5/0.7/0.7 Yes Case 3 male 47 0 No 2.39/2.41 3.66/3.78 65.30/63.81 75.80/66.40 8.0/3.0/1.0 Yes Case 4 male 63 70 No 0.94/0.84 1.74/1.87 54.02/45.08 22.90/26.40 4.0/3.0/3.6 Yes Case 5 male 75 25 No 2.39/2.25 3.38/3.25 70.71/69.15 57.90/83.30 10.0/7.5/8.0 Yes Case 6 male 69 40 No 3.35/2.53 4.54/4.35 73.78/58.19 70.70/68.40 3.5/0.5/0.5 Yes Case 7 male 63 30 No 2.59/1.38 3.78/2.85 68.51/48.45 60.20/84.80 16.5/11.0/11.0 Yes Case 8 female 46 0 Yes 0.81/0.63 1.68/1.39 48.21/45.40 49.10/— 12.0/10.0/10.0 No Case 9 male 53 0 No 1.52/1.14 2.44/2.06 62.29/55.64 77.60/86.30 16.5/18.0/19.0 No Note. TB, tuberculosis; TB-COPD, tuberculosis-associated chronic obstructive pulmonary disease; The definition of lung function parameters are consistent with the above mentioned; Case 8 had missing DLCO.
下载: 导出CSV
-
[1] Rahlwes KC, Dias BRS, Campos PC, et al. Pathogenicity and virulence of Mycobacterium tuberculosis. Virulence, 2023; 14, 2150449. doi: 10.1080/21505594.2022.2150449 [2] Houben RMGJ, Dodd PJ. The global burden of latent tuberculosis infection: a re-estimation using mathematical modelling. PLoS Med, 2016; 13, e1002152. doi: 10.1371/journal.pmed.1002152 [3] World Health Organization. Global tuberculosis report 2024. https://www.who.int/publications/i/item/9789240101531. [2024-10-29] [4] Malefane L, Maarman G. Post-tuberculosis lung disease and inflammatory role players: can we characterise the myriad inflammatory pathways involved to gain a better understanding? Chem Biol Interact, 2024; 387, 110817. [5] Singh S, Allwood BW, Chiyaka TL, et al. Immunologic and imaging signatures in post tuberculosis lung disease. Tuberculosis, 2022; 136, 102244. doi: 10.1016/j.tube.2022.102244 [6] Allwood BW, van der Zalm MM, Amaral AFS, et al. Post-tuberculosis lung health: perspectives from the First International Symposium. Int J Tuberc Lung Dis, 2020; 24, 820−8. doi: 10.5588/ijtld.20.0067 [7] Stek C, Allwood B, Walker NF, et al. The immune mechanisms of lung parenchymal damage in tuberculosis and the role of host-directed therapy. Front Microbiol, 2018; 9, 2603. doi: 10.3389/fmicb.2018.02603 [8] Gai XY, Allwood B, Sun YC. Post-tuberculosis lung disease and chronic obstructive pulmonary disease. Chin Med J (Engl), 2023; 136, 1923−8. doi: 10.1097/CM9.0000000000002771 [9] Meghji J, Auld SC, Bisson GP, et al. Post-tuberculosis lung disease: towards prevention, diagnosis, and care. Lancet Respir Med, 2025; 13, 460−72. doi: 10.1016/S2213-2600(24)00429-6 [10] Kotlyarov S, Oskin D. The role of inflammation in the pathogenesis of comorbidity of chronic obstructive pulmonary disease and pulmonary tuberculosis. Int J Mol Sci, 2025; 26, 2378. doi: 10.3390/ijms26062378 [11] Meghji J, Lesosky M, Joekes E, et al. Patient outcomes associated with post-tuberculosis lung damage in Malawi: a prospective cohort study. Thorax, 2020; 75, 269−78. doi: 10.1136/thoraxjnl-2019-213808 [12] Nightingale R, Chinoko B, Lesosky M, et al. Respiratory symptoms and lung function in patients treated for pulmonary tuberculosis in Malawi: a prospective cohort study. Thorax, 2022; 77, 1131−9. doi: 10.1136/thoraxjnl-2021-217190 [13] Global Initiative for Chronic Obstructive Lung Disease (GOLD). Global strategy for the diagnosis, management, and prevention of chronic obstructive pulmonary disease (2025 Report). https://goldcopd.org/2025-gold-report/. [2024-11-13] [14] Kamenar K, Hossen S, Gupte AN, et al. Previous tuberculosis disease as a risk factor for chronic obstructive pulmonary disease: a cross-sectional analysis of multicountry, population-based studies. Thorax, 2022; 77, 1088−97. doi: 10.1136/thoraxjnl-2020-216500 [15] Fan HH, Wu F, Liu J, et al. Pulmonary tuberculosis as a risk factor for chronic obstructive pulmonary disease: a systematic review and meta-analysis. Ann Transl Med, 2021; 9, 390. doi: 10.21037/atm-20-4576 [16] Xing ZZ, Sun TY, Janssens JP, et al. Airflow obstruction and small airway dysfunction following pulmonary tuberculosis: a cross-sectional survey. Thorax, 2023; 78, 274−80. doi: 10.1136/thoraxjnl-2021-218345 [17] Sheng ZK, Gai XY, Sun YC. Advances in the understanding of heterogeneous characteristics and comprehensive management of post-tuberculosis lung disease. Chin J Tuberc Respir Dis, 2025; 48, 181−5. (In Chinese) [18] Hicks A, Muthukumarasamy S, Maxwell D, et al. Chronic inactive pulmonary tuberculosis and treatment sequelae: chest radiographic features. Int J Tuberc Lung Dis, 2014; 18, 128−33. doi: 10.5588/ijtld.13.0360 [19] Chen RY, Yu X, Smith B, et al. Radiological and functional evidence of the bronchial spread of tuberculosis: an observational analysis. Lancet Microbe, 2021; 2, e518−26. doi: 10.1016/S2666-5247(21)00058-6 [20] Gai XY, Cao WL, Rao YF, et al. Risk factors and biomarkers for post-tuberculosis lung damage in a Chinese cohort of male smokers and non-smokers: protocol for a prospective observational study. BMJ Open, 2023; 13, e065990. doi: 10.1136/bmjopen-2022-065990 [21] Stanojevic S, Kaminsky DA, Miller MR, et al. ERS/ATS technical standard on interpretive strategies for routine lung function tests. Eur Respir J, 2022; 60, 2101499. doi: 10.1183/13993003.01499-2021 [22] Marion MS, Leonardson GR, Rhoades ER, et al. Spirometry reference values for American Indian adults: results from the Strong Heart Study. Chest, 2001; 120, 489−95. doi: 10.1378/chest.120.2.489 [23] Casarini M, Ameglio F, Alemanno L, et al. Cytokine levels correlate with a radiologic score in active pulmonary tuberculosis. Am J Respir Crit Care Med, 1999; 159, 143−8. doi: 10.1164/ajrccm.159.1.9803066 [24] Song QS, Guo XH, Zhang LL, et al. New approaches in the classification and prognosis of sign clusters on pulmonary CT images in patients with multidrug-resistant tuberculosis. Front Microbiol, 2021; 12, 714617. doi: 10.3389/fmicb.2021.714617 [25] Gai XY, Allwood B, Sun YC. Advances in the awareness of tuberculosis-associated chronic obstructive pulmonary disease. Chin Med J Pulm Crit Care Med, 2024; 2, 250−6. doi: 10.1016/j.pccm.2024.08.008 [26] Allwood BW, Byrne A, Meghji J, et al. Post-tuberculosis lung disease: clinical review of an under-recognised global challenge. Respiration, 2021; 100, 751−63. doi: 10.1159/000512531 [27] Joo DH, Kim MC, Sin S, et al. Incidence and risk factors of tuberculosis-associated chronic obstructive pulmonary disease. Int J Chron Obstruct Pulmon Dis, 2025; 20, 2091−102. doi: 10.2147/COPD.S523732 [28] Konstantinos Katsoulis K, Kostikas K, Kontakiotis T. Techniques for assessing small airways function: Possible applications in asthma and COPD. Respir Med, 2016; 119, e2−9. doi: 10.1016/j.rmed.2013.05.003 [29] Allwood BW, Rigby J, Griffith-Richards S, et al. Histologically confirmed tuberculosis-associated obstructive pulmonary disease. Int J Tuberc Lung Dis, 2019; 23, 552−4. doi: 10.5588/ijtld.18.0722 [30] Park HJ, Byun MK, Lee J, et al. Airflow obstruction and chronic obstructive pulmonary disease are common in pulmonary tuberculosis even without sequelae findings on chest X-ray. Infect Dis (Lond), 2023; 55, 533−42. doi: 10.1080/23744235.2023.2217904 [31] Lee JH, Chang JH. Lung function in patients with chronic airflow obstruction due to tuberculous destroyed lung. Respir Med, 2003; 97, 1237−42. doi: 10.1016/S0954-6111(03)00255-5 [32] Rao YF, Gai XY, Le YQ, et al. Enhanced proinflammatory cytokine production and immunometabolic impairment of NK cells exposed to Mycobacterium tuberculosis and cigarette smoke. Front Cell Infect Microbiol, 2022; 11, 799276. doi: 10.3389/fcimb.2021.799276 [33] Le YQ, Cao WL, Zhou L, et al. Infection of Mycobacterium tuberculosis promotes both M1/M2 polarization and MMP production in cigarette smoke-exposed macrophages. Front Immunol, 2020; 11, 1902. doi: 10.3389/fimmu.2020.01902 [34] Gajalakshmi V, Peto R, Kanaka TS, et al. Smoking and mortality from tuberculosis and other diseases in India: retrospective study of 43000 adult male deaths and 35000 controls. Lancet, 2003; 362, 507−15. doi: 10.1016/S0140-6736(03)14109-8 [35] Bansal N, Arunachala S, Kaleem Ullah M, et al. Unveiling silent consequences: impact of pulmonary tuberculosis on lung health and functional wellbeing after treatment. J Clin Med, 2024; 13, 4115. doi: 10.3390/jcm13144115 [36] Nishi MP, Mancuzo EV, Sulmonett N, et al. Pulmonary functional assessment: longitudinal study after treatment of pulmonary tuberculosis. Rev Inst Med Trop Sao Paulo, 2021; 63, e65. doi: 10.1590/s1678-9946202163065 -

 点击查看大图
计量
- 文章访问数: 21
- HTML全文浏览量: 8
- PDF下载量: 1
- 被引次数: 0

 Quick Links