

 下载:
下载:

-
Metabolic-associated fatty liver disease (MAFLD) is characterized by excessive fat accumulation in the liver and is primarily linked to metabolic dysregulation. It is often associated with obesity, type 2 diabetes, and dyslipidemia[1,2]. MAFLD can lead to inflammation, fibrosis, and even progression to cirrhosis or liver cancer if left untreated[3]. Its pathogenesis involves a complex interplay of genetic, environmental, and lifestyle factors. Over the past 30 years, the prevalence of MAFLD has increased, making it the most common chronic liver disease worldwide. According to data from 2024, approximately 5% of adults globally will be affected by MAFLD[4], and this figure is higher among overweight and obese populations[5]. Furthermore, growing evidence suggests that endocrine dysregulation, particularly thyroid dysfunction, plays a significant role in its pathogenesis[6].
Thyroid hormones are crucial for energy metabolism, and thyroid dysfunction is closely associated with various metabolic diseases. However, the relationship between thyroid hormones and metabolism is complex, and relying solely on indicators of thyroid function may be inadequate. For instance, studies have shown that even with adequate iodine nutrition, a key element in thyroid hormone synthesis, thyroid-stimulating hormone (TSH) levels can vary significantly owing to factors such as vitamin D status, body mass index (BMI), and regional differences[7]. Moreover, environmental exposure to certain trace elements has been linked to alterations in thyroid hormone levels and an increased risk of thyroid nodules, further illustrating the multifactorial nature of thyroid regulation[8,9]. Thyroid hormone sensitivity is a supplementary indicator of traditional thyroid function. It mainly includes central thyroid hormone sensitivity indicators, such as the thyroid-stimulating hormone index (TSHI) and thyrotrophic T4 resistance index (TT4RI), as well as peripheral sensitivity indicators, such as FT3/FT4[10,11]. In 2019, Spanish researchers led by Laclaustra reported that reduced thyroid hormone sensitivity might occur in individuals with normal thyroid function, characterized by the simultaneous presence of high FT4 and TSH levels. They proposed two new central thyroid hormone sensitivity indicators, the thyroid feedback quantile-based index (TFQI) and parametric thyroid feedback quantile-based index (PTFQI), to measure the degree of reduced thyroid hormone sensitivity[12].
This longitudinal cohort study aimed to systematically examine the relationship between thyroid hormone sensitivity and MAFLD. We hypothesized that thyroid hormone sensitivity, as indicated by specific sensitivity indices, may be an independent risk factor for MAFLD. The innovative aspect of this study is its focus on thyroid hormone sensitivity, an area that has not been well-studied in MAFLD research. Unlike previous cross-sectional studies, the present study used a longitudinal cohort design to explore the relationship between thyroid hormone sensitivity and MAFLD. This approach could help discover new biomarkers or pathways and improve the understanding and treatment of MAFLD. The triglyceride-glucose (TyG) index, which is widely used as a surrogate marker for insulin resistance, has been increasingly associated with the risk of metabolic disorders, including MAFLD. However, whether the TyG index serves as a mediator linking thyroid hormone sensitivity to MAFLD remains unclear. Elucidating this possible mediating mechanism could provide important insights into how insulin resistance, as estimated using the TyG index, contributes to MAFLD pathogenesis in individuals with thyroid dysfunction, thereby highlighting a potential pathway for intervention.
-
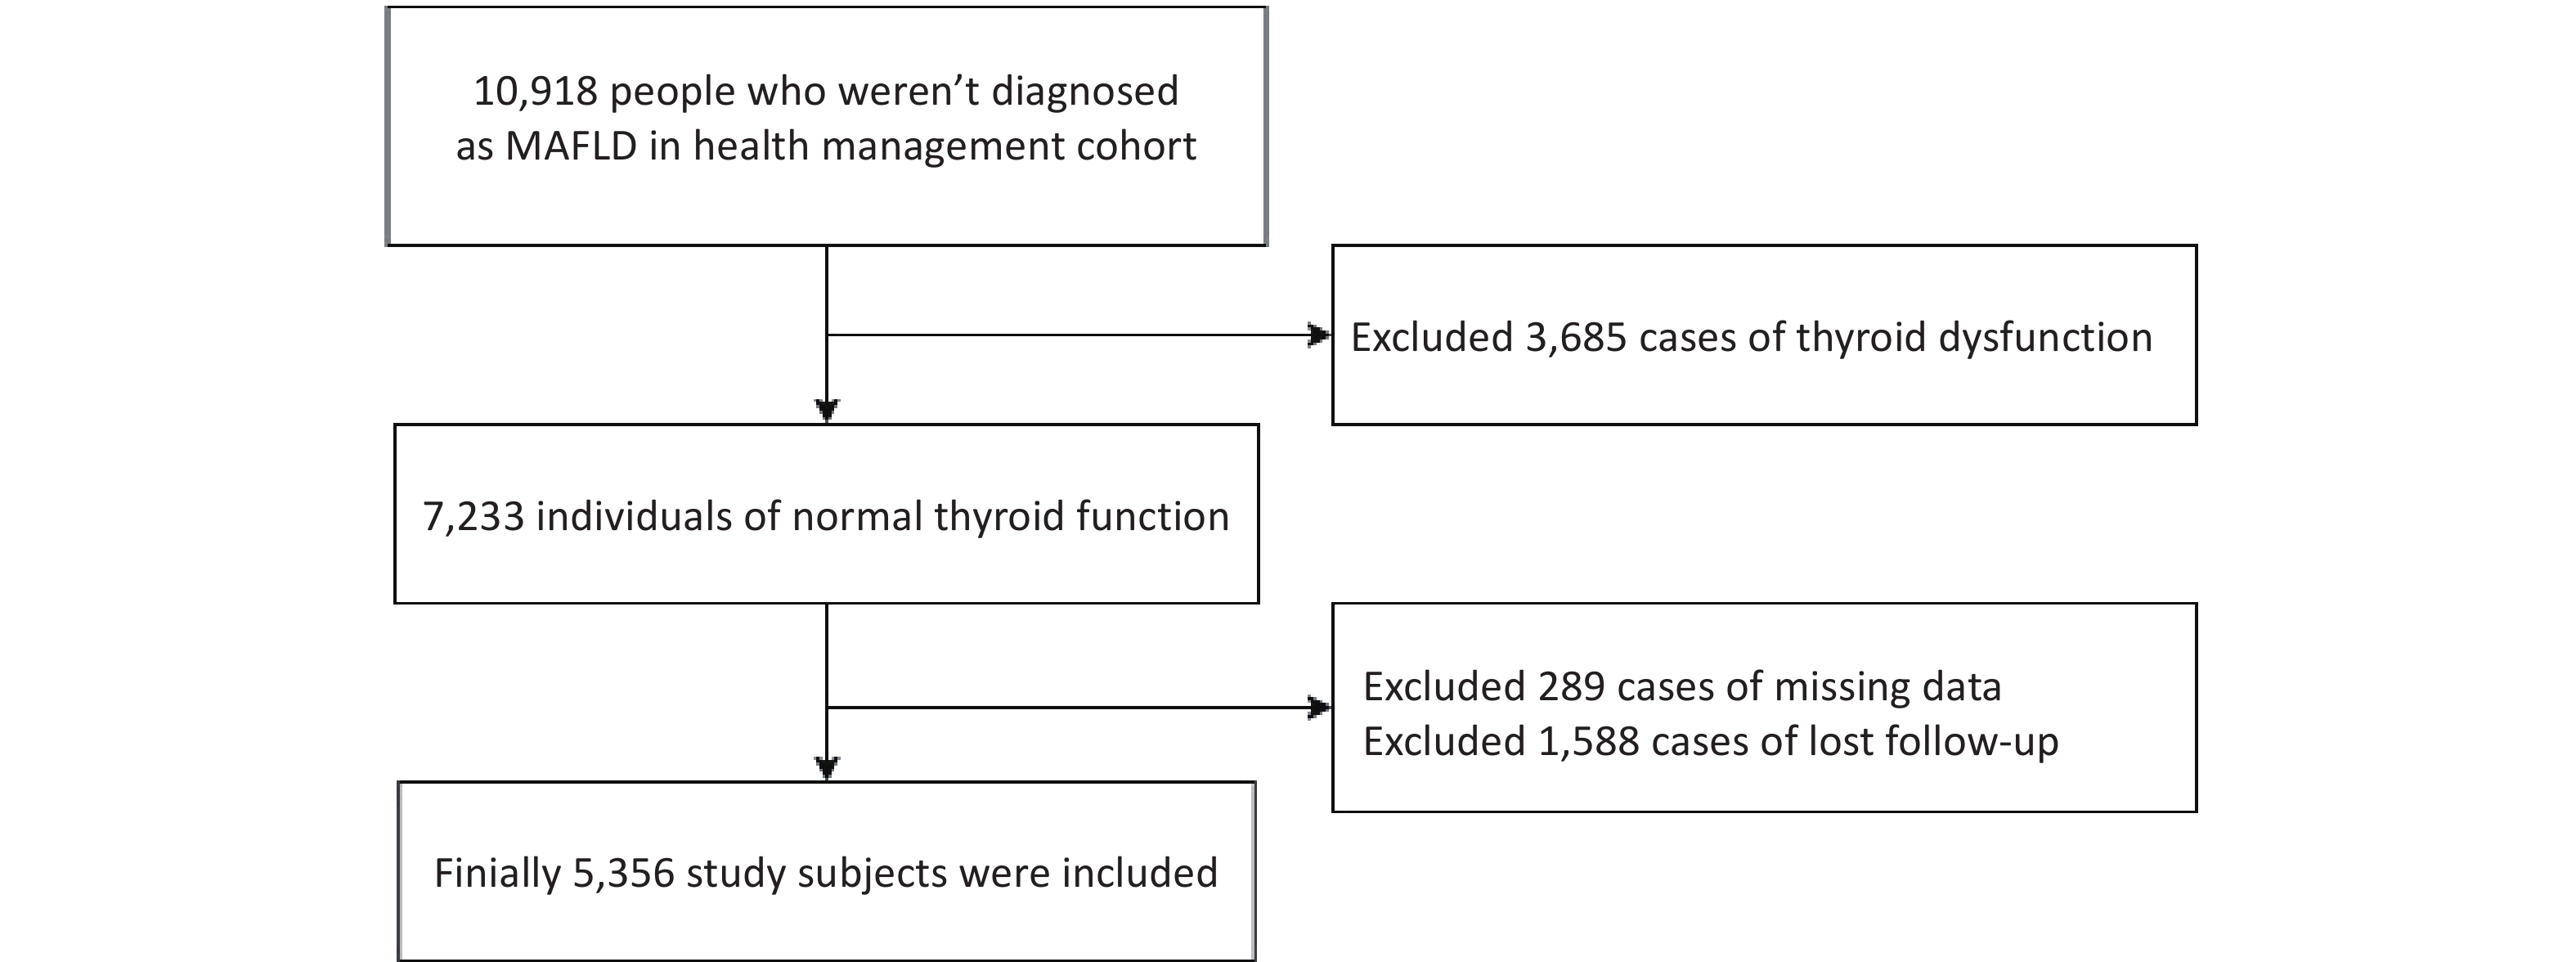
This study used data from the Beijing Health Management Cohort, which began in January 2010 and was followed up until December 2022. In total, 10,918 physical examinations performed at baseline were included. The inclusion criteria were :(1) Age ≥ 18 years;(2) Participants who weren’t diagnosed with MAFLD;(3) Thyroid function tests were conducted at baseline. After excluding 3,685 individuals with thyroid dysfunction and 1,877 individuals with missing data, 5,356 participants were included (Figure 1).
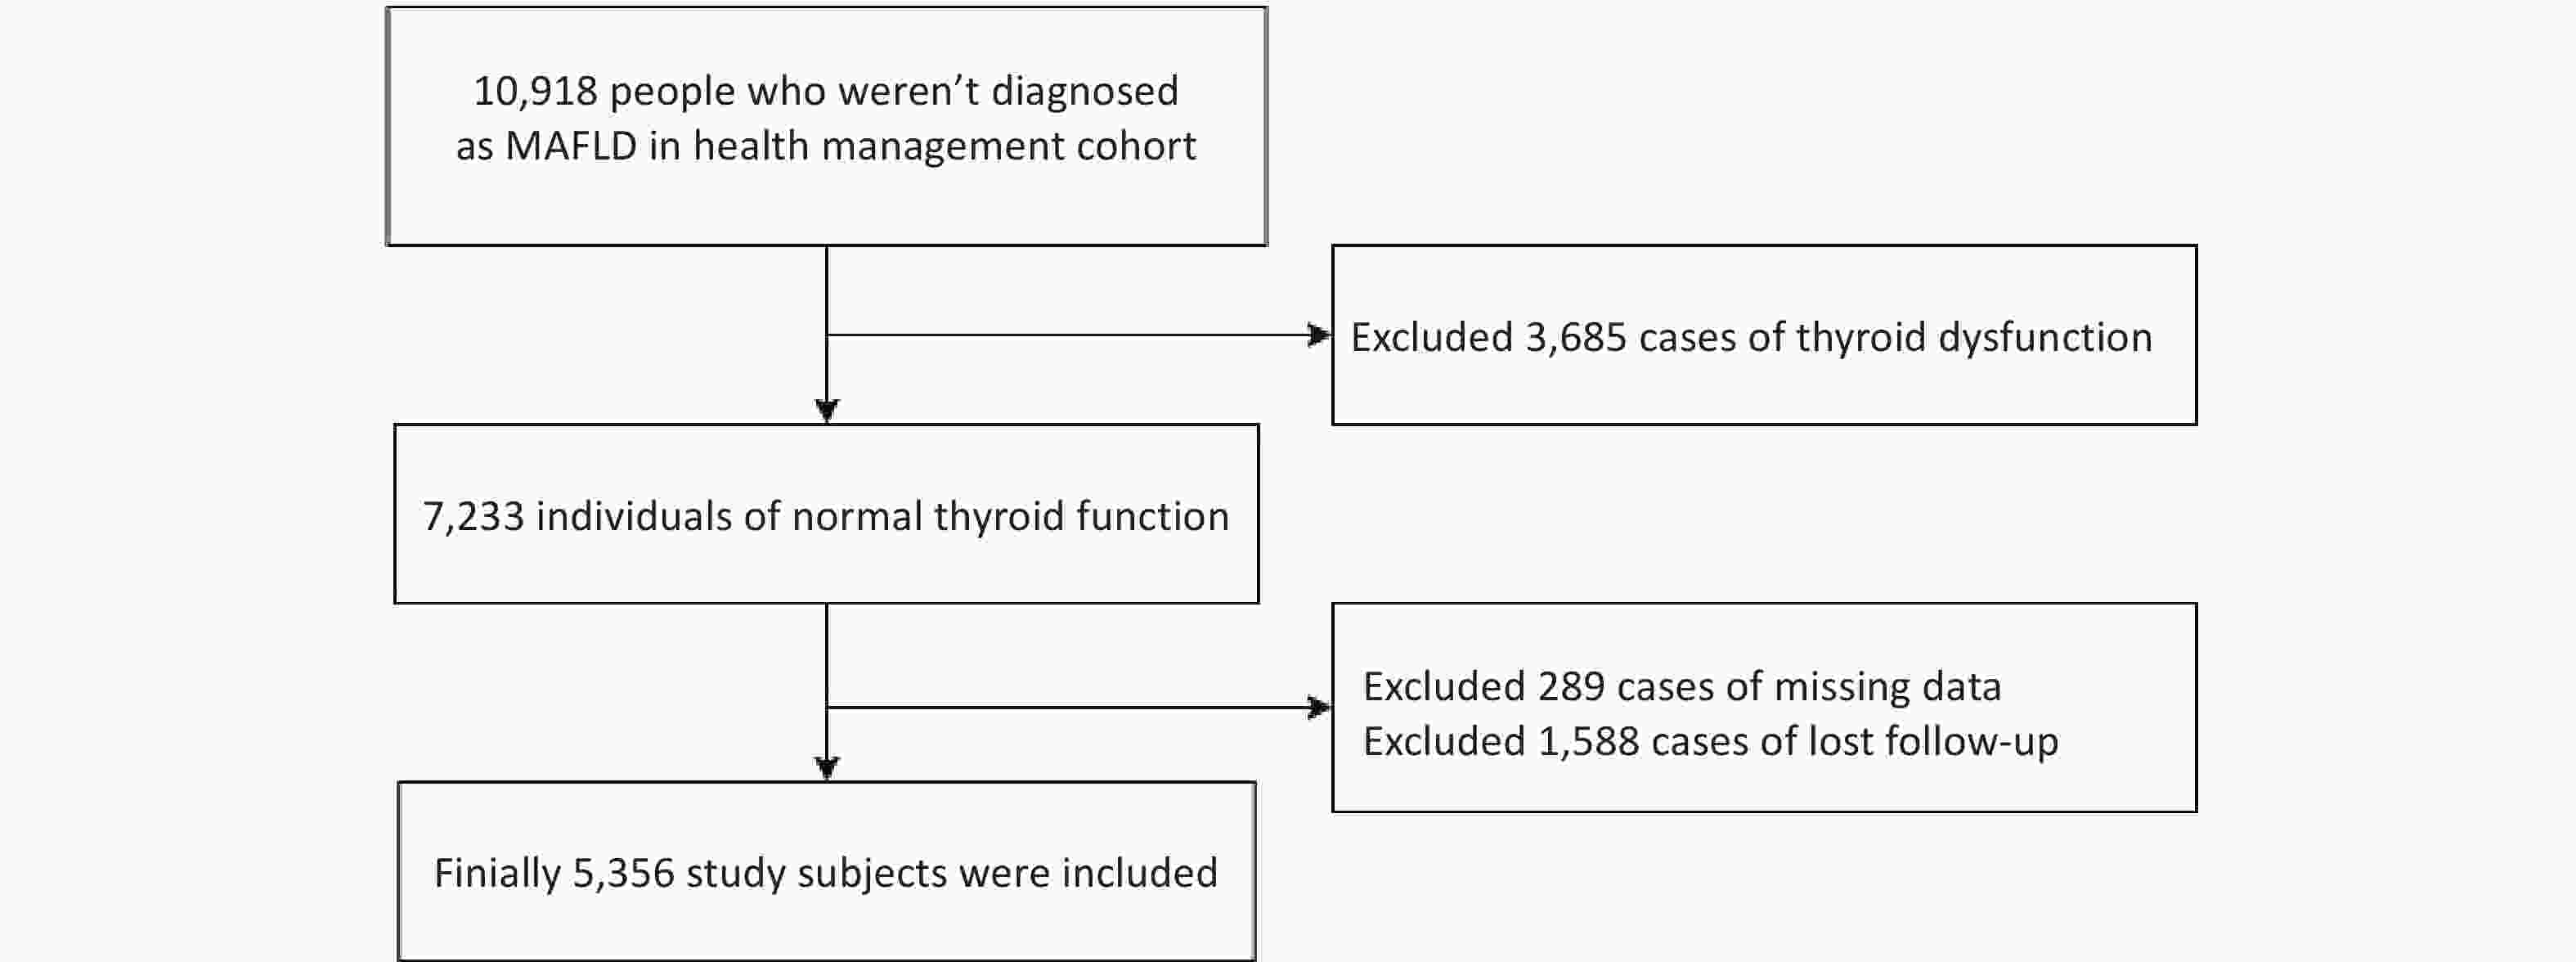
Figure 1. Flowchart of the study participants
The study was approved by the Ethics Committee of the Capital Medical University (number: Z2020SY120). All the participants provided informed consent to participate in this study. Participant anonymity was ensured by encrypting their personal identity information using identification codes. This study was conducted in accordance with the principles of the Declaration of Helsinki.
-
Detailed variables were collected at the time of enrollment, including sex, age, BMI, and waist circumference (WC). Standard measurements of systolic blood pressure (SBP) and diastolic blood pressure (DBP) were performed. Venous blood was collected from the participants on an empty stomach the following morning. Serum biochemicals included triglycerides (TG), high-density lipoprotein cholesterol (HDL-C), low-density lipoprotein cholesterol (LDL-C), total cholesterol (TC), aminotransferase (AST), alanine aminotransferase (ALT), free triiodothyronine (FT3), free thyroxine (FT4), TSH, and fasting plasma glucose (FPG). Fatty liver was diagnosed based on the findings of a liver ultrasound performed by trained technicians.
-
The TFQI, TSHI, Thyrotrophic T3 resistance index (TT3RI), and TT4RI were used to evaluate participants’ central sensitivity to thyroid hormones. The FT3/FT4 ratio was used to assess the peripheral thyroid sensitivity. For the TFQI, TSHI, TT3RI, and TT4RI, the higher the values, the lower the central sensitivity to thyroid hormones. Higher FT3/FT4 values indicated higher peripheral sensitivity to thyroid hormones. The equations used for the calculations were as follows:
FT3/FT4 = FT3(pM)/FT4 (pM)
TT3RI = FT3 (pmol/L) × TSH (mIU/L)[13];
TT4RI = FT4 (pmol/L) × TSH (mIU/L)[14];
TSHI = ln TSH (mIU/L) + 0.1345 × FT4 (pmol/L)[15].
TFQIFT3 = cdf FT3 − (1 − cdf TSH)[12];
TFQIFT4 = cdf FT4 − (1 − cdf TSH); cdf: cumulative distribution function[12];
TyG index = ln (fasting TG (mg/dL) × FPG (mg/dL)/2][16].
-
MAFLD was determined based on ultrasound diagnosed liver steatosis with at least one of the following 3 conditions, as defined by the 2020 international expert consensus on MAFLD[1]: (i) overweight (BMI: 23.0 to 24.9 kg/m2) or obesity (BMI of 25.0 kg/m2 or higher); (ii) type 2 diabetes mellitus (FPG level ≥ 7.0 mmol/L, PPG ≥ 11.1 mmol/L, HbA1c ≥ 6.5% and/or having a self-reported diagnosis of diabetes as the previous study[17]); or (iii) lean or normal weight (BMI < 23 kg/m2) with at least 2 metabolic risk abnormalities: a) waist circumference ≥ 90 cm in men and 80 cm in women, b) blood pressure ≥ 130/85 mmHg or specific drug treatment, c) TG ≥ 1.70 mmol/L or specific drug treatment, d) HDL-C < 1.0 mmol/L for men and < 1.3 mmol/L for women, e) prediabetes (ie, FPG levels 5.6 to 6.9 mmol/L, or 2-hour PPG levels 7.8 to 11.0 mmol/L or HbA1c 5.7% to 6.4%), f) a HOMA-IR score ≥ 2.5, and g) a plasma C-reactive protein level > 2 mg/L.
-
In this study, randomly distributed missing data were encountered. Given the relatively small proportion of missing data (less than 5% for all variables), they were handled by directly removing the affected cases. The proportion of missing data for each variable was as follows: height (4.00%); weight (4.00%); HC (3.98%); WC (3.98%); TG (0.04%); and FPG (0.03%).
The baseline characteristics of the participants are summarized as mean ± standard deviation or median (interquartile range) for continuous variables and frequencies for categorical variables (%) according to the presence or absence of MAFLD. Differences between the groups were calculated using Student’s t-test, Mann-Whitney U test, or chi-squared test.
A Cox regression model identified the association between thyroid function, sensitivity to thyroid hormone indices, and MAFLD. Covariates were selected based on previous studies, clinical relevance, and their potential role as confounders of the relationship between thyroid function and MAFLD. Covariates were tested for collinearity according to a variance inflation factor (VIF) < 5. No collinearity was found among the confounders. The complete model was adjusted for sex, age, BMI, WC, SBP, DBP, TG, TC, and low-density lipoprotein cholesterol levels.
Restricted cubic spline (RCS) analysis was conducted using a three-knot restricted cubic spline function to further validate the potential nonlinear relationship between the sensitivity to thyroid hormone indices and MAFLD. In the RCS analysis, models with three, four, and five knots were compared, and it was found that the three-knot model consistently had the lowest or comparable Akaike information criterion values (differences < 2). Thus, three knots were selected to achieve the best balance between model fit and parsimony. The model was adjusted for sex, age, BMI, WC, SBP, DBP, TG, TC, and low-density lipoprotein cholesterol levels.
Mediation analyses were performed to explore the mediators in the relationship between thyroid sensitivity indices and MAFLD.
All statistical analyses were performed using R software (version 4.4.2). Cox proportional hazard regression models were fitted using the survival package. The RCS was implemented using the rms and ggrcs packages. Mediation analysis was performed using the mediation package with the survreg() function, which fits accelerated failure time (AFT) models. In AFT models, the estimated coefficient (β) represents the effect on the log of event time: a positive β indicates a longer time to event (protective effect), whereas a negative β indicates a shorter time to event (higher risk). Statistical significance was defined as a two-tailed P value < 0.05.
-
The characteristics of the study population are presented in detail in Table 1. In total, 5,356 participants with a median age of 42 years (IQR: 34–51 years) were included in this study. The cumulative incidence of MAFLD during the follow-up was 18.26%. Compared with non-MAFLD cases, MAFLD participants had significantly higher FT3, FT4, FT3/FT4, TT3RI, TSHI, TFQIFT3, TFQIFT4, age, BMI, WC, SBP, DBP, FPG, TG, TC, LDL-C, ALT, and AST levels (P < 0.05). The HDL-C levels were lower in the MAFLD group than in the non-MAFLD group (P < 0.05). No difference was found in TSH and TT4RI levels between the two groups (P = 0.644 and P = 0.274, respectively).
Table 1. Characteristics of the study participants with and without MAFLD
Characteristic Total
(N = 5,356)MAFLD
(N = 978)Non-MAFLD
(N = 4,378)P-value Men, n% 2174 (40.59) 584 (59.71) 1590 (36.32) < 0.05 Age, years 42.00 (34.00
, 51.00)45.00 (37.00, 55.00) 41.00 (33.00, 51.00) < 0.05 BMI, kg/m2 22.91 ± 2.88 25.14 ± 2.56 22.41 ± 2.71 < 0.05 WC, cm 77.48 ± 9.48 84.65 ± 8.43 75.88 ± 8.95 < 0.05 SBP, mmHg 116.00 (107.00, 128.00) 120.00 (110.00, 133.00) 114.00 (106.00, 126.00) < 0.05 DBP, mmHg 71.00 (65.00, 80.00) 77.00 (70.00, 83.00) 70.00 (64.00, 80.00) < 0.05 FPG, mmol/L 5.04 (4.77, 5.38) 5.23 (4.94, 5.63) 5.00 (4.74, 5.33) < 0.05 TG, mmol/L 0.93 (0.68, 1.32) 1.29 (0.93, 1.72) 0.87 (0.64, 1.21) < 0.05 TC, mmol/L 4.75 (4.20, 5.36) 4.83 (4.28, 5.51) 4.74 (4.19, 5.33) < 0.05 HDL-C, mmol/L 1.40 (1.19, 1.63) 1.24 (1.08, 1.42) 1.44 (1.23, 1.67) < 0.05 LDL-C, mmol/L 2.73 (2.26, 3.23) 2.90 (2.42, 3.42) 2.69 (2.23, 3.18) < 0.05 ALT, U/L 14.70 (11.00, 20.00) 17.00 (13.00, 24.00) 14.00 (10.50, 19.00) < 0.05 AST, U/L 17.00 (14.00, 20.00) 17.00 (15.00, 21.00) 16.00 (14.00, 20.00) < 0.05 TSH, mIU/L 1.96 (1.43, 2.70) 1.97 (1.43, 2.64) 1.96 (1.43, 2.71) 0.644 FT3, pmol/L 4.49 (4.12, 4.89) 4.65 (4.26, 5.04) 4.46 (4.09, 4.85) < 0.05 FT4, pmol/L 13.94 (12.30, 16.44) 14.56 (12.48, 16.73) 13.80 (12.26, 16.34) < 0.05 FT3/FT4 0.31 (0.28, 0.35) 0.32 (0.28, 0.36) 0.31 (0.28, 0.35) 0.008 TT3RI 8.78 (6.29, 12.24) 9.21 (6.48, 12.37) 8.70 (6.24, 12.20) 0.035 TT4RI 27.70 (19.66, 39.91) 28.61 (20.05, 39.44) 27.49 (19.54, 40.00) 0.274 TSHI 2.60 (2.20, 3.04) 2.67 (2.25, 3.04) 2.59 (2.19, 3.04) 0.027 TFQIFT3 0.01 (-0.29, 0.30) 0.09 (-0.21, 0.37) -0.01 (-0.31, 0.28) < 0.05 TFQIFT4 0.00 (-0.31, 0.32) 0.05 (-0.26, 0.34) -0.01 (-0.32, 0.32) 0.008 Note. The continuous variables that obey the normal distribution are displayed as mean±standard deviation (x ± s), and the t-test was used for comparison between groups. Continuous variables that did not obey the normal distribution were presented as median and quartile interval forms [M (P25, P75)]. MAFLD, metabolic-associated fatty liver disease; BMI, body mass index; WC, waist circumference; SBP, systolic blood pressure; DBP, diastolic blood pressure; FPG, fasting plasma glucose; TG, triglycerides; TC, total cholesterol; HDL-C, high-density lipoprotein cholesterol; LDL-C, low-density lipoprotein cholesterol; ALT, alanine aminotransferase; AST, aspartate aminotransferase; TSH, thyrotropin (thyroid-stimulating hormone); FT3, free triiodothyronine; FT4, free thyroxine; TT3RI, thyrotrophic T3 resistance index; TT4RI, thyrotrophic T4 resistance index; TSHI, thyroid stimulating hormone index; TFQI, thyroid feedback quantile-based index.
-
Cox regression analysis was used to assess the relationship between the thyroid parameters and MAFLD (Table 2). In the crude model, TSH, FT3, FT3/FT4, TT4RI, TSHI, TFQIFT3, and TFQIFT4 levels were significantly associated with MAFLD risk (all P < 0.05). Specifically, FT3, FT3/FT4, and TFQIFT3 were positively associated with the MAFLD risk (P < 0.05), whereas TSH, TT4RI, TSHI, and TFQIFT4 were inversely associated with the MAFLD risk (P < 0.05). In Model 1 (adjusted for BMI, WC, TG, and LDL-C), the positive association remained significant between FT3, FT3/FT4, TT4RI, TSHI, TFQIFT4, and MAFLD (all P < 0.05). After further adjustment for sex, age, SBP, DBP, and TC in Model 2, FT3, FT4, FT3/FT4, TT4RI, TSHI, and TFQIFT4 were significantly associated with MAFLD risk (P < 0.05).
Table 2. Relationship between sensitivity indices to thyroid hormones and MAFLD incidence in different models
Thyroid
parametersModel 1 Model 2 Model 3 HR (95% CI) P-value HR (95% CI) P-value HR (95% CI) P-value TSH 0.922 (0.865, 0.984) 0.014 0.943 (0.883, 1.006) 0.077 0.943 (0.883, 1.008) 0.085 FT3 1.455 (1.315, 1.609) < 0.05 1.115 (1.008, 1.234) 0.035 1.118 (1.000, 1.250) 0.050 FT4 0.989 (0.965, 1.014) 0.400 0.983 (0.958, 1.008) 0.178 0.973 (0.948, 0.999) 0.043 FT3/FT4 98.530 (30.370, 319.600) < 0.05 9.299 (2.715, 31.851) < 0.05 14.287 (3.999, 51.042) < 0.05 TT3RI 0.997 (0.984, 1.010) 0.645 0.992 (0.979, 1.006) 0.259 0.992 (0.978, 1.006) 0.242 TT4RI 0.995 (0.991, 0.999) 0.016 0.996 (0.992, 1.000) 0.040 0.995 (0.991, 1.000) 0.025 TSHI 0.882 (0.789, 0.986) 0.027 0.891 (0.797, 0.995) 0.041 0.869 (0.776, 0.974) 0.016 TFQIFT3 1.296 (1.111, 1.513) < 0.05 1.009 (0.864, 1.180) 0.907 0.993 (0.844, 1.168) 0.929 TFQIFT4 0.830 (0.711, 0.968) 0.018 0.841 (0.721, 0.982) 0.029 0.806 (0.688, 0.945) 0.008 Notes. Model 1: none (univariate); Model 2: adjusted for BMI, WC, TG, and LDL-C; Model 3: adjusted for variables in Model 2 and sex, age, SBP, DBP, and TC. MAFLD, metabolic-associated fatty liver disease; BMI, body mass index; WC, waist circumference; SBP, systolic blood pressure; DBP, diastolic blood pressure; TG, triglycerides; TC, total cholesterol; LDL-C, low-density lipoprotein cholesterol; TSH, thyrotropin (thyroid-stimulating hormone); FT3, free triiodothyronine; FT4, free thyroxine; TT3RI, thyrotrophic T3 resistance index; TT4RI, thyrotrophic T4 resistance index; TSHI, thyroid-stimulating hormone index; TFQI, thyroid feedback quantile-based index.
-
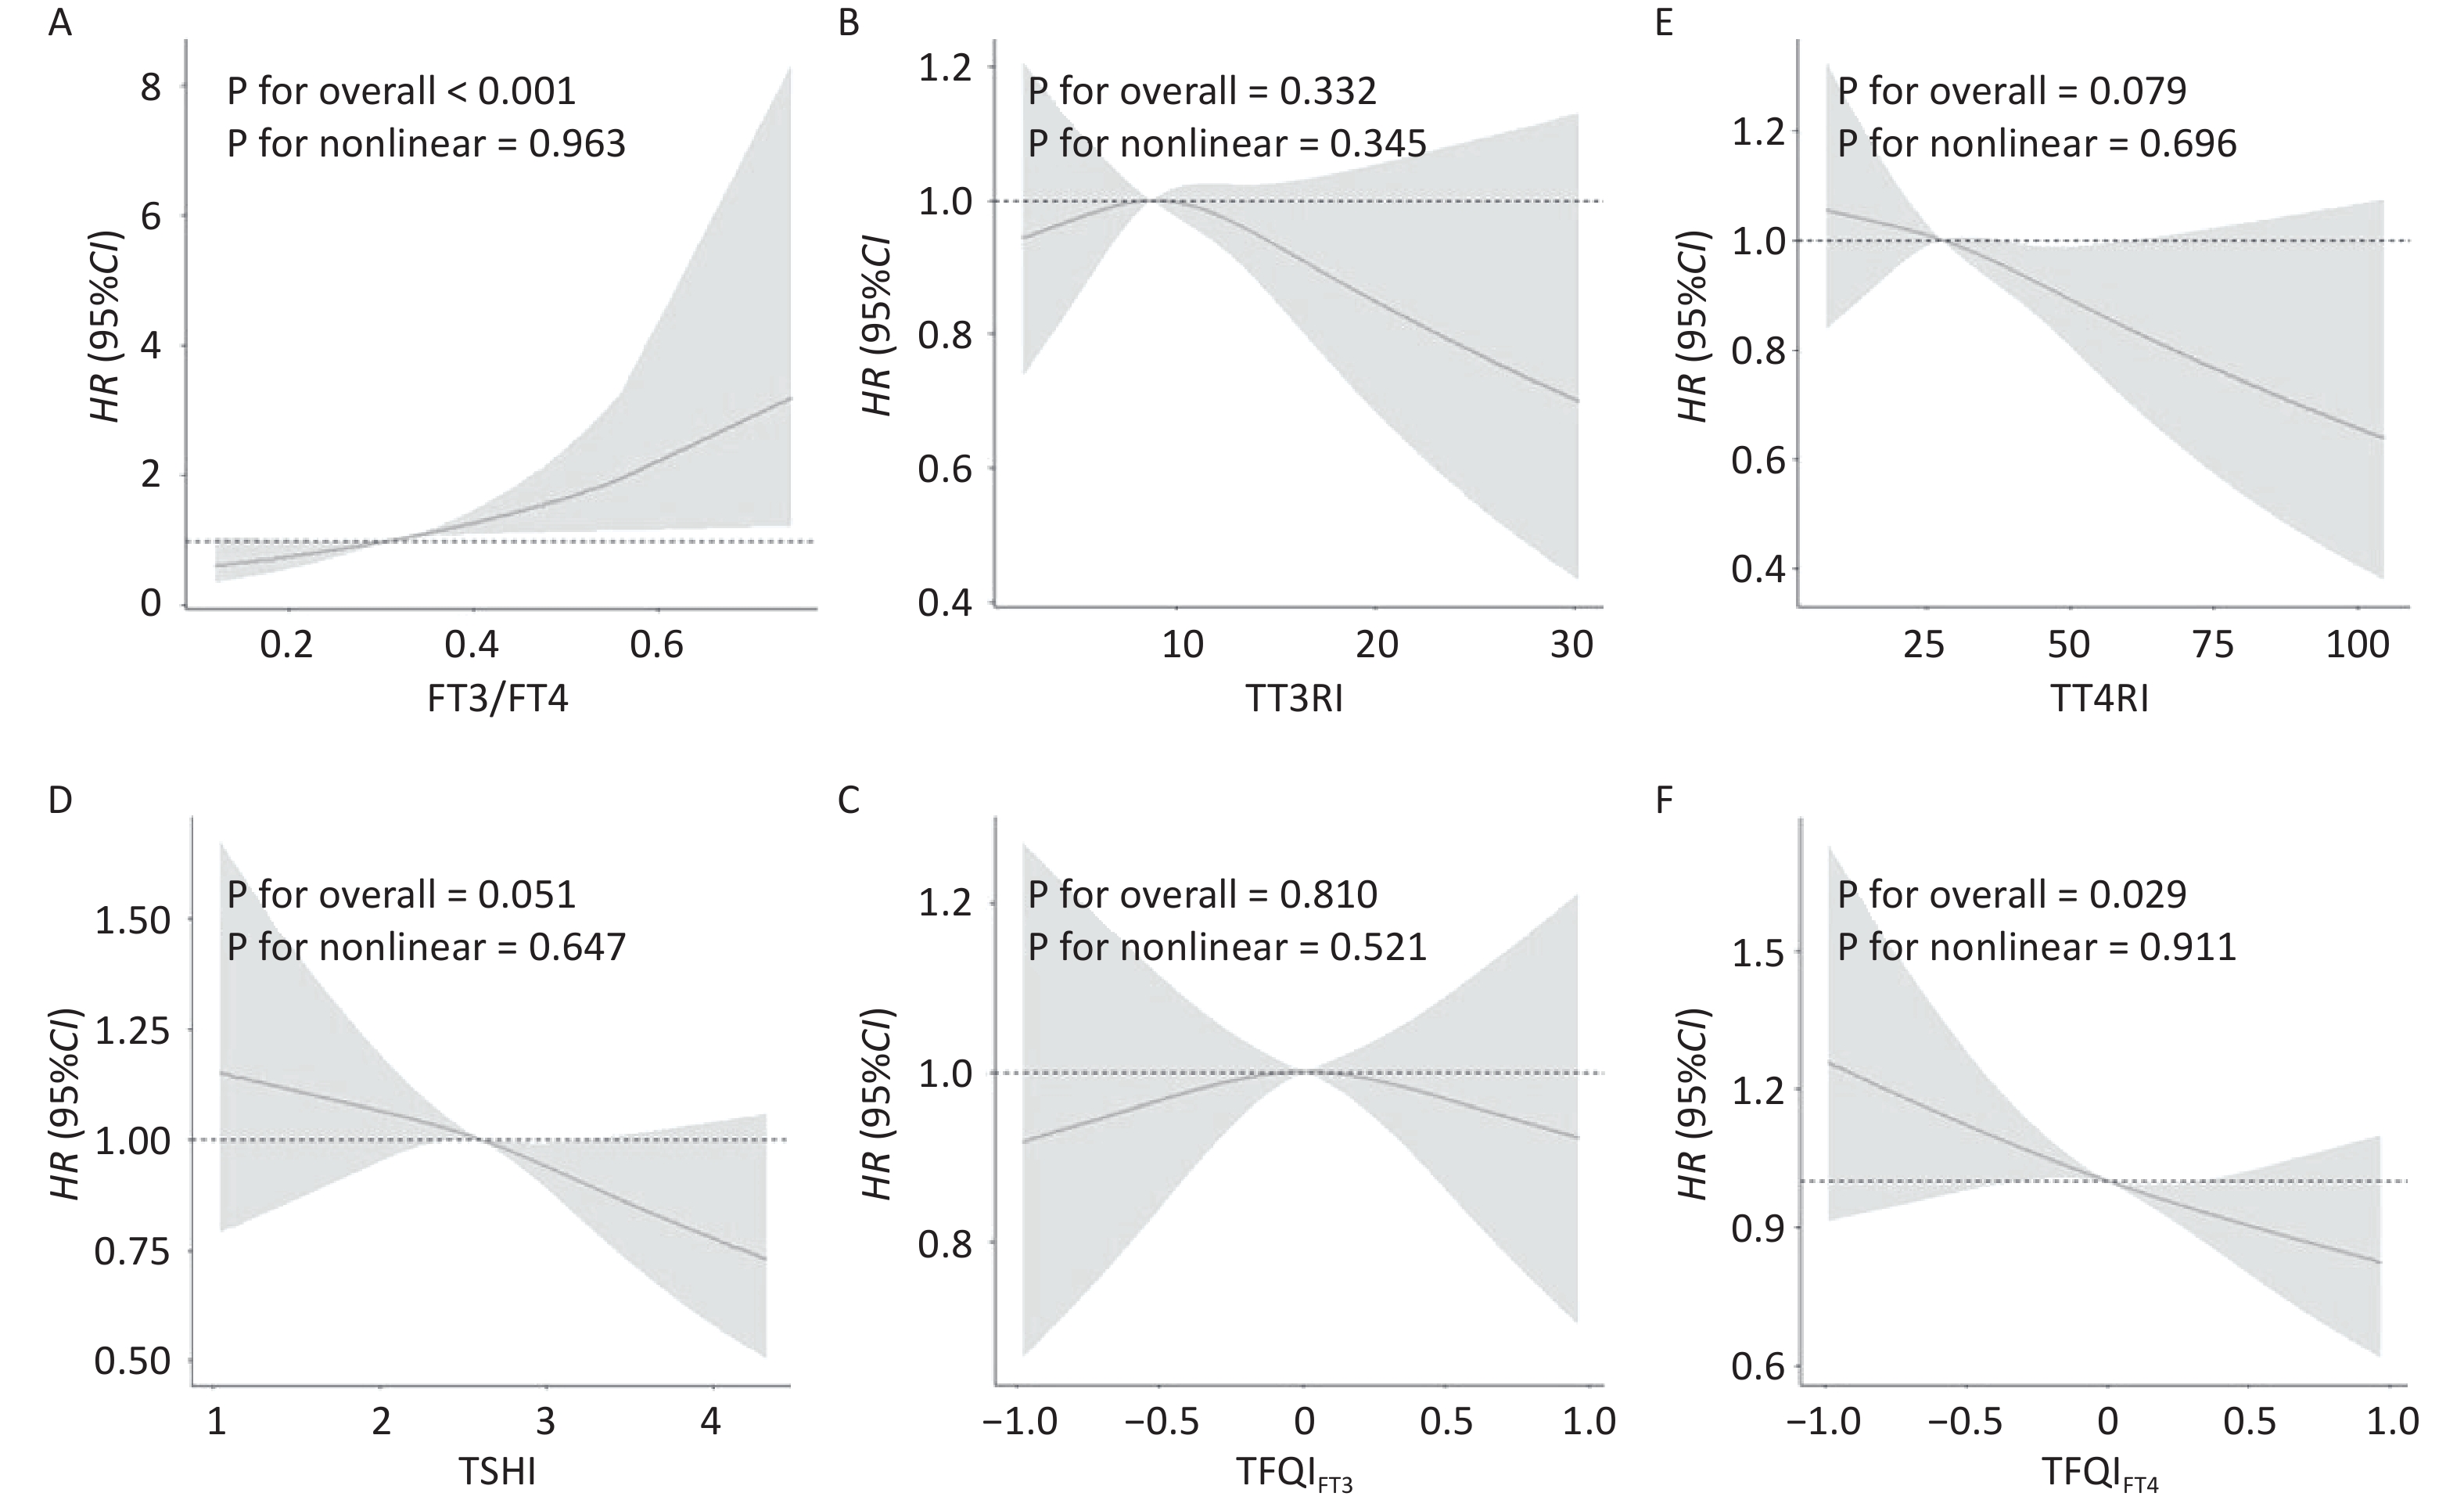
As shown in Figure 2, restricted cubic splines were used to flexibly model and visualize the relationships between FT3/FT4, TT3RI, TT4RI, TSHI, TFQIFT3, and TFQIFT4 with MAFLD. After adjusting for sex, age, BMI, WC, SBP, DBP, TG, TC, and LDL, the association between FT3/FT4 levels and MAFLD was statistically significant (P < 0.05). The restricted cubic spline model with knots located at 0.257, 0.314, and 0.388 did not suggest a nonlinear relationship (P > 0.05) (Figure 2A). No associations between TT3RI, TT4RI, TSHI, TFQIFT3 and MAFLD were found (P for overall > 0.05) (Figure 2B, 2C, 2D, and 2E). In Figure 2F, TFQIFT4 also showed a significant overall association (P for overall < 0.05). The restricted cubic spline model, with knots located at −0.570, 0.002, and 0.574, did not suggest a nonlinear relationship (P for nonlinear > 0.05).
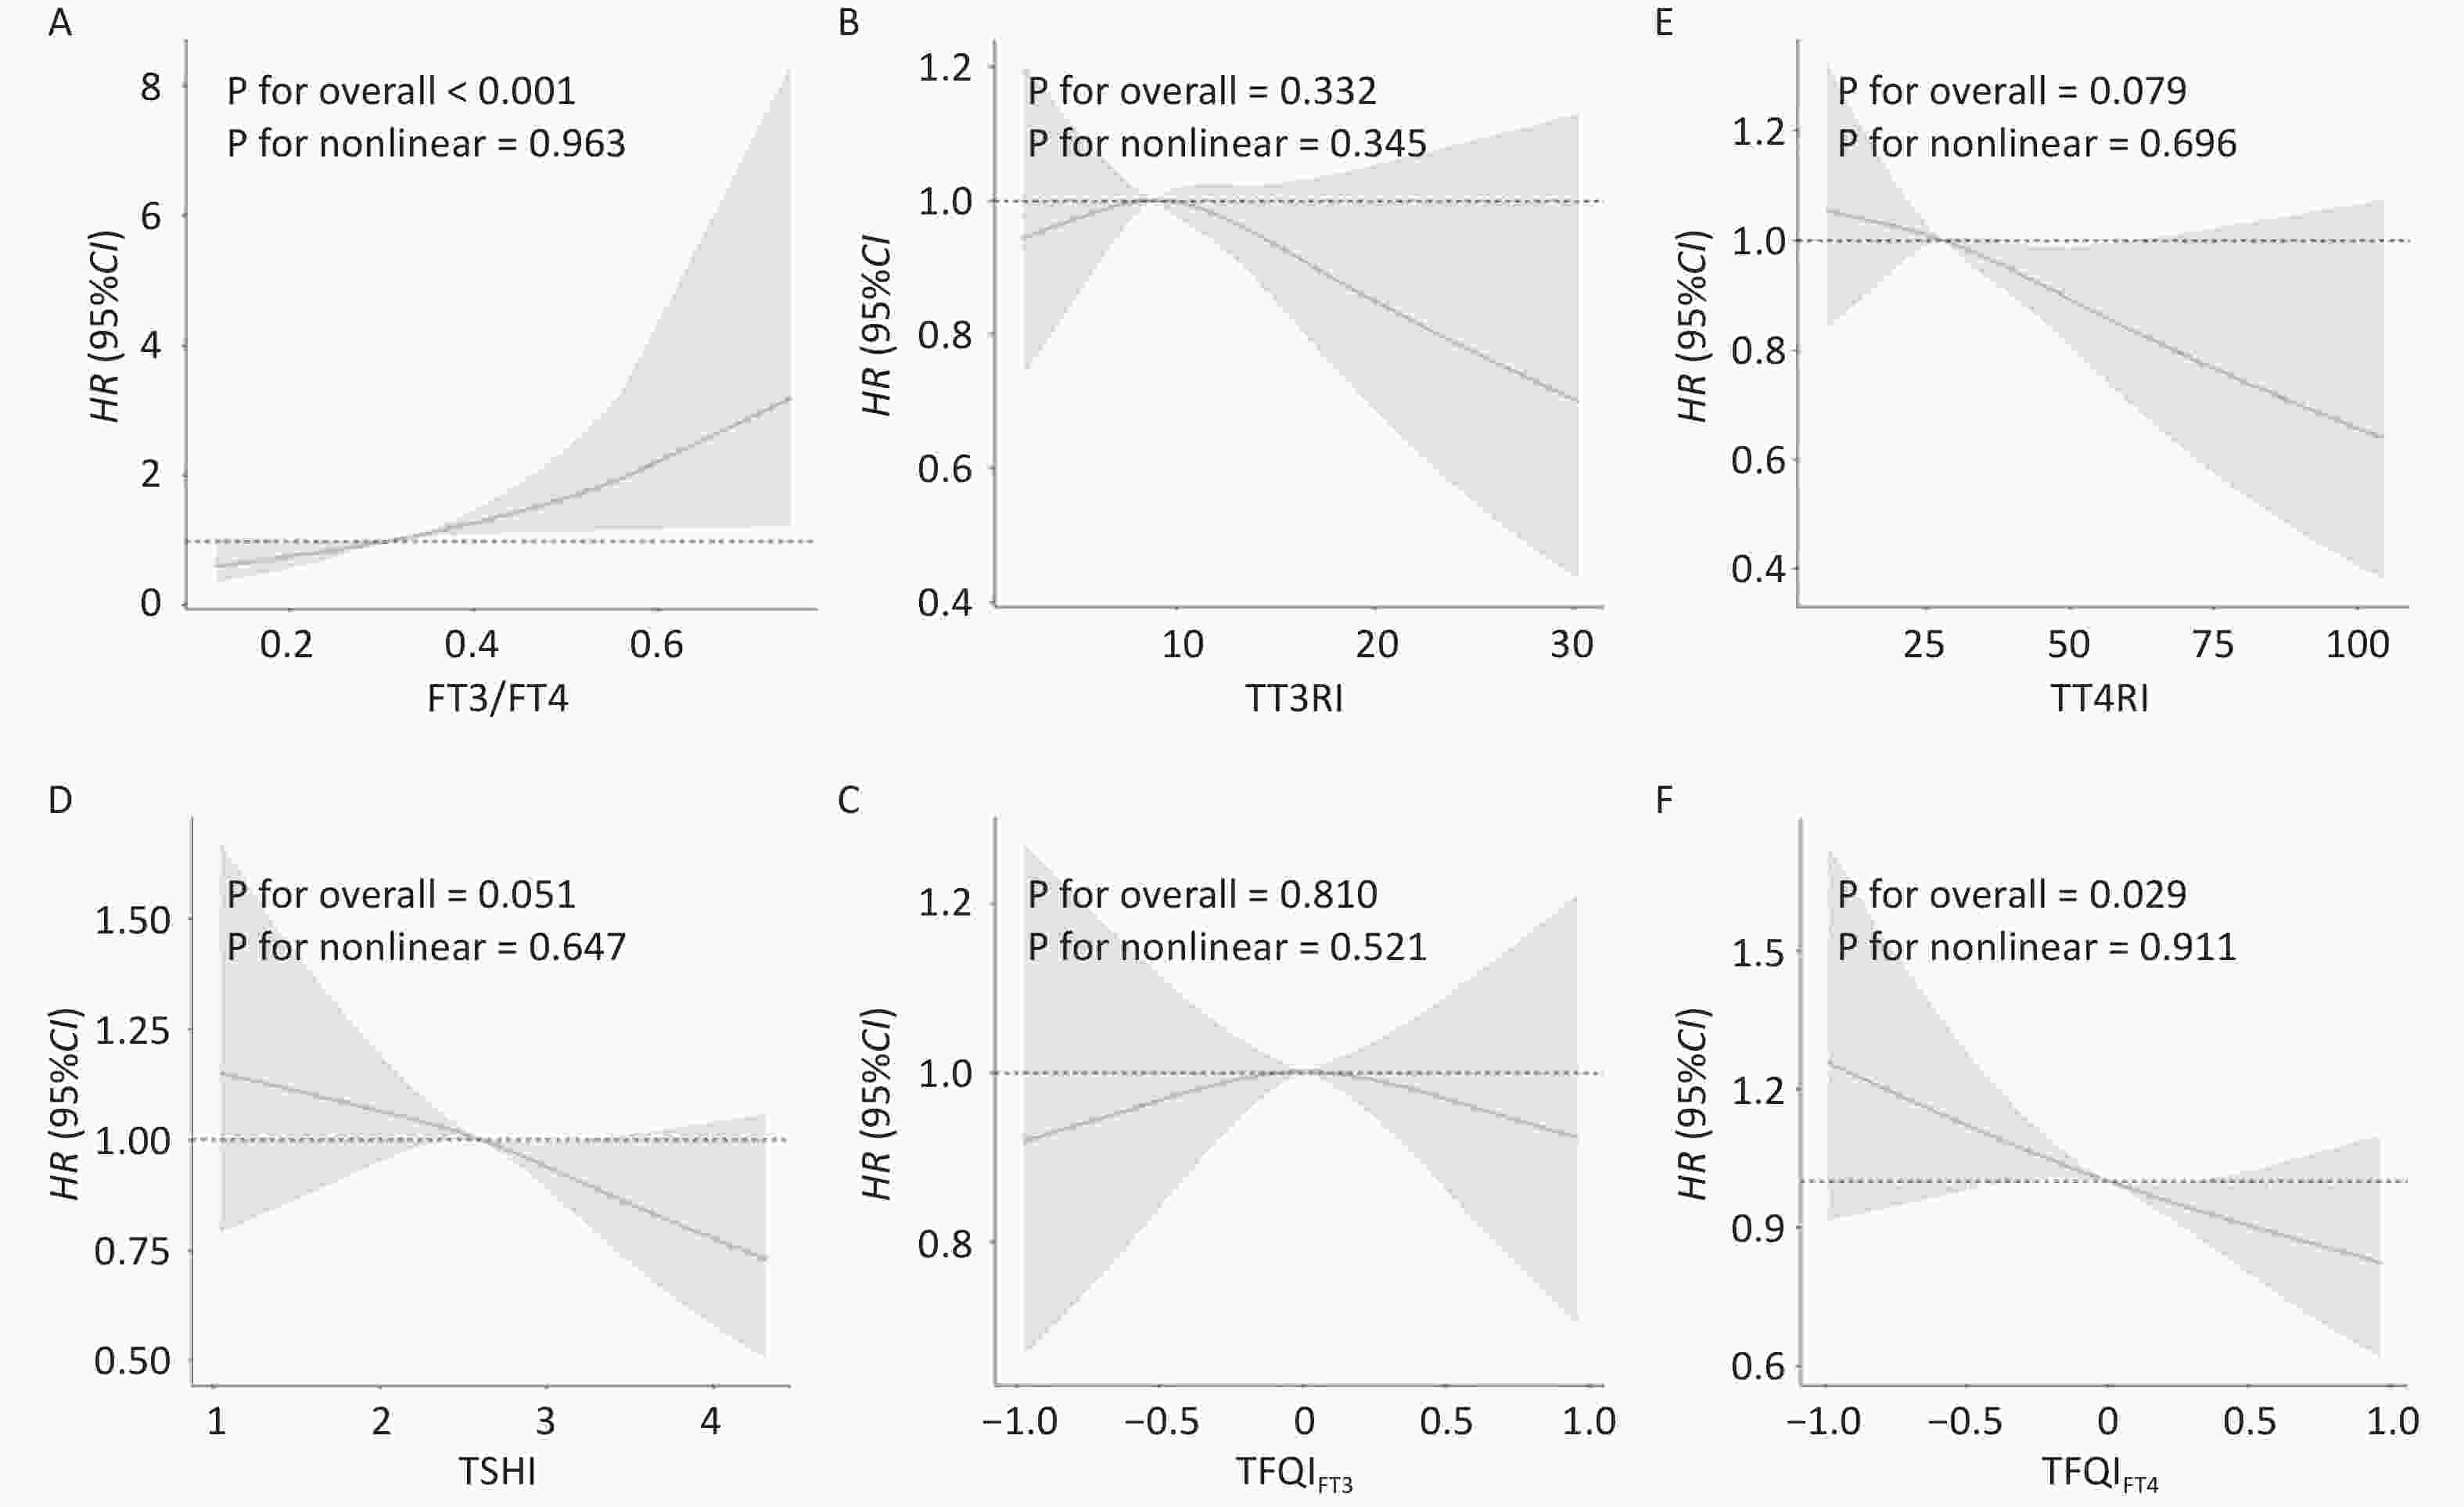
Figure 2. Nonlinear relationships of thyroid sensitivity indices with MAFLD. Restricted cubic spline (RCS) analysis was conducted. (A) FT3/FT4 and MAFLD (B) TT3RI and MAFLD (C) TT4RI and MAFLD (D) TSHI and MAFLD (E) TFQIFT3 and MAFLD (F) TFQIFT4 and MAFLD. The model was adjusted for sex, age, BMI, WC, SBP, DBP, TG, TC, and LDL-C.
-
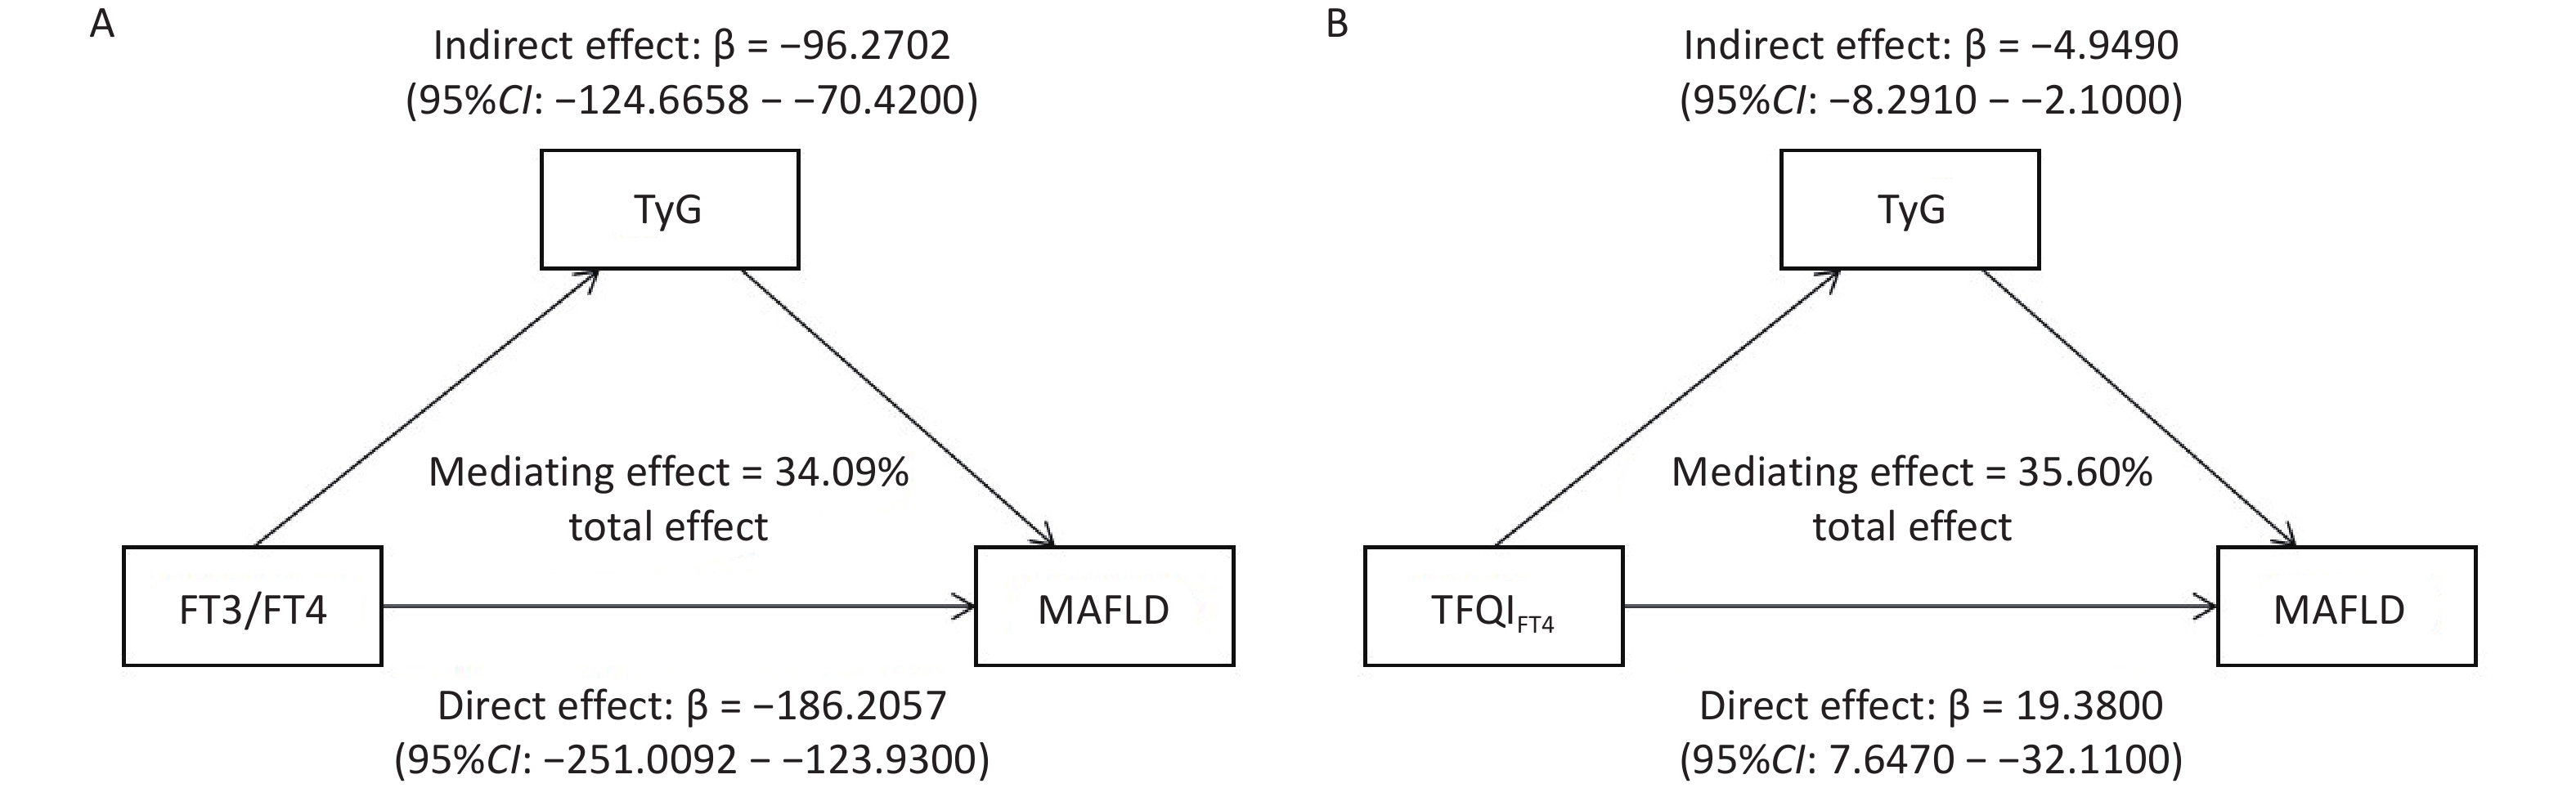
Mediation analyses were conducted based on the AFT model to determine whether the TyG index was a mediating factor in the association between FT3/FT4 and TFQIFT4 and MAFLD. The direct association between TyG and MAFLD incidence was first examined. The result shows that higher TyG was significantly associated with faster MAFLD onset(β = −1.537, 95% CI: −1.685 to −1.389, P < 0.05) in the AFT model. A negative β indicates a shorter time to event, suggesting that elevated TyG acts as a risk factor for MAFLD. Subsequently, mediation analyses were conducted to explore the indirect effects of thyroid sensitivity indices on MAFLD through TyG. As the findings report, FT3/FT4 had a significant direct effect on MAFLD (β = −186.2057, 95% CI: -251.0092 to −123.9300), indicating that higher FT3/FT4 levels were associated with a shorter time to disease onset and thus acted as a risk factor for MAFLD. In contrast, TFQIFT4 showed a significant positive direct effect (β = 19.3800, 95% CI: 7.6470 to 32.1100), suggesting a prolonged time to onset and a protective role against MAFLD (Figure 3). As Figure 3A displays, the TyG index (β = −96.2702, 95% CI: −124.6658 to −70.4200) incompletely mediated the indirect influence of FT3/FT4 on MAFLD occurrence. The mediation ratio is 34.09%. TyG index (β = −4.9490, 95% CI: −8.2910 to −2.1000) also incompletely mediated the indirect influence of TFQIFT4 on MAFLD. The proportion of mediation was 35.60% (Figure 3B).
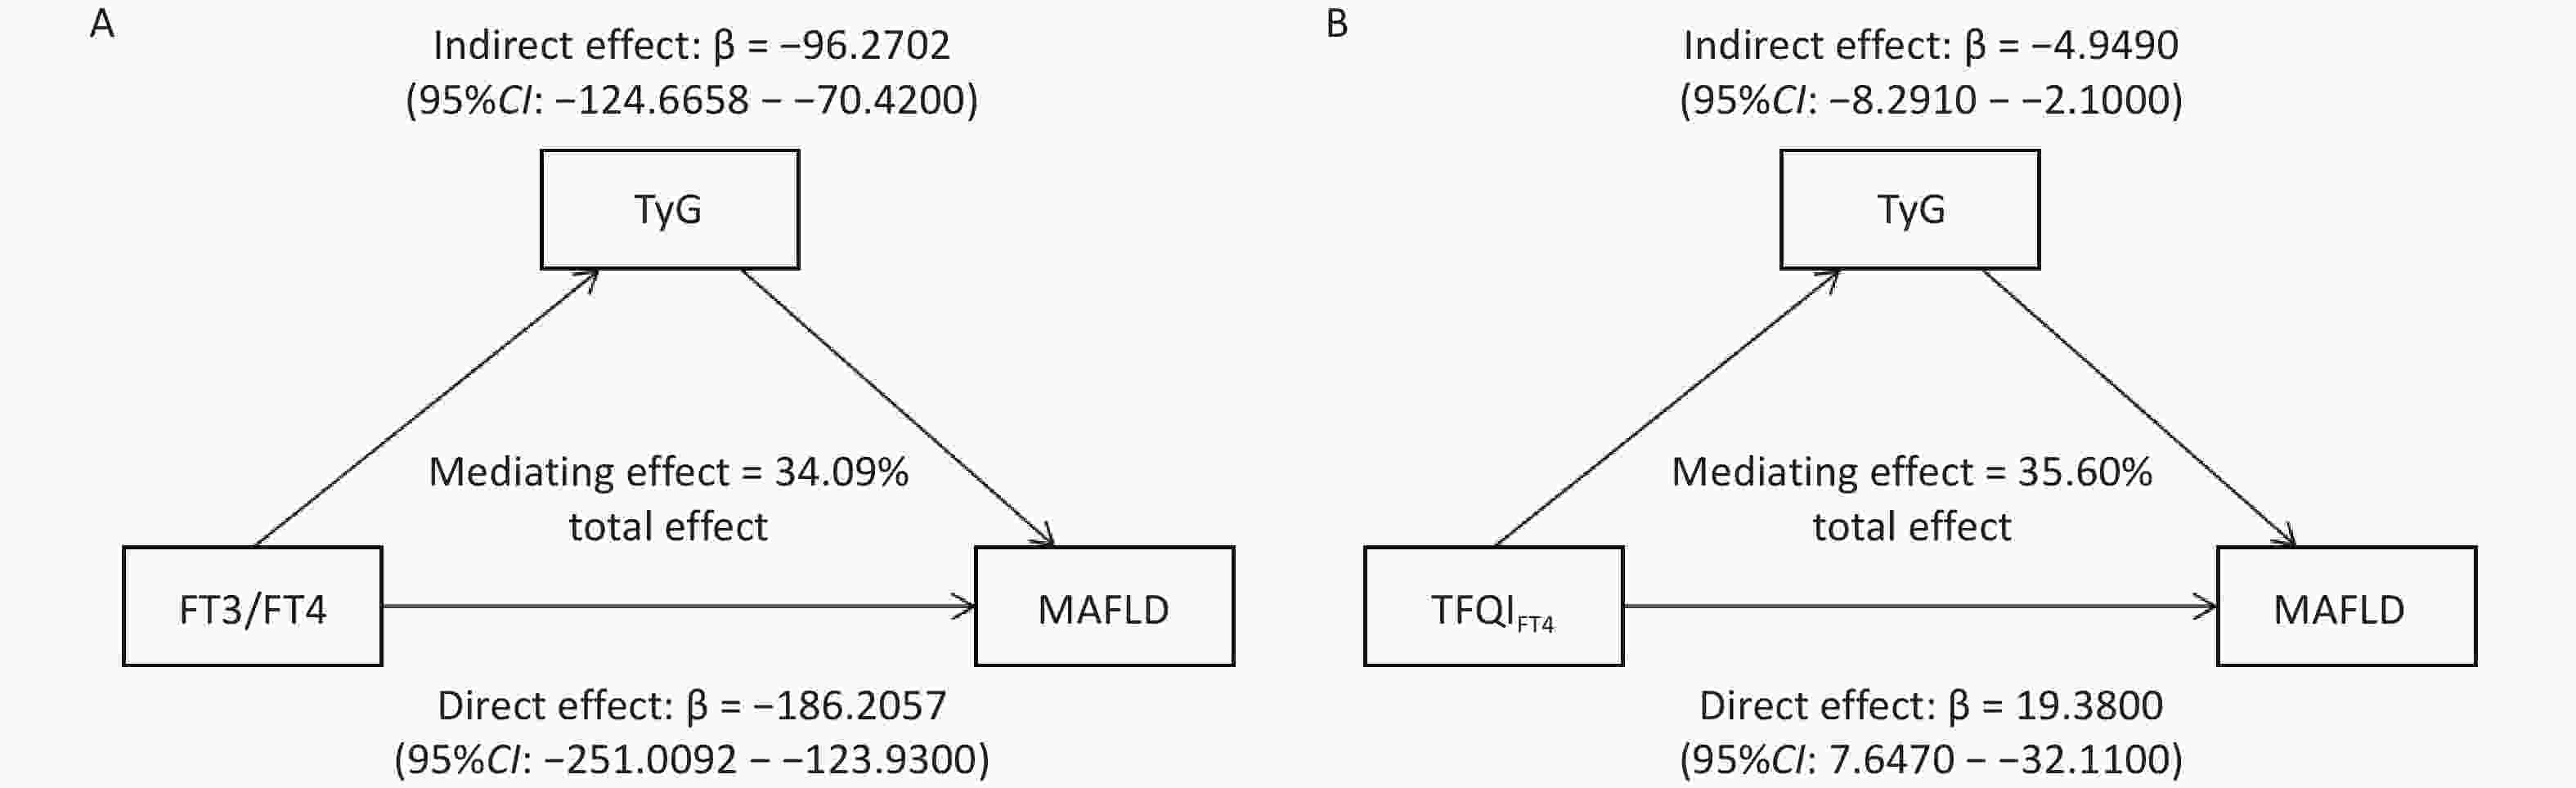
Figure 3. Mediation effect of TyG index on the associations between FT3/FT4, TFQIFT4, and MAFLD (A) FT3/FT4; (B) TFQIFT4.
-
To assess the robustness of these primary findings for the definition of the study population, a sensitivity analysis was conducted by expanding the cohort. For the sensitivity analysis, an additional 1,949 participants were included with subclinical thyroid dysfunction (encompassing both subclinical hypothyroidism and hyperthyroidism), resulting in an expanded cohort of 7,305 individuals. As shown in Table 3, the results of the multivariate Cox proportional hazards models in this expanded cohort were consistent with those of our primary analysis. After adjusting for sex, age, BMI, WC, TG, LDL-C, TC, SBP, and DBP, the association between key thyroid function parameters and MAFLD risk remained significant (P < 0.05). Specifically, FT3 (HR = 0.836, 95%CI: 0.758 to 0.921), FT4 (HR = 0.937, 95%CI: 0.915 to 0.959), FT3/FT4 (HR = 6.344, 95%CI: 2.018 to 19.950), TSHI (HR = 0.805, 95%CI: 0.732 to 0.886), and TFQI (HR = 0.687, 95%CI: 0.598 to 0.791) all continued to demonstrate significant associations with incident MAFLD.
Table 3. Sensitivity Analysis of the Relationship between sensitivity indices to thyroid hormones and MAFLD incidence in different models
Thyroid
parametersModel 1 Model 2 Model 3 HR (95% CI) P-value HR (95% CI) P-value HR (95% CI) P-value TSH 1.017 (0.971, 1.065) 0.478 1.024 (0.977, 1.073) 0.317 1.020 (0.973, 1.069) 0.413 FT3 1.112 (1.015, 1.217) 0.022 0.840 (0.768, 0.919) < 0.05 0.836 (0.758, 0.921) < 0.05 FT4 0.950 (0.929, 0.971) < 0.05 0.939 (0.918, 0.961) < 0.05 0.937 (0.915, 0.959) < 0.05 FT3/FT4 50.220 (16.970, 148.700) < 0.05 4.895 (1.597, 15.005) 0.005 6.344 (2.018, 19.950) 0.002 TT3RI 1.005 (0.995, 1.014) 0.341 0.999 (0.989, 1.009) 0.847 0.999 (0.989, 1.009) 0.810 TT4RI 0.999 (0.996, 1.002) 0.568 0.999 (0.996, 1.002) 0.517 0.999 (0.996, 1.002) 0.442 TSHI 0.830 (0.756, 0.912) < 0.05 0.811 (0.737, 0.891) < 0.05 0.805 (0.732, 0.886) < 0.05 TFQIFT3 0.968 (0.844, 1.109) 0.636 0.739 (0.643, 0.894) < 0.05 0.741 (0.642, 0.855) < 0.05 TFQIFT4 0.720 (0.628, 0.825) < 0.05 0.697 (0.608, 0.799) < 0.05 0.687 (0.598, 0.791) < 0.05 Notes. Model 1: none (univariate); Model 2: adjusted for BMI, WC, TG, and LDL-C; Model 3: adjusted for variables in Model 2 and sex, age, SBP, DBP, and TC. MAFLD, metabolic-associated fatty liver disease; BMI, body mass index; WC, waist circumference; SBP, systolic blood pressure; DBP, diastolic blood pressure; TG, triglycerides; TC, total cholesterol; LDL-C, low-density lipoprotein cholesterol; TSH, thyrotropin (thyroid-stimulating hormone); FT3, free triiodothyronine; FT4, free thyroxine; TT3RI, thyrotrophic T3 resistance index; TT4RI, thyrotrophic T4 resistance index; TSHI, thyroid-stimulating hormone index; TFQI, thyroid feedback quantile-based index.
-
This prospective cohort study investigated the association between indices of central and peripheral sensitivity to thyroid hormones and MAFLD incidence. These results revealed that the incidence was 18.26% in the euthyroid population. The median follow-up period was 22 months. This incidence was slightly higher than that reported in previous reviews and related studies[18,19], which may be attributable to the older median age of the population in this study.
The MAFLD group was characterized by higher FT3, FT4, FT3/FT4, TT3RI, TSHI, TFQIFT3, and TFQIFT4 baseline levels compared to the non-MAFLD group. Higher FT3 levels, lower FT4 levels, and higher sensitivity to thyroid hormones (increased FT3/FT4 or decreased TT4RI, TSHI, TFQIFT4) are associated with an increased incidence of MAFLD after adjusting for multiple potential confounders. These findings differ from those of previous studies and provide novel insights into the relationship between thyroid hormone sensitivity and MAFLD. For instance, a previous study reported that higher FT4 levels were significantly associated with a lower prevalence of NAFLD in euthyroid older Chinese individuals, whereas no association was found between FT3 and TSH levels and NAFLD[20]. However, another study suggested that higher FT3 and lower TSH levels are independently associated with a greater NAFLD incidence in middle-aged and older euthyroid individuals[21]. This study found that lower FT4 and higher FT3 levels, but not TSH levels, were associated with a higher risk of MAFLD. This is consistent with previous findings[22]. The differences between the current and previous studies may be attributed to the complex interplay between thyroid hormone sensitivity indices and metabolic and environmental factors, which cannot be fully explained by population characteristics or confounders alone. Further mechanistic studies are required to elucidate the underlying pathways and their interactions.
FT3, FT4, and TSH levels are interrelated and mutually influence each other. In contrast to single indices, composite indices provide a more comprehensive assessment of the regulation of thyroid hormone homeostasis[23]. The FT3/FT4 ratio is an index reflecting peripheral sensitivity, with higher values indicating higher peripheral sensitivity to thyroid hormones[24]. This study found a positive association between the FT3/FT4 ratio and MAFLD incidence, which is consistent with previous cross-sectional findings[22,25]. A previous study enrolling 129 participants with NAFLD suggested that higher TFQIFT4 levels were associated with higher liver fibrosis prevalence without calculating TFQIFT3[26]. The current study found that TFQIFT4 was negatively, rather than positively, associated with the prevalence of MAFLD. However, further large-scale epidemiological studies are required to validate these findings, as TFQIFT3 and TFQIFT4 have only recently been introduced and have not yet garnered significant attention.
The mechanisms underlying the relationship between thyroid hormone sensitivity indices and MAFLD are not fully understood but likely involve multiple interrelated pathways, including chronic inflammation, mitochondrial dysfunction, endoplasmic reticulum (ER) stress, insulin resistance, and dysregulated lipid metabolism[27–31]. Chronic inflammation is a key driver in MAFLD pathogenesis[28], with studies demonstrating that low FT4 levels are associated with elevated inflammatory biomarkers, such as tumor necrosis factor-alpha (TNF-α), interleukin-1 (IL-1), interleukin-6 (IL-6), and interferon-γ, which may exacerbate hepatic lipid accumulation[31–33]. Additionally, low-normal FT4 levels may exacerbate liver fat accumulation by influencing proinflammatory pathways[31]. Thyroid hormones also regulate hepatic fatty acid uptake, lipogenesis, and lipolysis; alterations in thyroid hormone levels can thus affect both systemic metabolism and local liver function[34–37]. Furthermore, thyroid hormone dysregulation may induce ER stress and insulin resistance via upregulation of ER-associated proteins, further promoting the progression of MAFLD[27,38–41]. Collectively, these findings suggest that impaired thyroid hormone sensitivity contributes to MAFLD via synergistic metabolic and inflammatory pathways. Future studies, particularly mechanistic and longitudinal investigations, are warranted to clarify causal relationships and explore potential therapeutic targets in the thyroid-liver axis.
The TyG index, calculated as the product of FPG and TG, has been developed and validated as a reliable surrogate marker for IR[42,43]. Accumulating evidence suggests that an elevated TyG index is associated with an increased risk of various metabolic diseases, including T2DM[44], MAFLD[45,46], liver fibrosis[47], and CVD[48]. Mediation analyses indicated that the TyG index partially mediated the association between sensitivity to thyroid hormones (FT3/FT4 and TFQIFT4) and MAFLD in the euthyroid population. Notably, a classical suppressive effect of TFQIFT4 was observed. Although TFQIFT4 exhibited an overall protective effect against MAFLD, it simultaneously increased TyG levels, which in turn increased the risk of MAFLD. This opposing pathway suppressed the full protective potential of TFQIFT4, revealing its complex dual role in MAFLD pathogenesis. The paradoxical finding that both FT3/FT4 and TFQIFT4 increase TyG levels but exert opposite effects on MAFLD risk can be explained by their distinct additional mechanisms beyond insulin resistance. FT3/FT4 may promote MAFLD through direct lipogenic effects on hepatocytes and alterations in energy expenditure that favor hepatic fat accumulation. Conversely, TFQIFT4, a marker of central thyroid resistance, may confer hepatic protection through mechanisms that enhance systemic metabolic homeostasis, promote lipid oxidative capacity, and exert anti-inflammatory effects, thereby counterbalancing its inherent potential to exacerbate insulin resistance. These results imply that insulin resistance, represented by the TyG index, constitutes an important but incomplete pathway through which variations in thyroid hormone sensitivity influence the risk of MAFLD. These findings highlight the intricate balance between the thyroid-mediated risk and protective mechanisms, suggesting that the net effect on MAFLD depends on the predominant pathway activated by different thyroid parameters.
The current study has several strengths, such as the use of the scarcely investigated TFQI and the recently proposed definition of MAFLD; however, several limitations remain. First, the evaluation of hepatic steatosis was based on ultrasonographic examination, which is not sufficiently sensitive to detect mild steatosis (< 30%). Second, this was a single-center study, which may have introduced a center-specific bias. Further multicenter studies are required to validate these findings in different settings. Third, the study population exclusively consisted of Chinese participants. Differences in genetic backgrounds, lifestyles, dietary patterns, and environmental exposure across populations may have affected the relationship between thyroid hormone sensitivity and MAFLD, thereby limiting the generalizability of our results. Multicenter, multiethnic, and longitudinal studies are essential to confirm and extend these observations. Additionally, the mediating role of the TyG index should be interpreted with caution, as it is a surrogate marker that may reflect broader metabolic dysfunction beyond insulin resistance. Finally, nutritional factors such as iodine intake or trace element levels, which have been shown to influence thyroid function and metabolic health, were not assessed[7–9]. Future studies should incorporate these measures to better understand the complex interactions among thyroid sensitivity, metabolic dysfunction, and environmental exposure.
In summary, it was demonstrated that FT3/FT4 was positively associated with the incidence of MAFLD, and TFQIFT4 was negatively associated with the incidence of MAFLD in Chinese euthyroid adults. The possible predictive effect of TFQIFT4 on MAFLD should be considered. However, further large-scale multicenter prospective cohort studies are needed to confirm this conclusion.
doi: 10.3967/bes2026.005
Association Between Sensitivity to Thyroid Hormones and Metabolic Dysfunction-Associated Fatty Liver Disease: A Cohort Study
-
Abstract:
Objective To investigate the association between thyroid hormone sensitivity indices and metabolic dysfunction-associated fatty liver disease (MAFLD) in euthyroid Chinese adults. Methods This cohort study included 5,356 euthyroid patients. The peripheral and central thyroid hormone sensitivity indices were calculated. Cox regression models were used to evaluate associations with MAFLD risk, and restricted cubic splines were used to assess potential nonlinearity. Mediation analyses based on an accelerated failure-time model were used to examine the role of the triglyceride-glucose (TyG) index. Results MAFLD incidence in euthyroid participants was 18.26%. After adjustment, higher free thyroxine (FT4) levels were inversely associated with MAFLD (HR = 0.973, 95% CI: 0.948 to 0.999, P = 0.043), whereas higher free triiodothyronine (FT3) levels increased MAFLD risk (HR = 1.118, 95% CI: 1.000 to 1.250, P = 0.050). Enhanced thyroid hormone sensitivity, as reflected by elevated FT3/FT4 levels and lower thyrotrophic T4 resistance index (TT4RI), thyroid stimulating hormone index (TSHI), and thyroid feedback quantile-based index (TFQIFT4), was also associated with a higher incidence (all P < 0.05). Mediation analyses indicated that TyG partially mediated the FT3/FT4–MAFLD and TFQIFT4–MAFLD associations, with indirect effects of -96.27 (95% CI: -124.67 to -70.42) and -4.95 (95% CI: -8.29 to -2.10), respectively. Conclusion Increased FT3/FT4 and decreased TFQIFT4 levels were significantly associated with a higher MAFLD risk in euthyroid adults, with TyG acting as a partial mediator. -
Key words:
- Metabolic dysfunction-associated fatty liver disease /
- Sensitivity to thyroid hormone /
- Triglyceride glucose index /
- Mediation effect /
- Cohort study
The authors declare that there are no conflicts of interest.
The study was approved by the Ethics Committee of the Capital Medical University (number: Z2020SY120). Informed consent was obtained from the participants to participate in this study.
注释:1) Authors’ Contributions: 2) Competing Interests: 3) Ethics: -
Figure 2. Nonlinear relationships of thyroid sensitivity indices with MAFLD. Restricted cubic spline (RCS) analysis was conducted. (A) FT3/FT4 and MAFLD (B) TT3RI and MAFLD (C) TT4RI and MAFLD (D) TSHI and MAFLD (E) TFQIFT3 and MAFLD (F) TFQIFT4 and MAFLD. The model was adjusted for sex, age, BMI, WC, SBP, DBP, TG, TC, and LDL-C.
Figure 3. Mediation effect of TyG index on the associations between FT3/FT4, TFQIFT4, and MAFLD (A) FT3/FT4; (B) TFQIFT4.
Table 1. Characteristics of the study participants with and without MAFLD
Characteristic Total
(N = 5,356)MAFLD
(N = 978)Non-MAFLD
(N = 4,378)P-value Men, n% 2174 (40.59) 584 (59.71) 1590 (36.32) < 0.05 Age, years 42.00 (34.00
, 51.00)45.00 (37.00, 55.00) 41.00 (33.00, 51.00) < 0.05 BMI, kg/m2 22.91 ± 2.88 25.14 ± 2.56 22.41 ± 2.71 < 0.05 WC, cm 77.48 ± 9.48 84.65 ± 8.43 75.88 ± 8.95 < 0.05 SBP, mmHg 116.00 (107.00, 128.00) 120.00 (110.00, 133.00) 114.00 (106.00, 126.00) < 0.05 DBP, mmHg 71.00 (65.00, 80.00) 77.00 (70.00, 83.00) 70.00 (64.00, 80.00) < 0.05 FPG, mmol/L 5.04 (4.77, 5.38) 5.23 (4.94, 5.63) 5.00 (4.74, 5.33) < 0.05 TG, mmol/L 0.93 (0.68, 1.32) 1.29 (0.93, 1.72) 0.87 (0.64, 1.21) < 0.05 TC, mmol/L 4.75 (4.20, 5.36) 4.83 (4.28, 5.51) 4.74 (4.19, 5.33) < 0.05 HDL-C, mmol/L 1.40 (1.19, 1.63) 1.24 (1.08, 1.42) 1.44 (1.23, 1.67) < 0.05 LDL-C, mmol/L 2.73 (2.26, 3.23) 2.90 (2.42, 3.42) 2.69 (2.23, 3.18) < 0.05 ALT, U/L 14.70 (11.00, 20.00) 17.00 (13.00, 24.00) 14.00 (10.50, 19.00) < 0.05 AST, U/L 17.00 (14.00, 20.00) 17.00 (15.00, 21.00) 16.00 (14.00, 20.00) < 0.05 TSH, mIU/L 1.96 (1.43, 2.70) 1.97 (1.43, 2.64) 1.96 (1.43, 2.71) 0.644 FT3, pmol/L 4.49 (4.12, 4.89) 4.65 (4.26, 5.04) 4.46 (4.09, 4.85) < 0.05 FT4, pmol/L 13.94 (12.30, 16.44) 14.56 (12.48, 16.73) 13.80 (12.26, 16.34) < 0.05 FT3/FT4 0.31 (0.28, 0.35) 0.32 (0.28, 0.36) 0.31 (0.28, 0.35) 0.008 TT3RI 8.78 (6.29, 12.24) 9.21 (6.48, 12.37) 8.70 (6.24, 12.20) 0.035 TT4RI 27.70 (19.66, 39.91) 28.61 (20.05, 39.44) 27.49 (19.54, 40.00) 0.274 TSHI 2.60 (2.20, 3.04) 2.67 (2.25, 3.04) 2.59 (2.19, 3.04) 0.027 TFQIFT3 0.01 (-0.29, 0.30) 0.09 (-0.21, 0.37) -0.01 (-0.31, 0.28) < 0.05 TFQIFT4 0.00 (-0.31, 0.32) 0.05 (-0.26, 0.34) -0.01 (-0.32, 0.32) 0.008 Note. The continuous variables that obey the normal distribution are displayed as mean±standard deviation (x ± s), and the t-test was used for comparison between groups. Continuous variables that did not obey the normal distribution were presented as median and quartile interval forms [M (P25, P75)].  下载: 导出CSV
Table 2. Relationship between sensitivity indices to thyroid hormones and MAFLD incidence in different models
Thyroid
parametersModel 1 Model 2 Model 3 HR (95% CI) P-value HR (95% CI) P-value HR (95% CI) P-value TSH 0.922 (0.865, 0.984) 0.014 0.943 (0.883, 1.006) 0.077 0.943 (0.883, 1.008) 0.085 FT3 1.455 (1.315, 1.609) < 0.05 1.115 (1.008, 1.234) 0.035 1.118 (1.000, 1.250) 0.050 FT4 0.989 (0.965, 1.014) 0.400 0.983 (0.958, 1.008) 0.178 0.973 (0.948, 0.999) 0.043 FT3/FT4 98.530 (30.370, 319.600) < 0.05 9.299 (2.715, 31.851) < 0.05 14.287 (3.999, 51.042) < 0.05 TT3RI 0.997 (0.984, 1.010) 0.645 0.992 (0.979, 1.006) 0.259 0.992 (0.978, 1.006) 0.242 TT4RI 0.995 (0.991, 0.999) 0.016 0.996 (0.992, 1.000) 0.040 0.995 (0.991, 1.000) 0.025 TSHI 0.882 (0.789, 0.986) 0.027 0.891 (0.797, 0.995) 0.041 0.869 (0.776, 0.974) 0.016 TFQIFT3 1.296 (1.111, 1.513) < 0.05 1.009 (0.864, 1.180) 0.907 0.993 (0.844, 1.168) 0.929 TFQIFT4 0.830 (0.711, 0.968) 0.018 0.841 (0.721, 0.982) 0.029 0.806 (0.688, 0.945) 0.008 Notes. Model 1: none (univariate); Model 2: adjusted for BMI, WC, TG, and LDL-C; Model 3: adjusted for variables in Model 2 and sex, age, SBP, DBP, and TC.
下载: 导出CSV
Table 3. Sensitivity Analysis of the Relationship between sensitivity indices to thyroid hormones and MAFLD incidence in different models
Thyroid
parametersModel 1 Model 2 Model 3 HR (95% CI) P-value HR (95% CI) P-value HR (95% CI) P-value TSH 1.017 (0.971, 1.065) 0.478 1.024 (0.977, 1.073) 0.317 1.020 (0.973, 1.069) 0.413 FT3 1.112 (1.015, 1.217) 0.022 0.840 (0.768, 0.919) < 0.05 0.836 (0.758, 0.921) < 0.05 FT4 0.950 (0.929, 0.971) < 0.05 0.939 (0.918, 0.961) < 0.05 0.937 (0.915, 0.959) < 0.05 FT3/FT4 50.220 (16.970, 148.700) < 0.05 4.895 (1.597, 15.005) 0.005 6.344 (2.018, 19.950) 0.002 TT3RI 1.005 (0.995, 1.014) 0.341 0.999 (0.989, 1.009) 0.847 0.999 (0.989, 1.009) 0.810 TT4RI 0.999 (0.996, 1.002) 0.568 0.999 (0.996, 1.002) 0.517 0.999 (0.996, 1.002) 0.442 TSHI 0.830 (0.756, 0.912) < 0.05 0.811 (0.737, 0.891) < 0.05 0.805 (0.732, 0.886) < 0.05 TFQIFT3 0.968 (0.844, 1.109) 0.636 0.739 (0.643, 0.894) < 0.05 0.741 (0.642, 0.855) < 0.05 TFQIFT4 0.720 (0.628, 0.825) < 0.05 0.697 (0.608, 0.799) < 0.05 0.687 (0.598, 0.791) < 0.05 Notes. Model 1: none (univariate); Model 2: adjusted for BMI, WC, TG, and LDL-C; Model 3: adjusted for variables in Model 2 and sex, age, SBP, DBP, and TC.
下载: 导出CSV
-
[1] Eslam M, Newsome PN, Sarin SK, et al. A new definition for metabolic dysfunction-associated fatty liver disease: an international expert consensus statement. J Hepatol, 2020; 73, 202−9. doi: 10.1016/j.jhep.2020.03.039 [2] Eslam M, Sanyal AJ, George J, et al. MAFLD: a consensus-driven proposed nomenclature for metabolic associated fatty liver disease. Gastroenterology, 2020; 158, 1999-2014. e1. [3] Pais R, Fartoux L, Goumard C, et al. Temporal trends, clinical patterns and outcomes of NAFLD-related HCC in patients undergoing liver resection over a 20-year period. Aliment Pharmacol Ther, 2017; 46, 856−63. doi: 10.1111/apt.14261 [4] Ledford H. First US drug approved for a liver disease surging around the world. Nature, 2024. [5] Liu JY, Ayada I, Zhang XF, et al. Estimating global prevalence of metabolic dysfunction-associated fatty liver disease in overweight or obese adults. Clin Gastroenterol Hepatol, 2022; 20, e573−82. doi: 10.1016/j.cgh.2021.02.030 [6] Qiu L, Wang DC, Xu T, et al. Influence of gender, age and season on thyroid hormone reference interval. Natl Med J China, 2018; 98, 1582−7. (In Chinese) [7] Shan XY, Zou Y, Huang LC, et al. Iodine nutrition, thyroid-stimulating hormone, and related factors of postpartum women from three different areas in China: a cross-sectional survey. Biomed Environ Sci, 2024; 37, 254−65. [8] Li XZ, Wu CL, Cen LT, et al. Association of thyroid nodules with various elements in urine and blood serum: a case-control study. Biomed Environ Sci, 2024; 37, 320−4. [9] Wang LJ, Wu JN, Wu XY, et al. Thyroid nodule prevalence and iodine nutrition: influencing factors in coastal areas. Biomed Environ Sci, 2024; 37, 1221−6. [10] Sinha RA, Singh BK, Yen PM. Direct effects of thyroid hormones on hepatic lipid metabolism. Nat Rev Endocrinol, 2018; 14, 259−69. doi: 10.1038/nrendo.2018.10 [11] Ludwig U, Holzner D, Denzer C, et al. Subclinical and clinical hypothyroidism and non-alcoholic fatty liver disease: a cross-sectional study of a random population sample aged 18 to 65 years. BMC Endocr Disord, 2015; 15, 41. doi: 10.1186/s12902-015-0030-5 [12] Laclaustra M, Moreno-Franco B, Lou-Bonafonte JM, et al. Impaired sensitivity to thyroid hormones is associated with diabetes and metabolic syndrome. Diabetes Care, 2019; 42, 303−10. doi: 10.2337/dc18-1410 [13] Yang SJ, Lai SQ, Wang ZX, et al. Thyroid feedback quantile-based index correlates strongly to renal function in euthyroid individuals. Ann Med, 2021; 53, 1945−55. doi: 10.1080/07853890.2021.1993324 [14] Yagi H, Pohlenz J, Hayashi Y, et al. Resistance to thyroid hormone caused by two mutant thyroid hormone receptors beta, R243Q and R243W, with marked impairment of function that cannot be explained by altered in vitro 3, 5, 3’-triiodothyroinine binding affinity. J Clin Endocrinol Metab, 1997; 82, 1608−14. [15] Jostel A, Ryder WDJ, Shalet SM. The use of thyroid function tests in the diagnosis of hypopituitarism: definition and evaluation of the TSH Index. Clin Endocrinol, 2009; 71, 529−34. doi: 10.1111/j.1365-2265.2009.03534.x [16] Zhang SJ, Du TT, Zhang JH, et al. The triglyceride and glucose index (TyG) is an effective biomarker to identify nonalcoholic fatty liver disease. Lipids Health Dis, 2017; 16, 15. doi: 10.1186/s12944-017-0409-6 [17] Li YZ, Teng D, Shi XG, et al. Prevalence of diabetes recorded in mainland China using 2018 diagnostic criteria from the American Diabetes Association: national cross sectional study. BMJ, 2020; 369, m997. [18] Miao L, Targher G, Byrne CD, et al. Current status and future trends of the global burden of MASLD. Trends Endocrinol Metab, 2024; 35, 697−707. doi: 10.1016/j.tem.2024.02.007 [19] Han XY, Guo B, Wang LL, et al. The mediation role of blood lipids on the path from air pollution exposure to MAFLD: a longitudinal cohort study. Sci Total Environ, 2023; 904, 166347. doi: 10.1016/j.scitotenv.2023.166347 [20] Xu CF, Xu L, Yu CH, et al. Association between thyroid function and nonalcoholic fatty liver disease in euthyroid elderly Chinese. Clin Endocrinol, 2011; 75, 240−6. doi: 10.1111/j.1365-2265.2011.04016.x [21] Gu YQ, Wu XH, Zhang Q, et al. High-normal thyroid function predicts incident nonalcoholic fatty liver disease among middle-aged and older euthyroid subjects. J Gerontol A Biol Sci Med Sci, 2022; 77, 197−203. doi: 10.1093/gerona/glab037 [22] Wan H, Yu GF, Xu SR, et al. Central sensitivity to free triiodothyronine with MAFLD and its progression to liver fibrosis in euthyroid adults. J Clin Endocrinol Metab, 2023; 108, e687−97. doi: 10.1210/clinem/dgad186 [23] Sun HL, Zhu W, Liu J, et al. Reduced sensitivity to thyroid hormones is associated with high remnant cholesterol levels in Chinese euthyroid adults. J Clin Endocrinol Metab, 2022; 108, 166−74. doi: 10.1210/clinem/dgac523 [24] Lang XY, Zhao B, Fang SH, et al. Higher peripheral thyroid sensitivity is linked to a lower risk of heart failure after acute myocardial infarction. J Clin Endocrinol Metab, 2023; 108, 2950−60. doi: 10.1210/clinem/dgad240 [25] Lai SQ, Li JR, Wang ZX, et al. Sensitivity to thyroid hormone indices are closely associated with NAFLD. Front Endocrinol, 2021; 12, 766419. doi: 10.3389/fendo.2021.766419 [26] Li RF, Zhou L, Chen C, et al. Sensitivity to thyroid hormones is associated with advanced fibrosis in euthyroid patients with non-alcoholic fatty liver disease: a cross-sectional study. Dig Liver Dis, 2023; 55, 254−61. doi: 10.1016/j.dld.2022.06.021 [27] Bektur Aykanat NE, Şahin E, Kaçar S, et al. Investigation of the effect of hyperthyroidism on endoplasmic reticulum stress and tran- sient receptor potential canonical 1 channel in the kidney. Turk J Med Sci, 2021; 51, 1554−63. [28] Lim S, Kim JW, Targher G. Links between metabolic syndrome and metabolic dysfunction-associated fatty liver disease. Trends Endocrinol Metab, 2021; 32, 500−14. doi: 10.1016/j.tem.2021.04.008 [29] Taylor PN, Razvi S, Pearce SH, et al. A review of the clinical consequences of variation in thyroid function within the reference range. J Clin Endocrinol Metab, 2013; 98, 3562−71. doi: 10.1210/jc.2013-1315 [30] Sinha RA, Yen PM. Thyroid hormone-mediated autophagy and mitochondrial turnover in NAFLD. Cell Biosci, 2016; 6, 46. doi: 10.1186/s13578-016-0113-7 [31] van Tienhoven-Wind LJN, Dullaart RPF. Tumor necrosis factor-α is inversely related to free thyroxine in euthyroid subjects without diabetes. Horm Metab Res, 2017; 49, 95−102. [32] Marchiori RC, Pereira LAF, Naujorks AA, et al. Improvement of blood inflammatory marker levels in patients with hypothyroidism under levothyroxine treatment. BMC Endocr Disord, 2015; 15, 32. doi: 10.1186/s12902-015-0032-3 [33] Milani AT, Khadem-Ansari MH, Rasmi Y. Effects of thyroxine on adhesion molecules and proinflammatory cytokines secretion on human umbilical vein endothelial cells. Res Pharm Sci, 2019; 14, 237−46. doi: 10.4103/1735-5362.258490 [34] Könner AC, Brüning JC. Toll-like receptors: linking inflammation to metabolism. Trends Endocrinol Metab, 2011; 22, 16−23. doi: 10.1016/j.tem.2010.08.007 [35] Hribal ML, Procopio T, Petta S, et al. Insulin-like growth factor-I, inflammatory proteins, and fibrosis in subjects with nonalcoholic fatty liver disease. J Clin Endocrinol Metab, 2013; 98, E304−8. doi: 10.1210/jc.2012-3290 [36] Hollenberg AN. The role of the thyrotropin-releasing hormone (TRH) neuron as a metabolic sensor. Thyroid, 2008; 18, 131−9. doi: 10.1089/thy.2007.0251 [37] de Moura Souza A, Sichieri R. Association between serum TSH concentration within the normal range and adiposity. Eur J Endocrinol, 2011; 165, 11−5. doi: 10.1530/EJE-11-0261 [38] Filali-Mouncef Y, Hunter C, Roccio F, et al. The ménage à trois of autophagy, lipid droplets and liver disease. Autophagy, 2022; 18, 50−72. doi: 10.1080/15548627.2021.1895658 [39] Lebeaupin C, Vallée D, Hazari Y, et al. Endoplasmic reticulum stress signalling and the pathogenesis of non-alcoholic fatty liver disease. J Hepatol, 2018; 69, 927−47. doi: 10.1016/j.jhep.2018.06.008 [40] Kammoun HL, Chabanon H, Hainault I, et al. GRP78 expression inhibits insulin and ER stress-induced SREBP-1c activation and reduces hepatic steatosis in mice. J Clin Invest, 2009; 119, 1201−15. doi: 10.1172/JCI37007 [41] Nakatani Y, Kaneto H, Kawamori D, et al. Involvement of endoplasmic reticulum stress in insulin resistance and diabetes. J Biol Chem, 2005; 280, 847−51. doi: 10.1074/jbc.M411860200 [42] Du TT, Yuan G, Zhang MX, et al. Clinical usefulness of lipid ratios, visceral adiposity indicators, and the triglycerides and glucose index as risk markers of insulin resistance. Cardiovasc Diabetol, 2014; 13, 146. doi: 10.1186/s12933-014-0146-3 [43] Simental-Mendía LE, Rodríguez-Morán M, Guerrero-Romero F. The product of fasting glucose and triglycerides as surrogate for identifying insulin resistance in apparently healthy subjects. Metab Syndr Relat Disord, 2008; 6, 299−304. doi: 10.1089/met.2008.0034 [44] Low S, Khoo KCJ, Irwan B, et al. The role of triglyceride glucose index in development of Type 2 diabetes mellitus. Diabetes Res Clin Pract, 2018; 143, 43−9. doi: 10.1016/j.diabres.2018.06.006 [45] Zhang R, Guan Q, Zhang MT, et al. Association between triglyceride-glucose index and risk of metabolic dysfunction-associated fatty liver disease: a cohort study. Diabetes Metab Syndr Obes, 2022; 15, 3167−79. doi: 10.2147/DMSO.S383907 [46] Taheri E, Pourhoseingholi MA, Moslem A, et al. The triglyceride-glucose index as a clinical useful marker for metabolic associated fatty liver disease (MAFLD): a population-based study among Iranian adults. J Diabetes Metab Disord, 2022; 21, 97−107. doi: 10.1007/s40200-021-00941-w [47] Tutunchi H, Naeini F, Mobasseri M, et al. Triglyceride glucose (TyG) index and the progression of liver fibrosis: a cross-sectional study. Clin Nutr ESPEN, 2021; 44, 483−7. doi: 10.1016/j.clnesp.2021.04.025 [48] Sánchez-Íñigo L, Navarro-González D, Fernández-Montero A, et al. The TyG index may predict the development of cardiovascular events. Eur J Clin Invest, 2016; 46, 189−97. doi: 10.1111/eci.12583 -

 点击查看大图
计量
- 文章访问数: 25
- HTML全文浏览量: 10
- PDF下载量: 0
- 被引次数: 0

 Quick Links