

 下载:
下载:


-
Heart failure (HF) is a clinical syndrome caused by structural and/or functional cardiac abnormalities. HF is characterized by significant morbidity, mortality and a high economic burden, with the prevalence and years lived with disability rates of 711.90 and 63.92 per 100,000 population in 2019[1], affecting approximately 64 million patients. Furthermore, the prevalence of HF is estimated to increase due to an aging population[2].
HF is induced by several aspects of risk factors such as traditional cardiometabolic factors, lifestyle factors, genetic and epigenetic factors, etc. HF has substantial heritability of approximately 15%–35%[3,4]. More than 50 susceptibility loci for HF have been identified in genome-wide association studies (GWASs) in different populations[5-7]. In a GWAS of over 90,000 HF cases and more than one million control individuals, seven proteins were identified as potential targets for preventative interventions[7]. The next challenge is to determine the roles of these variants in RNA regulation. Distinct regions of single nucleotide polymorphisms (SNP) affect RNA modifications in various ways, such as by changing modifiable nucleotides at modified positions or altering nucleotides around the modified sites, thereby indirectly influencing RNA modifications and their functions[8].
In the last few decades, an increasing body of evidence has shown that RNA translation is significantly influenced by epigenetic modifications and transcription factors. Indeed, N6-methyladenosine (m6A) is one of the most common post-transcriptional modifications in eukaryotes. More than 170 RNA modifications were identified, among which m6A was found to mediate over 80% of RNA methylation[9], and play roles in mRNA, rRNA, snRNA, and lncRNA regulation[10]. The progression of m6A modification is dynamic and reversible, and three protein regulators participate in this process: m6A methyltransferases (writers), m6A binding proteins (readers), and demethylases (erasers). These affect mRNA stability[11], splicing[12], translation[13], nuclear export[14], and other processes involved in various stages of the RNA lifecycle. Consequently, m6A modification plays roles in the occurrence and development of various diseases.
Recent evidences have shown that m6A is a candidate biomarker and therapeutic target for cardiovascular diseases. Additionally, the landscape of m6A has been observed to be altered in HF[15], and multiple studies have indicated that m6A influences a wide range of diseases in its progression, such as atherosclerosis, cardiac hypertrophy, and myocardial infarction[16]. For example, methyltransferase-like 14 (METTL14) promotes forkhead box O1 (FOXO1) expression by enhancing its m6A modification, inducing an endothelial cell inflammatory response and atherosclerotic plaque formation[17]. Moreover, the association between m6A modifications and gene expression in whole-transcriptome m6A confirmed that genetic variants influence m6A by changing the RNA sequences at the modifiable position or in the flanking region[8]. However, whether m6A-SNPs affect HF remains unclear. Therefore, in this study, we aimed to identify and annotate HF-associated m6A-SNPs. First, we explored HF-associated m6A-SNPs in GWAS and m6A datasets. We then evaluated the effects of these variants on gene expression using expression quantitative trait locus (eQTL) and gene expression analyses, which further supported the regulatory effect of the mutation sites. Finally, we conducted Mendelian randomization (MR) analyses to clarify the genetic relationships between these genes and HF risk factors.
-
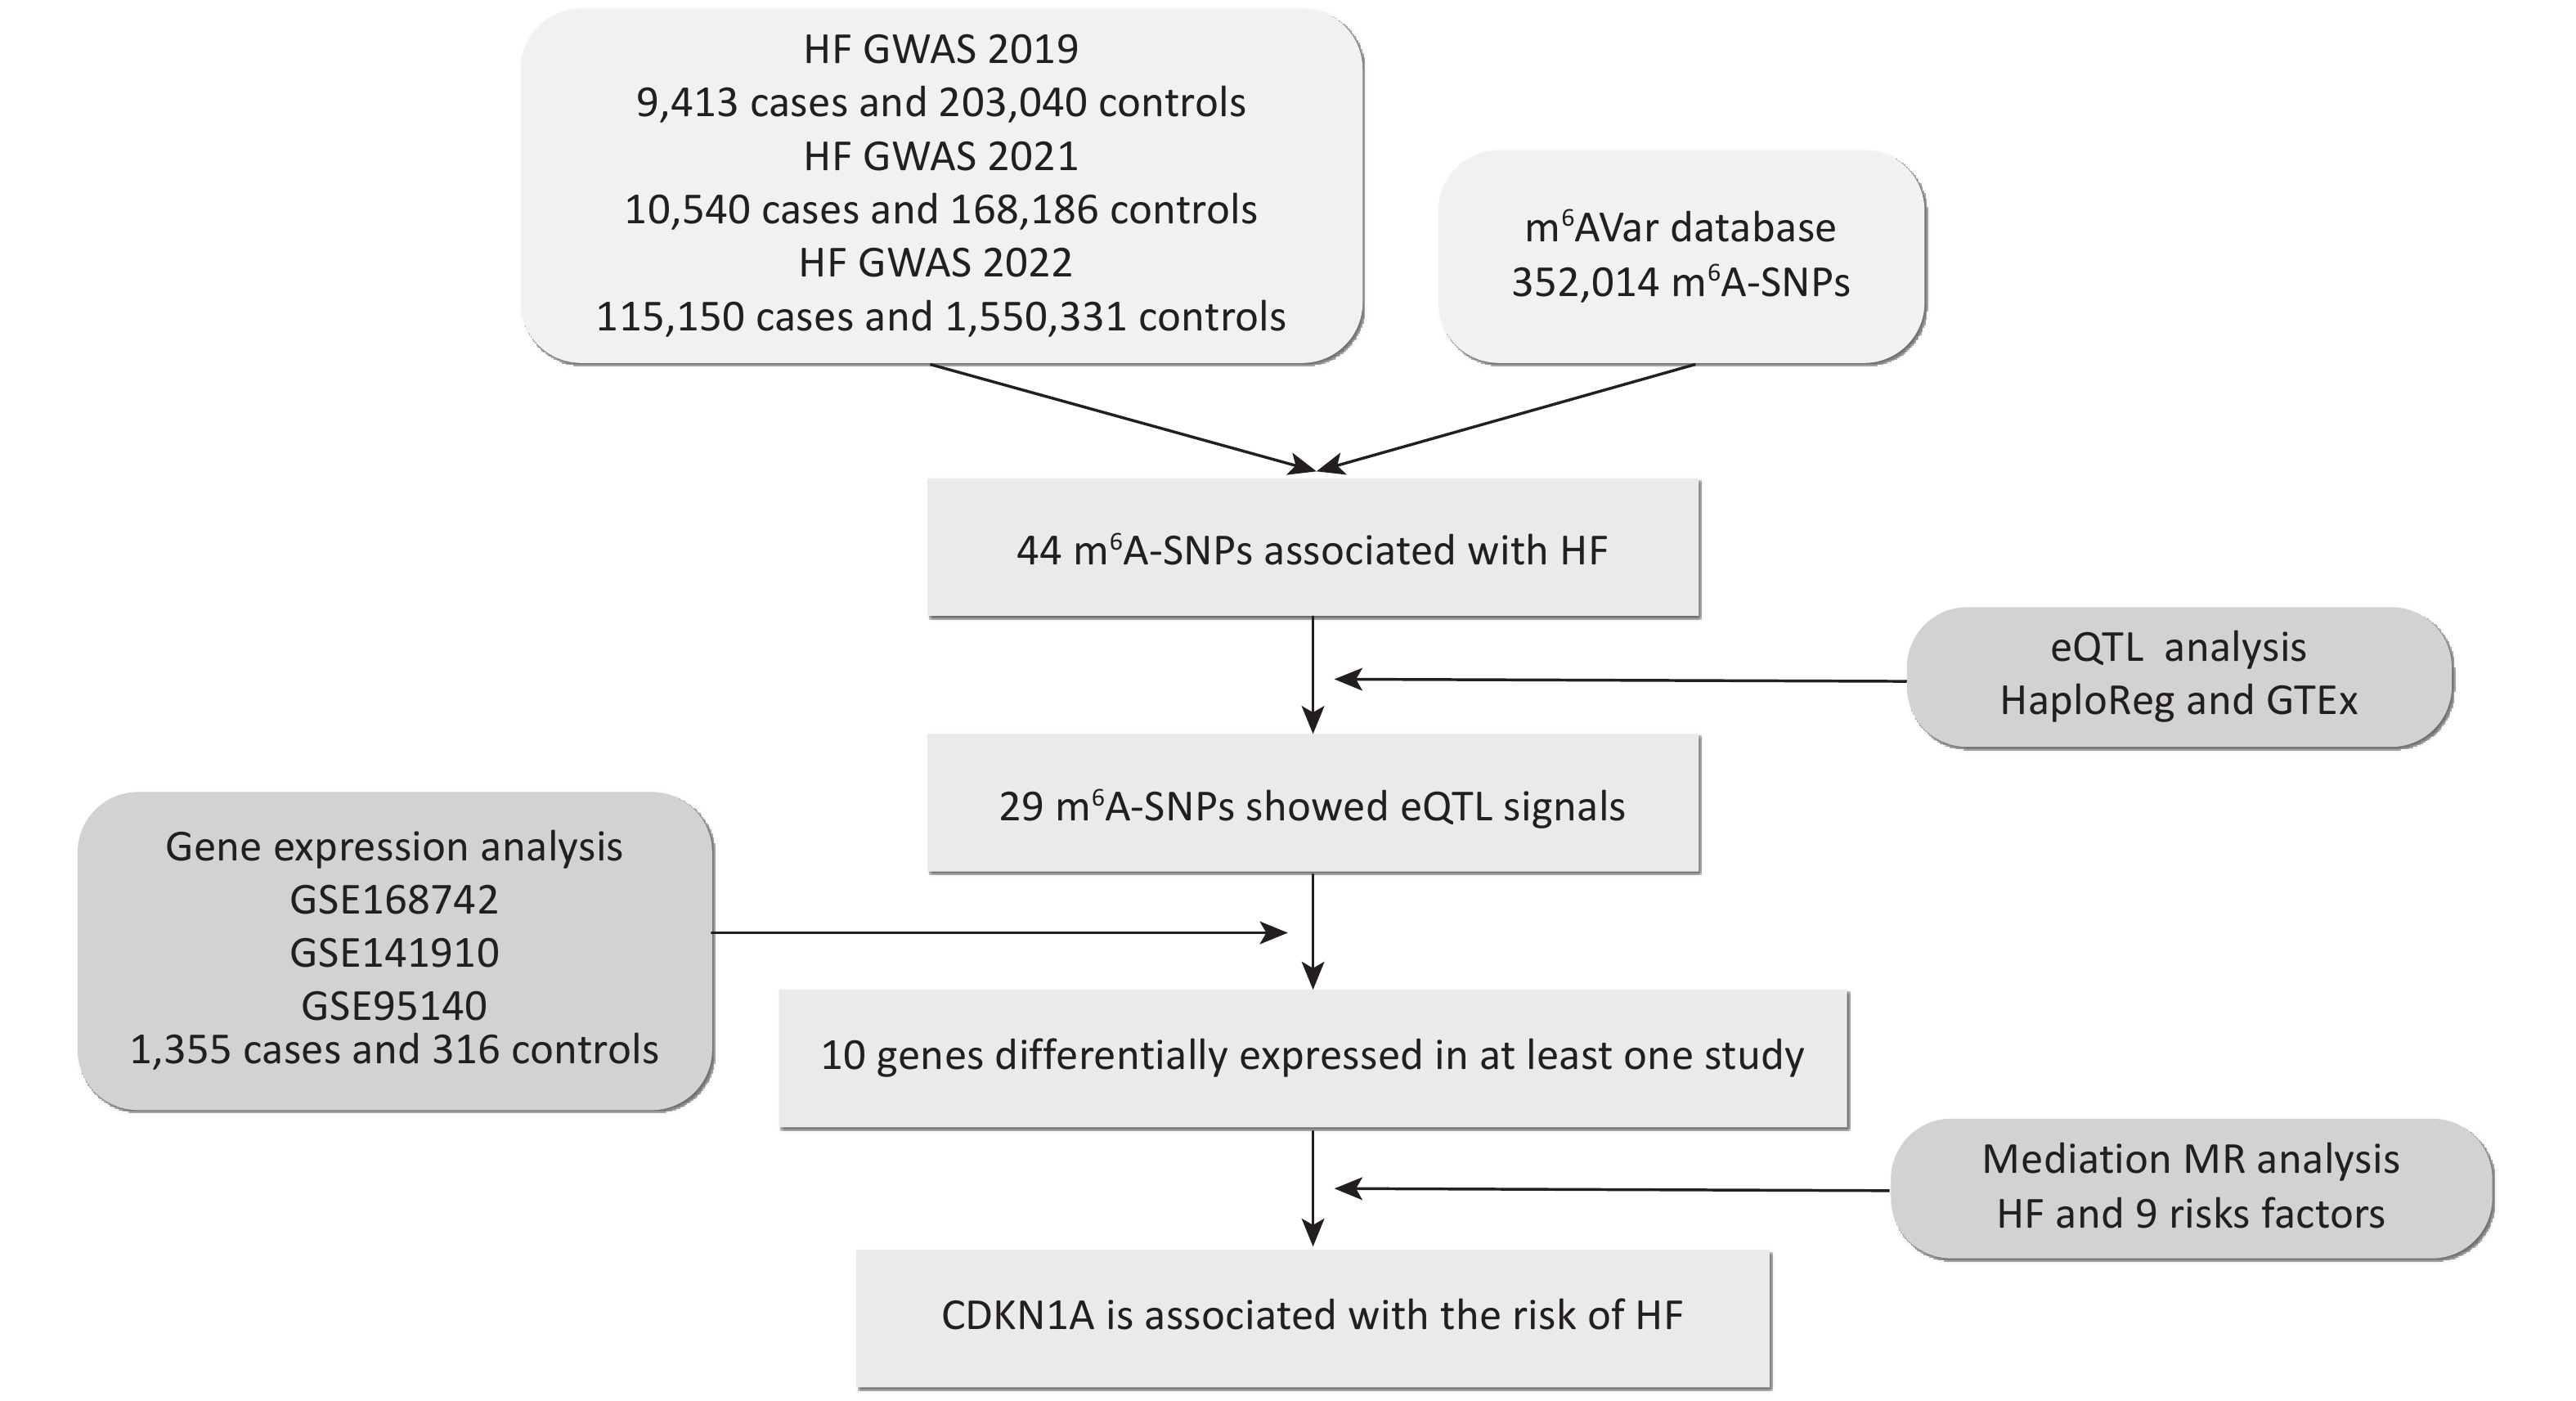
To explore the predominant m6A-SNPs associated with HF, we overlapped the published GWAS and m6A-SNP data (Figure 1). A total of 352,014 genetic variants from different populations (mainly European and Asian) were downloaded from the m6AVar database (m6avar.renlab.org/download.html)[18], which included functional variants involved in RNA modifications. The m6A-SNPs were divided into three confidence levels: 1) high confidence, with variants located near the RNA modification sites and verified by immunoprecipitation (mi CLIP) or photo-crosslinking-assisted m6A sequencing (PA-m6A-seq) experiments; 2) medium confidence, with modification sites generated from methylated RNA immunoprecipitation (MeRIP-Seq) experiments; and 3) low medium confidence, with predictions based on the random forest algorithm performed from sequences around all variants from Single Nucleotide Polymorphism Database (dbSNP) and The Cancer Genome Atlas (TCGA).
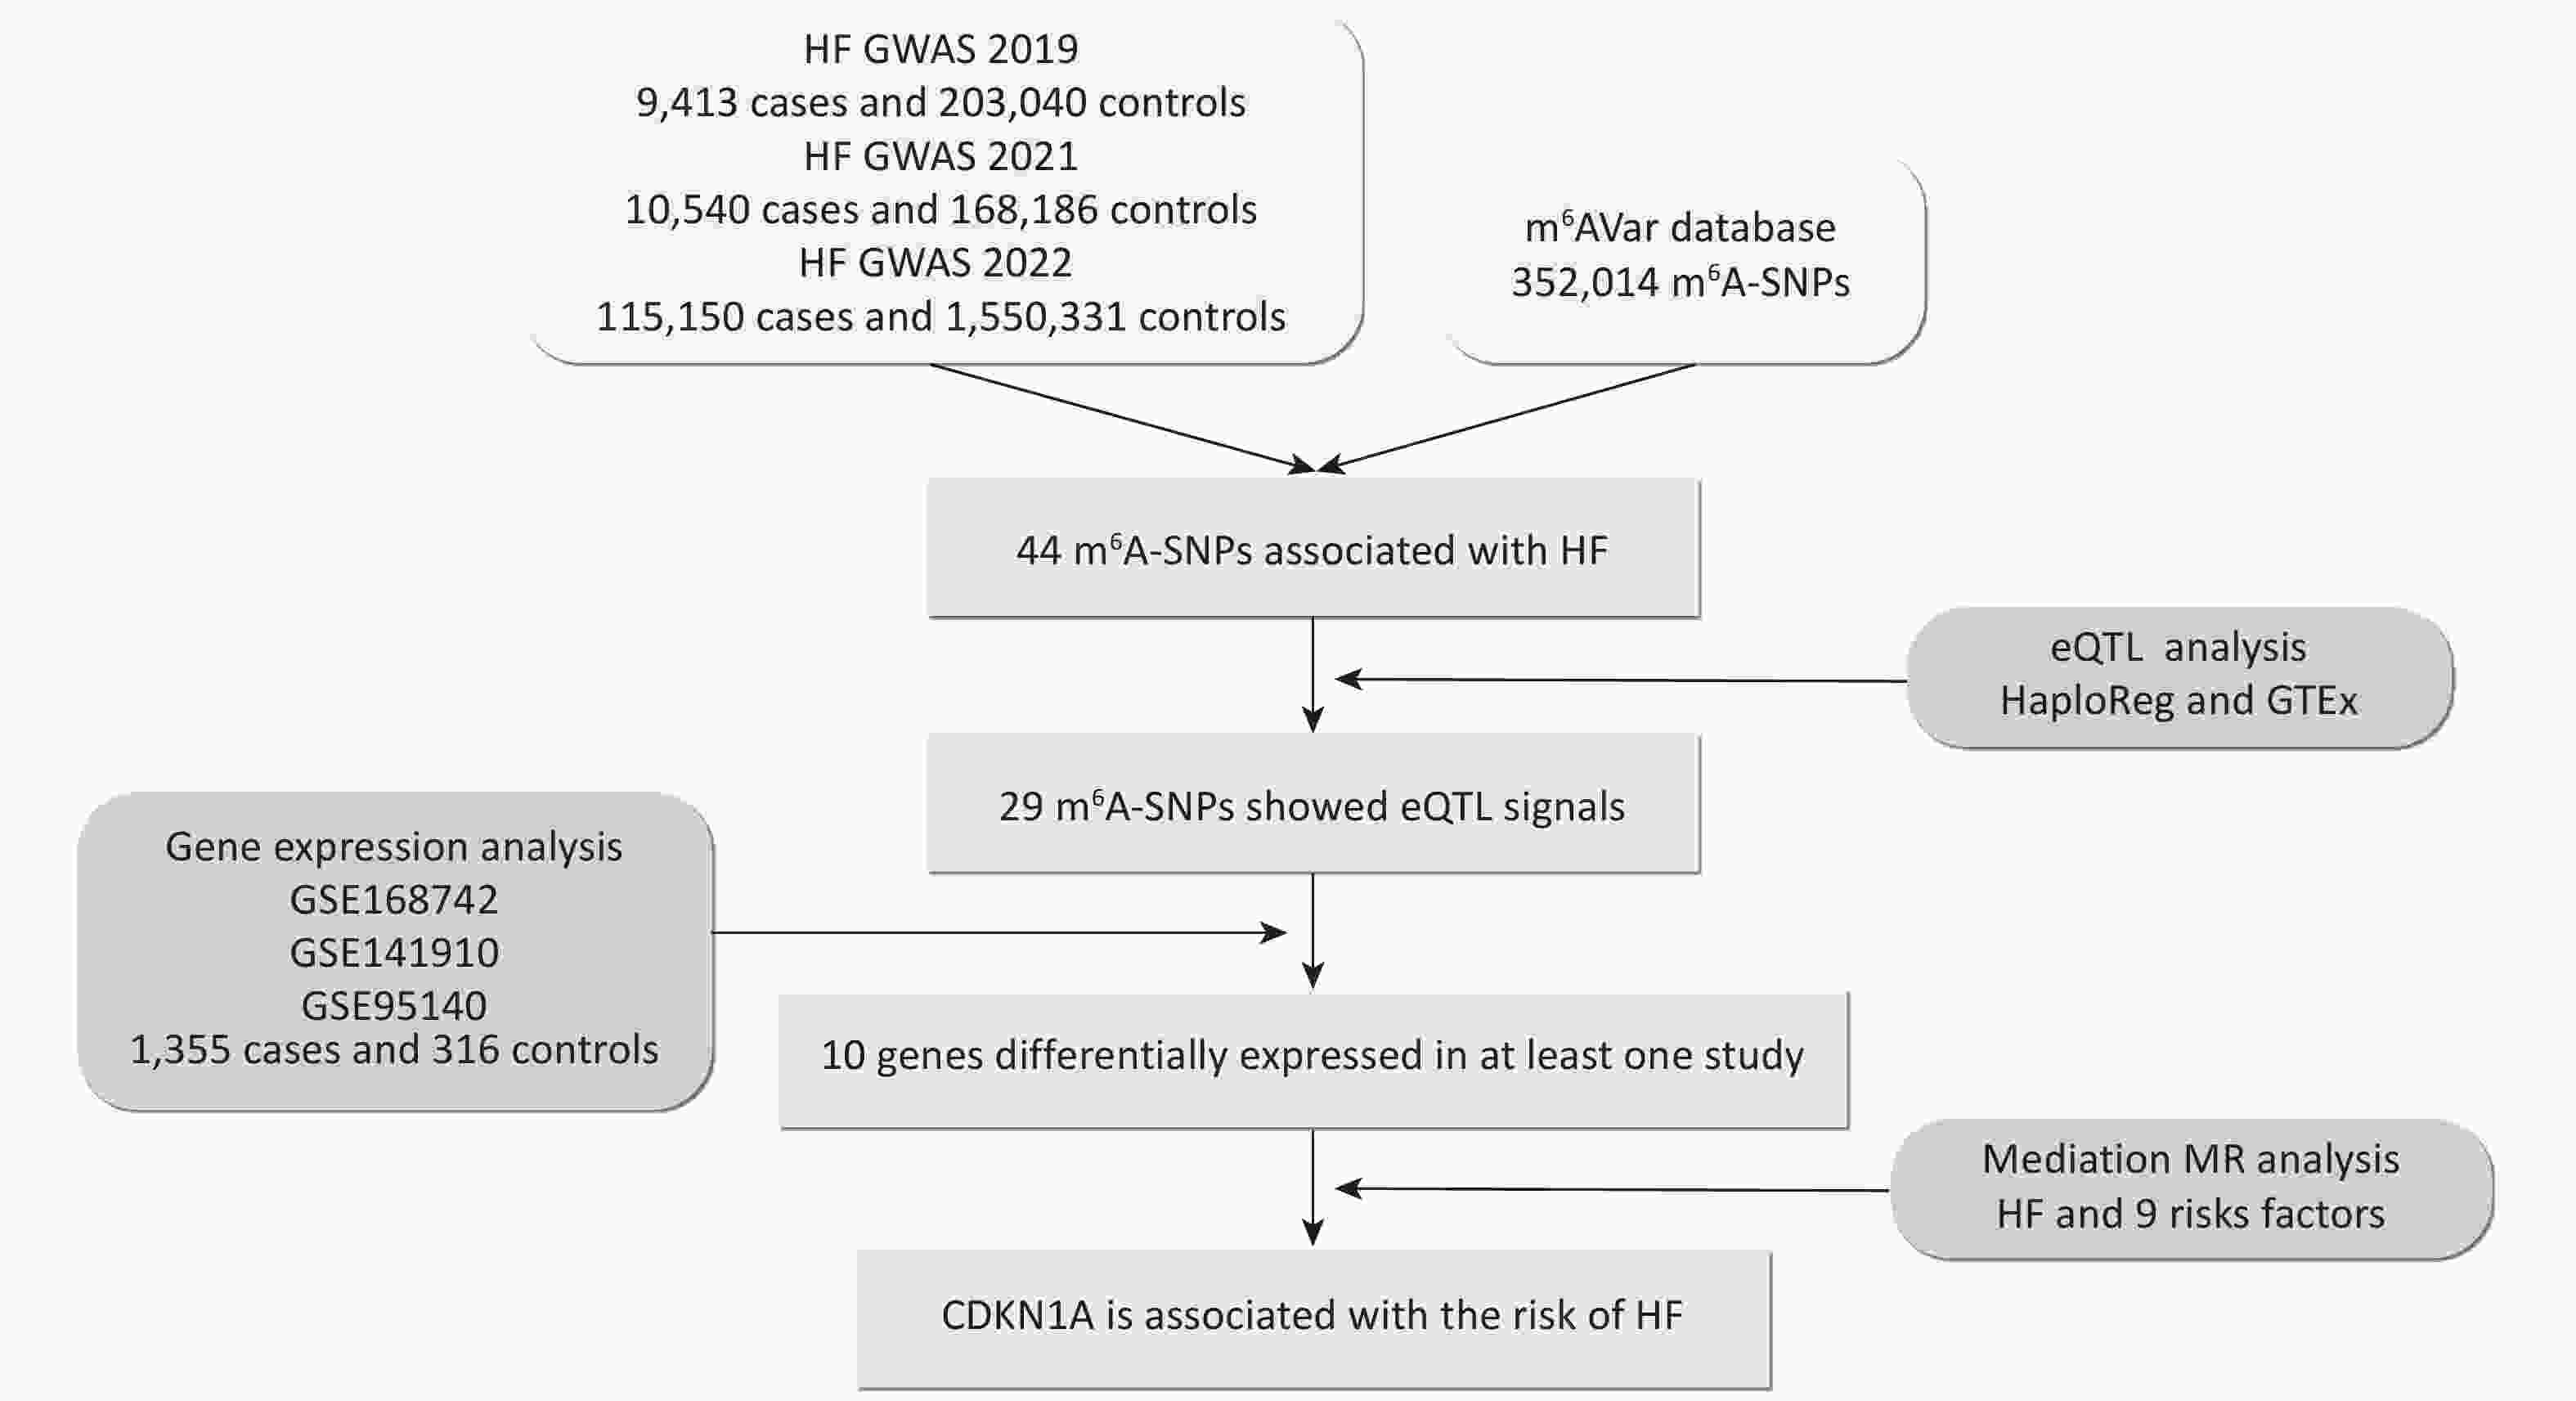
Figure 1. Flow chart illustrating the design and main results of the study. eQTL, expression quantitative trait locus; GWAS, genome-wide association study; HF, heart failure; m6A, N6-methyladenosine; MR, Mendelian randomization; SNP, single nucleotide polymorphism.
Three GWAS summary datasets were included in this study: (1) a 2019 HF GWAS from the BioBank Japan Project (BBJ) dataset, which contains 9,413 chronic HF cases and 203,040 controls from East Asia[19]; (2) a 2021 HF GWAS from a meta GWAS dataset (BBJ, UK biobank, and Finngene), which contains 10,540 congestive HF cases and 168,186 controls from a cross-population (East Asian and European)[20]; (3) a 2022 HF GWAS from a meta GWAS dataset (HERMES, Penn Medicine Biobank, etc), which contains 115,150 chronic HF or all-cause HF cases and 1,550,331 controls from a cross-population (mainly European)[6]. The SNPs were screened at a threshold of 1.00 × 10⁻⁴. Manhattan plots were generated using the ‘CMplot’ R package[21]. Enrichment analyses of m6A-SNPs passing the threshold were performed using Metascape (http://metascape.org/) to categorize and investigate the functional pathways of these genes. Metascape integrates comprehensive gene list annotations, including Kyoto Encyclopedia of Genes and Genomes (KEGG) and Gene Ontology (GO)[22].
-
To investigate whether HF-associated m6A-SNPs affect transcriptional regulation and gene expression at the genome-wide level, we performed eQTL analysis using HaploReg v4.2 (https://pubs.broadinstitute.org/mammals/haploreg/haploreg.php) and GTEx V8 (https://www.gtexportal.org/home/). HaploReg is an efficient tool for exploring the annotations of variants from the 1000 Genomes Project, which was designed to develop mechanistic hypotheses on the impact of variants on phenotypes[23]. HaploReg also aggregates eQTL data from numerous studies conducted on different human cell lines and tissues. Additionally, GTEx was used to study tissue-specific gene expression and regulation. We searched for possible functions of the m6A-SNPs in the aorta, coronary artery, right atrial appendage, and left ventricle using the eQTL calculator in GTEx. Finally, we annotated important m6A-SNPs in the UCSC browser (http://www.genome.ucsc.edu/), which provides a comprehensive and interactive visualization of genomic data, such as DNA sequences, gene structures, and regulatory elements in Encyclopedia of DNA Elements (ENCODE). The eQTL analysis revealed potential functional interactions between m6A-SNPs and RNA.
-
For the m6A-SNPs that showed eQTL signals, we further explored whether the genes were differentially expressed in HF compared with healthy controls. We retrieved three expression profiles from the Gene Expression Omnibus (GEO), GSE168742, GSE141910, and GSE95140, containing 1,355 HF cases and 316 controls. The GSE168742 expression profile comprises integrated single-cell RNA-seq and bulk RNA-seq data of human cardiomyocytes and cardiac fibroblasts from 678 cases with HF and 84 controls[24]. The GSE141910 expression profile comprises human cardiac tissue from 189 cases with HF and 161 healthy donors[25], of which the HF cases consisted of 161 cases with dilated cardiomyopathy and 28 cases with hypertrophic cardiomyopathy. The GSE95140 expression profile comprises human cardiomyocytes from 488 HF cases with dilated cardiomyopathy and 71 controls[26]. In R, we used the ‘limma’ package[27] to analyze bulk RNA-seq gene expression data. The threshold was set as follows to recognize the differences in expression between HF cases and controls: Padj value < 0.05, and an absolute value of log2 fold change (FC) (|logFC|) > 1.
-
Genes affected by m6A-SNPs may further influence HF at the protein level via RNA translation. To explore how these genes influence HF, we selected m6A-SNPs with eQTL signals to perform MR analysis. Four genes with available protein quantitative trait locus (pQTL) data were selected for subsequent analyses: CDKN1A, SMAD3, PDIA6, and TTN. To identify the potential functional mechanisms of these four critical genes, we performed a two-step MR to explore the possible pathways involved. We first conducted a two-sample MR to investigate the causal association between plasma proteins and HF. A two-sample bidirectional MR was also performed to evaluate the mutual causality of HF on critical proteins. We then performed a two-sample MR to identify whether risk factors for HF, including hypertension, blood pressure (BP), obesity, body mass index (BMI), diabetes, coronary heart disease (CHD), cardiomyopathy, and myocardial infarction (MI), may mediate the pathways from plasma protein to HF. Benjamini–Hochberg false discovery rate (FDR) adjustments were used for multiple tests. The effects of proteins on HF outcomes were designated as the total effect (β0). The effects of proteins on each mediator were estimated as β1, and the effects of mediators on HF outcomes were estimated as β2. The mediation proportion of mediators in the causal association between proteins and HF outcomes was calculated as the product of β1 and β2 divided by β0[28], and the 95% confidence intervals (CI) of the mediation proportions were calculated using the delta method[29].
The pQTL data were obtained from the Decode study containing 100,000 individuals and 4,970 proteins[30]. Summary-level GWAS outcome data were downloaded from the MRC Integrative Epidemiology Unit (IEU) Open GWAS database (https://gwas.mrcieu.ac.uk/)[31] (
Supplementary Table S1 , available in www.besjournal.com).All MR analyses were performed using the ‘TwosampleMR’[31] R package. For the two-sample MR, we selected significant (P < 5.00 × 10⁻⁶) and independent (linkage disequilibrium r2 < 0.01, > 10,000 kb) SNPs as instrumental variables. Five MR methods were used: inverse-variance weighted, weighted median, MR-Egger, simple mode, and weighted mode. For multiple testing-adjusted significance thresholds, we selected a liberal FDR threshold of 20% to explore biological characteristics. For sensitivity analyses, heterogeneity and pleiotropy tests were performed using the MR-Egger and inverse-variance weighted methods. The MR-Egger method was used to provide a credible estimate when there is potential horizontal pleiotropy[32]. Calculations using the delta method were conducted using the ‘RMediation’ R package[33], with the default algorithm.
-
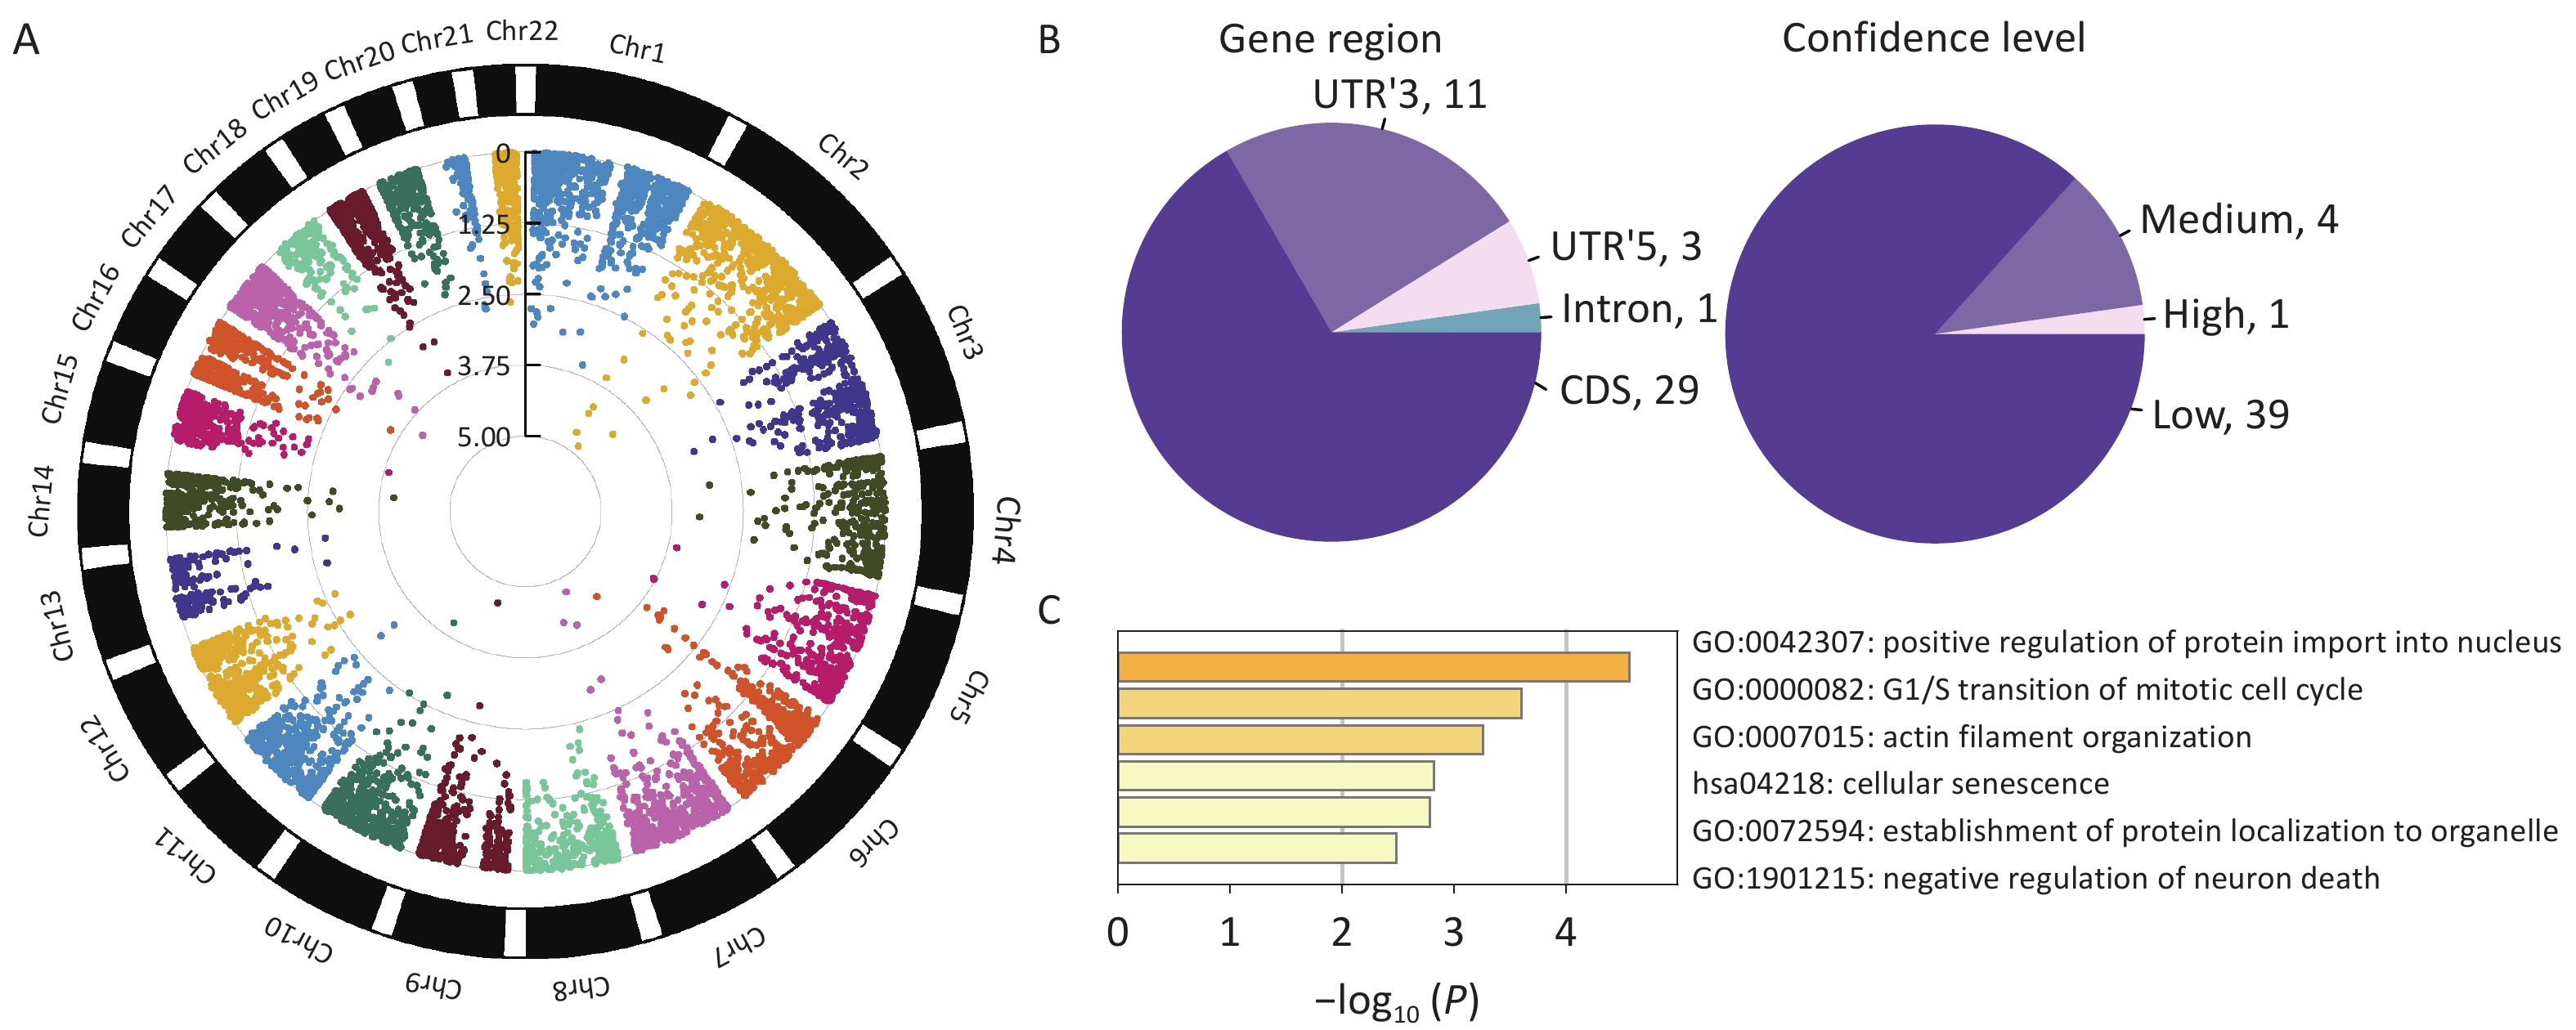
We found 44 m6A-SNPs associated with HF (Figure 2A). Among those SNPs, 29 were located in coding sequences (CDS), 11 in 3’ untranslated regions (UTR’3), 3 in 5’ untranslated regions (UTR’5), and 1 in an intron (Figure 2B). Regarding the confidence level, 1 SNP was high (mi CLIP/PA-m6A-Seq), 4 were medium (MeRIP-Seq), and 39 were low (transcriptome-wide prediction). The most significant SNP, rs1801270, which is located in a CDS, and has a medium confidence level, was significant in both GWAS2019 (P = 7.75 × 10⁻⁶) and GWAS2022 (P = 4.89 × 10⁻⁴). Enrichment analyses indicated that these genes were predominantly enriched in the positive regulation of protein import into the nucleus, transition of the mitotic cell cycle, and establishment of protein localization to organelles (Figure 2C).
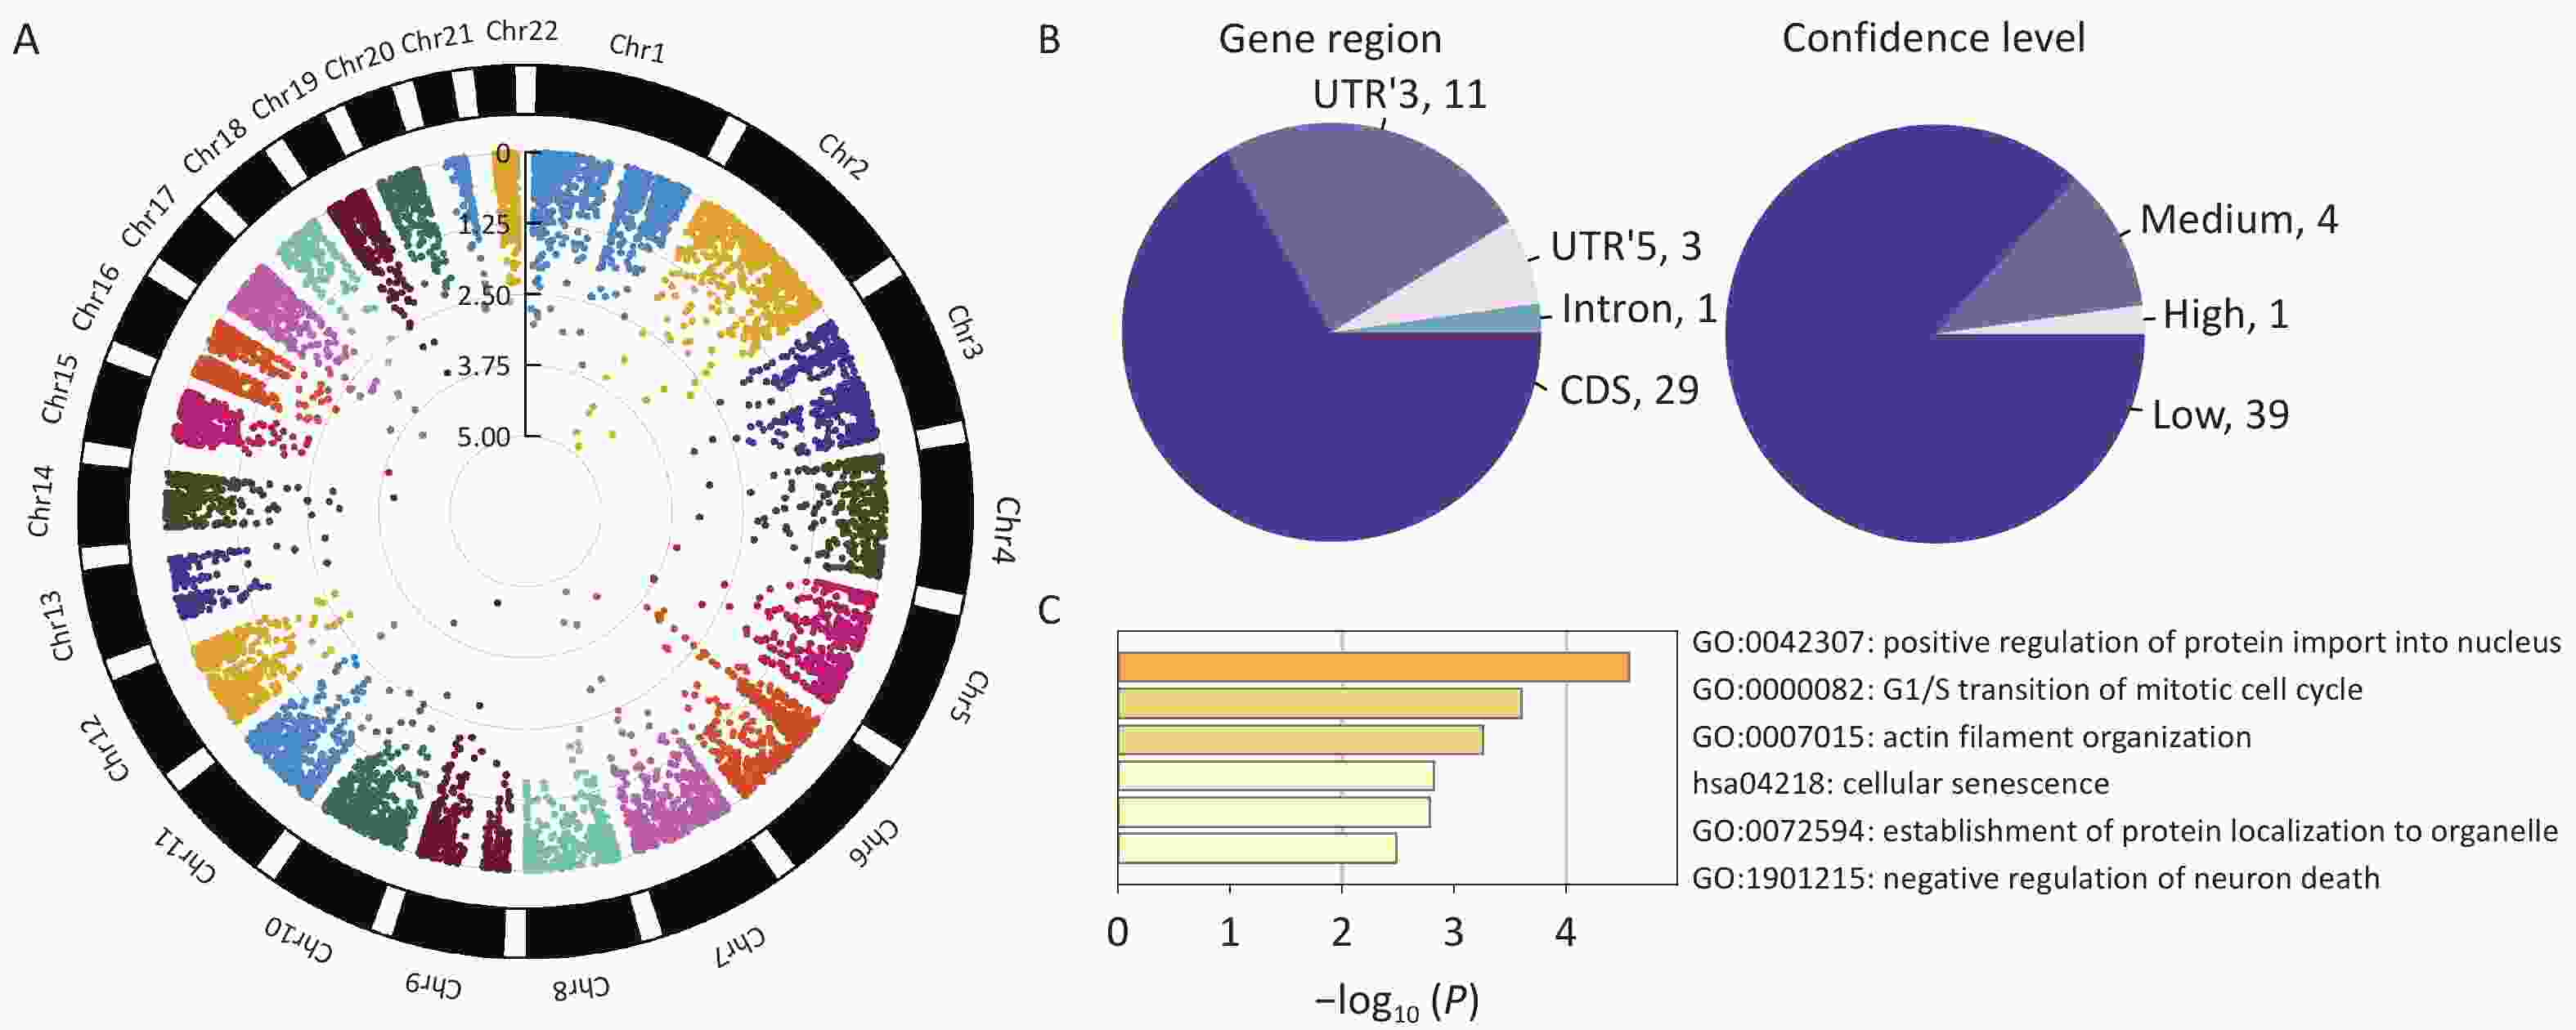
Figure 2. Characteristics of identified HF-associated m6A-SNPs. (A) Circle Manhattan plot of GWAS2022 (which overlapped most SNPs with the m6A-SNP dataset). (B) Information on m6A-SNPs associated with heart failure. (C) Gene ontology terms of genes at which m6A-SNPs are placed (Metascape: http://metascape.org/).
-
The effects of m6A modification predominantly act through the translation or degradation of mRNA, and m6A-SNPs therefore likely affect RNA expression. Among 44 m6A-SNPs, 29 SNPs showed eQTL signals in the HaploReg browser. Among these signals, rs1048414 hits the highest count with 196 records and was associated with the mRNA levels of HLA-DQA1 and HLA-DQA2 in most cells and tissues. The SNP rs3734264 hit 65 records and was associated with the mRNA levels of bridge-like lipid transfer protein family member 3A (BLTP3A, also known as UHRF1BP1) and small nuclear ribonucleoprotein polypeptide C (SNRPC) in most cells and tissues. Most SNPs regulate RNA translation through histone marks, protein binding, and motif changes.
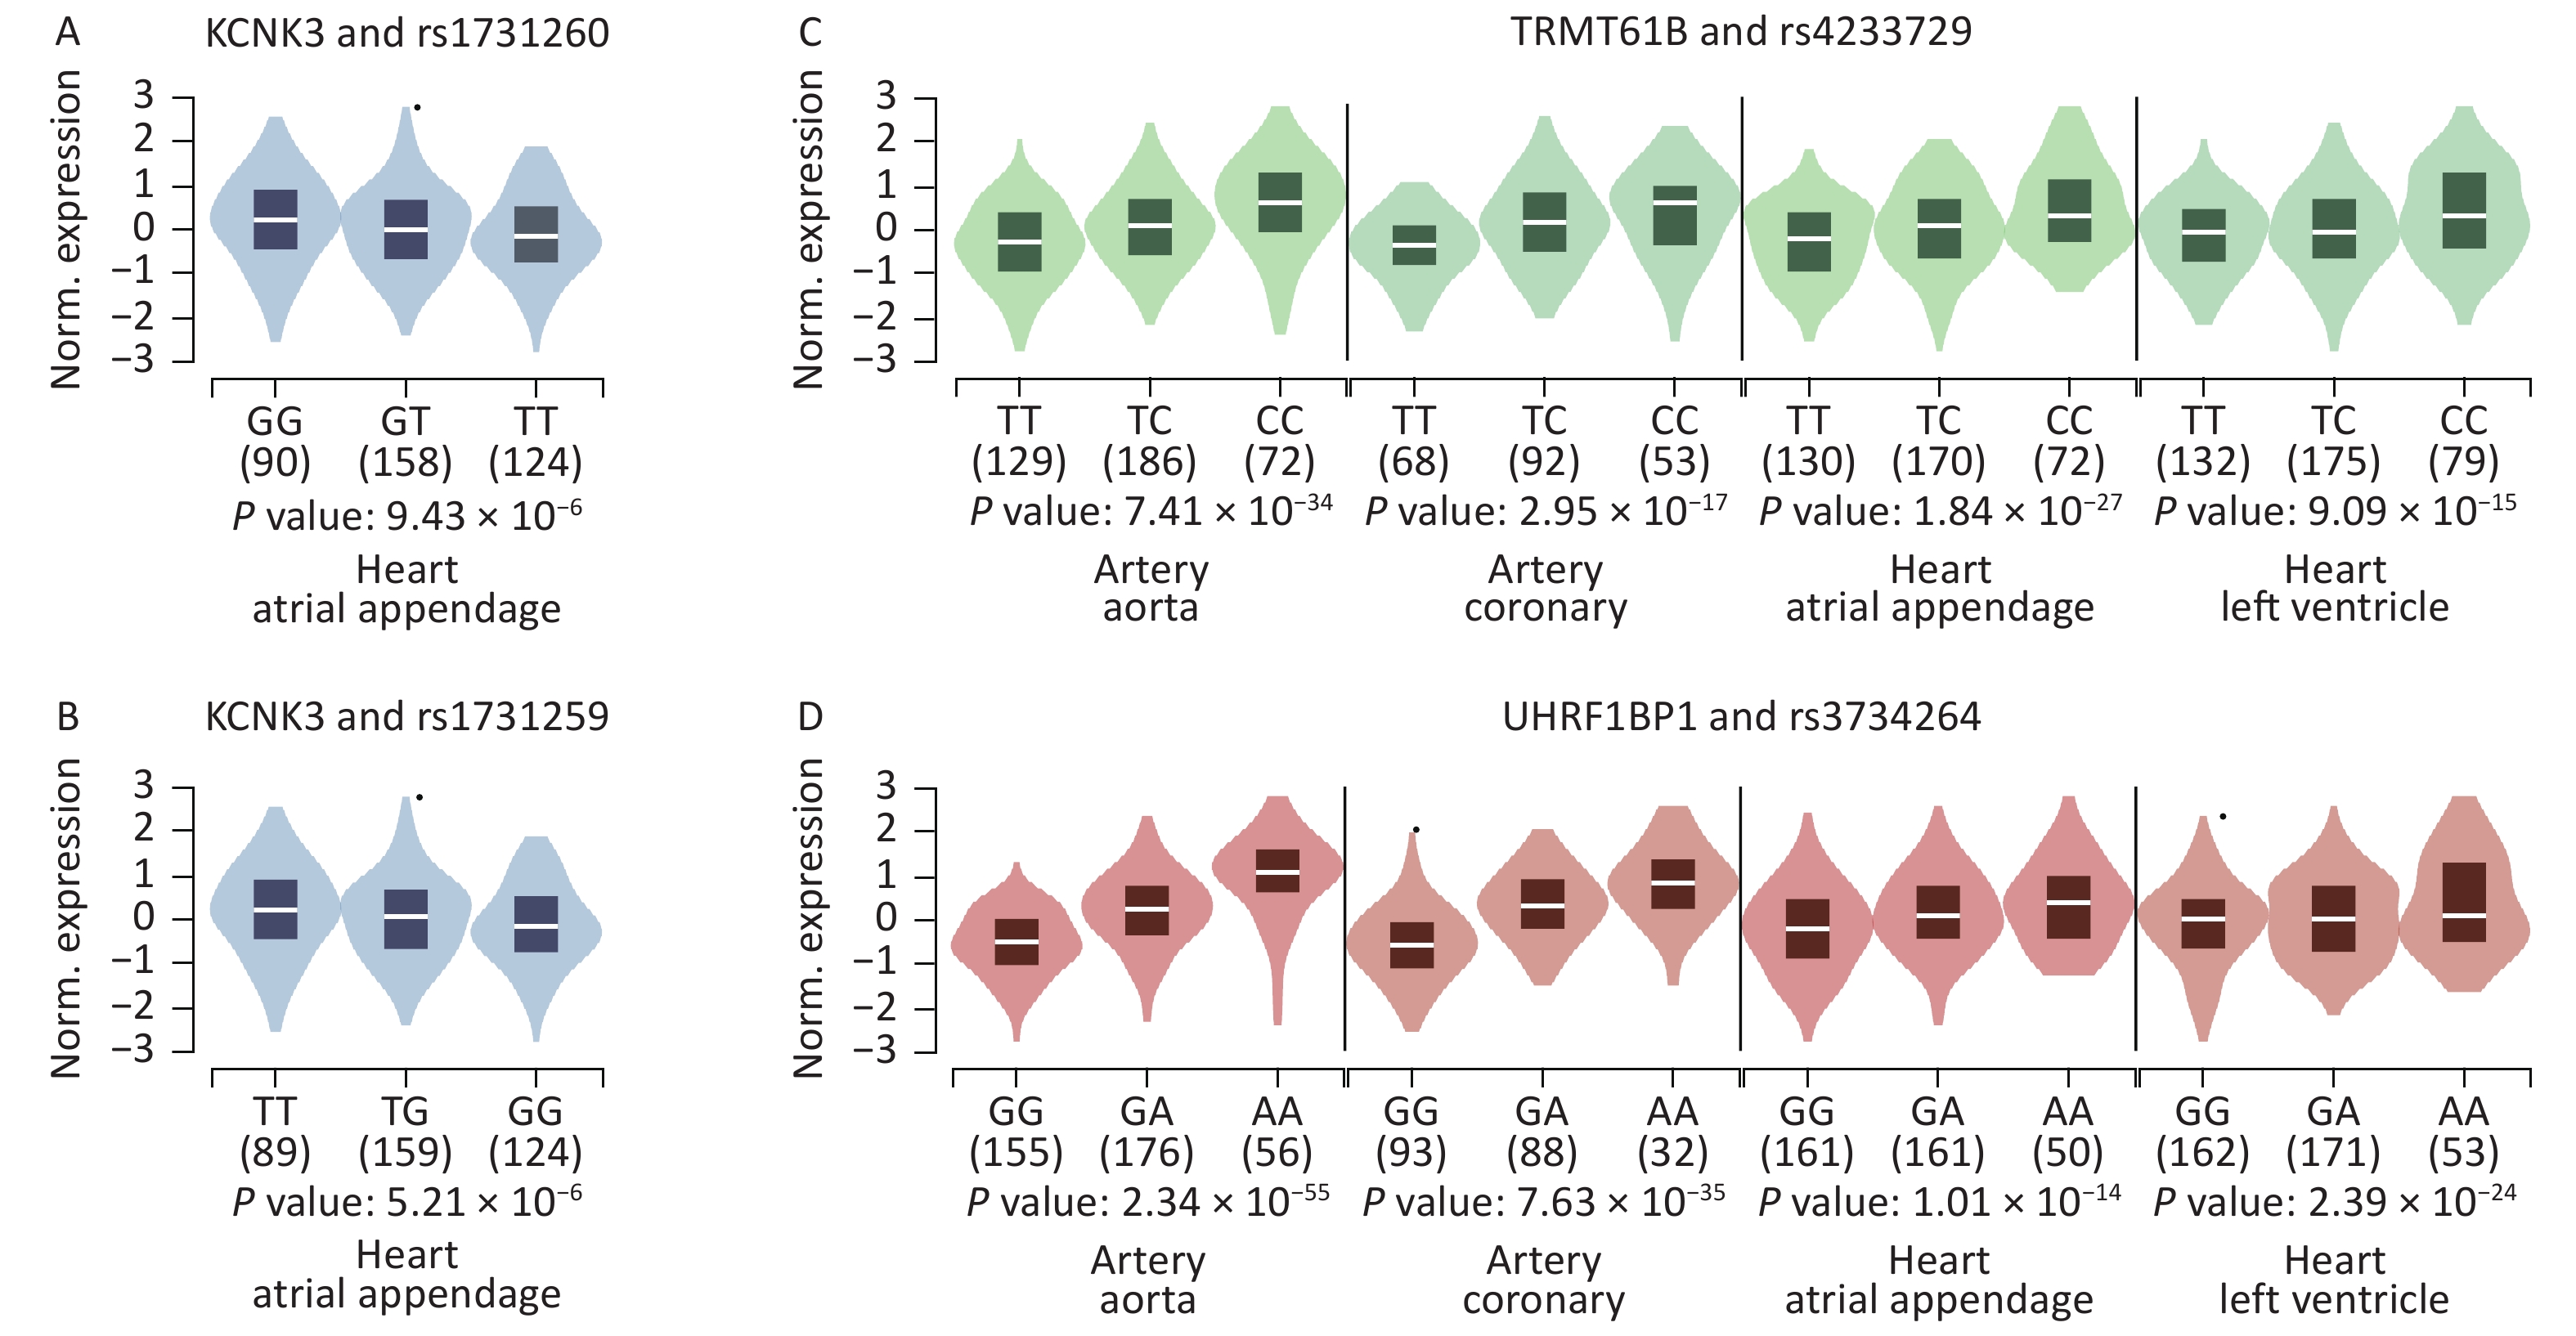
We further searched for eQTL signals in specific HF-associated tissues using the GTEx V8 eQTL calculator and found that 8 SNPs showed significant signals in the related tissues. Both rs1731259 and rs1731260 were associated with KCNK3 expression in the right atrial appendage. The rs4233729 was associated with TRMT61B expression levels (P = 7.40 × 10⁻³⁴, 3.00 × 10⁻¹⁷, 1.80 × 10⁻²⁷, and 9.10 × 10⁻¹⁵), and rs3734264 with UHRF1BP1 expression levels (P = 2.30 × 10−55, 7.60 × 10⁻³⁵, 1.00 × 10⁻¹⁴, and 2.40 × 10⁻²⁴), in the aorta, coronary artery, right atrial appendage, and left ventricle, respectively (Figure 3).
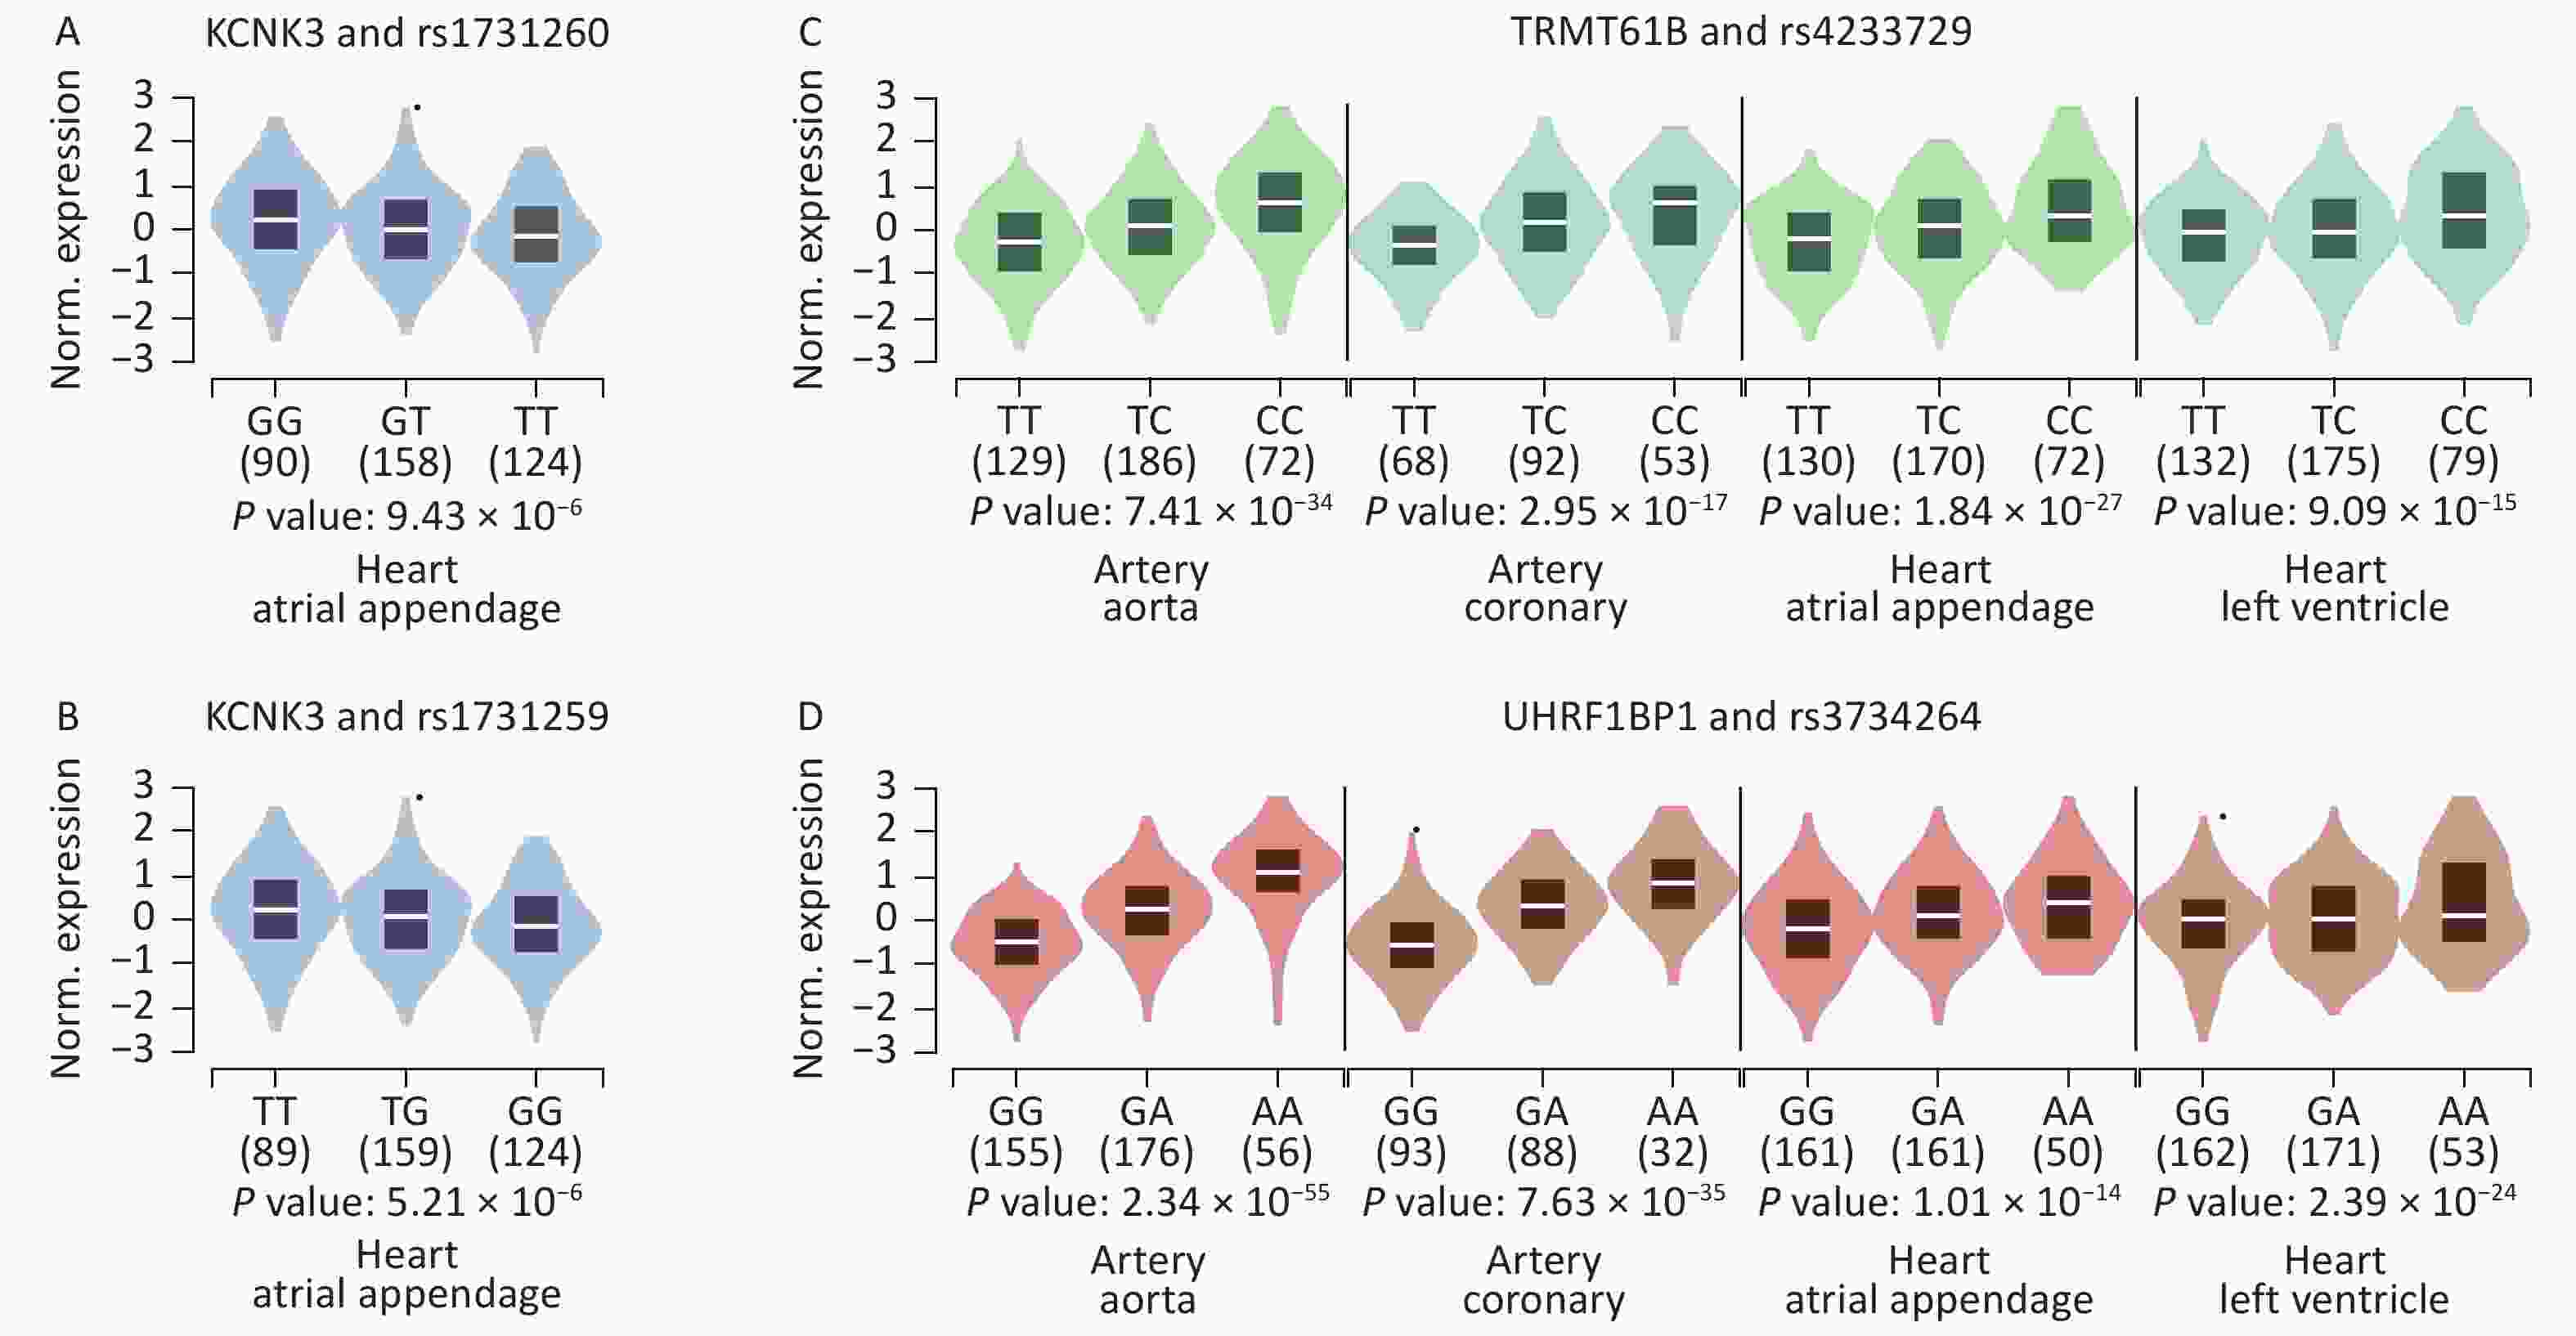
Figure 3. Violin plots of the eQTLs of some significant SNPs. P values were calculated using the eQTL calculator in GTEx V8 (GTEx Portal). (A) The effect allele of rs1731260 was associated with KCNK3 expression in the right atrial appendage. (B) The effect allele of rs1731259 was associated with KCNK3 expression in the right atrial appendage. (C) The effect allele of rs4233729 was associated with TRMT61B expression in the aorta, coronary artery, right atrial appendage, and left ventricle. (D) The effect allele of rs3734264 was associated with UHRF1BP1 expression in the aorta, coronary artery, right atrial appendage, and left ventricle.
-
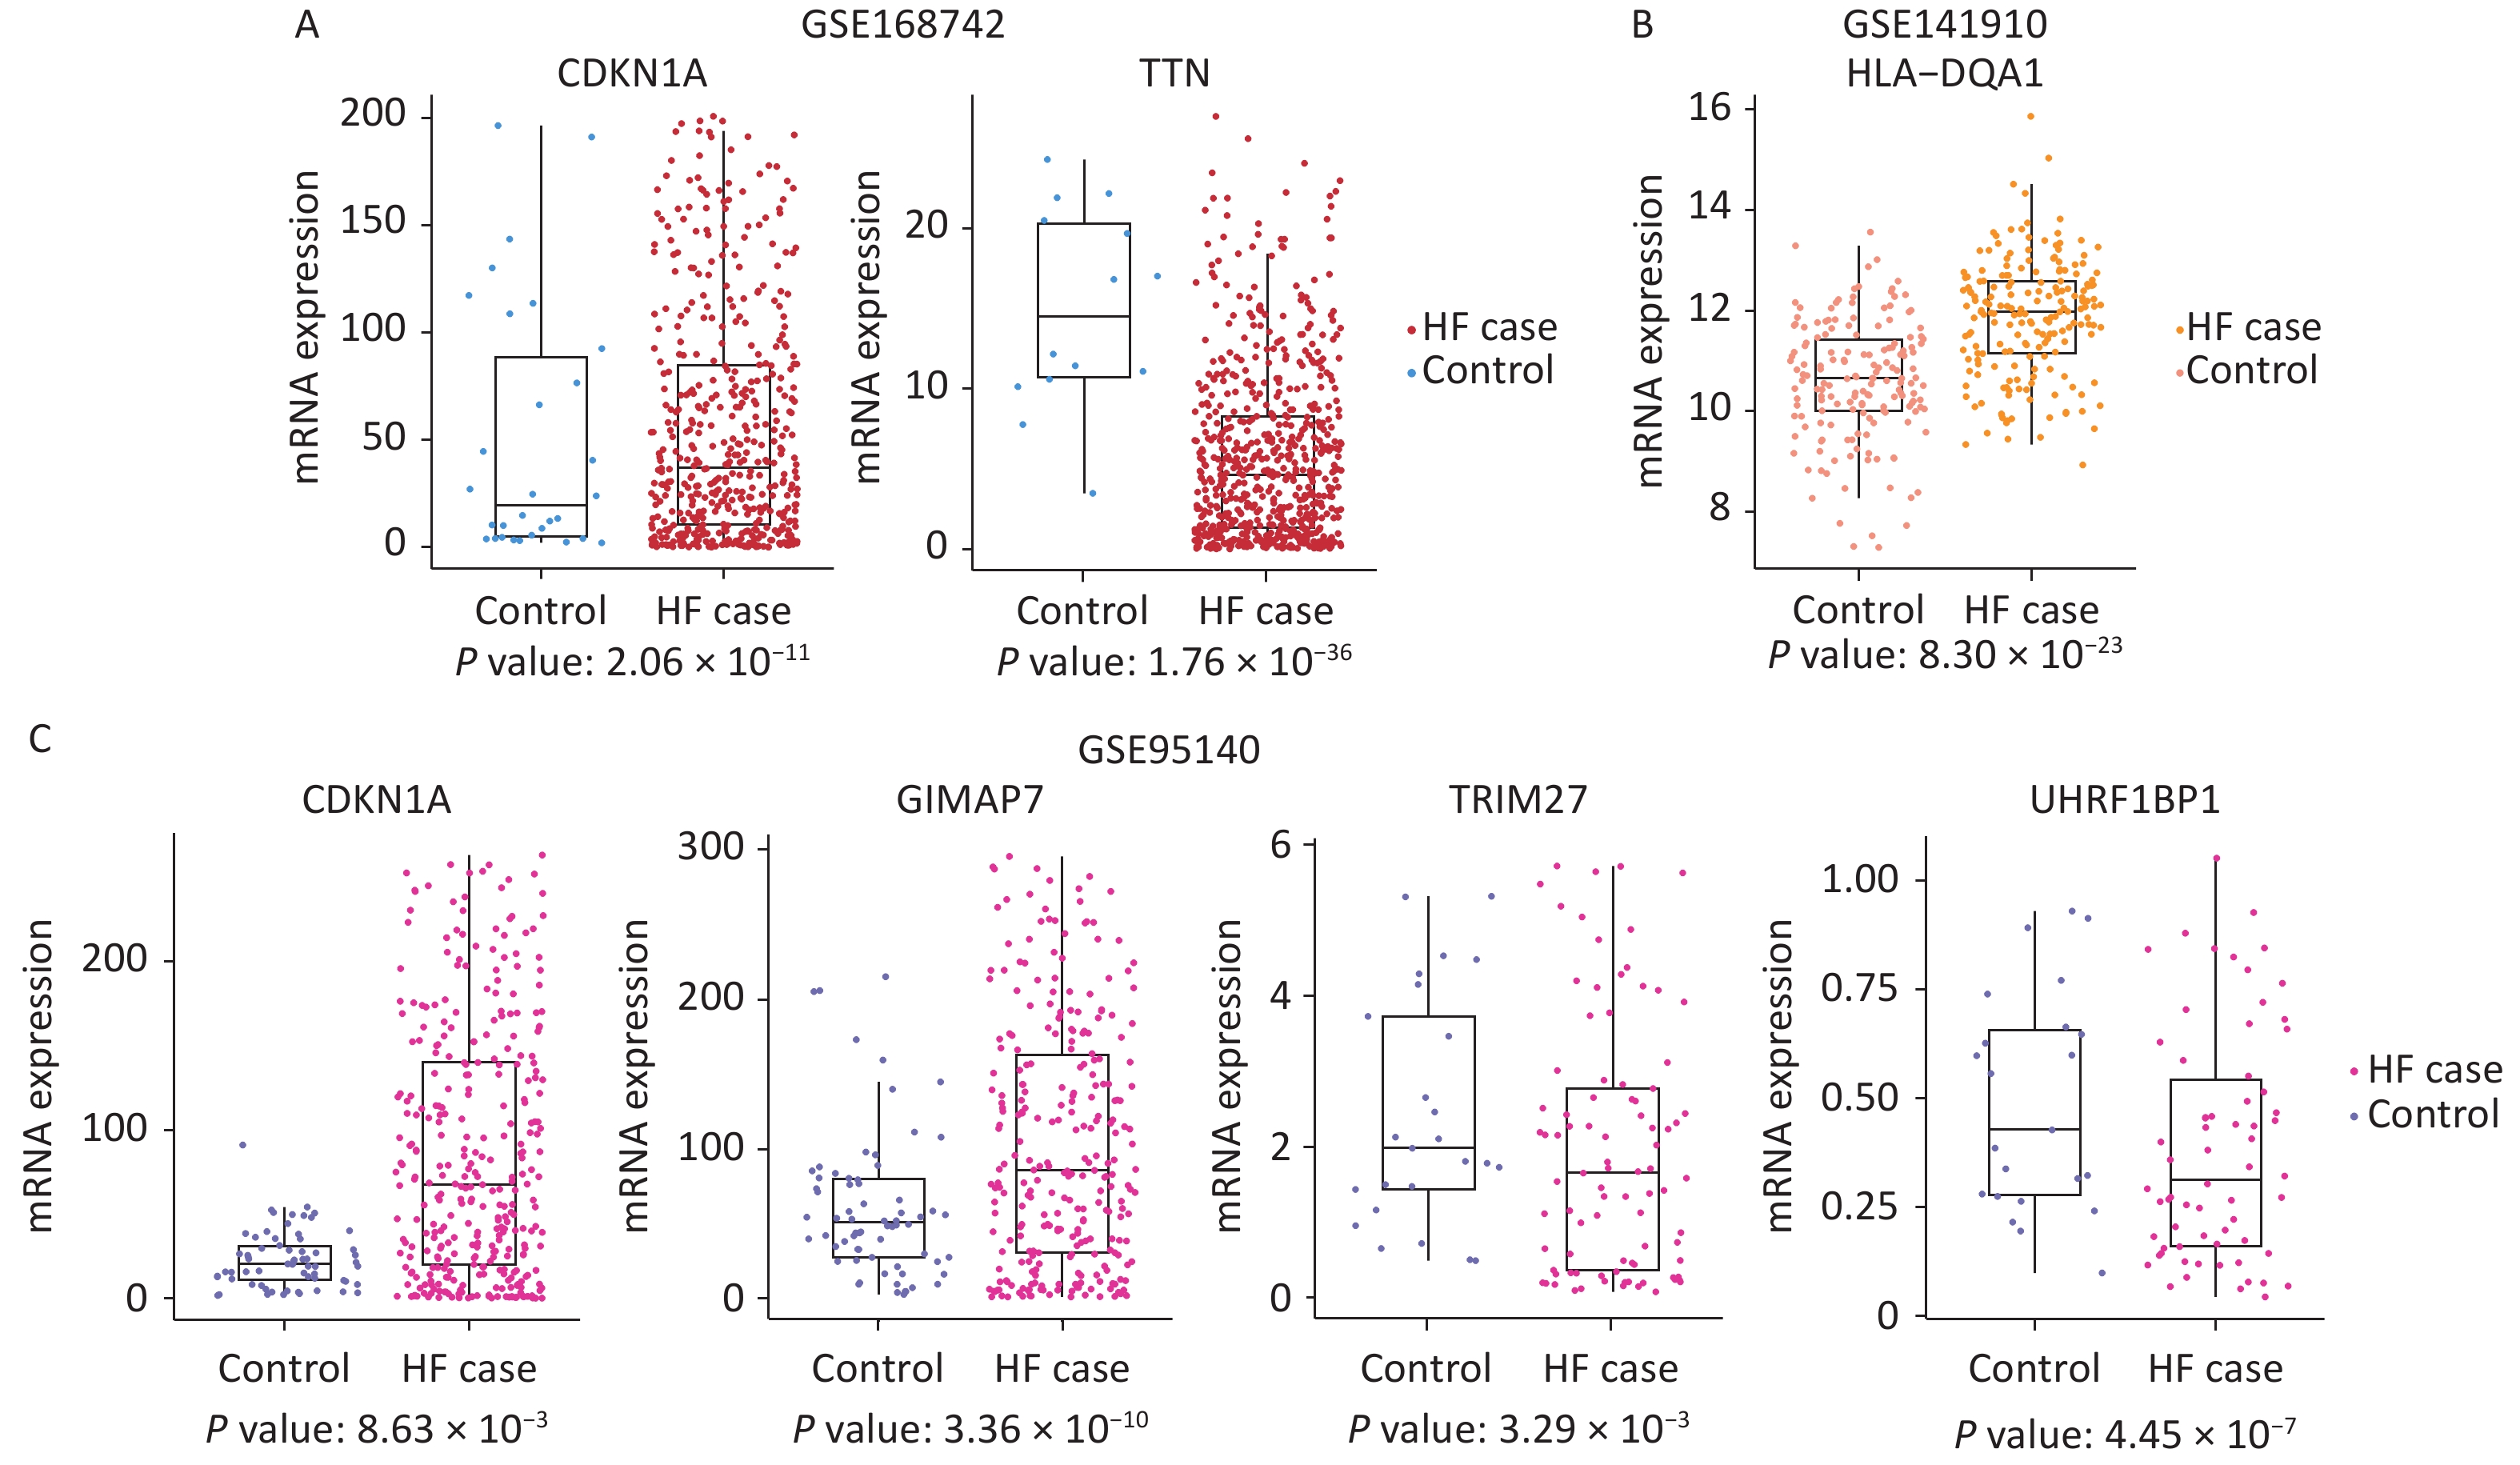
Gene expression may be alerted in HF and related diseases. Cardiomyopathies encompass a diverse array of heart muscle disorders that are considered as significant risk factors contributing to the development of HF. To investigate whether the m6A-SNPs related genes can alter mRNA levels, we also conducted gene expression analyses in HF with different etiologies. The GSE168742, GSE141910, and GSE95140 datasets were used, and included 1,355 HF cases and 316 controls. Of the 28 genes, 10 were differentially expressed between the cases and controls (Padj < 0.05, |log2FC| > 1).
In GSE168742, TTN (P = 1.76 × 10−36, logFC = –3.10), GIMAP7 (P = 5.01 × 10⁻⁵, logFC = 2.37), CDKN1A (P = 2.06 × 10⁻¹¹, logFC = 3.32), PPP1CB (P = 2.07 × 10⁻⁶, logFC = 1.64), and WFS1 (P = 8.94 × 10⁻⁸, logFC = –1.86) showed different levels of RNA expression between cases with HF and controls. In GSE141910, HLA-DQA1 (P = 8.30 × 10⁻²³, logFC = –1.31) was differentially expressed between cases with HF and controls. In GSE95140, KDM3A (P = 2.57 × 10⁻⁴, logFC = –1.34), SHPRH (P = 2.31 × 10⁻⁹, logFC = –1.83), GIMAP7 (P = 3.36 × 10⁻¹⁰, logFC = 3.74), TRIM27 (P = 3.29 × 10⁻³, logFC = –1.19), CDKN1A (P = 8.63 × 10⁻³, logFC = 1.52), UHRF1BP1 (P = 4.45 × 10⁻⁷, logFC = –1.30), and TTN (P = 4.94 × 10⁻⁶, logFC = –1.19) were found to be differently expressed between cases with HF and controls. These results are shown in Figure 4.
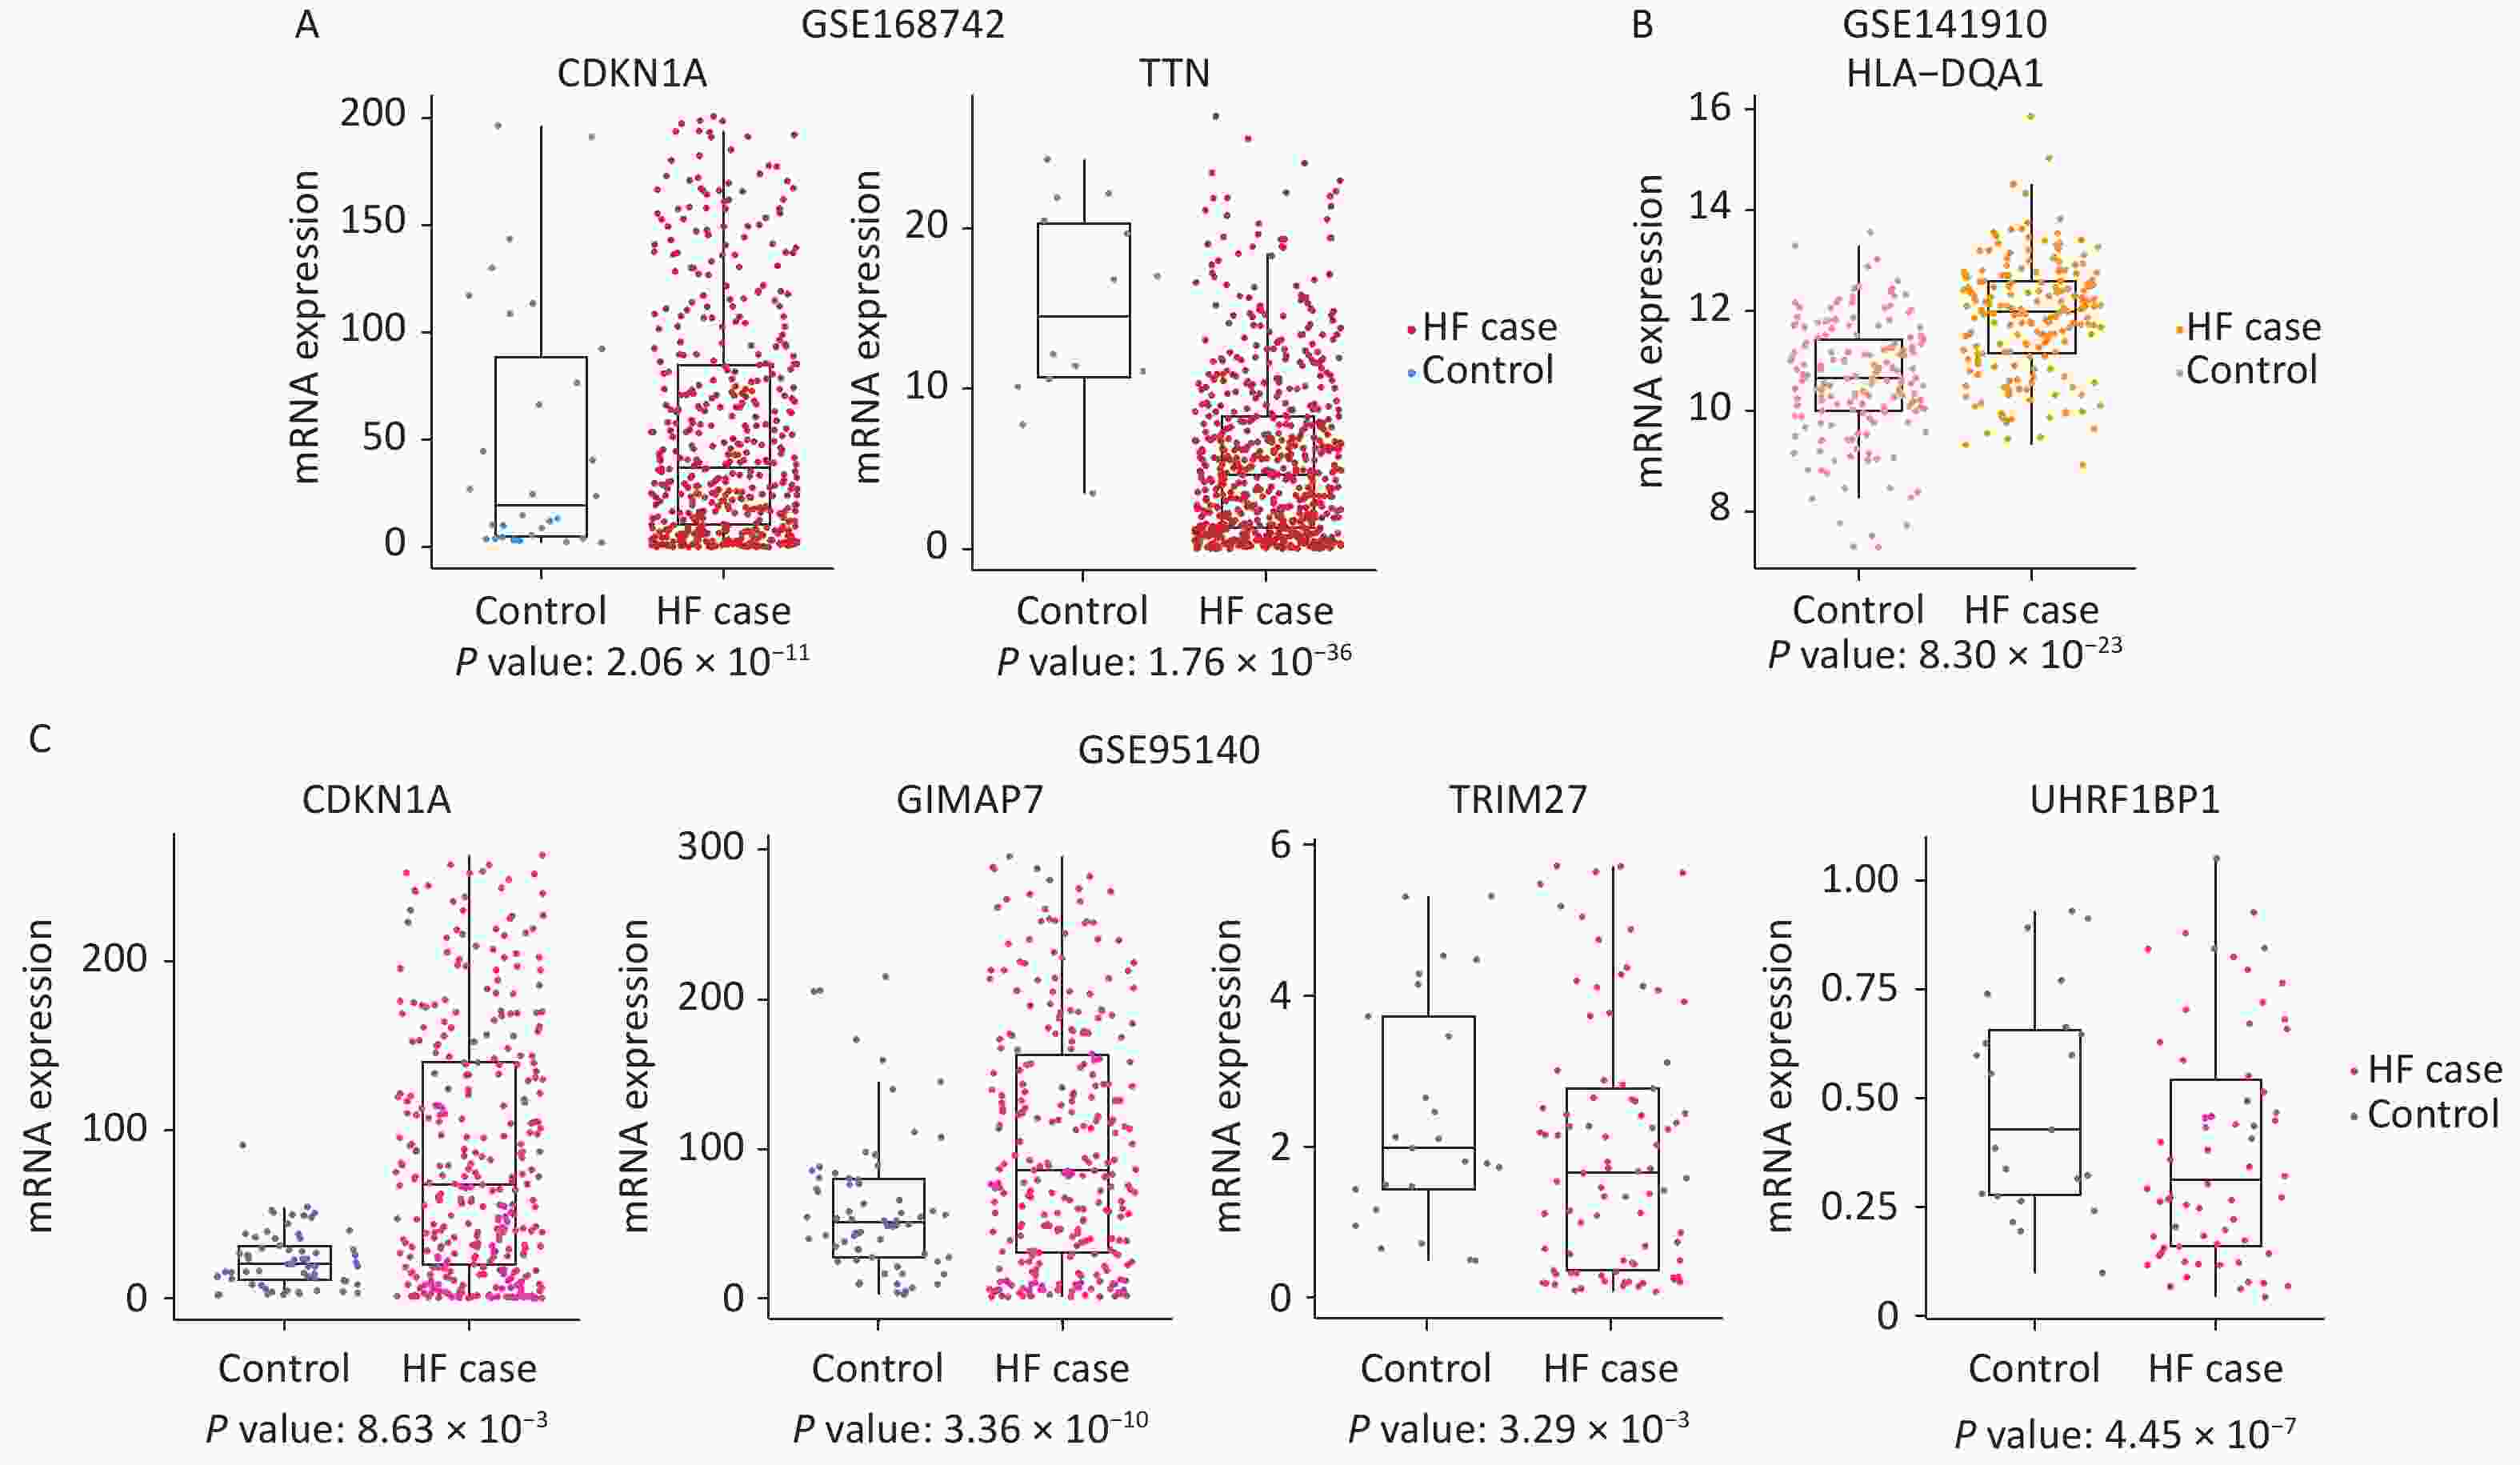
Figure 4. Box plots depicting the gene expression of the three datasets. (A) Differentially expressed genes found in GSE168742: expression of CDKN1A and TTN in HF cases and controls. (B) Differentially expressed genes found in GSE141910: expression of HLA−DQA1 in HF cases and controls. (C) Differentially expressed genes found in GSE95140: expression of CDKN1A, GIMAP7, TRIM27, and UHRF1BP1 in HF cases and controls. HF: heart failure.
-
By integrating all evidence (
Supplementary Table S2 , available in www.besjournal.com), we identified 10 SNPs with eQTL signals, and the associated genes were differentially expressed in HF (Table 1). The SNP rs1801270, a missense variant from C to A, causes amino acid transversion of serine (Ser) to arginine (Arg). The SNP rs1801270 is located in the exon region of the CDKN1A gene on chromosome 6. It was associated with chronic HF in both the cross-ancestry GWAS (P = 4.89 × 10⁻⁴) and the East Asian GWAS (P = 7.75 × 10⁻⁶), and its m6A-SNP confidence level was medium (resulting from MeRIP-seq data). The SNP rs1801270 affected the expression of RAB44 in fibroblasts, affecting only one eQTL. Additionally, this SNP was found to affect four motifs: 2 protein-bound areas (POL2 and ZBTB), DNase in 8 tissues, and enhancer histone marks in 16 tissues. CDKN1A expression was higher in cases with HF than in controls in both GSE168742 (P = 2.06 × 10⁻¹¹) and GSE95140 (P = 8.63 × 10⁻³).Table 1. The significant m6A-SNPs for heart failure
rsID Chr Effect
allele
frequencyβ P Gene Gene
regionConfidence
levelHaploReg GTEx GSE168742 GSE95140 GSE141910 rs1801270* 6 0.068 0.015 7.75 × 10⁻⁶ CDKN1A CDS Medium 1 N 3.315 1.525 − rs2030259 2 0.225 0.027 1.41 × 10⁻⁵ KDM3A CDS Low 2 N − −1.344 − rs6900607 6 0.742 −0.101 4.21 × 10⁻⁵ SHPRH CDS Low 2 N − −1.833 − rs3735081 7 0.330 0.022 5.48 × 10⁻⁵ GIMAP7 CDS Low 6 N 2.367 3.742 − rs1048414 6 0.604 0.051 2.49 × 10⁻⁴ HLA−DQA1 CDS Low 196 N − − −1.314 rs11545587 6 0.105 0.029 4.74 × 10⁻⁴ TRIM27 UTR5 Medium 2 N − −1.187 − rs1801270 6 0.238 0.029 4.89 × 10⁻⁴ CDKN1A CDS Medium 1 N 3.315 1.525 − rs3734264 6 0.353 0.019 4.98 × 10⁻⁴ UHRF1BP1
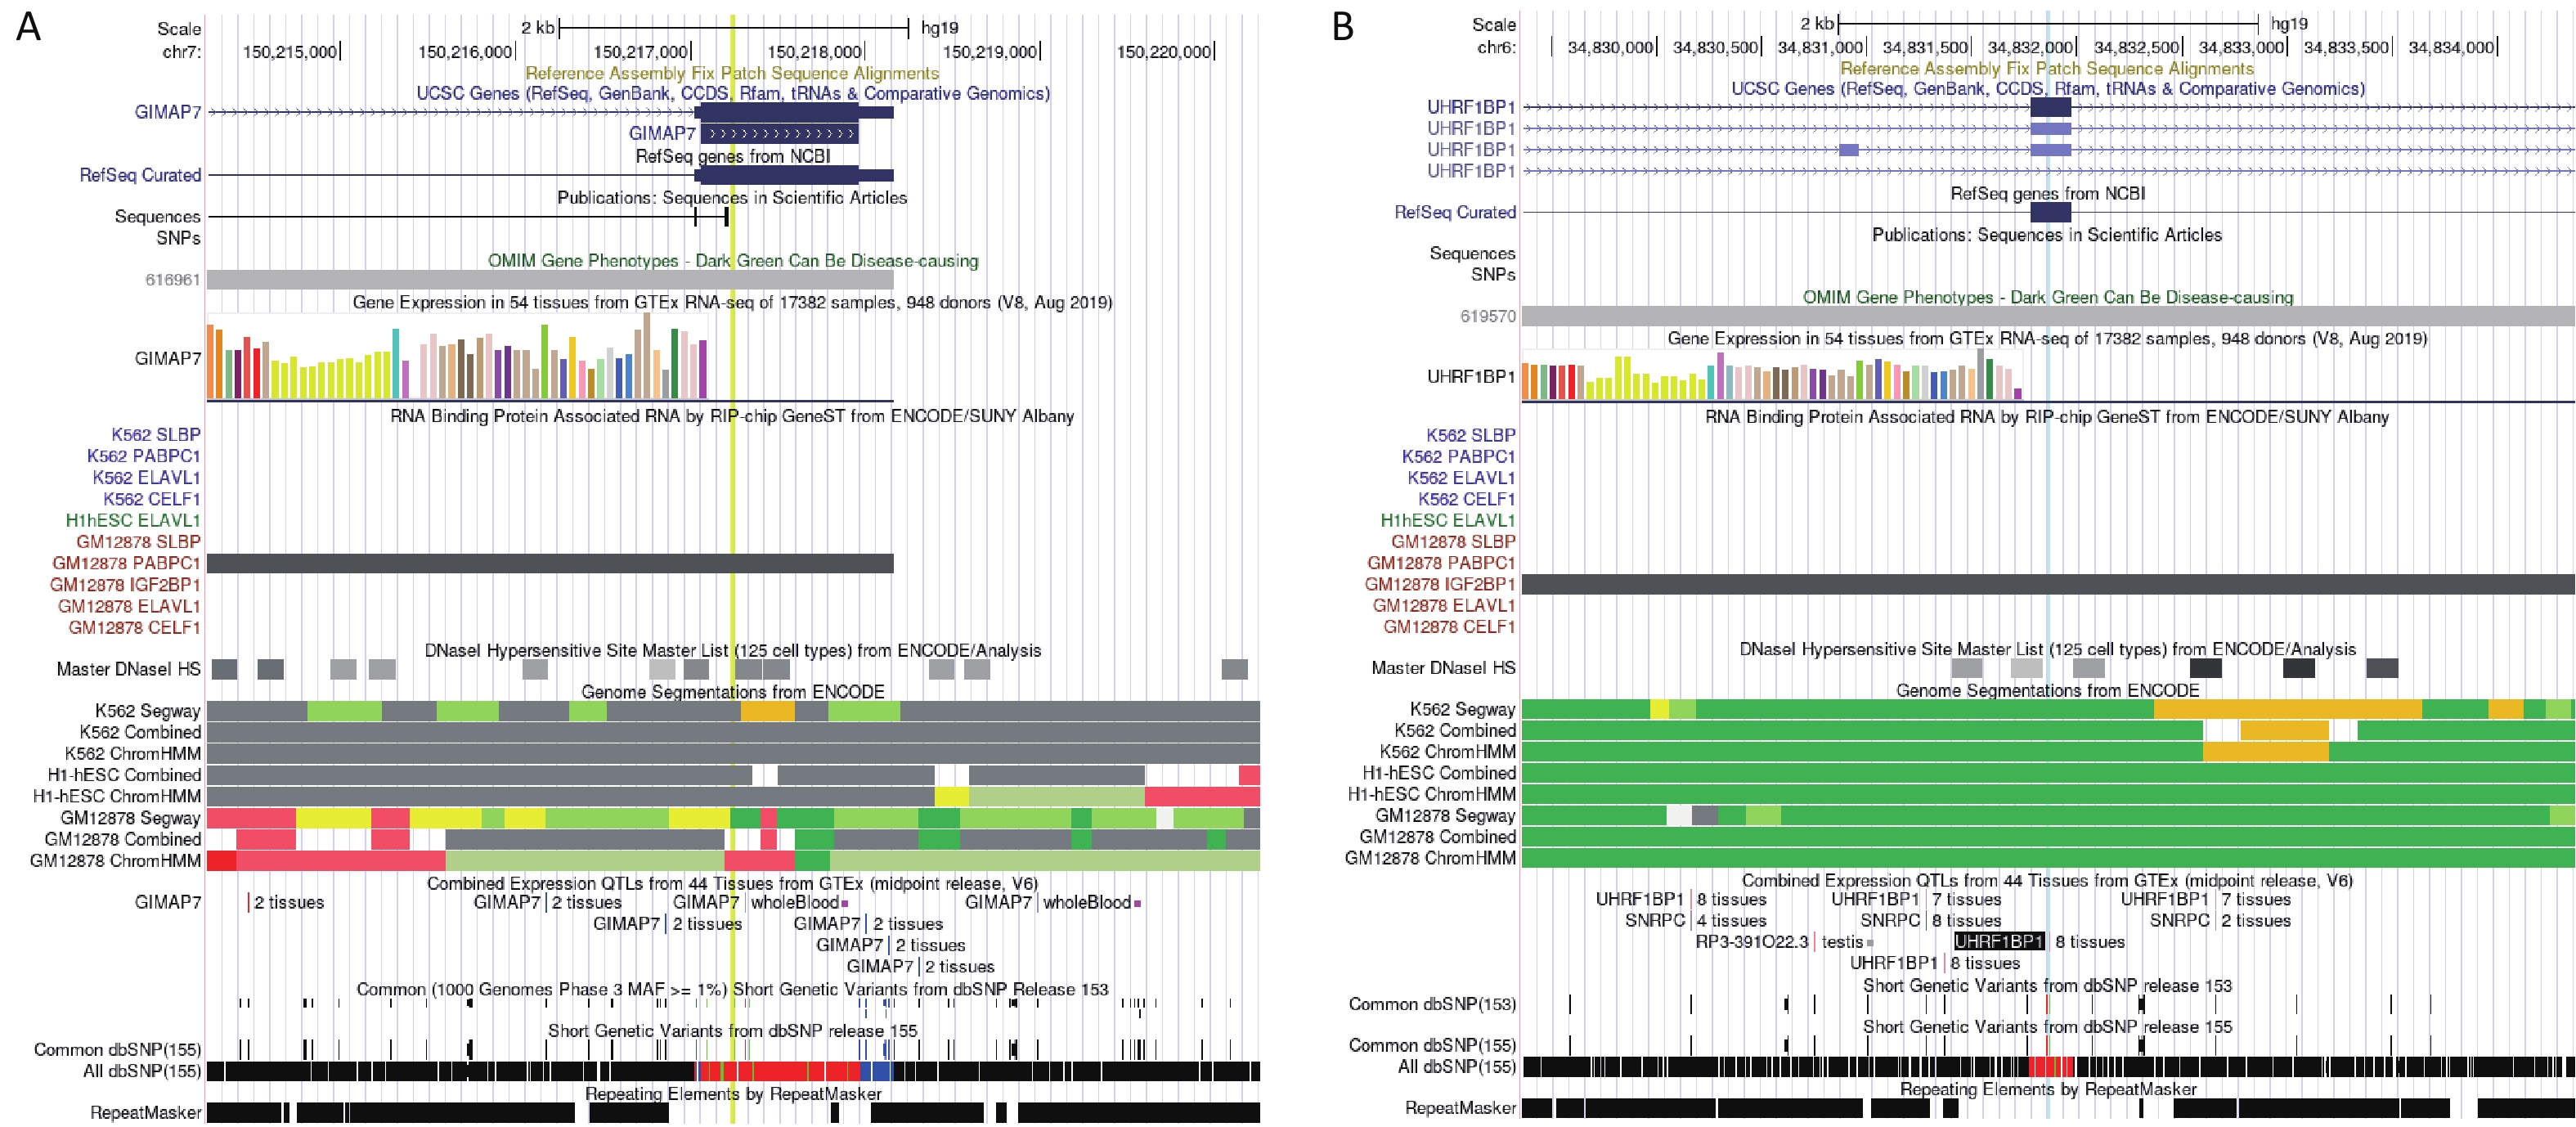
(BLTP3A)CDS Low 65 Y − −1.305 − rs1128416 2 0.443 −0.018 7.14 × 10⁻⁴ PPP1CB CDS Low 57 N 1.641 − − rs66523653 2 0.046 −0.192 8.44 × 10⁻⁴ TTN CDS Low 1 N −3.098 −1.187 − rs1801206 4 0.585 0.018 8.65 × 10⁻⁴ WFS1 CDS Low 8 N −1.858 − − Note. *This record is the result of the BioBankJapan Project (BBJ) genome−wide association studies (GWAS) dataset (GWAS 2019), and the rest are from the meta−database (GWAS 2022). rsID: number of SNP; Chr: chromosome; HaploReg: number of eQTL signals from HaploReg v4.2; GTEx: eQTL signals from GTEx V8 (in artery aorta, artery coronary, heart atrial appendage, and heart left ventricle); GSE16874: logFC between the heart failure group and control group; GSE95140: logFC between the HF group and control group; GSE141910: logFC between the HF group and control group. The “−” in these three columns means no significant expression. The “Y” in GTEx means the SNP showed an eQTL effect in the specific tissue described above, and the “N” means the SNP didn’t show eQTL effect in a specific tissue. The SNP rs3735081 was associated with chronic HF in a cross-ancestry GWAS (P = 5.48 × 10⁻⁵) and showed 6 eQTL signals. Differential expression analyses showed that GIMAP7 expression was higher in patients with HF than in controls in GSE168742 and GSE95140 (P = 5.01 × 10⁻⁵ and P = 3.36 × 10⁻¹⁰, respectively). The RNA immunoprecipitation and microarray analysis (RIP-chip) indicated a potential interaction between rs3735081 and PABPC1 (Supplementary Figure S1A, available in www.besjournal.com). The SNP rs3734264 was associated with chronic HF in a cross-ancestry GWAS (P = 4.98 × 10⁻⁴) and showed 65 eQTL signals. The GTEx eQTL calculator also indicated its effect on UHRF1BP1 expression in the aorta, coronary artery, right atrial appendage, and left ventricle. Different expression analyses showed that UHRF1BP1 expression was lower in patients with HF than in the controls in GSE95140 (P = 4.45 × 10⁻⁷). Furthermore, RIP-chip analysis indicated a potential interaction between rs3734264 and IGF2BP1 (Supplementary Figure S1B).
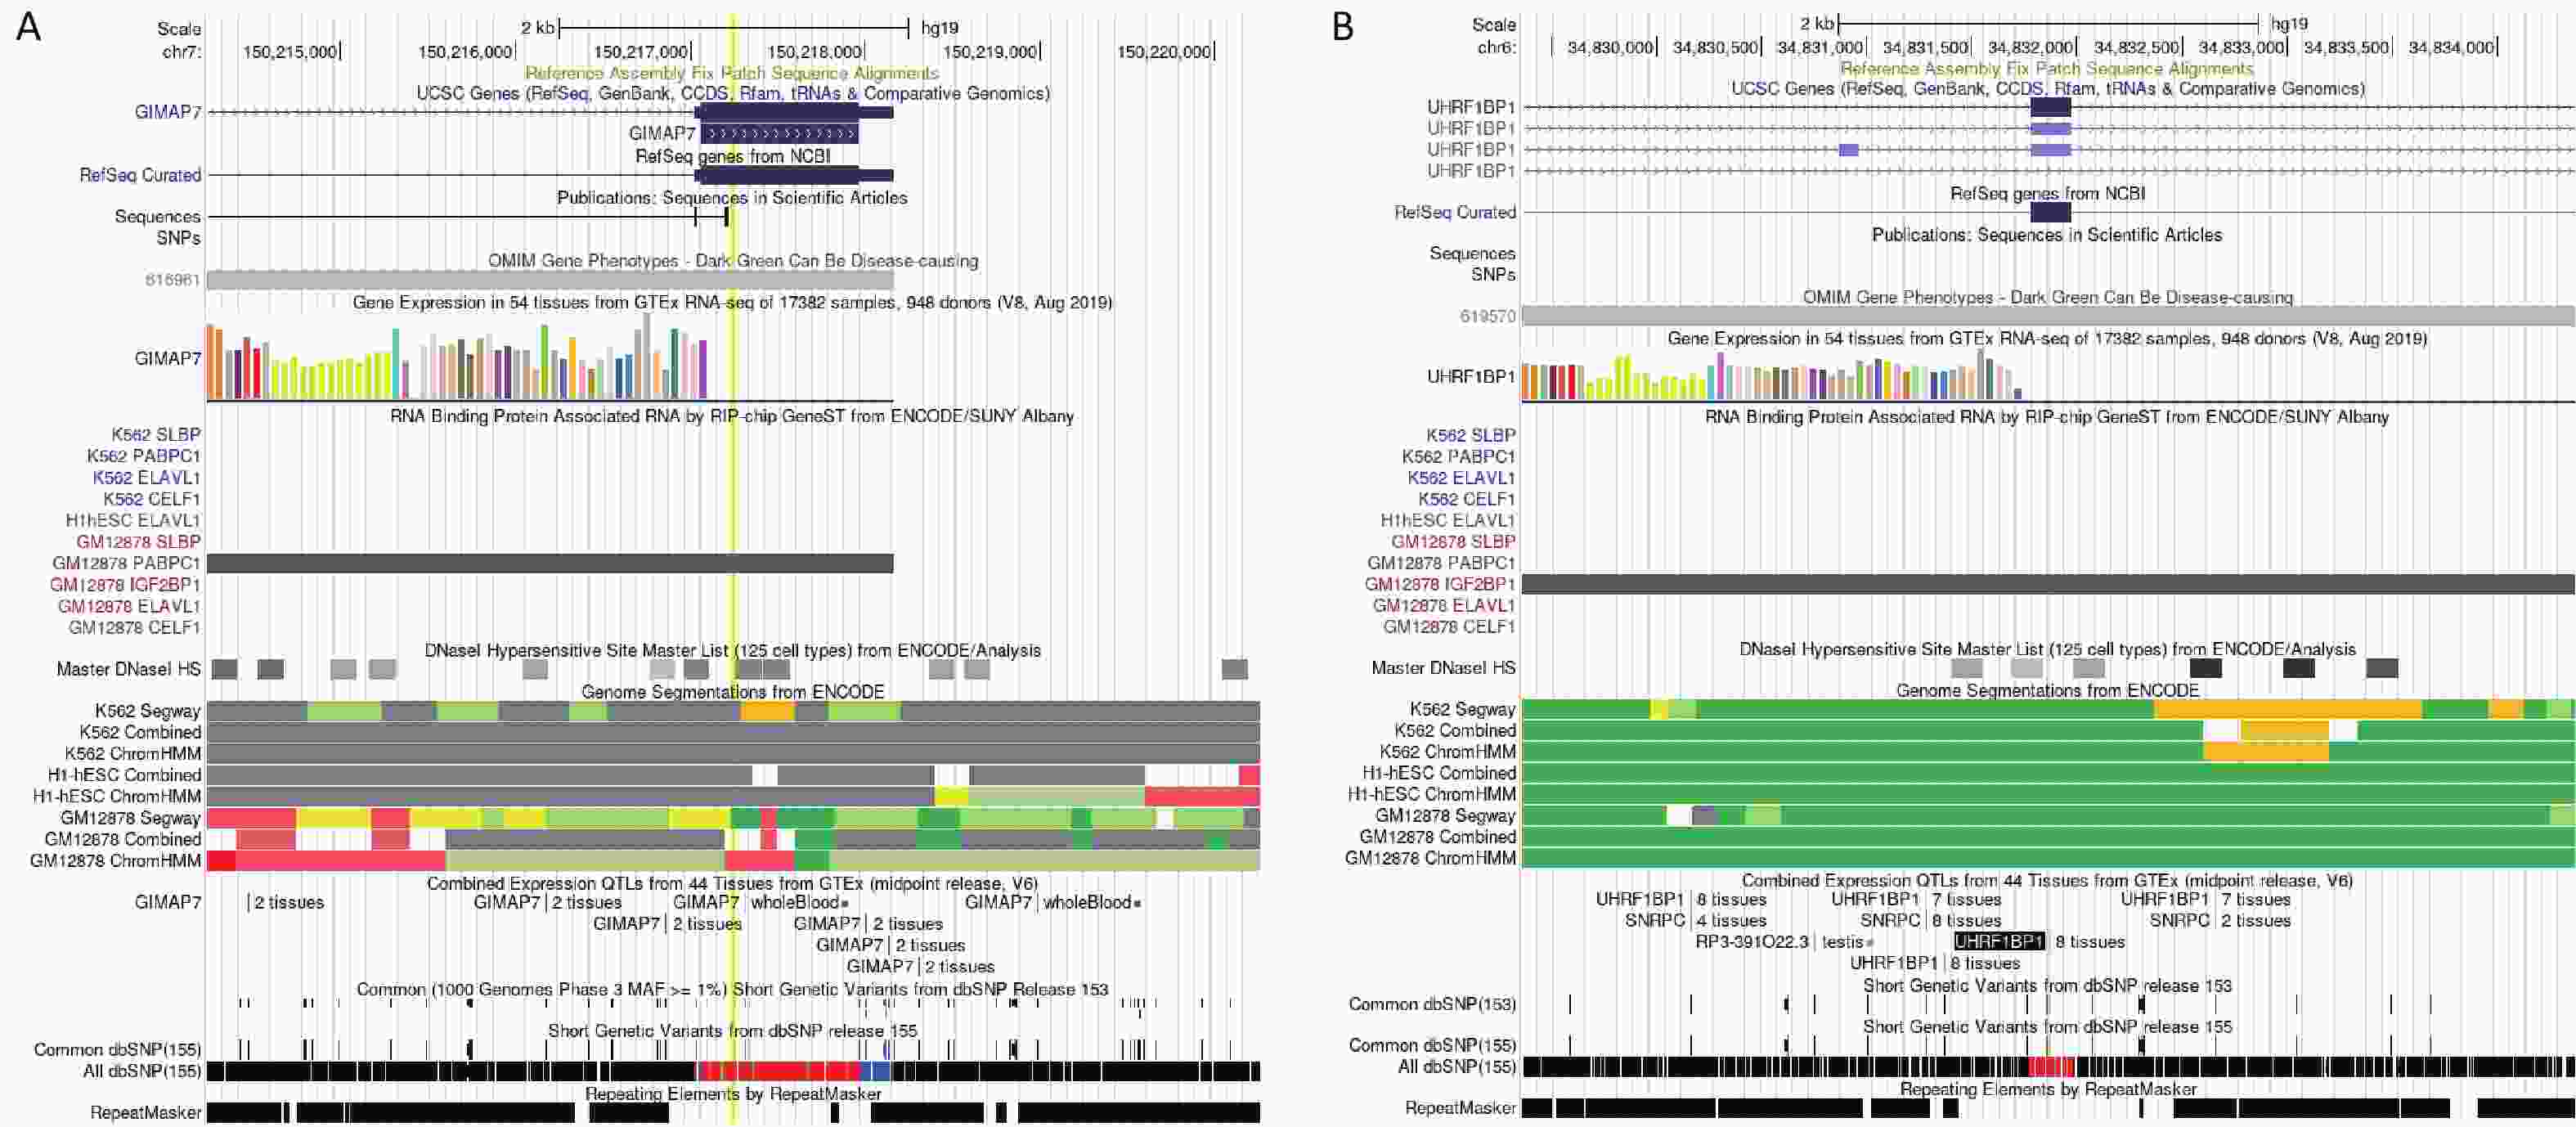
Figure S1. Potential function of rs3734264 and rs3735081 in UCSC browser. (A) The information of rs3735081 located at exon of GIAMP7. The RIP-chip indicated the potential interaction between rs3735081 and PABPC1. (B) The information of rs3734264 located at exon of UHRF1BP1. The RIP-chip GeneST analysis of ENCODE/SUNY Albany data indicated a potential interaction between rs3734264 and IGF2BP1.
-
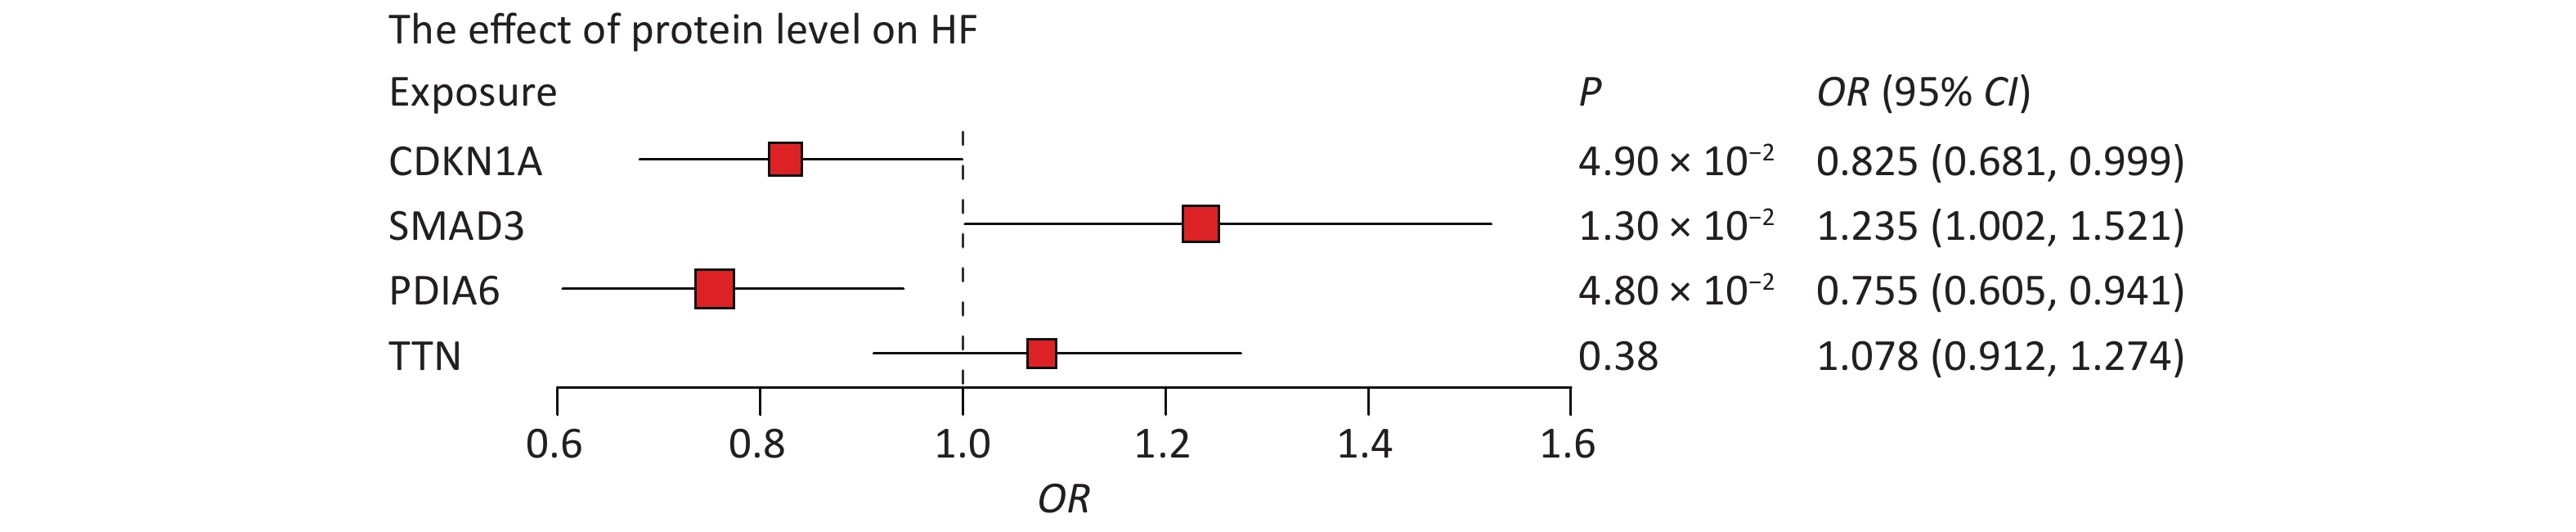
First, we tested whether four proteins were associated with HF. Indeed, MR results showed that CDKN1A (P = 4.90 × 10⁻²), PDIA6 (P = 1.30 × 10⁻²), and SMAD3 (P = 4.80 × 10⁻²) were associated with HF, whereas the association between TTN and HF was not statistically significant (Figure 5). Higher circulating levels of both CDKN1A (OR = 0.825, 95% CI, 0.681–0.999) and PDIA6 (OR = 0.755, 95% CI, 0.605–0.941) were associated with a lower risk of HF, while higher circulating levels of SMAD3 (OR = 1.235, 95% CI, 1.002–1.521) were associated with a higher risk of HF. In further bidirectional MR analyses, no reverse causality was observed for genetically predicted HF on CDKN1A (P = 0.20), PDIA6 (P = 0.10), or SMAD3 levels (P = 0.24) using the inverse variance weighted (IVW) method (
Supplementary Table S3 , available in www.besjournal.com).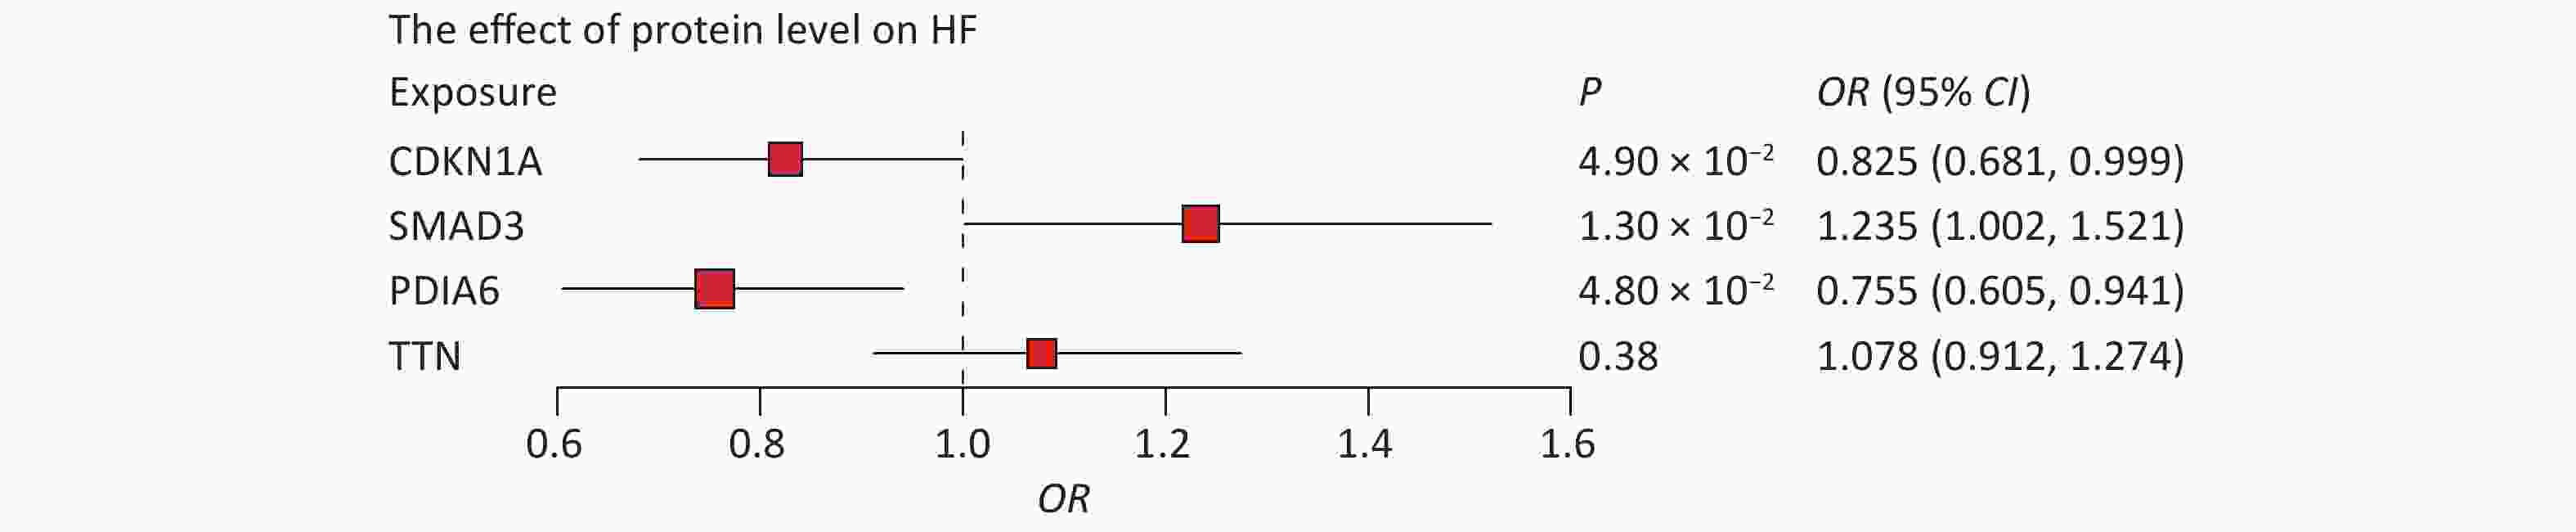
Figure 5. Associations of protein levels with HF. The point estimates are represented by a square along with the 95% confidence intervals. The size of the squares represented the standard error. CI, confidence interval; HF, heart failure; OR, odds ratio.
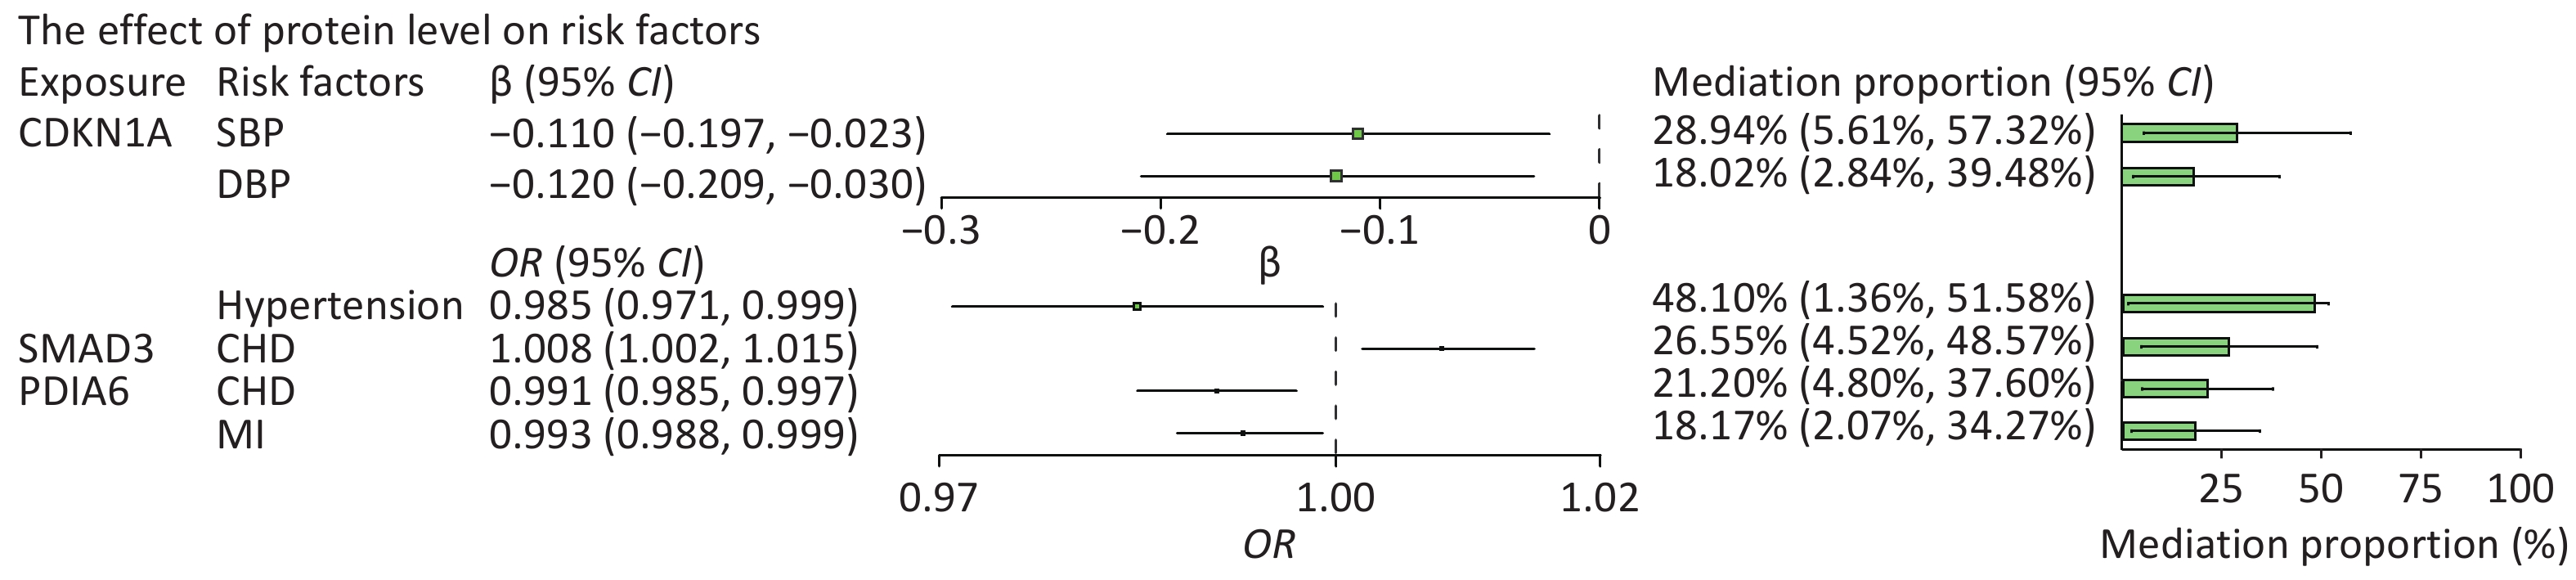
We then searched for causal associations between these proteins and a range of risk factors for HF. Among all risk factors assessed, the circulating level of CDKN1A was inversely associated with hypertension (OR = 0.985, 95% CI: 0.971 to 0.999), systolic BP (SBP) (β = −0.11, 95% CI: −0.197 to −0.023), and diastolic BP (DBP) (β = −0.12, 95% CI: −0.209 to −0.03). Circulating PDIA6 level was inversely associated with CHD (OR = 0.991, 95% CI, 0.985–0.997) and MI (OR = 0.993, 95% CI, 0.988–0.999). Circulating SMAD3 level was positively associated with CHD (OR = 1.008, 95% CI, 1.002–1.015). The circulating level of TTN was positively associated with DBP (β = 0.062, 95% CI: 0.006 to 0.117) and BMI (β = 0.111, 95% CI: 0.046 to 0.176). The aforementioned effects were significant for at least one method, and all five MR methods showed consistent associations. Statistically significant associations of CDKN1A, PDIA6 and SMAD3 with HF and its risk factors are shown in
Supplementary Tables S4.1, 4.2, and 4.3 (available in www.besjournal.com). -
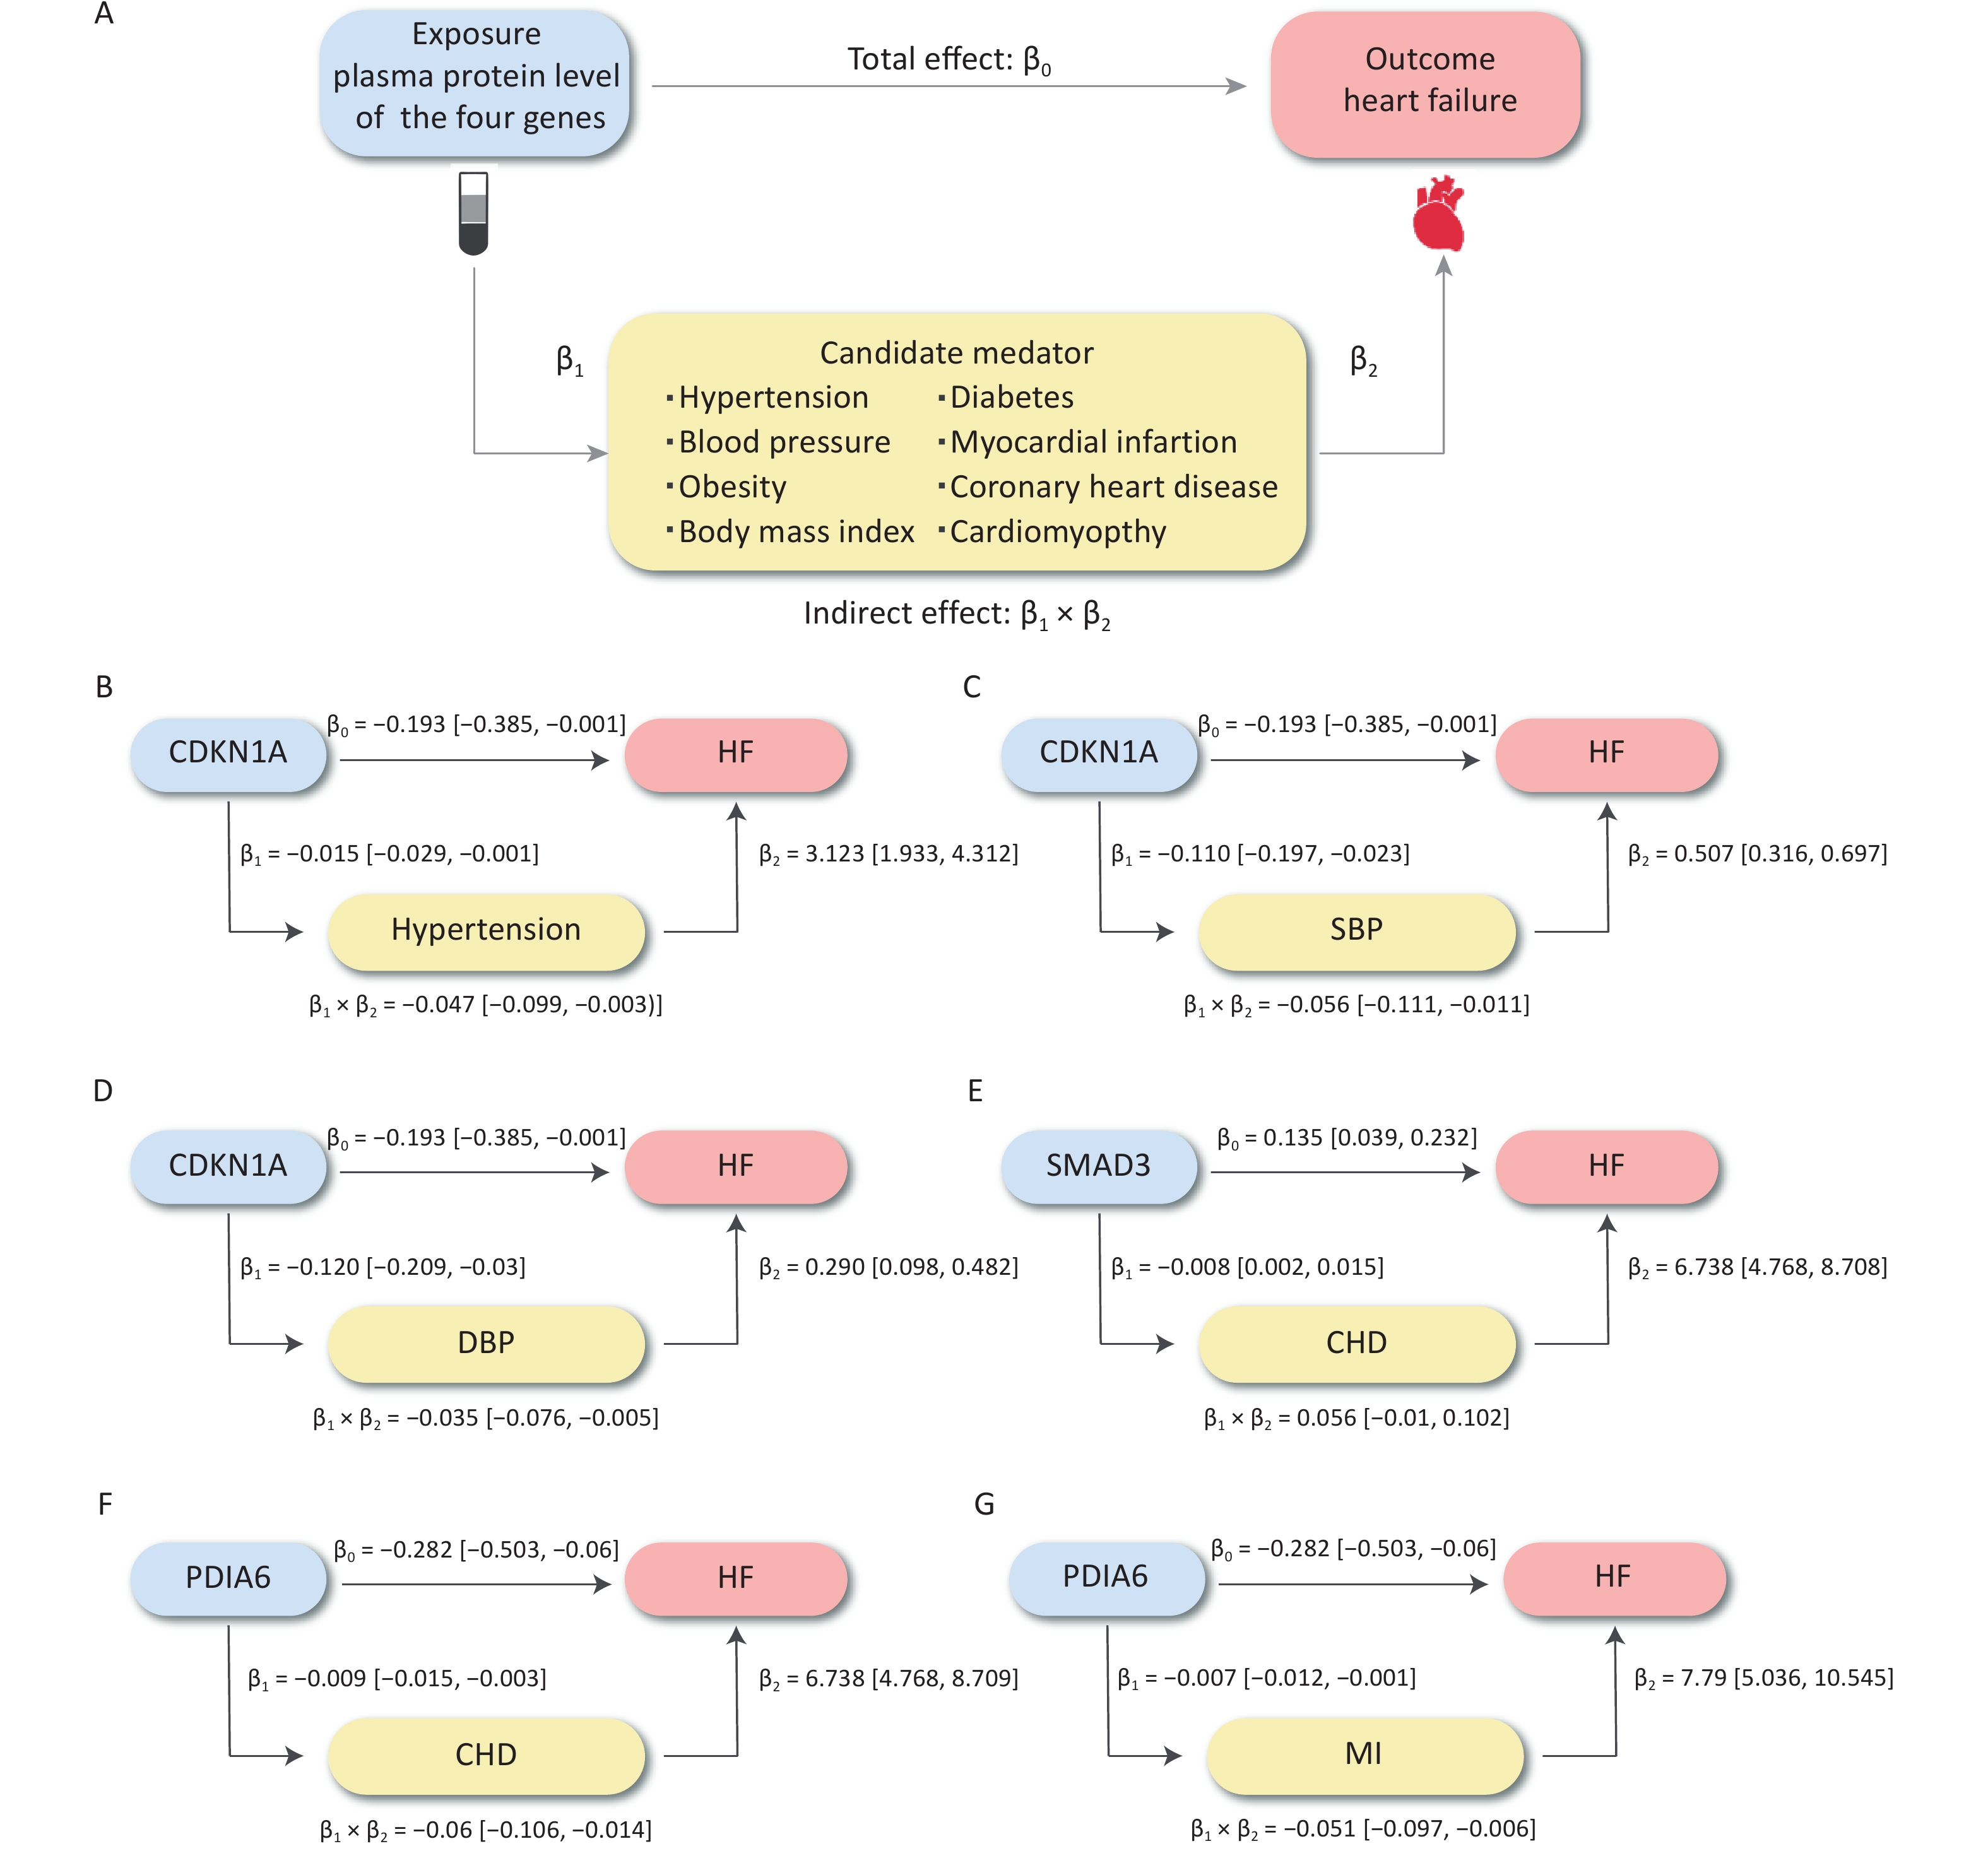
We further evaluated the potential mechanisms by which the significantly associated risk factors may influence the relationship between proteins and HF outcomes. The SNP rs1801270, which is located in the exon region of CDKN1A and has a medium confidence level, was associated with chronic HF in both the cross-ancestry GWAS (P = 4.89 × 10⁻⁴) and the East Asian GWAS (P = 7.75 × 10⁻⁶). Differential expression analyses showed that CDN1KA was highly expressed in both dilated cardiomyopathy and HF samples when compared to controls. We analyzed hypertension and BP as mediators of the pathway from CDKN1A to HF, as shown in Figure 6A. The association between CDKN1A and HF risk is likely mediated by hypertension and high BP. The total and mediation effects of the three mediators are shown in Figure 6B–D. The mediation effects (β1 × β2) of SBP, DBP, and hypertension were −0.056 (95% CI: −0.111 to −0.011), −0.035 (95% CI: −0.076 to −0.005) and −0.047 (95% CI: −0.099 to −0.003), respectively. Hypertension described 48.10% (95% CI: 1.36%–51.58%) of the total effect of CDKN1A on HF, followed by SBP (28.94%, 95% CI: 5.61%–57.32%) and DBP (18.02%, 95% CI: 2.84%–39.48%) (Figure 7). Overall, this suggests that CDKN1A may protect against HF by inhibiting the BP pathway.
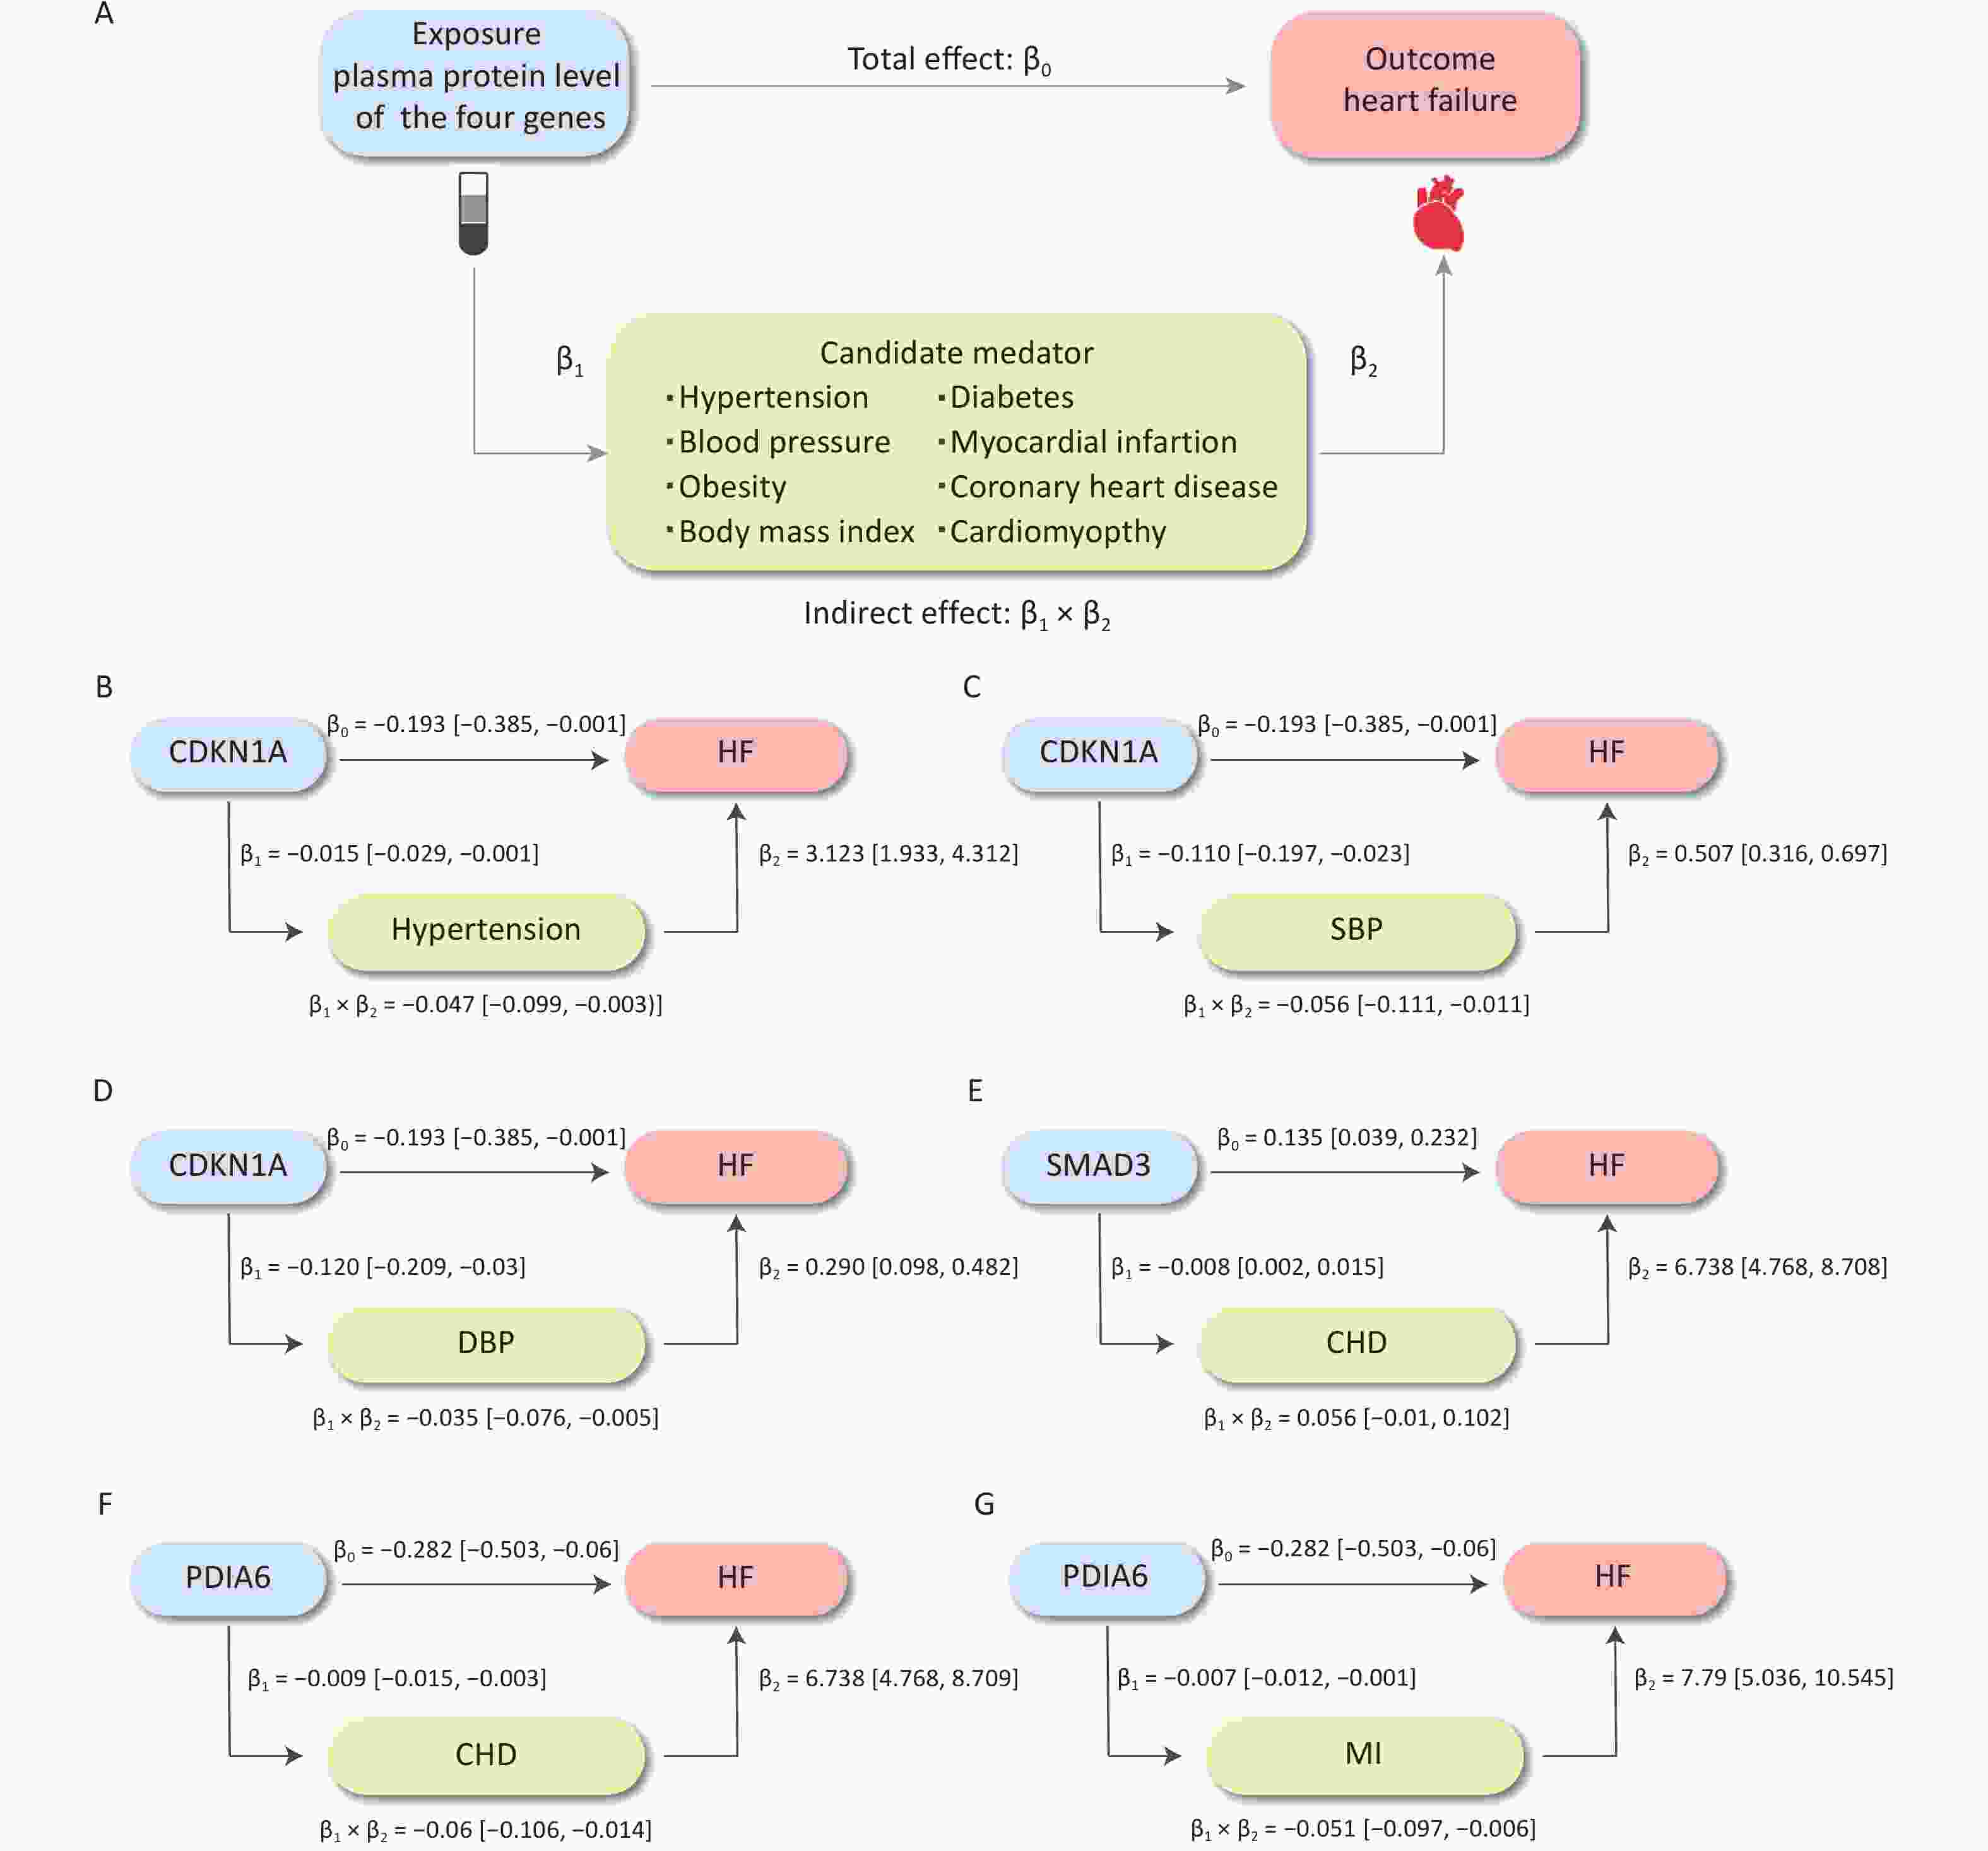
Figure 6. The causal effect of plasma protein on HF risk mediated by risk factors. (A) The overall design of mediation MR. (B–G) The effects of three proteins on HF, hypertension, SBP, DBP, CHD, and MI and the mediation proportion of three mediators. CHD, coronary heart disease; DBP, diastolic blood pressure; HF, heart failure; MI, myocardial infarction; MR, Mendelian randomization; SBP, systolic blood pressure.
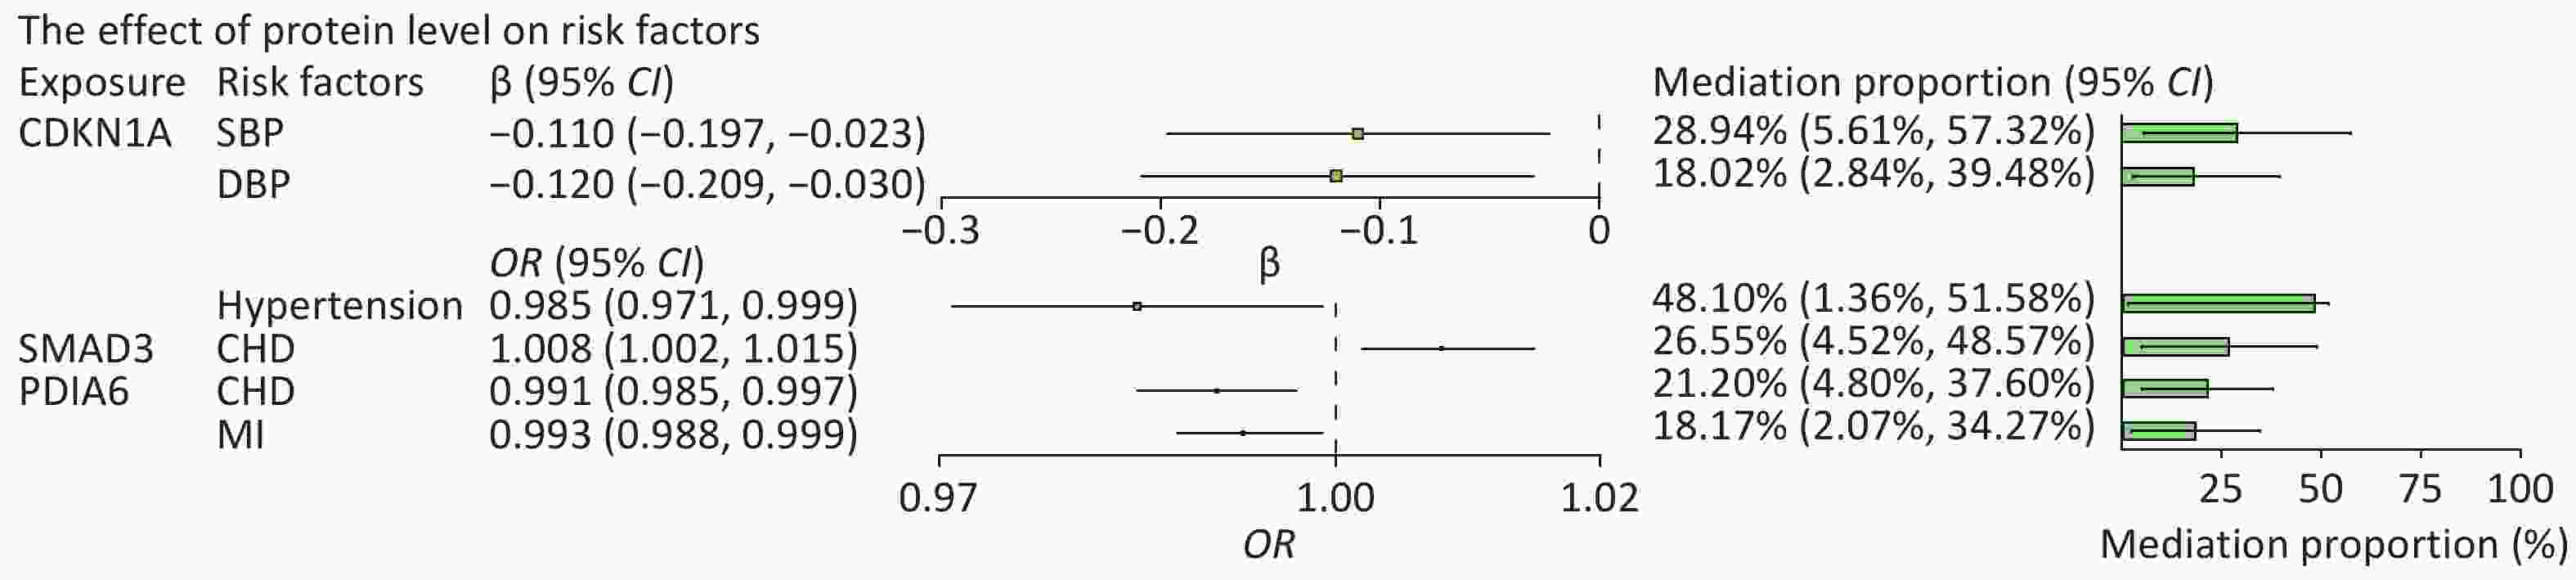
Figure 7. Effect of protein levels on mediators and mediating role of each mediator in associations of protein levels with heart failure. The point estimates were represented by a square along with the 95% confidence intervals. The size of the squares represented the standard error. CHD, coronary heart disease; CI, confidence interval; DBP, diastolic blood pressure; HF, heart failure; MI, myocardial infarction; OR, odds ratio; SBP, systolic blood pressure.
Following the same design, we subsequently analyzed the role of CHD and MI as mediators in the pathway from PDIA6 to HF and CHD as a mediator in the pathway from SMAD3 to HF. The total and mediation effects of the mediators are shown in Figure 6E–G. CHD explained 21.20% (95% CI: 4.80%–37.60%) of the total effect of PDIA6 on HF, followed by MI (18.17%, 95% CI: 2.07%–34.27%). CHD explained 26.55% (95% CI: 4.52%–48.57%) of the total effect of SMAD3 on HF (Figure 7).
-
In this study, we identified HF-associated m6A-SNPs by exploring large-scale GWAS data and performing eQTL analysis. Some genes, including CDKN1A, showed differential expression levels in cases with HF when compared to controls. The genetic association between plasma CDKN1A protein and HF was verified by MR analysis. Mediation analysis indicated that CDKN1A may influence HF through BP regulation. Consequently, we revealed the role of CDKN1A in HF development through its contribution to RNA modification, gene expression, and protein action, thereby providing new ideas for selecting therapeutic targets.
Recent studies have examined the relationships of m6A-SNP with BP[34] and coronary artery disease[35]. Indeed, GWAS data has revealed associations between SNPs located in CDKN1A and HF-associated risk traits, such as left ventricular systolic function (rs4135240)[5], pulse pressure (rs1801270)[36], hypertrophic cardiomyopathy (rs3176326)[37], and cardiovascular biological trait (rs2376620)[38]. In another HF GWAS, CDKN1A (rs4135240) was found to be associated with HF and reduced left ventricular systolic function[5]. In the present study, we examined HF-associated m6A-SNPs and found that 10 SNPs in CDKN1A and other genes showed eQTL effects in various tissues and cells. Susceptibility genes were significantly expressed in HF cases. Enrichment analysis revealed that these genes were enriched in processes related to positive regulation of protein import, transition of mitotic cell cycle, and establishment of protein localization to organelles. These results indicate that these genes may play roles in the regulation of molecular functions. Moreover, CDKN1A was identified as a critical gene and subsequently included in the MR analysis. The role of CDKN1A in cardiovascular diseases has been previously reported and validated through recent experiments on the regulation of various cardiovascular risk factors. CDKN1A encodes p21, a potent cell cycle inhibitor of postnatal cardiomyocyte cell cycle arrest[39], and regulates growth-related processes in cardiac hypertrophy[40]. Research has indicated that CDKN1A is repressed by hypoxia-inducible factor 1α (HIF1α), thereby affecting the proliferation of hypoxic fetal cardiomyocytes[41]. Whether the m6A-SNPs in CDKN1A affect the development of HF through these processes needs to be verified.
Both PDIA6 and SMAD3 were found to be associated with HF in an MR study. PDIA6 encodes a member of the disulfide isomerase family that catalyzes protein disulfide bond formation. It also protects cardiomyocytes from ischemia/reperfusion-induced death by promoting disulfide bond formation and enhancing ER protein folding[42]. In a mouse model of myocardial ischemia/reperfusion, PDIA6 was experimentally validated as a gene regulated by alternative splicing[43]. SMAD3 directly upregulates programmed cell death 5 (PDCD5) during cardiac fibrosis. SMAD3 has been shown to broadly regulate cardiac fibrosis through various pathways. For example, SMAD3 upregulates PDCD5 during myocardial fibrosis, which subsequently mitigates progressive fibrosis and cardiac dysfunction[44]. Additionally, SMAD3 critically regulates the function of infarcted macrophages by facilitating the phagocytic phenotype to an anti-inflammatory transition, thereby protecting the infarcted heart from adverse remodeling[45].
Our study is the first to report an association between the m6A-SNPs and the risk of HF. We have provided detailed annotations for these m6A-SNPs, which show that m6A-SNPs are critical for regulating mRNA in HF. Moreover, the strengths of our study include the relatively large sample size of the GWAS and the gene expression data used. Furthermore, we conducted extensive tests on the mediation of a broad range of risk factors in regulating HF progression, utilizing the largest available pQTL dataset to date.
Our study also has some limitations. First, the m6A-SNPs we screened out did not reach genome-wide significance. Second, experiments on animal models and cell lines were not conducted to further verify causal associations. Third, although the results of the sensitivity analyses passed the tests, the causal associations should be interpreted with caution, as several assumptions of the methods are untestable and the heterogeneity of the instrumental variables and residual horizontal pleiotropy might still distort some results. Fourth, we utilized GWAS summary data rather than individual data and could not further explore the differences in subgroups, such as sex and age. Hence, the potential genes and m6A-SNPs identified in this study require further verification to provide solid evidence for clinical diagnosis and prevention. Finally, as an exploratory study, we selected a relatively liberal FDR threshold to identify potentially meaningful results. This also means accepting a higher false positive rate, and future validation of the identified SNP loci and genes is necessary.
In conclusion, this study identified HF-related m6A-SNPs, especially in the CDKN1A gene. CDKN1A showed a significant association with HF in MR analysis, and the effects were mediated by BP. These findings, if confirmed in larger studies, may have further implications for the development and prevention of HF.
-
The data analyzed and reported in this manuscript are publicly available and can be accessed from various databases.
-
Table S1. Information on GWAS datasets in the MR study
Phenotype Unit Sample size (case/control) Population Consortium or cohort study Year of publication pQTL 1-SD 35,559 European (Icelanders) deCODE 2021 Heart failure Event 13,087/205,705 European FinnGen Biobank 2021 Systolic blood pressure 1-SD 436,419 European UK biobank 2018 Diastolic blood pressure 1-SD 317,756 European Neale Lab 2017 Hypertension Event 54,358/408,652 European UK Biobank 2018 Diabetes Event 22,340/439,238 European UK Biobank 2018 Obesity Event 4,688/458,322 European UK biobank 2018 Body mass index 1-SD 454,884 European UK biobank 2018 Coronary heart disease Event 10,157/351,037 European UK Biobank 2018 Cardiomyopathy Event 1,276/156,711 European FinnGen Biobank 2021 Myocardial infarction Event 7,018/354,176 European UK Biobank 2018 Note. SD, standard deviation. Table S2. The HF−related m6A−SNPs with the information of GWAS, gene expression difference, and eQTL signals
rsID Chr Effect allele
frequencybeta P Gene Gene region Confidence level HaploReg GTEx GSE168742 GSE95140 GSE141910 rs1801270* 6 0.068 0.015 7.75E−06 CDKN1A CDS Medium 1 N 3.315 1.525 − rs2030259 2 0.2252 0.0272 1.41E−05 KDM3A CDS Low 2 N − −1.344 − rs55838432 7 0.4671 −0.0324 1.81E−05 POM121C UTR5 Low 120 Y − − − rs1731260 2 0.526 0.022 2.14E−05 KCNK3 UTR3 Low 5 Y − − 1.037/1.049 rs41302673 9 0.9065 −0.0409 2.27E−05 C9orf96 CDS Low 13 N − − − rs6900607 6 0.742 −0.1006 4.21E−05 SHPRH CDS Low 2 N − −1.833 − rs28411034† 1 0.0354 / 4.55E−05 MTF1 UTR3 Low 72 Y − − − rs62618736 2 0.0507 −0.2212 5.24E−05 TTN CDS Low 0 N −3.098 1.187 − rs1731259 2 0.4721 −0.022 5.31E−05 KCNK3 UTR3 Low 4 Y − − 1.037/1.049 rs3735081 7 0.3297 0.0218 5.48E−05 GIMAP7 CDS Low 6 N 2.367 3.742 − rs11555142 7 0.1168 −0.0346 7.34E−05 ATP5J2−PTCD1, PTCD1 CDS Low 13 N − − − rs4233729 2 0.5413 0.0202 7.36E−05 TRMT61B CDS High 58 Y − − − rs2955355 17 0.612 −0.0214 8.40E−05 GID4 CDS Low 19 N − − − rs45449696 14 0.3701 0.0245 9.92E−05 CEP170B CDS Low 0 N − − − rs147001392 10 0.9874 −0.3761 1.01E−04 CACUL1 UTR3 Low 0 N − − − rs3743342 15 0.2679 −0.0228 1.48E−04 SMAD3 UTR3 Low 15 Y − − − rs7729926 5 0.6377 −0.0195 1.61E−04 KIF20A Intron Low 7 N − − − rs11748963 5 0.6695 0.0219 1.70E−04 PROB1 CDS Low 45 Y − − − rs8065203 17 0.027 −0.2802 2.06E−04 CYTH1 CDS Low 0 N − −1.883 − rs1048414 6 0.6044 0.0505 2.49E−04 HLA−DQA1 CDS Low 196 N − − −1.322/−1.261 rs6874933 5 0.5128 −0.0188 2.54E−04 PLEKHG4B UTR3 Low 6 N − − − rs4799 2 0.4529 0.0185 2.65E−04 PDIA6 CDS Medium 7 N − − − rs12410992 1 0.9508 0.1062 2.73E−04 B3GALT2 UTR3 Low 0 N − − − rs422145 16 0.0124 −0.8203 2.76E−04 TLDC1 CDS Low 0 N − − − rs73590585 19 0.872 −0.0282 2.97E−04 KMT2B CDS Low 3 N − − − rs1842233 2 0.7657 −0.0221 3.61E−04 XIRP2 CDS Low 0 N − − − rs61751894 6 0.0987 0.0298 4.26E−04 ZNF311 CDS Low 1 N − − − rs3024463 6 0.1427 −0.1135 4.66E−04 F13A1 UTR3 Low 0 N − − 1.036/1.307 rs11545587 6 0.105 0.0289 4.74E−04 TRIM27 UTR5 Medium 2 N − 1.187 − rs1801270 6 0.238 0.0285 4.89E−04 CDKN1A CDS Medium 1 N 3.315 1.525 − rs62078340 17 0.0297 −0.0653 4.90E−04 SEC14L1 UTR3 Low 0 N 3.030 2.397 − rs3734264 6 0.3533 0.0185 4.98E−04 UHRF1BP1 CDS Low 65 Y − −1.305 − rs2235868 6 0.509 −0.0174 5.00E−04 GLP1R CDS Low 0 N − − − rs35120633 11 0.0621 0.0387 5.34E−04 ZNF259 CDS Low 0 N − − − rs8081747 17 0.0643 −0.0471 5.38E−04 SLC38A10 UTR5 Low 0 N − − − rs60495707 4 0.0122 0.3068 5.44E−04 BDH2, SLC9B2 CDS, CDS Low 0 N 1.236 − − rs1128159 3 0.5114 0.017 6.57E−04 HCLS1 UTR3 Low 5 N − − − rs1128416 2 0.4429 −0.0175 7.14E−04 PPP1CB CDS Low 57 N 1.641 − − rs12122948 1 0.9582 −0.0458 7.97E−04 LRRC39 CDS Low 8 N − − − rs6962772 7 0.7646 0.0213 8.17E−04 ZNF789 CDS Low 14 N − − − rs66523653 2 0.0457 −0.1924 8.44E−04 TTN CDS Low 1 N −3.098 1.187 − rs1801206 4 0.5848 0.0181 8.65E−04 WFS1 CDS Low 8 N −1.858 − − rs7143282 14 0.0238 0.238 8.73E−04 SAMD4A UTR3 Low 0 N −1.803 − − rs2128414 1 0.0686 −0.0382 9.43E−04 PEX14 CDS Medium 0 N − − − rs6587625 1 0.2098 0.0214 9.52E−04 THEM5 CDS Low 5 N 3.315 1.525 − Note: *Result from BBJ GWAS dataset (GWAS 2019), †This record is from the Finngene database (GWAS2021). The rest of the records are all from meta GWAS dataset (GWAS2022). rsid: the number of SNP; Chr: Chromosome; HaploReg: the number of eQTL signals from HaploReg v4.2; GTEx: the eQTL signals from GTEx V8 (in artery aorta, artery coronary, heart atrial appendage, and heart left ventricle); GSE16874: the logFC between HF group and healthy group; GSE95140: the logFC between HF group and healthy group; GSE141910: the logFC between HF group and health group. The “/” means no information in GWAS dataset. The “−” in these three columns means no significant expression. The “Y” in GTEx means the SNP showed eQTL effects in specific organisms described above, and the “N” means the SNP didn’t show eQTL effect in a specific tissue. Table S3. The results of bidirectional MR results of bidirectional MR analysis between three proteins and heart failure*
Exposure Outcome Method No. of SNPs# SE P β (95% CI) Heart failure CDKN1A MR Egger 16 0.030 0.494 −0.021 (−0.08,0.038) Weighted median 16 0.026 0.744 −0.009 (−0.06,0.043) Inverse variance weighted 16 0.022 0.204 0.028 (−0.015,0.071) Simple mode 16 0.035 0.893 −0.005 (−0.074,0.065) Weighted mode 16 0.026 0.854 −0.005 (−0.056,0.046) PDIA6 MR Egger 6 0.148 0.303 −0.175 (−0.466,0.116) Weighted median 6 0.085 0.096 −0.141 (−0.307,0.025) Inverse variance weighted 6 0.067 0.101 −0.11 (−0.241,0.021) Simple mode 6 0.125 0.255 −0.161 (−0.405,0.084) Weighted mode 6 0.125 0.238 −0.168 (−0.414,0.078) SMAD3 MR Egger 11 0.126 0.656 −0.058 (−0.305,0.189) Weighted median 11 0.064 0.153 −0.091 (−0.215,0.034) Inverse variance weighted 11 0.054 0.244 −0.063 (−0.168,0.043) Simple mode 11 0.116 0.200 −0.159 (−0.386,0.068) Weighted mode 11 0.124 0.286 −0.14 (−0.383,0.103) Note: *β coefficients (95% CIs) derived from the IVW, weighted median, weighted ratio, weighted median, and MR Egger methods. #The numbers of SNPs used as IVs in the inverse variance weighted, weighted median, weighted ratio and MR Egger methods. All statistical tests were two−sided. P < 0.05 and FDR < 0.2 was considered significant. Table S4.1. The two−sample MR between CDKN1A and heart failure, diastolic blood pressure, systolic blood pressure and hypertension*
Exposure Outcome Method No. of SNPs# SE P FDR β (95% CI) OR (95% CI) CDKN1A Heart failure MR Egger 8 0.176 0.963 0.963 − 1.008 (0.715, 1.423) Weighted median 8 0.128 0.597 0.932 − 0.935 (0.713, 1.225) Inverse variance weighted 8 0.098 0.049 0.195 − 0.825 (0.681, 0.999) Simple mode 8 0.189 0.672 0.853 − 0.92 (0.621, 1.363) Weighted mode 8 0.144 0.563 0.941 − 0.916 (0.703, 1.194) Essential hypertension MR Egger 7 0.017 0.102 0.409 − 0.966 (0.934, 0.999) Weighted median 7 0.008 0.191 0.336 − 0.99 (0.974, 1.005) Inverse variance weighted 7 0.007 0.036 0.133 − 0.985 (0.971, 0.999) Simple mode 7 0.012 0.423 0.563 − 0.99 (0.967, 1.012) Weighted mode 7 0.012 0.421 0.592 − 0.99 (0.968, 1.012) Diastolic blood pressure MR Egger 8 0.046 0.040 0.159 −0.120 (−0.209, −0.030) − Weighted median 8 0.030 0.657 0.766 −0.013 (−0.077, 0.050) − Inverse variance weighted 8 0.028 0.727 0.960 −0.010 (−0.065, 0.045) − Simple mode 8 0.053 0.737 0.741 −0.019 (−0.124, 0.086) − Weighted mode 8 0.052 0.744 0.750 −0.018 (−0.122, 0.086) − Systolic blood pressure MR Egger 8 0.045 0.048 0.193 −0.110 (−0.197, −0.023) − Weighted median 8 0.027 0.745 0.851 −0.009 (−0.059, 0.042) − Inverse variance weighted 8 0.025 0.436 0.720 −0.020 (−0.070, 0.030) − Simple mode 8 0.048 0.915 0.909 −0.005 (−0.092, 0.081) − Weighted mode 8 0.046 0.852 0.740 −0.009 (−0.102, 0.084) − Note: *β coefficients (95% CIs) and ORs coefficients (95% CIs) derived from the IVW, weighted median, weighted ratio, weighted median, and MR Egger methods. #The numbers of SNPs used as IVs in the inverse variance weighted, weighted median, weighted ratio and MR Egger methods. All statistical tests were two−sided. P < 0.05 and FDR < 0.2 was considered significant. Table S4.2. The two-sample MR between PDIA6 and heart failure, coronary heart disease, myocardial infarction*
Exposure Outcome Method No. of SNPs# SE P FDR OR (95% CI) PDIA6 Heart failure MR Egger 9 0.192 0.339 0.383 0.821 (0.564, 1.196) Weighted median 9 0.146 0.017 0.068 0.705 (0.529, 0.94) Inverse variance weighted 9 0.113 0.013 0.050 0.755 (0.605, 0.941) Simple mode 9 0.222 0.106 0.424 0.667 (0.431, 1.031) Weighted mode 9 0.210 0.095 0.379 0.672 (0.446, 1.014) Coronary heart disease MR Egger 9 0.006 0.044 0.177 0.986 (0.976, 0.997) Weighted median 9 0.004 0.010 0.040 0.989 (0.982, 0.997) Inverse variance weighted 9 0.003 0.006 0.021 0.991 (0.985, 0.997) Simple mode 9 0.006 0.125 0.502 0.99 (0.978, 1.002) Weighted mode 9 0.006 0.072 0.286 0.988 (0.977, 0.999) Myocardial infarction MR Egger 9 0.005 0.156 0.625 0.993 (0.983, 1.002) Weighted median 9 0.004 0.054 0.172 0.993 (0.986, 1.000) Inverse variance weighted 9 0.003 0.014 0.057 0.993 (0.988, 0.999) Simple mode 9 0.005 0.295 0.380 0.995 (0.986, 1.004) Weighted mode 9 0.004 0.136 0.418 0.993 (0.985, 1.001) Note: *ORs coefficients (95% CIs) derived from the IVW, weighted median, weighted ratio, weighted median, and MR Egger methods. #The numbers of SNPs used as IVs in the inverse variance weighted, weighted median, weighted ratio and MR Egger methods. All statistical tests were two-sided. P < 0.05 and FDR < 0.2 was considered significant. The Benjamini-Hochberg method was used to control FDR for multiple testing. Table S4.3. The two-sample MR between SMAD3 and heart failure, coronary heart disease, and cardiomyopathy*
Exposure Outcome Method No. of SNPs# SE P FDR OR (95% CI) SMAD3 Heart failure MR Egger 9 0.160 0.456 0.608 1.127 (0.823, 1.541) Weighted median 9 0.283 0.175 0.351 1.532 (0.88, 2.668) Inverse variance weighted 9 0.107 0.048 0.096 1.235 (1.002, 1.521) Simple mode 9 0.237 0.881 0.881 0.964 (0.606, 1.535) Weighted mode 9 0.207 0.840 0.940 1.044 (0.696, 1.568) Coronary heart disease MR Egger 8 0.004 0.076 0.151 1.008 (0.999, 1.016) Weighted median 8 0.008 0.996 0.996 1,000 (0.984, 1.017) Inverse variance weighted 8 0.003 0.011 0.021 1.008 (1.002, 1.015) Simple mode 8 0.008 0.375 0.527 1.007 (0.992, 1.023) Weighted mode 8 0.008 0.405 0.540 1.007 (0.991, 1.024) Cardiomyopathy MR Egger 9 1.377 0.031 0.123 0.024 (0.002, 0.363) Weighted median 9 0.634 0.341 0.455 0.547 (0.158, 1.895) Inverse variance weighted 9 0.574 0.074 0.296 0.359 (0.117, 1.105) Simple mode 9 1.206 0.683 0.970 0.600 (0.056, 6.376) Weighted mode 9 0.965 0.548 0.730 0.546 (0.082, 3.618) Note: *ORs coefficients (95% CIs) derived from the IVW, weighted median, weighted ratio, weighted median, and MR Egger methods. #The numbers of SNPs used as IVs in the inverse variance weighted, weighted median, weighted ratio and MR Egger methods. All statistical tests were two-sided. P < 0.05 and FDR < 0.2 was considered significant. The Benjamini-Hochberg method was used to control FDR for multiple testing.
全文HTML
Determination of HF-associated m6A-SNPs
eQTL Analysis
Gene Expression Analysis
pQTL-MR and Mediation Analysis
HF-associated m6A-SNPs
The Impact of m6A-SNPs on Gene Expression
Target Genes Differentially Expressed in HF
Integrative Analyses Indicate Several SNPs may Potentially Affect m6A Modification
MR Analysis Indicated the Association of Critical Proteins with Heart Failure and Its Risk Factors
Mediator Analysis Showed CDKN1A and Other Proteins may Affect HF by Risk Factor Pathways
 24188+.pdf
|

|

 Quick Links