

 下载:
下载:

-
Between 1990 and 2021, the proportion of global disability-adjusted life years attributed to mental disorders increased from 3.46% to 5.38%, making it one of the top 10 leading causes of the global burden[1]. The World Health Organization has listed anxiety disorders, including obsessive-compulsive disorder (OCD), as the sixth largest contributor to nonfatal health loss globally[2,3]. OCD is a mental and behavioral condition in which a person experiences intrusive thoughts (obsessions) and feels compelled to repeatedly perform certain rituals (compulsions) to alleviate the distress caused by the obsession[4]. Cognitive-behavioral theories suggest that OCD can often lead to an increase in anxiety or a sense of discomfort, resulting in a more extensive disease burden[5].
Previous observational studies suggested that body composition, such as body mass index (BMI), was linked to several psychiatric disorders[6-8]. Notably, individuals with OCD may tend to have lower rates of obesity and excess weight[9,10], and conversely, the prevalence of OCD is relatively low in obese individuals[11]. Several studies suggest that in addition to BMI, more attention should be given to indicators such as fat distribution, as these indicators may have superior predictive value[12,13]. However, the causal relationship and direction between fat mass (FM) and OCD remain unclear, and the results of observational studies may be influenced by confounding bias or reverse causality factors[9]. Fortunately, emerging genomics studies have allowed us to infer their causality by leveraging the Mendelian randomization (MR) approach. As the genetic variants are randomly allocated at conception, MR analysis could overcome the underlying reverse causation and confounding, similar to a randomized controlled trial.
In this study, we utilized the two-sample MR approach[14], which is based on publicly available summary statistics, to infer the causal association between genetically predicted FM and OCD, providing new insights into preventing psychiatric disorders.
-
We used summary statistics from publicly available genome-wide association studies (GWASs) to conduct two-sample MR analyses. We aimed to evaluate whether there was a causal association between FM and OCD. MR analysis relies on the following three assumptions: (1) instrumental variables (IVs) are strongly correlated with exposure; (2) IVs are not related to the confounding factors affecting the “exposure-outcome” pathway; and (3) IVs affect outcomes solely through the exposure variable.
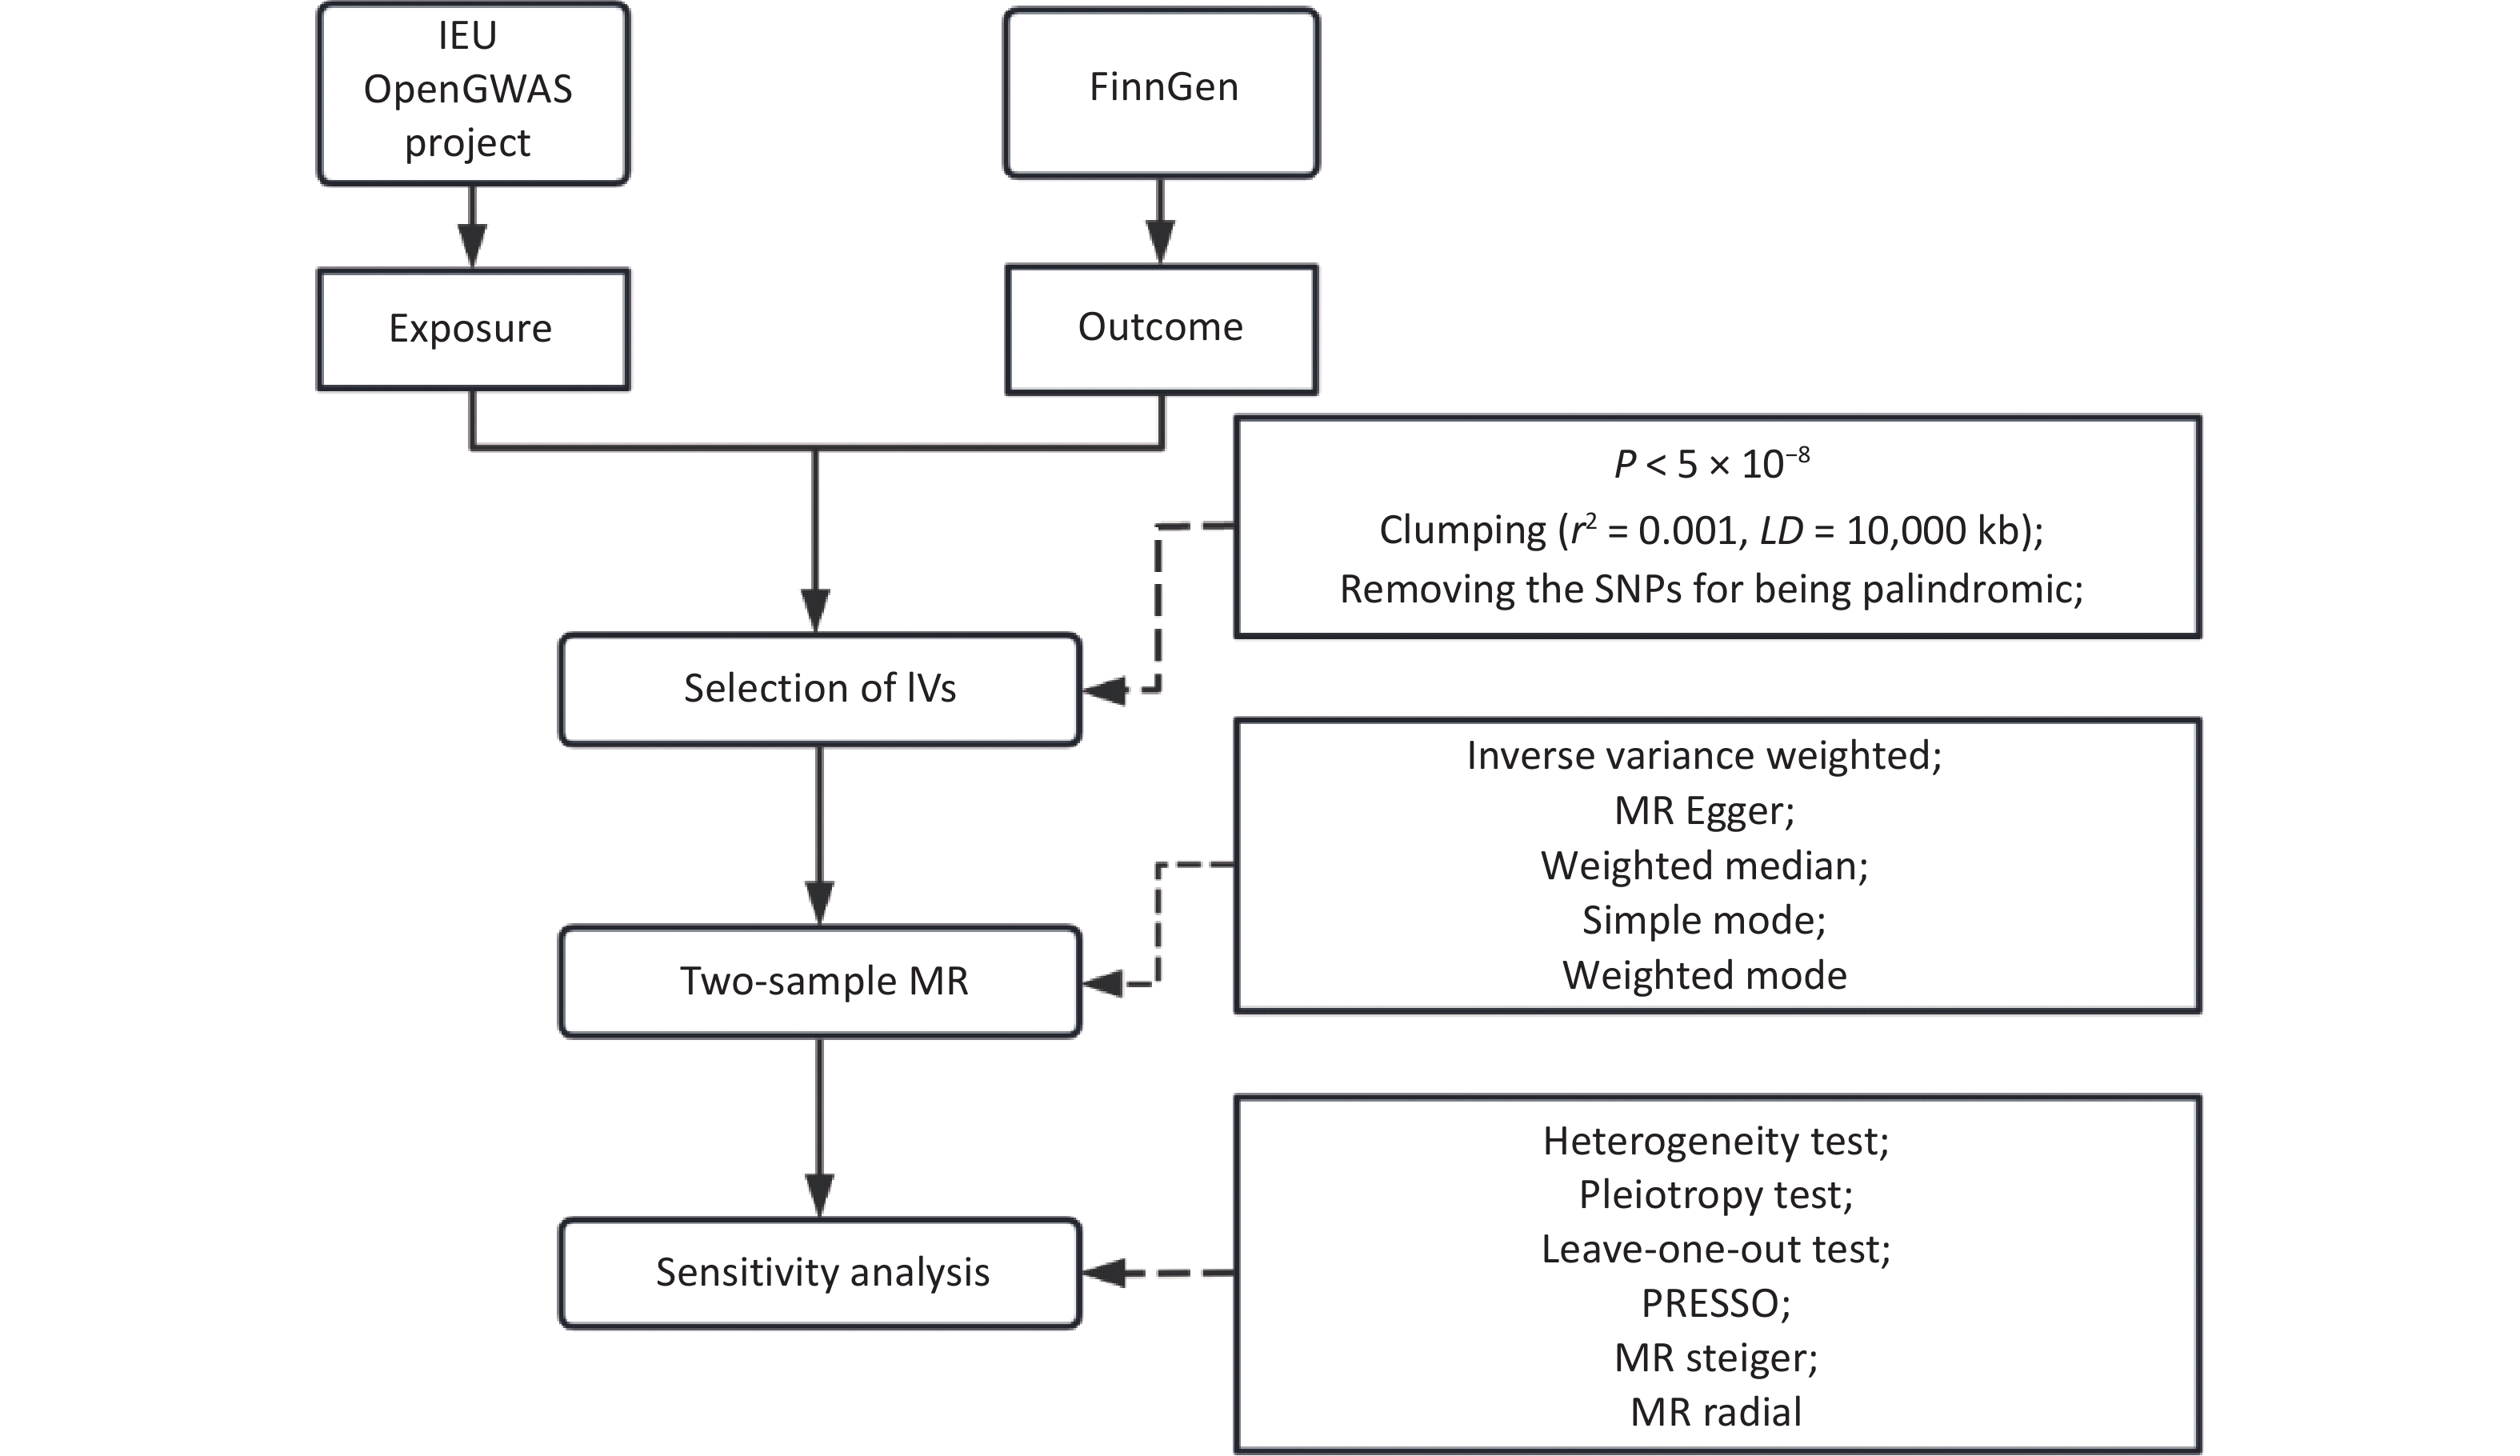
We searched for and retrieved the summary statistical data of the exposure and outcome variables from the IEU Open GWAS project and the FinnGen consortium. We selected single nucleotide polymorphisms (SNPs) that were independently associated with exposure at genome-wide significance levels (P < 5×10⁻⁸, r2 < 0.001 within a 10,000 k-base-pair window). Subsequently, palindromic SNPs were removed. Two-sample MR was then conducted using five methods to estimate causality. Multiple corrections were conducted for the primary analysis. Heterogeneity tests, pleiotropic tests, leave-one-out tests, MR pleiotropy residual sum and outlier (MR-PRESSO) tests, MR Steiger tests of directionality, MR radial tests, and sensitivity analyses were also performed to test the robustness of the causality results, as shown in Figure 1 for the technical roadmap. In addition, given that the education variable strongly predicted FM, fat-free mass (FFM), and body fat percentage (BF%), we performed sensitivity analyses after excluding SNPs associated with education (P < 5×10⁻⁸). The reverse causality between FM and OCD was further explored.
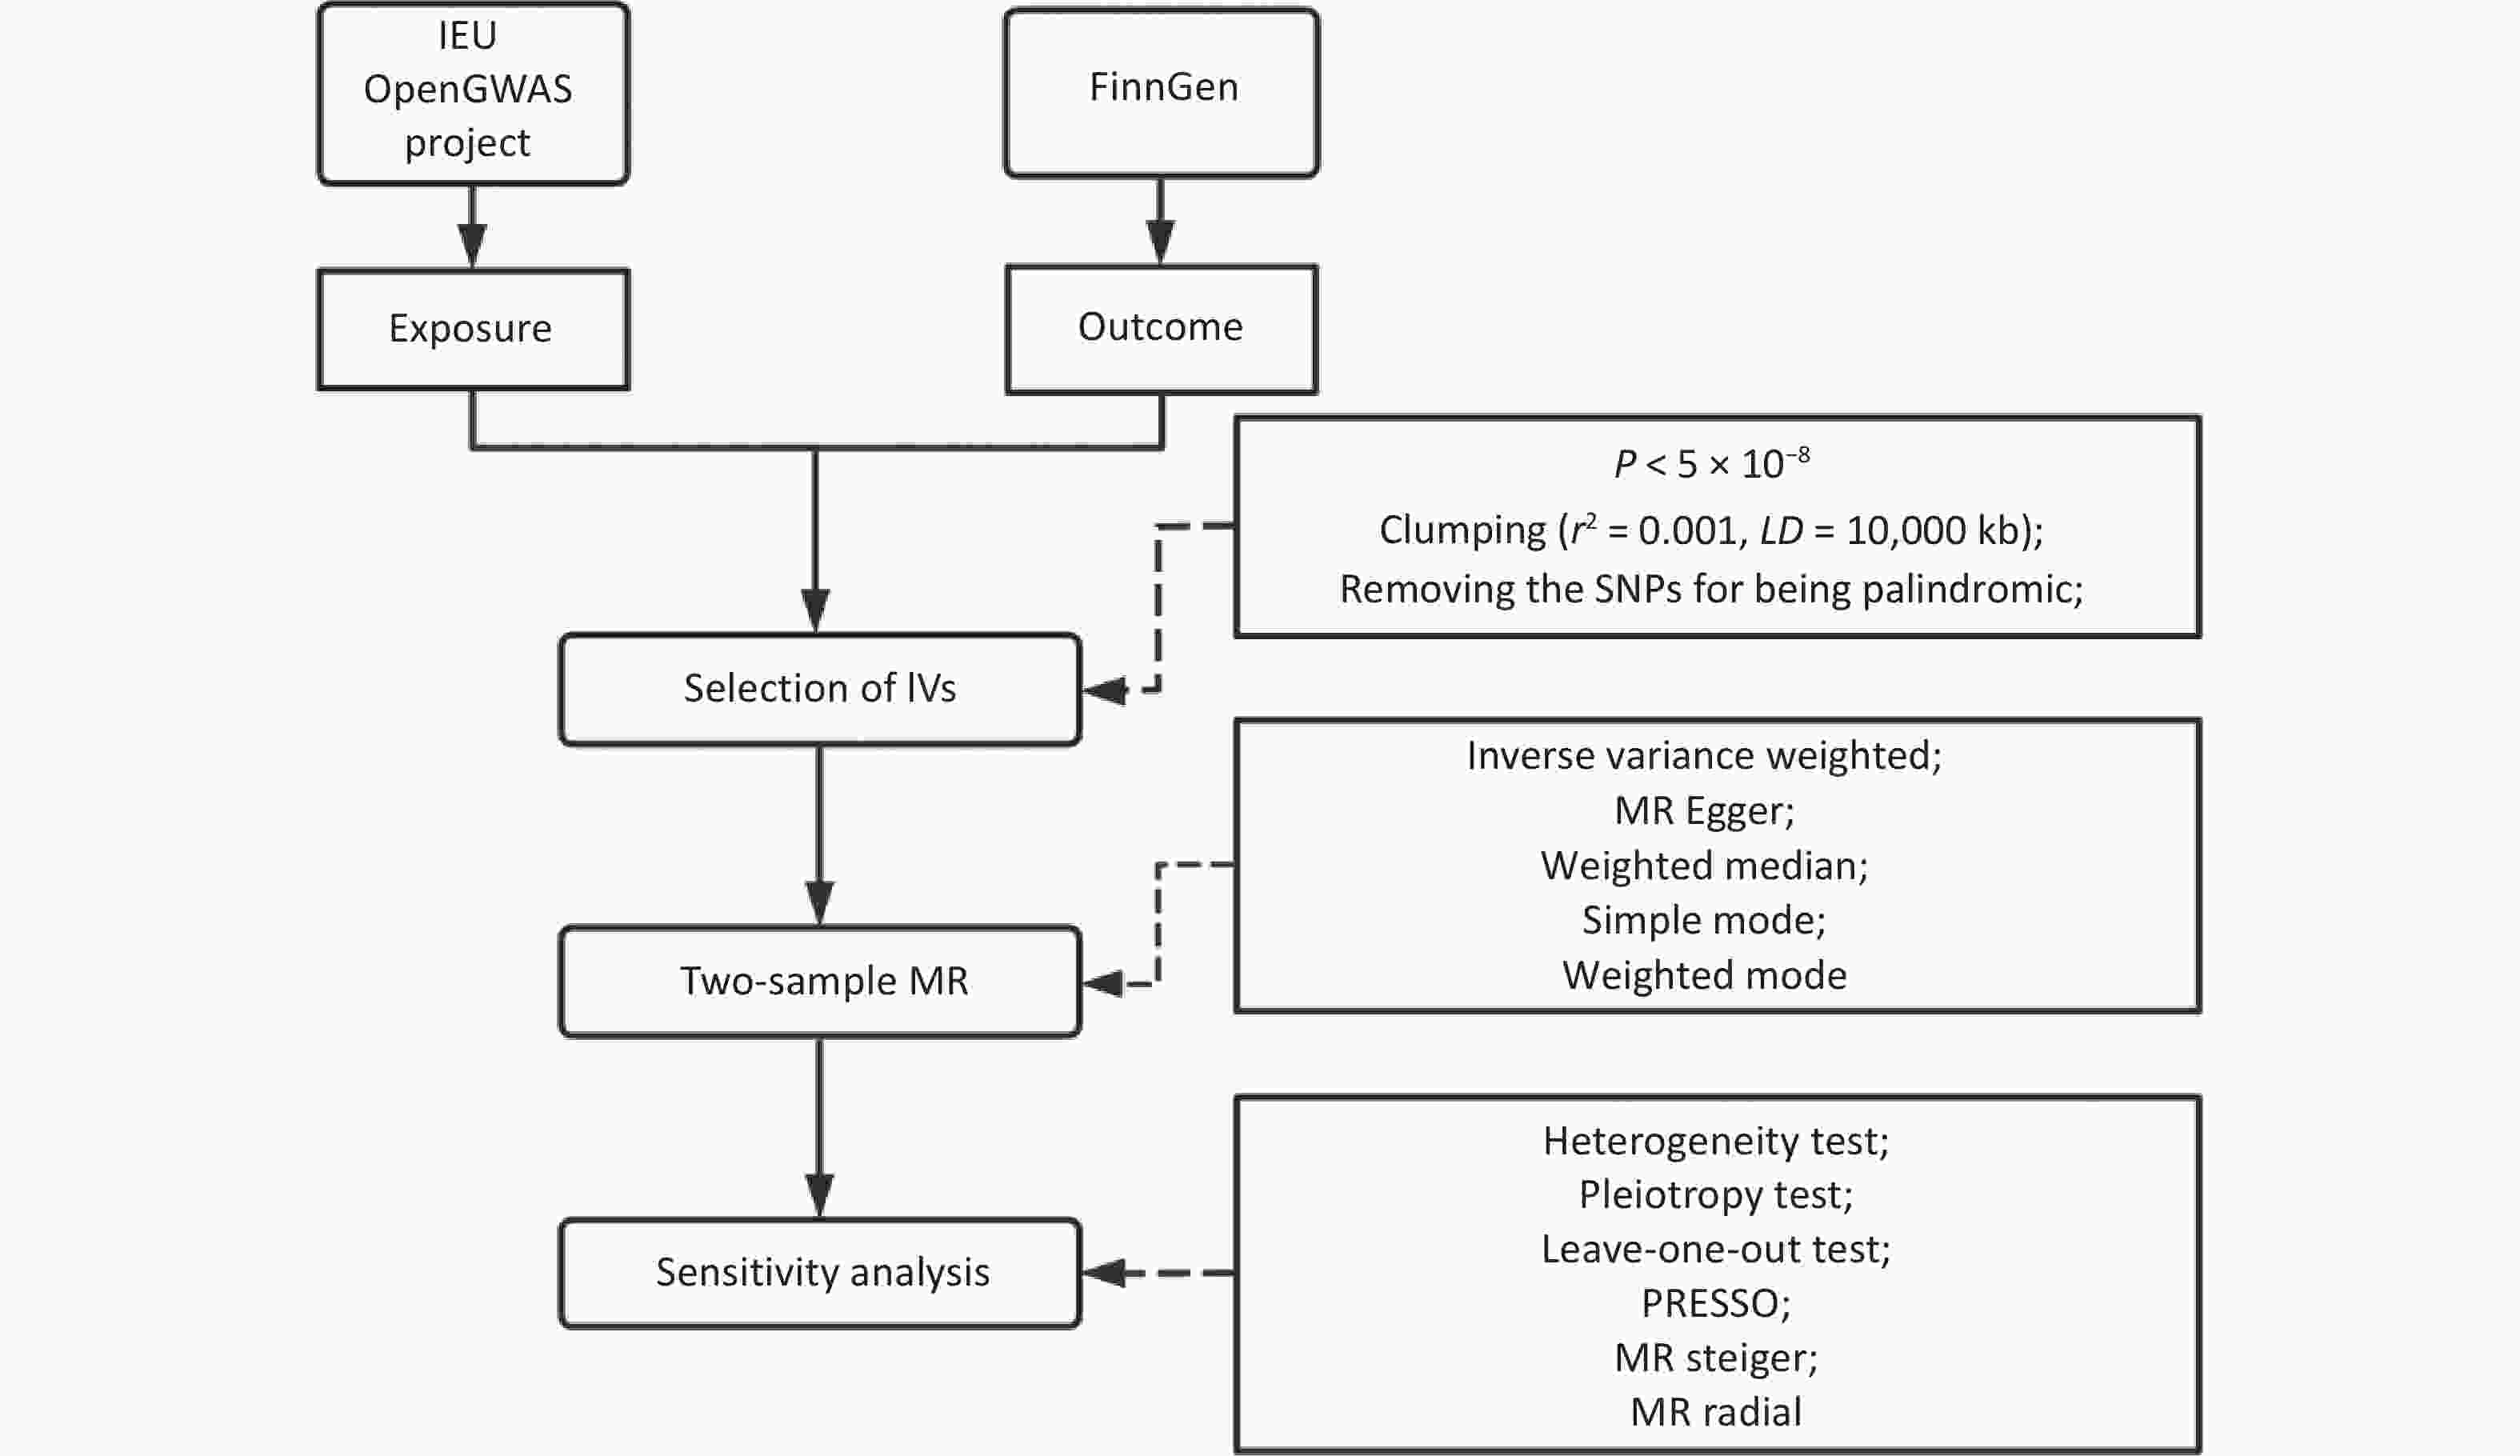
Figure 1. The technical roadmap for the study. IV, instrumental variable; P, P value; LD, Linkage Disequilibrium; kb, kilobases; SNP, single nucleotide polymorphism; MR, Mendelian randomization; PRESSO, pleiotropy residual sum and outlier.
-
Our study obtained summary statistics from GWASs conducted by various international consortiums involving all participants of European ancestry. The available summary statistics for both sexes were combined. We chose the most recent GWAS with the largest sample size for the primary analysis and the other for the sensitivity analysis (Table 1).
Table 1. Summary of genome-wide association studies used in the present study
Phenotype GWAS ID Consortium Sample size, n SNPs, n Year ICD-10 Total Case Control Exposure FM ukb-b-19393 MRC-IEU 454,137 − − 9,851,867 2018 − FM * ukb-a-265 Neale Lab 330,762 − − 10,894,596 2017 − FFM ukb-b-13354 MRC-IEU 454,850 − − 9,851,867 2018 − FFM * ukb-a-266 Neale Lab 331,291 − − 10,894,596 2017 − BF% ukb-b-8909 MRC-IEU 454,633 − − 9,851,867 2018 − BF% * ukb-a-264 Neale Lab 331,117 − − 10,894,596 2017 Education ebi-a-GCST90029012 − 470,941 − − 11,972,619 2018 Outcome OCD finn-b-F5-OCD FinnGen 339,539 1,962 337,577 16,380,384 2021 ICD-10 F42; ICD-9 3003; ICD-8 3003 OCD * ieu-a-1189 PGC 9,725 2,688 7,037 8,409,517 2017 DSM-IV Note. *: The summary statistical data were utilized for the sensitivity analyses. All the populations were of European ancestry and included males and females; SNP, single nucleotide polymorphism; FM, fat mass; FFM, fat-free mass; BF%, body fat percentage; OCD, obsessive-compulsive disorder; MRC-IEU, MRC Integrative Epidemiology Unit; PGC, The Psychiatric Genomics Consortium; ICD, The International Statistical Classification of Diseases and Related Health Problems. DSM-IV, Diagnostic and Statistical Manual of Mental Disorders, 4th edition. The selection of exposure-associated SNPs for genetic instruments was based on GWAS searches in the IEU Open GWAS project[15,16]. The GWAS data from the MRC-IEU and Neale Lab were output from the GWAS pipeline using Phesant-derived variables from the UK Biobank[17]. All three exposure phenotypes were continuous variables measured by a bioelectrical impedance analyser[18].
SNPs with genome-wide significant (P < 5×10⁻⁸) associations with exposure phenotypes were selected. The variants were subsequently pruned by linkage disequilibrium (r2 < 0.001 within 10,000 k-base-pair windows). The F-statistic was applied to evaluate the instrument strength. SNPs with an F-statistic greater than 10 were considered strong instruments[19]. No weak instrumental variables were found among the above. After excluding the palindromic sequence, 396, 512, and 367 independent SNPs were identified as IVs for FM, FFM, and BF%, respectively.
Genetic variants associated with OCD were obtained from the FinnGen consortium[20] and the PGC consortium[21]. In the FinnGen consortium, OCD was diagnosed according to the International Statistical Classification of Diseases and Related Health Problems 9th and 10th Revision. All patients from the PGC met the Diagnostic and Statistical Manual of Mental Disorders 4th edition[21]. The median age at first onset of OCD was 24.94 years. There was no overlap between the participants in the exposure and outcome studies.
We used publicly available summary data for which no additional ethical committee approval or participant informed consent was needed. The checklist for strengthening the reporting of observational studies in epidemiology using MR (STROBE-MR) was followed (Supplementary Table S1)[22].
-
After selecting the IVs, we implemented two-sample MR based on five analytical approaches: inverse variance weighted (IVW), MR-Egger, weighted median, simple mode, and weighted mode methods. IVW served as the primary estimator because it yields the most efficient pooled estimate under the assumption of either no directional pleiotropy or balanced pleiotropy across variants. The MR-Egger method incorporates an intercept term to identify and correct unbalanced pleiotropy, while it may be biased and inflated Type I error rates[23]. The weighted median method provides a consistent causal effect when at least 50% of the total weight derives from valid instruments, thereby tolerating a substantial proportion of invalid SNPs[24]. The simple and weighted mode estimators rely on the zero-modal pleiotropy assumption and provide a consistent causal estimation if the largest group of SNP-specific estimates originates from valid instruments[25]. Given its superior statistical power, IVW estimates were regarded as the primary results, with the other four methods serving as sensitivity analyses[25,26]. The Wald method and delta approach were utilized to estimate the causal ratio and confidence interval (CI) of the single IV, respectively. The effect of each SNP is weighted by the inverse of the variance of the ratio estimator. The results of the IVW method were corrected by the false discovery rate (FDR) and Bonferroni method. The association between the exposure variables and OCD with a P value < 0.05/3 = 0.0167 (Bonferroni correction for multiple testing) was considered significant.
Heterogeneity tests, pleiotropy tests, leave-one-out tests, and sensitivity analyses were performed to evaluate the robustness of the findings. The Cochran’s Q test was used to determine the heterogeneity between the causal estimates of different genetic variants[27]. The MR-PRESSO test and the slope of the MR‒Egger regression were applied to monitor the potential horizontal pleiotropy effect[28]. The MR Steiger test of directionality was performed to validate the direction of the association between exposure and OCD. The MR radial method[29] detected outliers, which were then excluded from the sensitivity analysis. In addition, the summary statistics of different data sources were used to examine the robustness of the primary results.
All analyses were performed using R software (version 4.2.3, R Foundation for Statistical Computing, Vienna, Austria). “TwoSampleMR”[15], “MR-PRESSO”[28], “RadialMR”[29], “ggplot2” and other software packages were utilized for statistical analysis and visualization. P < 0.05 was considered to indicate statistical significance.
-
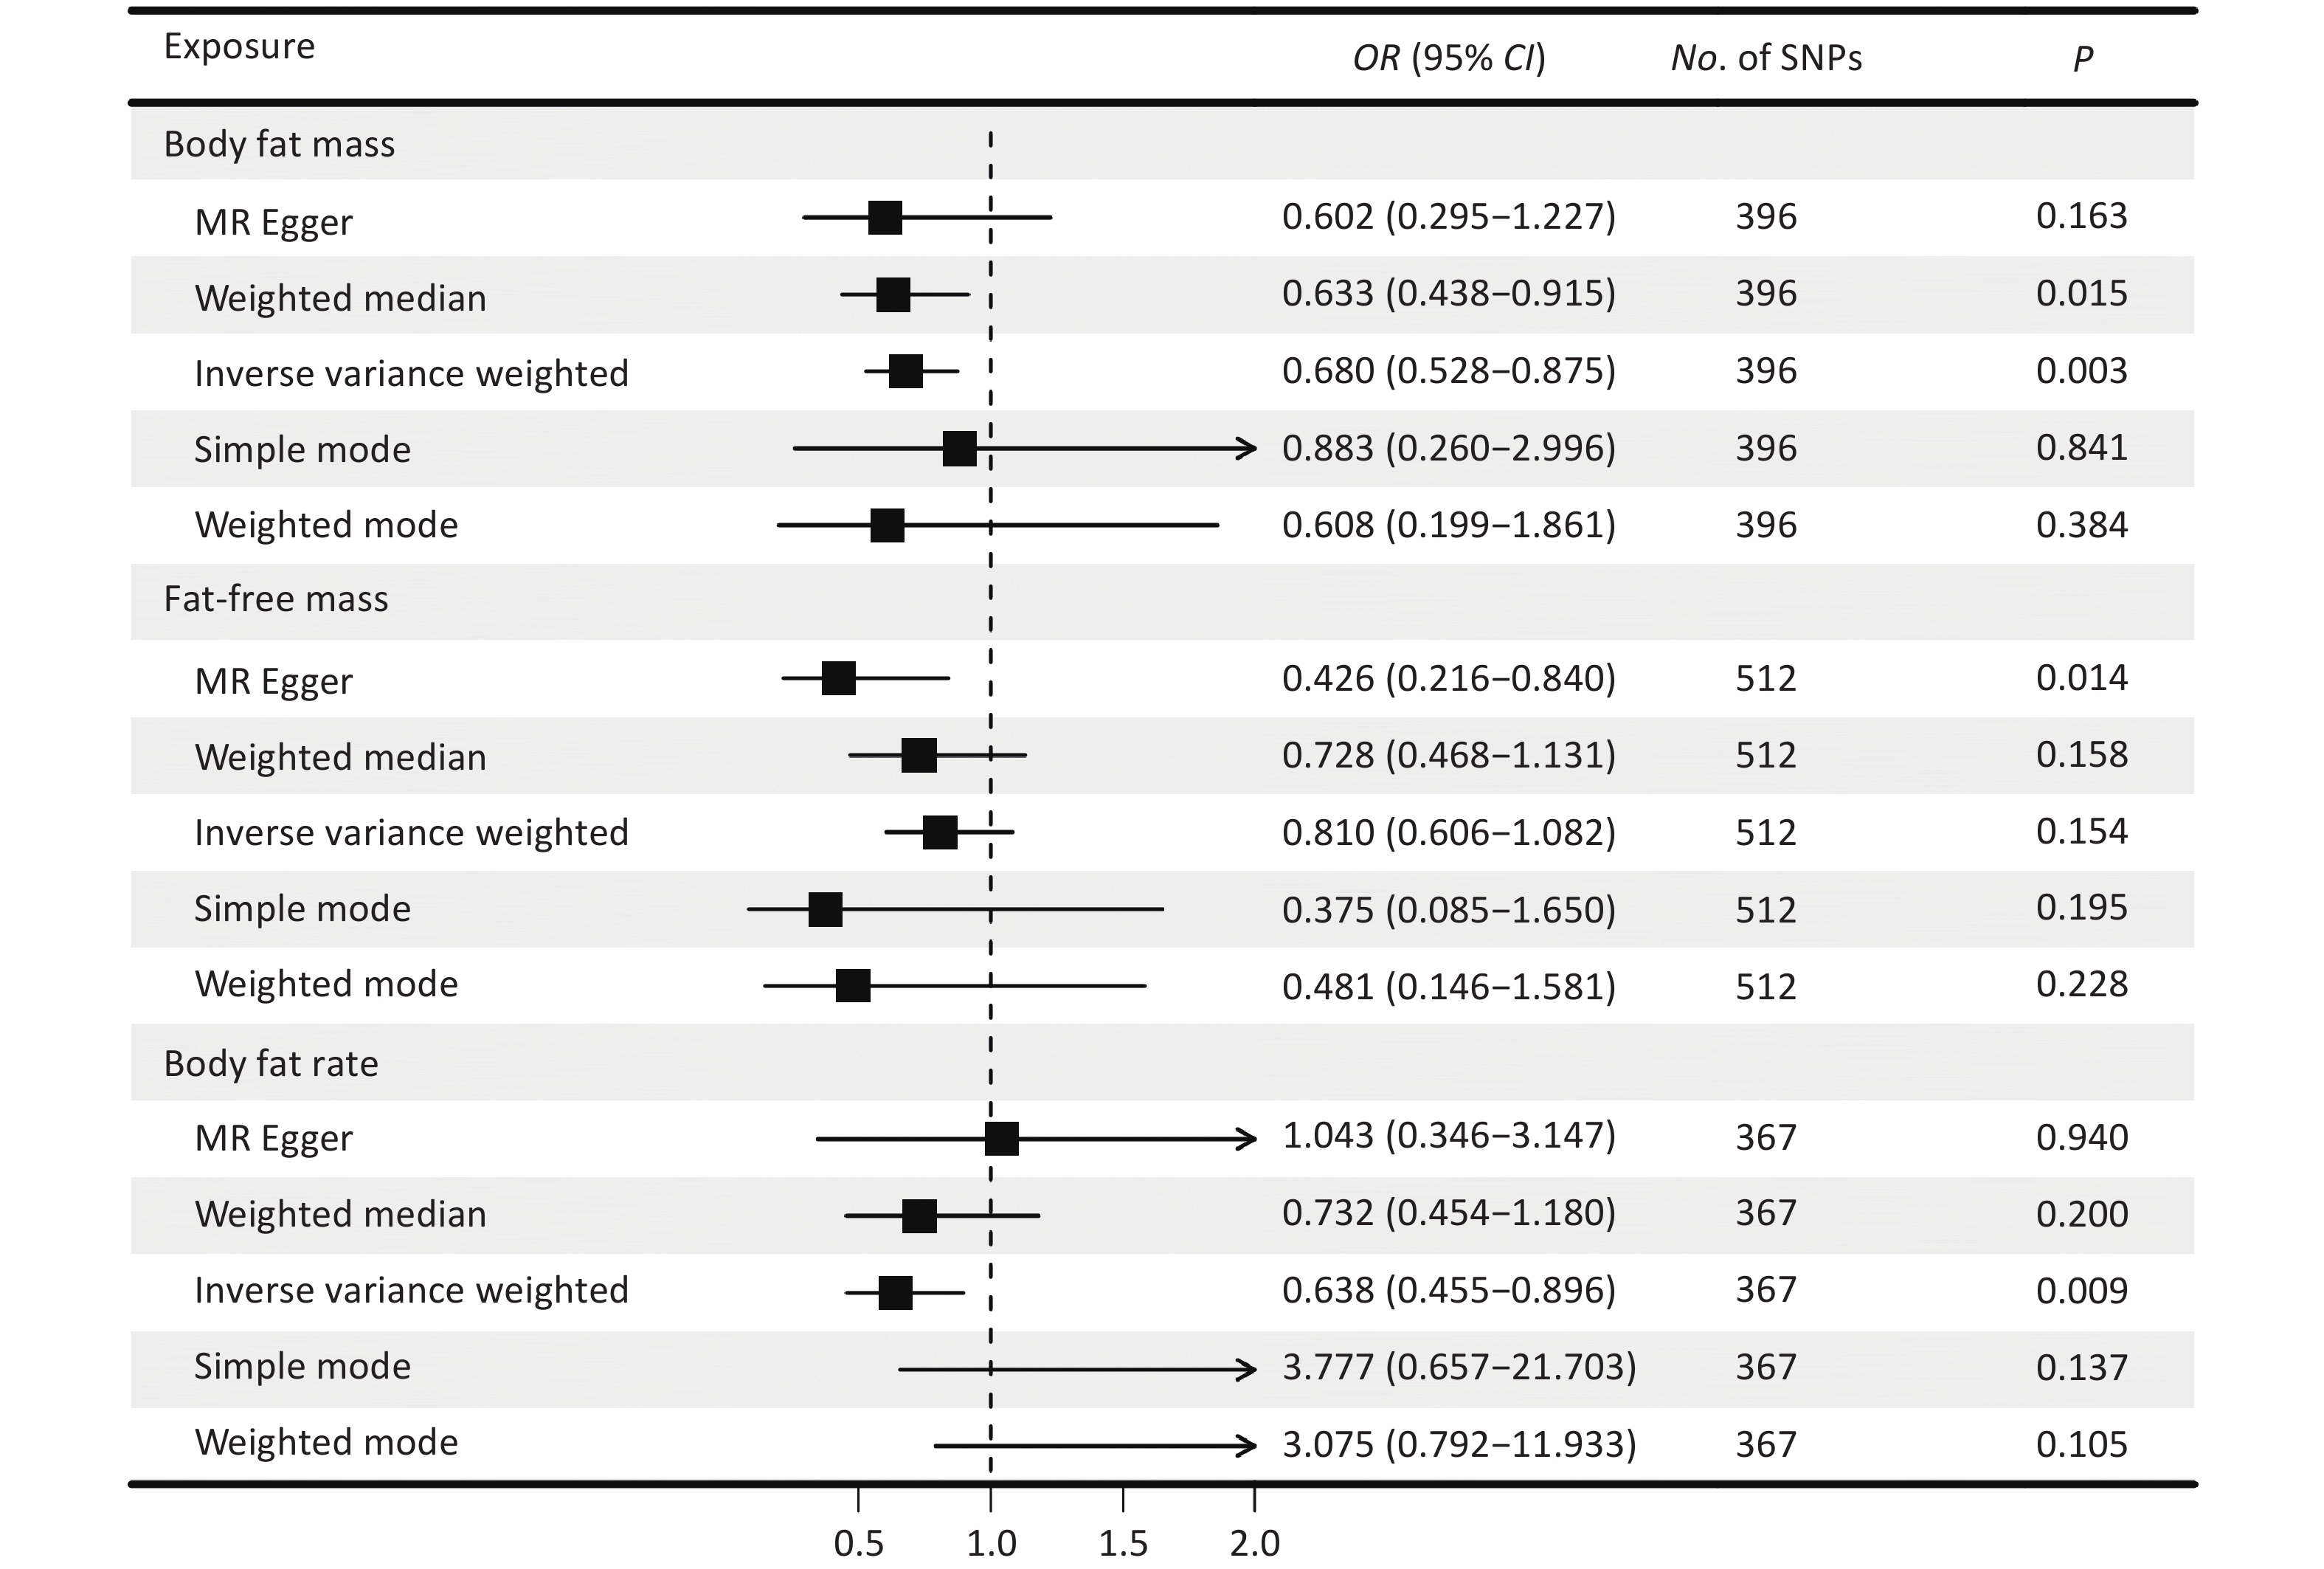
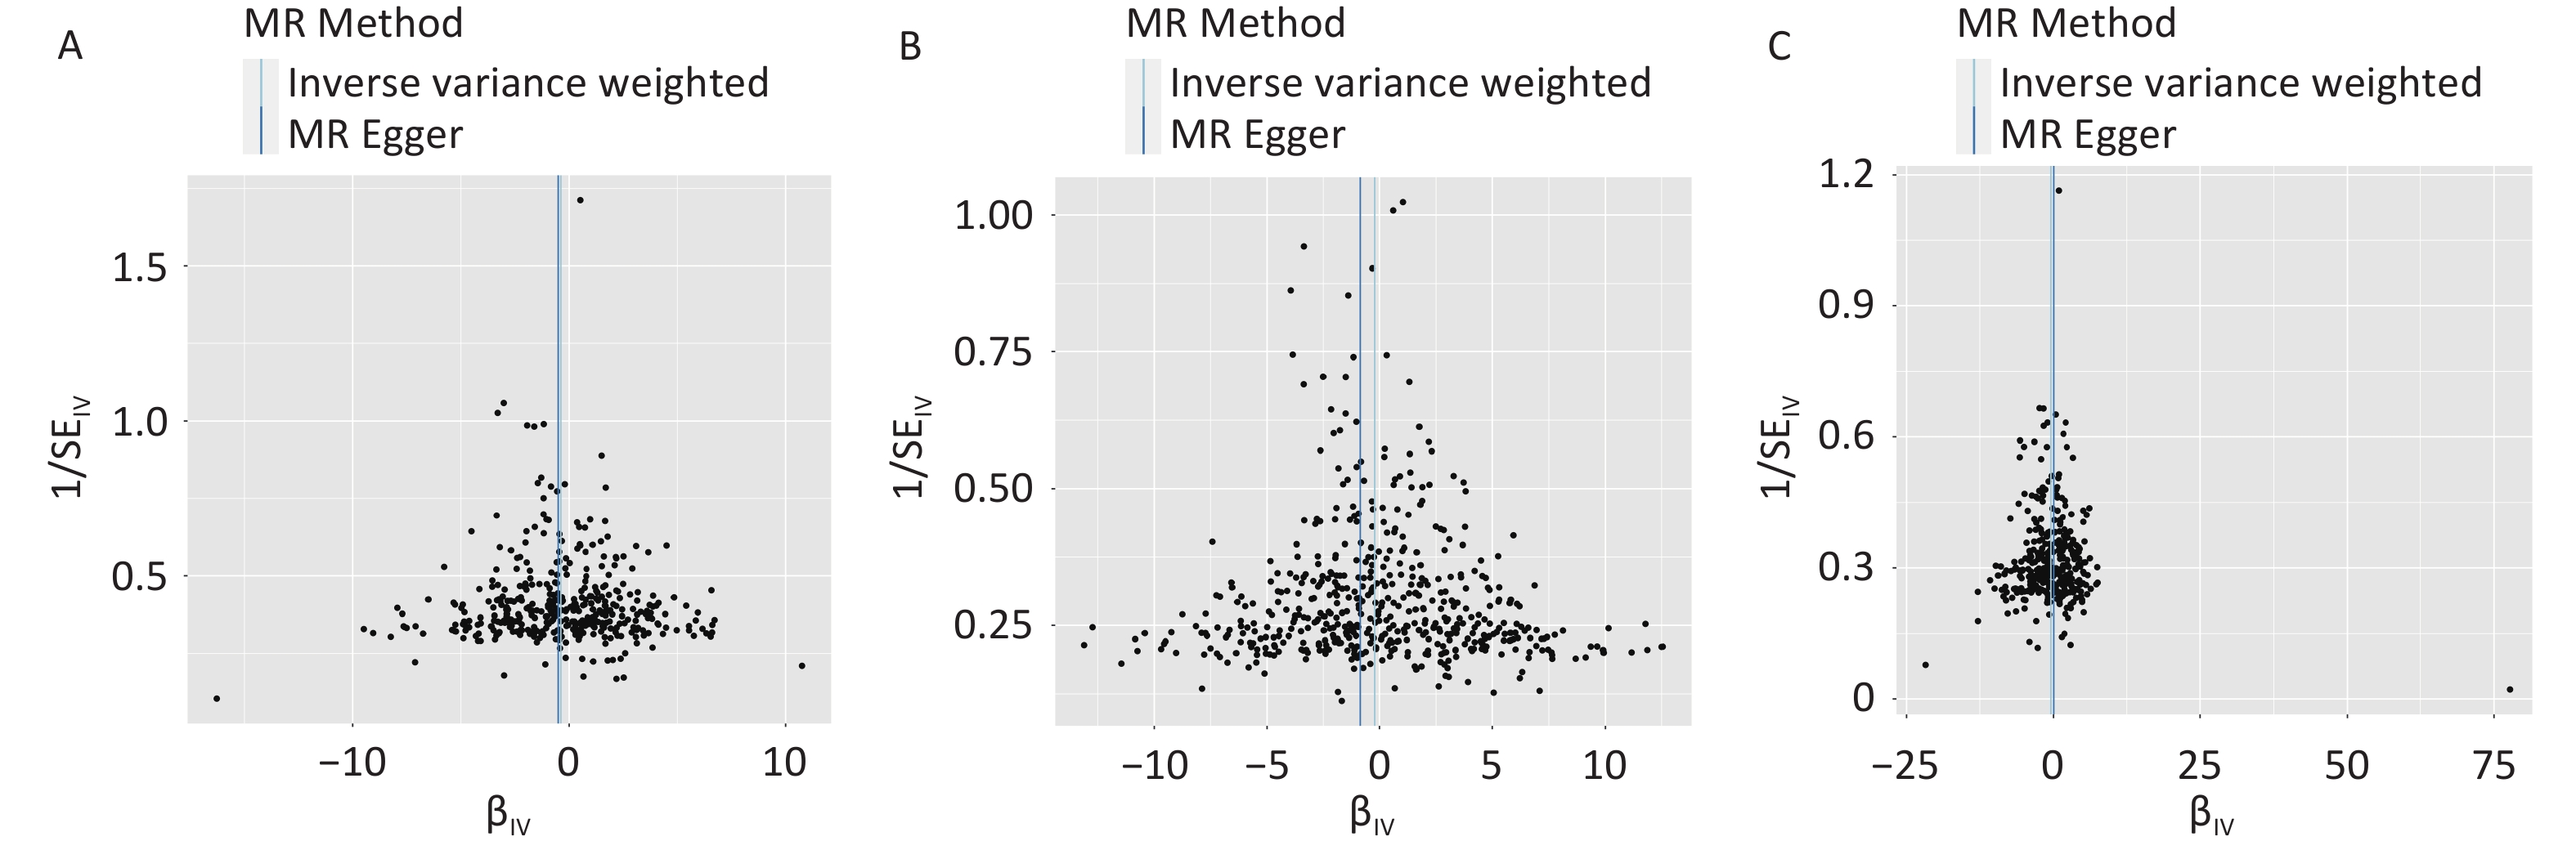
The F-statistic of each SNP was greater than 10 (Supplementary Table S2-S4). Figure 2 presents causal estimates across five MR methods, which collectively address heterogeneity and horizontal pleiotropy. The results of the IVW method showed that a genetically predicted decrease in FM was associated with an increased risk of OCD [odds ratio (OR) = 0.680, 95% CI: 0.528–0.875, P = 0.003] (Figure 2). Broadly consistent risk estimates were obtained using the weighted median approach (OR = 0.633, 95% CI: 0.438–0.915, P = 0.015), and the directionally same estimates were observed for the other methods. The causal effect of FM on OCD risk was consistent after Bonferroni correction and FDR correction (Table 2). The funnel plots and scatter plots for the causal effects of FM, FFM, and BF% on OCD are shown in Figure 3 and Supplementary Figure S1.
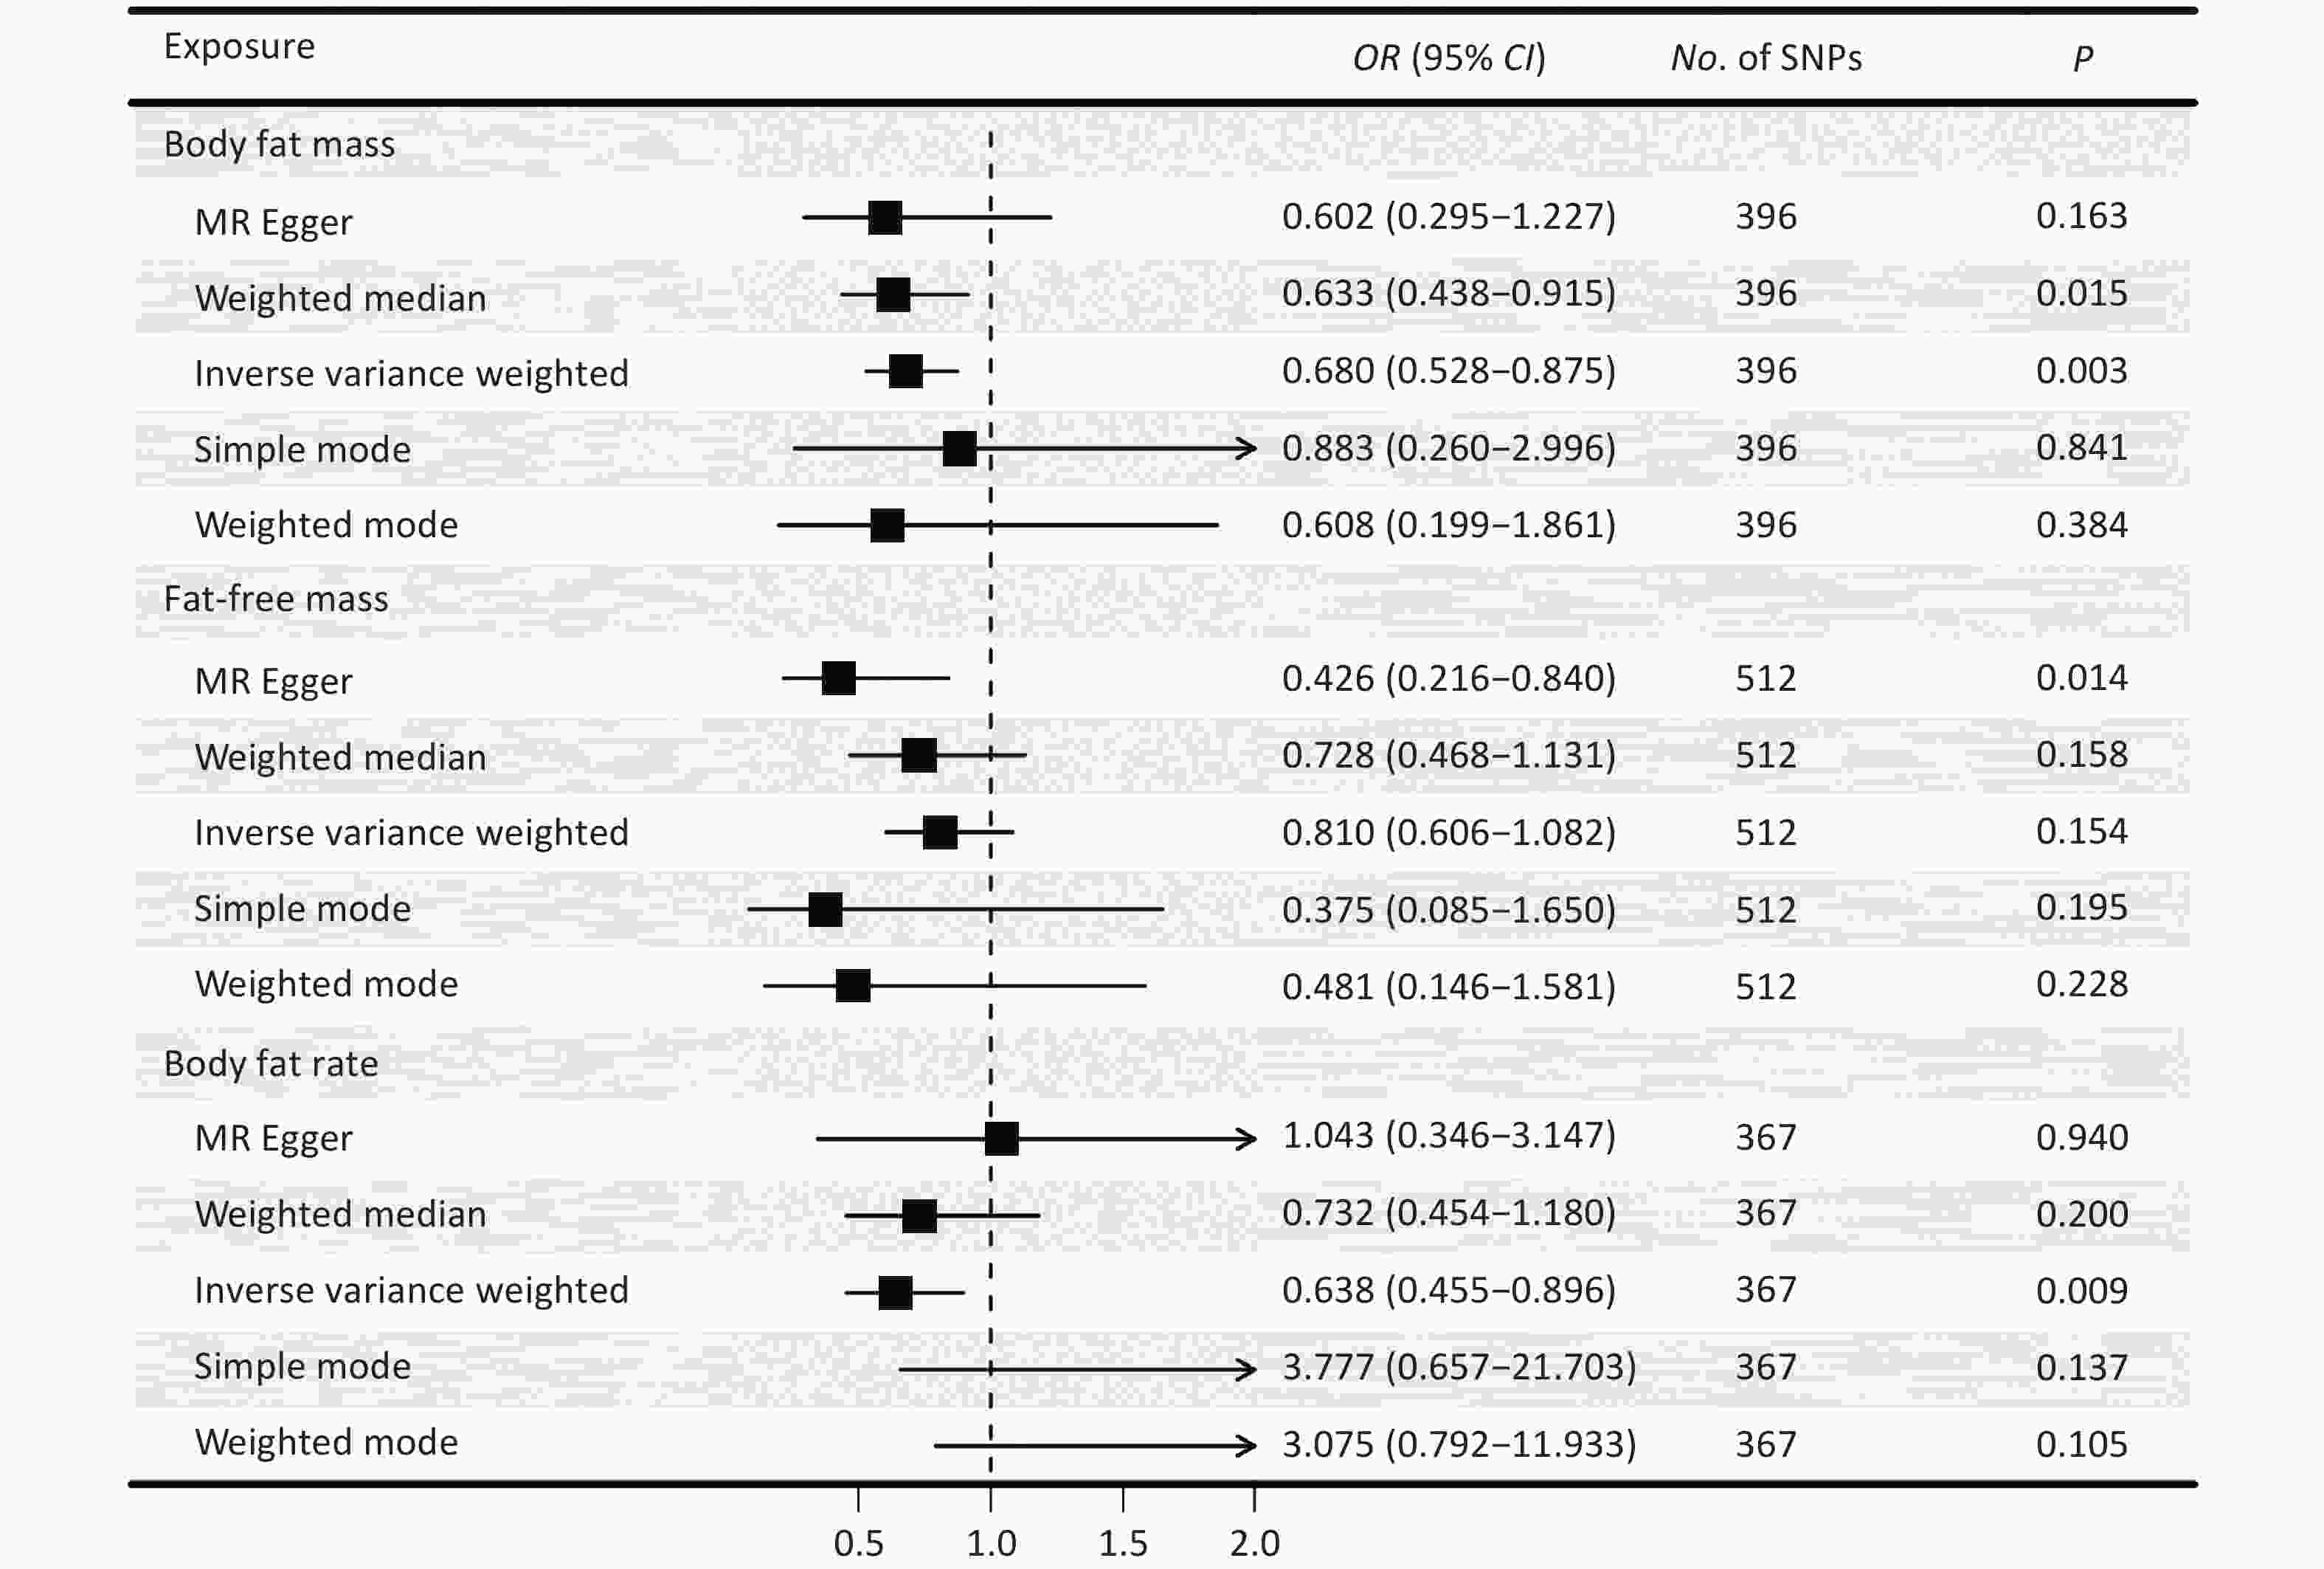
Figure 2. The causal effects of body fat mass, fat-free mass, body fat percentage and obsessive-compulsive disorder derived from five Mendelian-randomization methods. OR, odds ratio; CI, confidence interval; P, P value. SNP, single nucleotide polymorphism; MR, Mendelian randomization. The results of the IVW method were reported in the figure. The results of MR-Egger, weighted-median, simple mode, and weighted mode estimates provided as sensitivity checks for horizontal pleiotropy and instrument heterogeneity.
Table 2. The causal effects between body fat mass, fat-free mass, body fat percentage and obsessive-compulsive disorder (IVW method)
Exposure SNPs, n OR (95% CI) P value FDR P value Fat mass 396 0.680 (0.528, 0.875) 0.003* 0.008 Fat-free mass 512 0.810 (0.606, 1.082) 0.154 0.154 Body fat percentage 367 0.638 (0.455, 0.896) 0.009* 0.014 Note. IVW, inverse variance weighted; SNP, single nucleotide polymorphism; OR, odds ratio; CI, confidence interval; FDR, false discovery rate. *: The P value was still significant after Bonferroni correction. 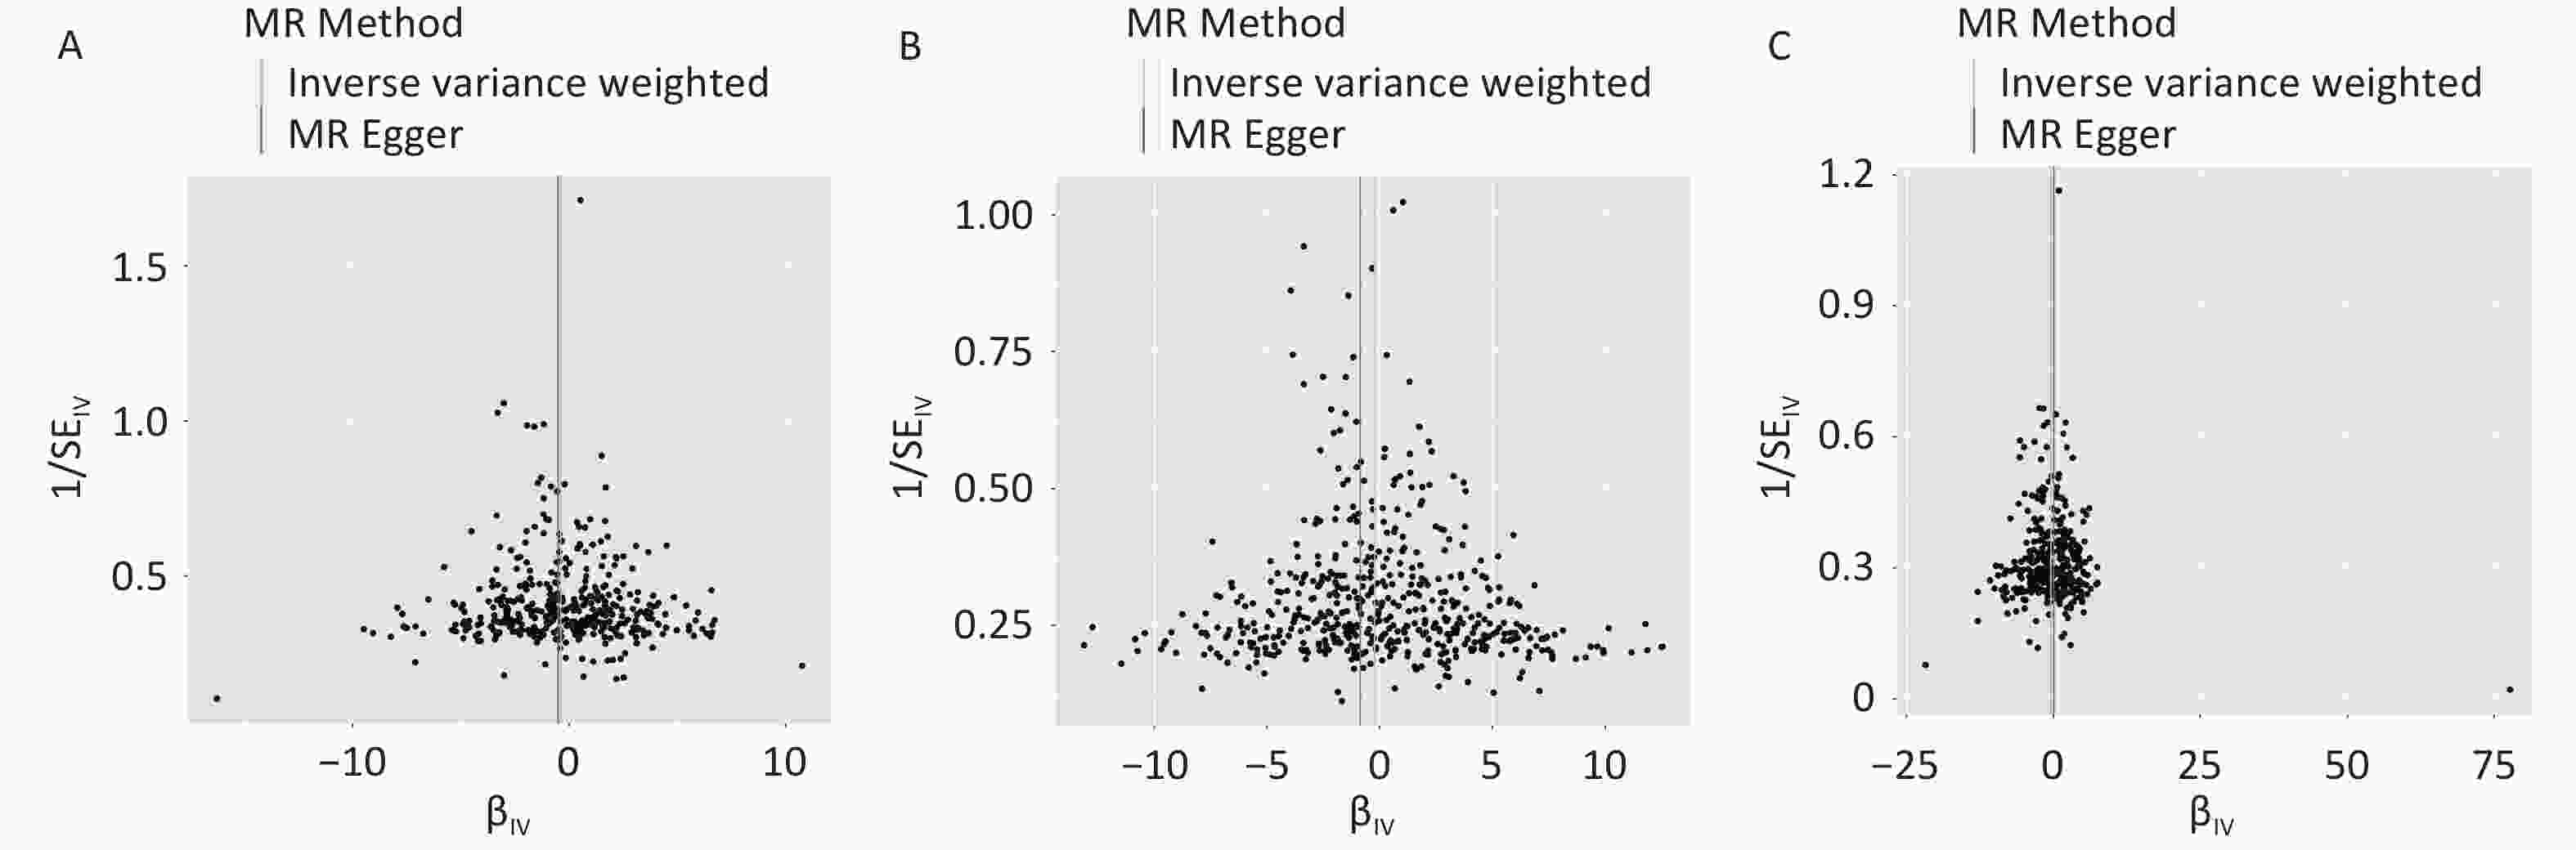
Figure 3. Funnel plot for the causal effects of (a) body fat mass, (b) fat-free mass, and (c) body fat percentage on obsessive-compulsive disorder. IV, instrumental variable; SE, standard error. MR, Mendelian randomization.
The results of MR‒Egger showed that a genetically predicted decrease in FFM was significantly associated with a greater risk of OCD (OR = 0.426, 95% CI: 0.216–0.840; P = 0.014). However, the other four methods showed no significant causal associations (Figure 2, Supplementary Table S5). According to the IVW estimate, with a per standard deviation (SD) increase in the genetically predicted level of BF%, the risk of OCD decreased by 36.2% (OR = 0.638, 95% CI: 0.455–0.896, P = 0.009). The estimates of the other four methods were not significant.
-
We conducted a series of sensitivity analyses to assess heterogeneity and pleiotropy (Supplementary Table S5). The Cochran’s Q test suggested the existence of heterogeneity in FM (P < 0.001), FFM (P = 0.003), and BF% (P = 0.002). Therefore, the random effect model was employed to estimate the effect size (Supplementary Table S6). Similar effect sizes as the primary finding were obtained from the random effects models (FM: OR = 0.680, 95% CI: 0.528–0,875, P = 0.003; BF%: OR = 0.638, 95% CI: 0.455–0.896, P = 0.009).
The pleiotropy test by MR‒Egger intercept suggested the existence of pleiotropy of FFM (P = 0.041). The intercepts from the MR‒Egger regression analysis of FM (P = 0.720) and BF% (P = 0.360) did not reach statistical significance, suggesting that there was no apparent evidence of pleiotropy.
According to the leave-one-out test, all the estimates had the same effect direction, indicating robust results (Supplementary Figures S2-4). The MR-PRESSO global test results showed horizontal pleiotropy; however, no outliers were detected. In addition, the correct causal direction was confirmed using the MR Steiger directionality test.
We obtained a comparable effect size as our primary finding after removing the outliers identified by the MR radial method (Supplementary Table S7). Our sensitivity analysis did not reveal any evidence of pleiotropy or heterogeneity.
We replaced the exposure and outcome dataset to verify whether the results of the primary analyses were robust (Supplementary Table S8). The results showed that the causal relationship between genetically predicted FM and OCD remained robust. For instance, a one-SD increase in genetically predicted FM decreased the risk of OCD, with an OR of 0.721 (IVW: 95% CI = 0.548–0.949, P = 0.019), after replacing the dataset with the FM. Similarly, the results after exchanging the OCD summary statistical data showed that a genetically predicted FM increase was significantly associated with a lower risk of OCD (IVW: OR = 0.656, 95% CI: 0.510–0.845, P = 0.001).
After excluding education-related SNPs, our results remained consistent with the main findings (Supplementary Table S9). For example, only one SNP (rs11245344) was strongly associated with FM and education. One SD increase in genetically predicted FM decreased the risk of OCD, with an OR of 0.682 (IVW: 95% CI = 0.530–0.878, P = 0.003) after removing rs11245344.
We conducted bidirectional MR by exchanging the exposure and outcome variables of the primary analyses. SNPs with genome-wide significant (P < 1 × 10⁻⁵) associations with OCD were selected since there were no SNPs with P values smaller than 5 × 10⁻⁸. Genetically predicted increases in OCD risk were significantly associated with decreased FM (IVW: OR = 0.992, 95% CI: 0.986–0.998, P = 0.010) (Supplementary Table S10).
-
We used a two-sample MR approach to explore the causal relationship between genetically predicted FM and OCD based on summary statistical data from the most recent GWAS with the largest sample size. For the first time, we found a negative causal relationship between genetically predicted FM and OCD.
The bidirectional causality between FM and OCD indicates that these two traits may share some common genetic predisposition. Few studies have investigated the effect of FM on OCD, and most of them found that people with OCD had a lower BMI, which supported our findings[9-11]. For instance, a cohort study from the Dutch Multicenter Clinical Consortiums revealed that the purer the OCD phenotype is, the stronger the protection against overweight and obesity[9]. An MR study by Hübel et al. revealed that OCD was significantly negatively associated with BF%[30]. Abramovitch et al.[31] proposed a model that illustrated how individuals with OCD tend to exhibit specific behaviors related to weight management. This may explain the negative association between genetically predicted OCD and FM. A causal relationship between reduced FM and increased risk of OCD was found for the first time in this study. This causal relationship between FM and OCD may provide a novel target for the prevention and treatment of OCD. Moreover, the reverse causal relationship between OCD and FM suggests that changes in FM levels may be considered an auxiliary indicator for assessing the severity of OCD progression. Further research is needed to elucidate the underlying mechanisms of this bidirectional causality. Moreover, while MR-Egger suggested a potential association between FFM and OCD (P = 0.014), the primary IVW analysis showed non-significance (P = 0.154). This discrepancy likely reflects MR-Egger’s sensitivity to residual pleiotropy, whereas IVW’s superior statistical power makes it more reliable, thus current evidence cannot substantiate causal claims. Future MR studies employing stronger FFM instruments and larger samples are warranted to clarify this relationship.
A multifactorial etiology of OCD is assumed, in which biological, psychological, genetic, and external factors interact[32-35]. Accordingly, we explored plausible mechanisms linked reduced FM to an increased risk of OCD from psychological, genetic, and biological perspectives.
From a psychological perspective, individuals with low FM may have a greater risk of developing OCD due to distorted beliefs and misconceptions within their cognitive and belief systems[36]. These individuals may excessively focus on weight, food, and dietary habits, leading to a skewed perception of their self-worth. Erroneously believing that satisfaction and self-acceptance can be achieved only through reducing body fat, individuals may become trapped in a cycle of obsessive thinking and compulsive behaviors[37]. For example, Levinson et al.[38] discovered that when individuals with anorexia nervosa reported greater concern over mistakes, they endorsed more severe OCD core dimensions (obsessions and compulsions). As participants' reported compulsions increased, their reported drive for thinness and body dissatisfaction also increased, suggesting a mutual influence between these factors. Previous studies have also attempted to explain the low BMI in OCD patients by repeated negative reinforcements resulting in alterations of positive reinforcement[39,40].
From a genetic perspective, a recent genetic analysis suggested that BMI may be a metabolic-behavioral trait[41]. BDNF[42] and FTO[43-45] were found to be associated with both obesity and psychiatric disorders. In addition, animal experiments have identified several candidate genes correlated with OCD, including SAPAP3 and SLITRK5[46,47]. Therefore, there may be shared genetic loci between FM and OCD that mediate the functional pathway. Further studies are warranted to investigate the genetic connection between FM and OCD.
From a biological perspective, serotonin (5-HT) deficiency has been implicated in OCD pathogenesis[48,49]. Although a recent systematic umbrella review revealed an inconsistent association between serotonin and depression[50], 5-HT3 antagonists are still used in clinical practice for the treatment of OCD[51]. Adipocytes in adipose tissue can synthesize and store tryptophan, an essential component of serotonin synthesis[52,53]. Thus, a decrease in FM may lead to an insufficient supply of tryptophan, affecting serotonin synthesis and release, thereby increasing the risk of OCD.
Moreover, disruptions in glutamate metabolism—particularly elevated glutamate levels in cortico-striato-thalamo-cortical circuits—are increasingly implicated in OCD pathophysiology[40,54-58]. Adipocytes regulate fatty acid synthesis pathways that intersect with glutamate metabolism, converting glutamate to α-ketoglutarate via adipocyte enzymes[59,60]. Thus, reduced FM may increase the risk of developing OCD through the glutamate system.
In summary, there is limited research on the causal association between reduced fat mass and increased OCD risk, possibly mediated through psychological distortions, shared genetic predispositions, altered serotonin synthesis, and dysregulated fatty acid-glutamate metabolism. This study is a data-driven causal exploration based on population-based GWAS data. Future studies are warranted to elucidate the underlying mechanisms involved.
Our study, based on the latest and largest publicly available European GWAS data and through comprehensive MR analysis and several sensitivity analyses, is the first to report the negative causality between genetically predicted FM and OCD, complementing previous correlational studies. However, limitations should also be noted. First, the generalizability of our findings is limited, given that only GWAS data from populations of European ancestry were used. Although the largest and most up-to-date GWAS data were selected for this study, our results may not fully extend to other ethnic groups. Further studies of diverse ancestral backgrounds are warranted to assess the robustness and cross-ethnic applicability of the observed FM-OCD causal relationship. Second, only summary-level data, not individual data, are available. Two-sample MR with the linear assumption is performed, which may result in the misestimation of the causality. Third, due to data limitations, we did not take into account the bimodal onset of OCD. By incorporating such detailed classifications, future studies can provide more valuable insights into the causality between FM and OCD. Fourth, the comorbidity of OCD with other disorders cannot be explored using MR methods. Subsequent studies can consider using alternative methods to investigate the causal relationship between FM and the comorbidity of OCD.
-
Based on the publicly available GWAS database, a negative causal relationship between genetically predicted FM and OCD was identified using the two-sample MR approach. This finding is informative for future research on the causal relationship between obesity and mental illness and provides new possibilities for targeted prevention strategies. The prevention or treatment of psychiatric disorders should include not only the control of BMI but also fat distribution and body composition. However, our findings should be interpreted with caution, as unmeasured pleiotropy or residual confounding could influence the causal estimates derived from MR.
doi: 10.3967/bes2025.069
Dissecting the Causal Association between Body Fat Mass and Obsessive-compulsive Disorder: A Two-sample Mendelian Randomization Study
-
Abstract:
Objective Previous studies link lower body mass index (BMI) with increased obsessive-compulsive disorder (OCD) risk, yet other body mass indicators may offer superior prediction. We dissected the causal association between body fat mass (FM) and OCD. Methods Summary statistics from genome-wide association studies of European ancestry were utilized to conduct two-sample Mendelian randomization analysis. Heterogeneity, horizontal pleiotropy, and sensitivity analyses were performed to assess the robustness. Results The inverse variance weighting method demonstrated that a genetically predicted decrease in FM was causally associated with an increased OCD risk [odds ratio (OR) = 0.680, 95% confidence interval (CI): 0.528–0.875, P = 0.003]. Similar estimates were obtained using the weighted median approach (OR = 0.633, 95% CI: 0.438–0.915, P = 0.015). Each standard deviation increases in genetically predicted body fat percentage corresponded to a reduced OCD risk (OR = 0.638, 95% CI: 0.455–0.896, P = 0.009). The sensitivity analysis confirmed the robustness of these findings with no outlier instrument variables identified. Conclusion The negative causal association between FM and the risk of OCD suggests that the prevention or treatment of mental disorders should include not only the control of BMI but also fat distribution and body composition. -
Key words:
- Mendelian randomization /
- Body fat mass /
- Obsessive-compulsive disorder /
- Causal inference.
None.
We used publicly available summary data for which no additional ethical committee approval or participant informed consent was needed.
注释:1) Authors’ Contributions: 2) Competing Interests: 3) Ethics: -
Figure 1. The technical roadmap for the study. IV, instrumental variable; P, P value; LD, Linkage Disequilibrium; kb, kilobases; SNP, single nucleotide polymorphism; MR, Mendelian randomization; PRESSO, pleiotropy residual sum and outlier.
Figure 2. The causal effects of body fat mass, fat-free mass, body fat percentage and obsessive-compulsive disorder derived from five Mendelian-randomization methods. OR, odds ratio; CI, confidence interval; P, P value. SNP, single nucleotide polymorphism; MR, Mendelian randomization. The results of the IVW method were reported in the figure. The results of MR-Egger, weighted-median, simple mode, and weighted mode estimates provided as sensitivity checks for horizontal pleiotropy and instrument heterogeneity.
Figure 3. Funnel plot for the causal effects of (a) body fat mass, (b) fat-free mass, and (c) body fat percentage on obsessive-compulsive disorder. IV, instrumental variable; SE, standard error. MR, Mendelian randomization.
Table 1. Summary of genome-wide association studies used in the present study
Phenotype GWAS ID Consortium Sample size, n SNPs, n Year ICD-10 Total Case Control Exposure FM ukb-b-19393 MRC-IEU 454,137 − − 9,851,867 2018 − FM * ukb-a-265 Neale Lab 330,762 − − 10,894,596 2017 − FFM ukb-b-13354 MRC-IEU 454,850 − − 9,851,867 2018 − FFM * ukb-a-266 Neale Lab 331,291 − − 10,894,596 2017 − BF% ukb-b-8909 MRC-IEU 454,633 − − 9,851,867 2018 − BF% * ukb-a-264 Neale Lab 331,117 − − 10,894,596 2017 Education ebi-a-GCST90029012 − 470,941 − − 11,972,619 2018 Outcome OCD finn-b-F5-OCD FinnGen 339,539 1,962 337,577 16,380,384 2021 ICD-10 F42; ICD-9 3003; ICD-8 3003 OCD * ieu-a-1189 PGC 9,725 2,688 7,037 8,409,517 2017 DSM-IV Note. *: The summary statistical data were utilized for the sensitivity analyses. All the populations were of European ancestry and included males and females; SNP, single nucleotide polymorphism; FM, fat mass; FFM, fat-free mass; BF%, body fat percentage; OCD, obsessive-compulsive disorder; MRC-IEU, MRC Integrative Epidemiology Unit; PGC, The Psychiatric Genomics Consortium; ICD, The International Statistical Classification of Diseases and Related Health Problems. DSM-IV, Diagnostic and Statistical Manual of Mental Disorders, 4th edition.  下载: 导出CSV
Table 2. The causal effects between body fat mass, fat-free mass, body fat percentage and obsessive-compulsive disorder (IVW method)
Exposure SNPs, n OR (95% CI) P value FDR P value Fat mass 396 0.680 (0.528, 0.875) 0.003* 0.008 Fat-free mass 512 0.810 (0.606, 1.082) 0.154 0.154 Body fat percentage 367 0.638 (0.455, 0.896) 0.009* 0.014 Note. IVW, inverse variance weighted; SNP, single nucleotide polymorphism; OR, odds ratio; CI, confidence interval; FDR, false discovery rate. *: The P value was still significant after Bonferroni correction.
下载: 导出CSV
-
[1] The Lancet Psychiatry. Global Burden of Disease 2021: mental health messages. Lancet Psychiatry, 2024; 11, 573. doi: 10.1016/S2215-0366(24)00222-0 [2] Ravindran A, Richter M, Jain T, et al. Functional connectivity in obsessive-compulsive disorder and its subtypes. Psychol Med, 2020; 50, 1173−81. doi: 10.1017/S0033291719001090 [3] Whitfield H, Hargreaves D, Nicholls D, et al. Risk factors of persistent adolescent thinness: findings from the UK Millennium Cohort Study. BMC Public Health, 2023; 23, 938. doi: 10.1186/s12889-023-15850-1 [4] Pampaloni I, Marriott S, Pessina E, et al. The global assessment of OCD. Compr Psychiatry, 2022; 118, 152342. doi: 10.1016/j.comppsych.2022.152342 [5] Stein DJ, Costa DLC, Lochner C, et al. Obsessive-compulsive disorder. Nat Rev Dis Primers, 2019; 5, 52. doi: 10.1038/s41572-019-0102-3 [6] Patti MA, Croen LA, Chen AM, et al. Prepregnancy BMI, gestational weight gain, and susceptibility to autism-related traits: the EARLI and HOME studies. Obesity, 2023; 31, 1415−24. doi: 10.1002/oby.23710 [7] Lee S, Byun MS, Yi D, et al. Body mass index and two-year change of in vivo Alzheimer's disease pathologies in cognitively normal older adults. Alzheimers Res Ther, 2023; 15, 108. doi: 10.1186/s13195-023-01259-w [8] Rios JM, Miller AL, Lumeng JC, et al. Associations of maternal food addiction, dietary restraint, and pre-pregnancy BMI with infant eating behaviors and risk for overweight. Appetite, 2023; 184, 106516. doi: 10.1016/j.appet.2023.106516 [9] Abramovitch A, Anholt GE, Cooperman A, et al. Body mass index in obsessive-compulsive disorder. J Affect Disord, 2019; 245, 145−51. doi: 10.1016/j.jad.2018.10.116 [10] Subramaniam M, Picco L, He V, et al. Body mass index and risk of mental disorders in the general population: results from the Singapore Mental Health Study. J Psychosom Res, 2013; 74, 135−41. doi: 10.1016/j.jpsychores.2012.10.009 [11] Husky MM, Mazure CM, Ruffault A, et al. Differential associations between excess body weight and psychiatric disorders in men and women. J Womens Health, 2018; 27, 183−90. doi: 10.1089/jwh.2016.6248 [12] Stefan N. Causes, consequences, and treatment of metabolically unhealthy fat distribution. Lancet Diabetes Endocrinol, 2020; 8, 616−27. doi: 10.1016/S2213-8587(20)30110-8 [13] Mattar L, Thiébaud MR, Huas C, et al. Depression, anxiety and obsessive-compulsive symptoms in relation to nutritional status and outcome in severe anorexia nervosa. Psychiatry Res, 2012; 200, 513−7. doi: 10.1016/j.psychres.2012.04.032 [14] Bowden J, Davey Smith G, Burgess S. Mendelian randomization with invalid instruments: effect estimation and bias detection through Egger regression. Int J Epidemiol, 2015; 44, 512−25. doi: 10.1093/ije/dyv080 [15] Hemani G, Zheng J, Elsworth B, et al. The MR-Base platform supports systematic causal inference across the human phenome. Elife, 2018; 7, e34408. doi: 10.7554/eLife.34408 [16] Elsworth B, Lyon M, Alexander T, et al. The MRC IEU OpenGWAS data infrastructure. bioRxiv, 2020. [17] Mitchell R, Hemani G, Dudding T, et al. UK Biobank Genetic Data: MRC-IEU quality control, version 2. 2019. [18] Kyle UG, Bosaeus I, De Lorenzo AD, et al. Bioelectrical impedance analysis—part I: review of principles and methods. Clin Nutr, 2004; 23, 1226−43. doi: 10.1016/j.clnu.2004.06.004 [19] Palmer TM, Lawlor DA, Harbord RM, et al. Using multiple genetic variants as instrumental variables for modifiable risk factors. Stat Methods Med Res, 2012; 21, 223−42. doi: 10.1177/0962280210394459 [20] Kurki MI, Karjalainen J, Palta P, et al. FinnGen provides genetic insights from a well-phenotyped isolated population. Nature, 2023; 613, 508−18. doi: 10.1038/s41586-022-05473-8 [21] Arnold PD, Askland KD, Barlassina C, et al. Revealing the complex genetic architecture of obsessive-compulsive disorder using meta-analysis. Mol Psychiatry, 2018; 23, 1181−8. doi: 10.1038/mp.2017.154 [22] Skrivankova VW, Richmond RC, Woolf BAR, et al. Strengthening the reporting of observational studies in epidemiology using mendelian randomization: The STROBE-MR Statement. JAMA, 2021; 326, 1614−21. doi: 10.1001/jama.2021.18236 [23] Burgess S, Thompson SG. Interpreting findings from Mendelian randomization using the MR-Egger method. Eur J Epidemiol, 2017; 32, 377−89. doi: 10.1007/s10654-017-0255-x [24] Bowden J, Davey Smith G, Haycock PC, et al. Consistent estimation in mendelian randomization with some invalid instruments using a weighted median estimator. Genet Epidemiol, 2016; 40, 304−14. doi: 10.1002/gepi.21965 [25] Hartwig FP, Davey Smith G, Bowden J. Robust inference in summary data Mendelian randomization via the zero modal pleiotropy assumption. Int J Epidemiol, 2017; 46, 1985−98. doi: 10.1093/ije/dyx102 [26] Larsson SC, Butterworth AS, Burgess S. Mendelian randomization for cardiovascular diseases: principles and applications. Eur Heart J, 2023; 44, 4913−24. doi: 10.1093/eurheartj/ehad736 [27] Bowden J, Del Greco MF, Minelli C, et al. Improving the accuracy of two-sample summary-data Mendelian randomization: moving beyond the NOME assumption. Int J Epidemiol, 2019; 48, 728−42. doi: 10.1093/ije/dyy258 [28] Verbanck M, Chen CY, Neale B, et al. Detection of widespread horizontal pleiotropy in causal relationships inferred from Mendelian randomization between complex traits and diseases. Nat Genet, 2018; 50, 693−8. doi: 10.1038/s41588-018-0099-7 [29] Bowden J, Spiller W, Del Greco M F, et al. Improving the visualization, interpretation and analysis of two-sample summary data Mendelian randomization via the Radial plot and Radial regression. Int J Epidemiol, 2018; 47, 1264−78. doi: 10.1093/ije/dyy101 [30] Hübel C, Gaspar HA, Coleman JRI, et al. Genetic correlations of psychiatric traits with body composition and glycemic traits are sex- and age-dependent. Nat Commun, 2019; 10, 5765. doi: 10.1038/s41467-019-13544-0 [31] Abramovitch A, Mckay D. Behavioral impulsivity in obsessive-compulsive disorder. J Behav Addict, 2016; 5, 395−7. doi: 10.1556/2006.5.2016.029 [32] Park I, Ha MJ, Kim T, et al. Cortical gyrification differences between early- and late-onset obsessive-compulsive disorder: neurobiological evidence for neurodevelopmentally distinct subtypes. Psychol Med, 2023; 53, 5976−85. doi: 10.1017/S0033291722003129 [33] Perera MPN, Mallawaarachchi S, Bailey NW, et al. Obsessive-compulsive disorder (OCD) is associated with increased engagement of frontal brain regions across multiple event-related potentials. Psychol Med, 2023; 53, 7287−99. doi: 10.1017/S0033291723000843 [34] Blanco-Vieira T, Radua J, Marcelino L, et al. The genetic epidemiology of obsessive-compulsive disorder: a systematic review and meta-analysis. Transl Psychiatry, 2023; 13, 230. doi: 10.1038/s41398-023-02433-2 [35] Denzel D, Runge K, Feige B, et al. Autoantibodies in patients with obsessive-compulsive disorder: a systematic review. Transl Psychiatry, 2023; 13, 241. doi: 10.1038/s41398-023-02545-9 [36] Sandstrom A, Krause S, Ouellet-Courtois C, et al. What's control got to do with it? A systematic review of control beliefs in obsessive-compulsive disorder. Clin Psychol Rev, 2024; 107, 102372. doi: 10.1016/j.cpr.2023.102372 [37] Schuyler M, Geller DA. Childhood obsessive-compulsive disorder. Psychiatr Clin North Am, 2023; 46, 89−106. doi: 10.1016/j.psc.2022.10.002 [38] Levinson CA, Zerwas SC, Brosof LC, et al. Associations between dimensions of anorexia nervosa and obsessive-compulsive disorder: an examination of personality and psychological factors in patients with anorexia nervosa. Eur Eat Disord Rev, 2019; 27, 161−72. doi: 10.1002/erv.2635 [39] Abramovitch A, Pizzagalli DA, Geller DA, et al. Cigarette smoking in obsessive-compulsive disorder and unaffected parents of OCD patients. Eur Psychiatry, 2015; 30, 137−44. [40] Pauls DL, Abramovitch A, Rauch SL, et al. Obsessive-compulsive disorder: an integrative genetic and neurobiological perspective. Nat Rev Neurosci, 2014; 15, 410−24. doi: 10.1038/nrn3746 [41] Finucane HK, Reshef YA, Anttila V, et al. Heritability enrichment of specifically expressed genes identifies disease-relevant tissues and cell types. Nat Genet, 2018; 50, 621−9. doi: 10.1038/s41588-018-0081-4 [42] Timpano KR, Schmidt NB, Wheaton MG, et al. Consideration of the BDNF gene in relation to two phenotypes: hoarding and obesity. J Abnorm Psychol, 2011; 120, 700−7. doi: 10.1037/a0024159 [43] Loos RJF, Bouchard C. FTO: the first gene contributing to common forms of human obesity. Obes Rev, 2008; 9, 246−50. doi: 10.1111/j.1467-789X.2008.00481.x [44] Rivera M, COHEN-Woods S, Kapur K, et al. Depressive disorder moderates the effect of the FTO gene on body mass index. Mol Psychiatry, 2012; 17, 604−11. doi: 10.1038/mp.2011.45 [45] Zarza-Rebollo JA, Molina E, Rivera M. The role of the FTO gene in the relationship between depression and obesity. A systematic review. Neurosci Biobehav Rev, 2021; 127, 630−7. doi: 10.1016/j.neubiorev.2021.05.013 [46] Zai G, Barta C, Cath D, et al. New insights and perspectives on the genetics of obsessive-compulsive disorder. Psychiatr Genet, 2019; 29, 142−51. doi: 10.1097/YPG.0000000000000230 [47] Kajs BL, van Roessel PJ, Davis GL, et al. Valence processing alterations in SAPAP3 knockout mice and human OCD. J Psychiatr Res, 2022; 151, 657−66. doi: 10.1016/j.jpsychires.2022.05.024 [48] Nakao T, Okada K, Kanba S. Neurobiological model of obsessive-compulsive disorder: evidence from recent neuropsychological and neuroimaging findings. Psychiatry Clin Neurosci, 2014; 68, 587−605. doi: 10.1111/pcn.12195 [49] Zohar J, Kennedy JL, Hollander E, et al. Serotonin-1D hypothesis of obsessive-compulsive disorder: an update. J Clin Psychiatry, 2004; 65, 18−21. [50] Moncrieff J, Cooper RE, Stockmann T, et al. The serotonin theory of depression: a systematic umbrella review of the evidence. Mol Psychiatry, 2023; 28, 3243−56. doi: 10.1038/s41380-022-01661-0 [51] Eissazade N, Mosavari H, Eghdami S, et al. Efficacy and safety of 5-hydroxytryptamine-3 (5-HT3) receptor antagonists in augmentation with selective serotonin reuptake inhibitors (SSRIs) in the treatment of moderate to severe obsessive-compulsive disorder: a systematic review and meta-analysis of randomized clinical trials. Sci Rep, 2023; 13, 20837. doi: 10.1038/s41598-023-47931-x [52] Kałużna-Czaplińska J, Gątarek P, Chirumbolo S, et al. How important is tryptophan in human health?. Crit Rev Food Sci Nutr, 2019; 59, 72−88. doi: 10.1080/10408398.2017.1357534 [53] U-Din M, de Mello VD, Tuomainen M, et al. Cold-stimulated brown adipose tissue activation is related to changes in serum metabolites relevant to NAD+ metabolism in humans. Cell Rep, 2023; 42, 113131. doi: 10.1016/j.celrep.2023.113131 [54] Frank D, Gruenbaum BF, Shelef I, et al. Blood glutamate scavenging as a novel glutamate-based therapeutic approach for post-traumatic brain injury anxiety and social impairment. Transl Psychiatry, 2023; 13, 41. doi: 10.1038/s41398-023-02329-1 [55] Wang J, Hua GM, Wang SB, et al. Glutamatergic neurotransmission is affected by low-frequency repetitive transcranial magnetic stimulation over the supplemental motor cortex of patients with obsessive-compulsive disorder. J Affect Disord, 2023; 325, 762−9. doi: 10.1016/j.jad.2023.01.064 [56] Singer HS. Motor control, habits, complex motor stereotypies, and Tourette syndrome. Ann N Y Acad Sci, 2013; 1304, 22−31. doi: 10.1111/nyas.12281 [57] Zhao Q, Xu TT, Wang Y, et al. Limbic cortico-striato-thalamo-cortical functional connectivity in drug-naïve patients of obsessive-compulsive disorder. Psychol Med, 2021; 51, 70−82. doi: 10.1017/S0033291719002988 [58] Weeland CJ, Kasprzak S, de Joode NT, et al. The thalamus and its subnuclei—a gateway to obsessive-compulsive disorder. Transl Psychiatry, 2022; 12, 70. doi: 10.1038/s41398-022-01823-2 [59] Morigny P, Boucher J, Arner P, et al. Lipid and glucose metabolism in white adipocytes: pathways, dysfunction and therapeutics. Nat Rev Endocrinol, 2021; 17, 276−95. doi: 10.1038/s41574-021-00471-8 [60] Zhang X, Cai YY, Jiang YP, et al. Genetic correlation between circulating metabolites and chalazion: a two-sample Mendelian randomization study. Front Mol Biosci, 2024; 11, 1368669. doi: 10.3389/fmolb.2024.1368669 -

 点击查看大图
计量
- 文章访问数: 30
- HTML全文浏览量: 10
- PDF下载量: 1
- 被引次数: 0

 Quick Links