

 下载:
下载:

-
Cause of death surveillance data is most important for developing effective health policies, whose quality is crucially affected by the accuracy of the underlying cause of death (UCOD) provided in death certificates. The World Health Organization (WHO) has clearly defined a UCOD as “the disease or injury which initiated the train of morbid events leading directly to death, or the circumstance of the accident or violence which produced the fatal injuries”[1]. However, medical workers may fill in some ambiguous or vague codes in the International Statistical Classification of Diseases and Related Health Problems (ICD) to be someone’s UCOD in actual practical work. These codes was regarded as “garbage code (GC)”[2]. In 2010, Naghavi et al.[3] divided GCs into four categories, “causes that cannot or should not be considered as UCOD, intermediate causes in the cause of death chain, immediate causes in the cause of death chain, and unspecified causes within a larger cause grouping”. With the progression of the Global Burden of Disease (GBD) study, the identification and distinguishment of GCs kept getting further refined[4].
The percentage of GCs is the main index for the reliability of a death statistics dataset assessment. The existence of GCs affects the statistics on the composition and ranking of death causes in a population, which would lead to inaccurate or even incorrect cognition and judgment on the priorities of health issues, then unavoidably influence policy making and the population health promotion goals. In addition to the originally existing GCs, the results of GCs redistribution could also seriously influence the judgment on the trend of diseases.
Since the existence and the poor redistribution of GCs have adverse impacts on death data quality, scientists have explored reasonable approaches to redistribution[3]. GCs Redistribution could be understood as assigning a GC to a plausible correct ICD code for UCOD, based on the pathophysiological characteristics of certain diseases and so on. Nowadays, there are several ways for redistributing GCs, such as expert consultation[3], fixed proportional reassignment[3], computed proportional reassignment based on the information from the cause of death chain (including coarsened exact matching)[4], regression models (including linear regression)[5], and other complicated equations[6]. Among them, linear regression (LR) model and coarsened exact matching (CEM) are commonly used.
In previous studies[5], most of the approaches were used in global or national-level database scenarios. While, some causes of death at the city level with 1 to 10 million permanent residents would be impacted by GCs more sensitively than that of national or global level. It is unknown whether these methods are applied to the city level data or not. In China, administrative regions are divided into four levels: provincial, prefecture, county, and township. Normally, the number of populations from prefectures or counties is within 1 to 10 million, while the resident quantity of townships is smaller than that. Thus, taking a common GC - “heart failure"[7] as an example, this study aimed to test the application of CEM and LR at the city level, including a prefecture - Weifang city from Shandong Province and a county - Xuanwei city from Yunnan Province.
Chinese Cause-of-Death Reporting System (CDRS) had been established since 1990s, with only 145 disease surveillance points across 31 provinces. After 2003, most of the cities/counties gradually established the cause of death surveillance system covering the whole administrative regions, as well as Weifang and Xuanwei. The cause of death report rules were gradually improved, forming a nest of criteria for cause of death reports and analysis procedures[8]. The causes of death data were from Weifang CDRS from 2010 to 2017, and from Xuanwei from 2010 to 2016, respectively. The average population of permanent residents in Weifang and Xuanwei during the study period was about 9.24 and 1.51 million, respectively. The data was desensitized before analyzed, and data cleaning was shown in previous paper[9].
The UCOD death records with ICD-10 codes I50, I50.0, I50.1 and I50.9 stated as heart failure, were extracted from the datasets. Firstly, these UCOD records were corrected based on the cause of death chain and the information on other diseases, following the ICD-10 rules and guidelines for morbidity coding established by WHO[1]. Then, those records with UCOD remaining to be heart failure entered the redistribution process.
Redistribution was carried out in Weifang and Xuanwei both by CEM[7] and LR method[10]. CEM combined with the death chain information based on fixed proportional reassignment[7]. The records with UCOD remaining to be heart failure were so-called “treatment records", while those UCOD records with a non-garbage code and non-injury disease, but with heart failure in the cause of death chain, were regarded as the “control records". Whether a UCOD was a GC or an injury was judged according to the disease classification by the Institute for Health Metrics and Evaluation (IHME) in their GBD 2017[3]. Notably, the records whose UCOD had been changed from heart failure to another ICD-10 code in the previous step would also be included in the control pool, if they met the conditions. Five variables were selected to divide subgroups, including death year, urban or rural resident, gender, age, and the highest agency of diagnosis (Table 1). In each subgroup, we split the total number of heart failures (UCOD on the treatment records) into other diseases in accordance with the constituent ratio of UCOD on the control records. In some subgroups there was no control record, thus the redistribution could not be performed. At last, we added up the results of all subgroups to form the heart failure redistribution result of Weifang and Xuanwei, respectively.
Table 1. Variables for dividing subgroups in Weifang and Xuanwei
Characteristics Weifang Xuanwei n Percent (%) n Percent (%) Gender Male 268,639 56.30 34,320 61.80 Female 208,425 43.68 21,216 38.20 Unknown* 72 0.02 − − Age group (years) 0- 5,513 1.16 2,120 3.82 15- 24,090 5.05 6,584 11.86 45- 103,215 21.63 12,472 22.46 65- 94,719 19.85 10,959 19.73 75- 150,839 31.61 15,322 27.59 85- 98,760 20.70 8,079 14.55 Death year 2010 56,264 11.79 7,054 12.70 2011 56,446 11.83 7,993 14.39 2012 56,333 11.81 7,737 13.93 2013 59,725 12.52 7,924 14.27 2014 58,323 12.22 8,335 15.01 2015 60,645 12.71 7,869 14.17 2016 63,638 13.34 8,610 15.50 2017 65,762 13.78 − − Between 2014—2016 but unknown* − − 14 0.03 The highest agency of diagnosis Tertiary hospital 106,308 22.28 10,018 18.04 Secondary hospital 270,190 56.63 22,579 40.66 Primary hospital 83,771 17.56 9,976 17.96 No hospital diagnosis or other or unknown* 16,867 3.54 12,963 23.34 Urban or rural resident Rural 263,743 55.28 − − Urban 213,166 44.68 − − Unknown* 227 0.05 − − Garbage code# Category 1 21,975 4.61 4,291 7.73 Category 2 7,706 1.62 2,606 4.69 Category 3 6,629 1.39 462 0.83 Category 4 7,967 1.67 2,990 5.38 Total 477,136 55,536 Note. *If the missing values could not be filled, ‘unknown’ was used as a category. #Garbage Code categories: category 1: causes that cannot or should not be considered as underlying cause of death (UCOD); category 2: intermediate causes in the cause of death chain; category 3: immediate causes in the cause of death chain; category 4: unspecified causes within a larger cause grouping; — means no data. LR is established between the garbage code and the target code. The negative correlation and linear regression model were used to find the target coding range and allocation ratio method. The 12 target groups (TGs) for LR model establishment have been listed by Ahern et al[10]. In each year, heart failure and the 12 TGs formed a “heart failure universe". Then using all the percentages data, a LR formula: % TG = α + β×[% heart failure] + ε, was run 12 times, to estimate the relation across years between the proportion of heart failure attributed to deaths and the proportion of the deaths attributed to TG. If the TGs had statistically significant positive correlation with heart failure, they were dropped and then formed a new “heart failure universe”. After that, the procedure was repeated until no TG was significantly positively associated with heart failure. We carried out the analysis in 8 subgroups (2 genders multiplied by 4 age groups). After all rounds of calculation, the TGs whose final regression coefficient (β) was negative and statistically significant (P < 0.05) in each subgroup were kept. According to the constituent ratio of their y-intercepts (α) yielded by the regression, we split the total number of heart failures into TGs. We could further split each TG into the ICD-10 codes contained in it, in accordance with the constituent ratio of the codes as well.
After heart failure correction by using WHO guidelines and redistribution by two approaches, we aggregated the results to the categories of diseases, and compared the cause-specific mortalities before and after redistribution. All analyses were performed by SAS 9.4 (SAS Institute Inc., Cary, North Carolina, USA).
All methods of this study were carried out in accordance with relevant guidelines and regulations. All study protocols were approved by ethics committee of Institute of Basic Medical Sciences, Chinese Academy of Medical Sciences (CAMS) (authorization number: 037-2014).
-
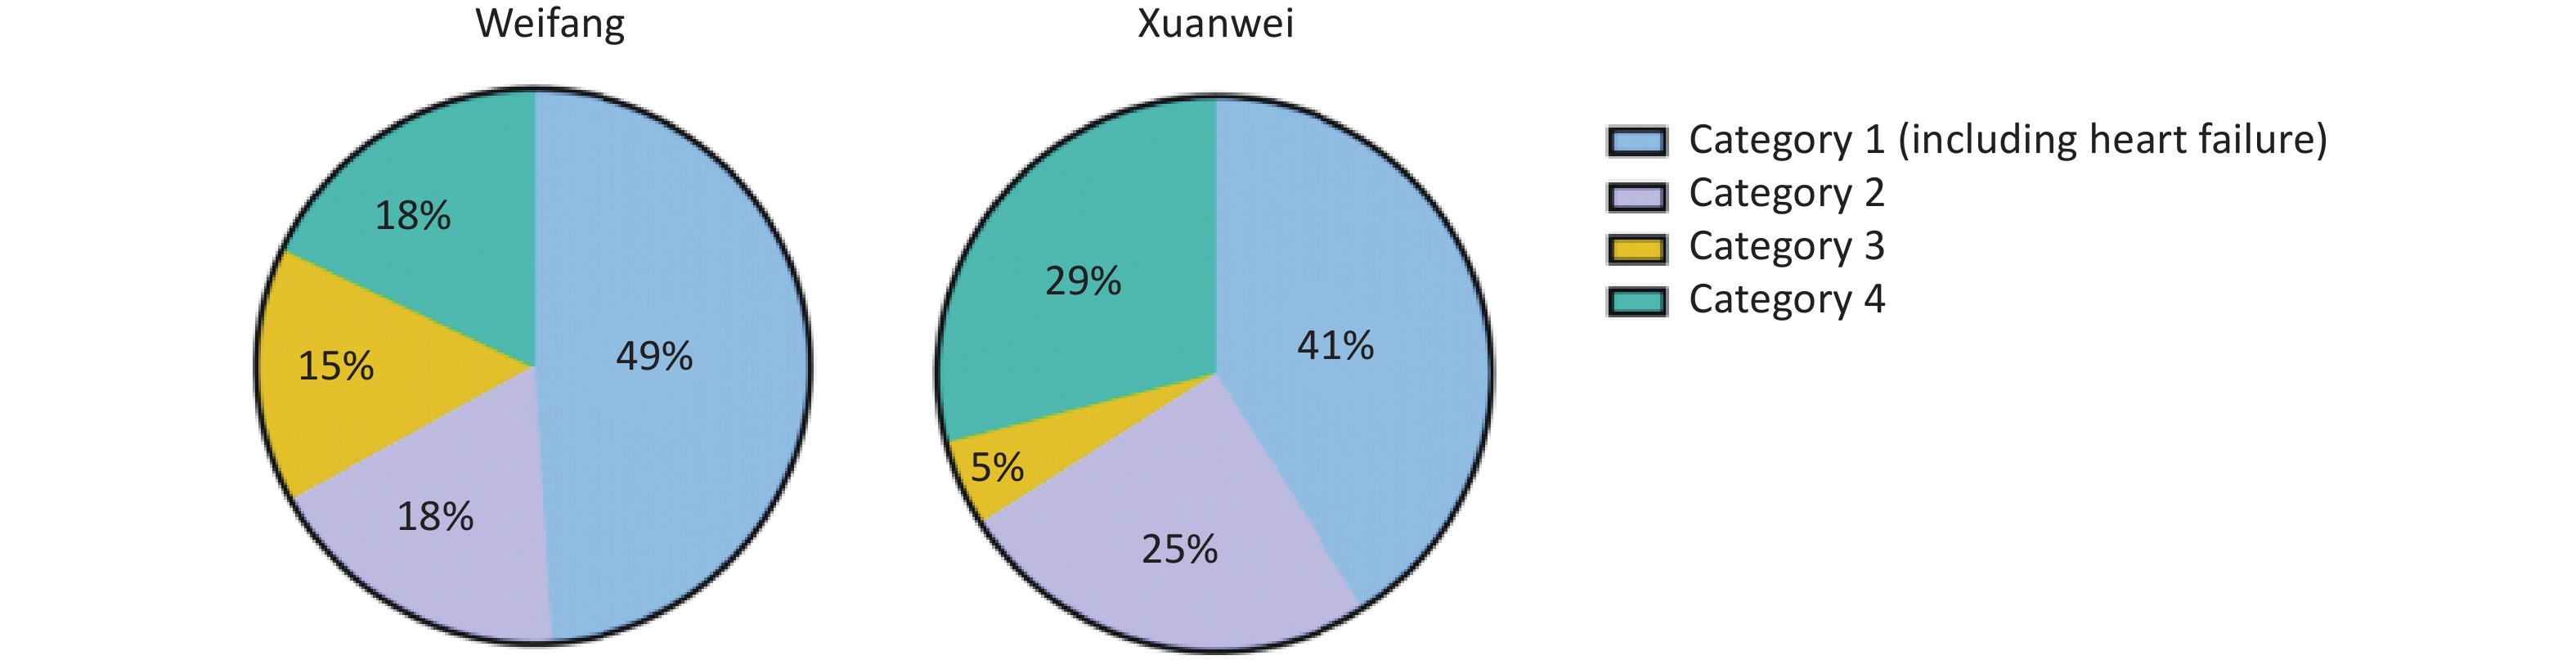
In total, Weifang and Xuanwei had 477,136 and 55,536 deaths, with 56.30% and 61.80% of males proportion, respectively. The proportion of the cause of death without a diagnosis from hospitals in Weifang (3.54%) was much lower than that of Xuanwei (23.34%). The percentages of category 1 to category 4 GCs in the death dataset were 4.61%, 1.62%, 1.39% and 1.67% in Weifang, and 7.73%, 4.69%, 0.83% and 5.38% in Xuanwei, respectively (Table 1), which indicated that some problems still existed in the cause of death coding process, especially in county-level cities. The percentage of GCs in Weifang and Xuanwei was 9.29% and 18.63%, respectively (Supplementary Figure S1, available in www.besjournal.com). The percentage of category 1 GCs (causes that cannot or should not be considered as UCOD) was the highest in both cities, which indicated that we should further enhance certain training on the difference between UCOD and diagnoses in clinical or health service encounter.
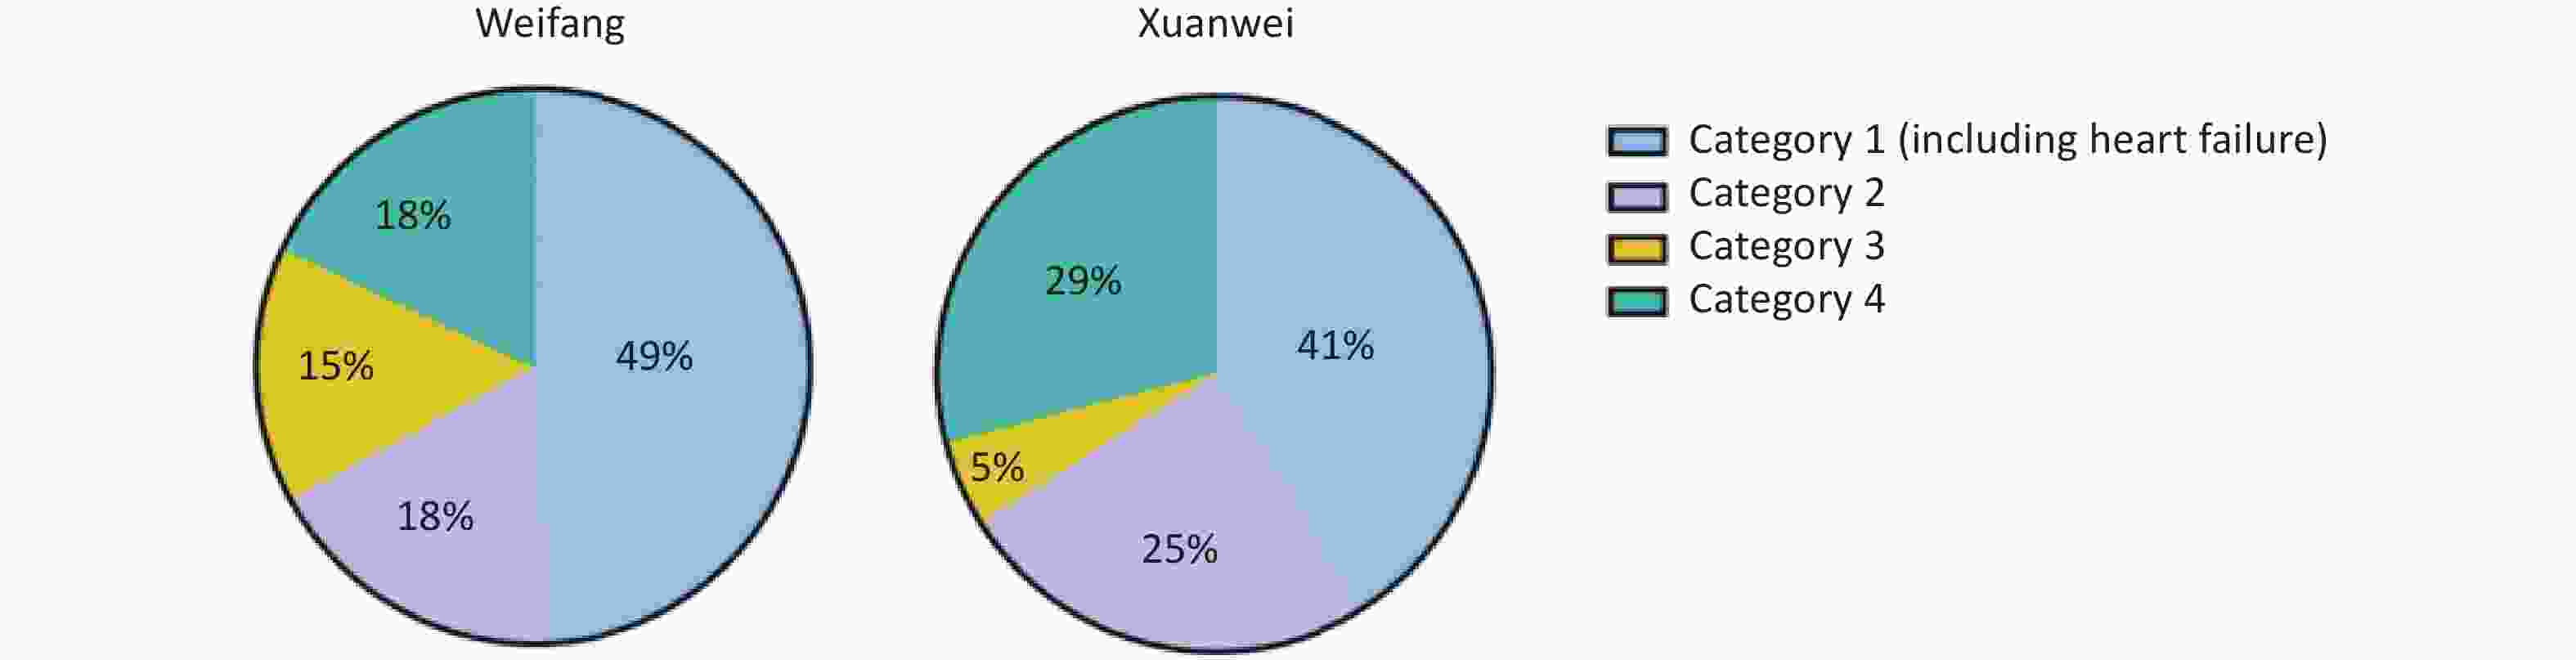
Figure S1. The constituent ratio of GCs in Weifang and Xuanwei.
Within those, death cases with UCOD stated as heart failure were 1,556 (0.33%) in Weifang and 226 (0.41%) in Xuanwei, respectively. Following the WHO guidelines, in Weifang, 74.16% of records remained heart failure, 12.85% of records were changed to other GCs, and 12.98% of records were assigned to a plausible correct UCOD. While in Xuan, these three proportions were 76.99%, 12.39% and 10.62%, respectively. These plausible correct UCODs were highly overlapping with the original top 20 causes of death in both cities (Table 2).
Table 2. The correction of heart failure by WHO guidelines
Item Weifang (n = 1,556) Xuanwei (n = 226) Corrected UCODs n Percent (%) Corrected UCODs n Percent (%) Garbage codes Remaining heart failure 1,154 74.16 Remaining heart failure 174 76.99 Other garbage codes 200 12.85 Other garbage codes 28 12.39 Correct UCOD 202 12.98 Correct UCOD 24 10.62 Non-communicable diseases# Ischemic heart disease (IHD) 126 8.10 Chronic obstructive pulmonary disease (COPD) 9 3.98 Hypertensive heart disease (HHD) 34 2.19 Malignant neoplasms except for TBLC 6 2.65 Stroke 3 0.19 Ischemic heart disease (IHD) 3 1.33 Rheumatic heart disease (RHD) 2 0.13 Hypertensive heart disease (HHD) 3 1.33 Cardiovascular diseases except for IHD, HHD, RHD and Stroke (CD) 2 0.13 Rheumatic heart disease (RHD) 1 0.44 Chronic obstructive pulmonary disease (COPD) 10 0.64 Other non-communicable diseases 1 0.44 Chronic respiratory diseases except for COPD 1 0.06 Digestive diseases 1 0.44 Malignant neoplasms except for TBLC 5 0.32 Tracheal, bronchus, and lung cancer (TBLC) 3 0.19 Diabetes mellitus and Chronic kidney disease (DMCKD) 4 0.26 Other non-communicable diseases 2 0.13 Digestive diseases 1 0.06 Neurological disorders 1 0.06 Injuries − 7 0.45 − 4 1.77 Communicable, maternal, neonatal, and nutritional diseases − 1 0.06 − 1 0.44 Note. #Diseases of three systems, cardiovascular diseases, chronic respiratory diseases and malignant neoplasms, are further divided into detailed diseases. ICD: International Statistical Classification of Diseases and Related Health Problems; UCOD: underlying cause of death; — means no data. The average total cause of death rates was 645.41/100,000 in Weifang, which was higher than that of Xuanwei (524.56/100,000). After corrected the causes of death by WHO guidelines, the top two causes of death were ischemic heart disease (IHD) (153.22/100,000) and stroke (126.71/100,000) in Weifang, and chronic obstructive pulmonary disease (COPD) (96.10/100,000) and tracheal, bronchus, and lung cancer (TBLC) (76.64/100,000) in Xuanwei (Supplementary Table S1, available in www.besjournal.com).
Table S1. Total mortality and cause-specific mortalities in Weifang and Xuanwei after UCOD correction
Causes Weifang 2010−2017 Xuanwei 2010−2016 Crude mortality (/100,000) Crude mortality (/100,000) Total 645.41 524.56 Communicable, maternal, neonatal, and nutritional diseases HIV/AIDS and sexually transmitted infections HIV/AIDS 0.03 0.94 Sexually transmitted diseases excluding HIV 0.01 0.04 Respiratory infections and tuberculosis Tuberculosis 0.41 1.20 Lower respiratory infections 0.95 7.24 Upper respiratory infections 0.04 0.18 Enteric infections Diarrheal diseases 0.07 0.72 Invasive Non-typhoidal Salmonella (iNTS) 0.02 0.03 Neglected tropical diseases and malaria Malaria < 0.01 0.03 Leprosy 0.01 0.08 Chagas disease < 0.01 0.00 Cysticercosis < 0.01 0.00 Dengue 0.00 0.02 Rabies 0.04 0.09 Other neglected tropical diseases 0.06 0.00 Other infectious diseases Meningitis 0.19 0.63 Encephalitis 0.18 0.11 Tetanus 0.02 0.03 Measles < 0.01 0.01 Varicella and herpes zoster 0.01 0.09 Acute hepatitis 0.17 0.49 Other unspecified infectious diseases 0.05 0.26 Maternal and neonatal disorders Maternal disorders 0.08 0.40 Neonatal disorders 2.09 5.70 Nutritional deficiencies Protein-energy malnutrition 0.12 0.56 Iron-deficiency anemia < 0.01 0.01 Other nutritional deficiencies 0.22 0.64 Non-communicable diseases Neoplasms Lip and oral cavity cancer 0.35 0.26 Nasopharynx cancer 0.60 0.60 Other pharynx cancer 0.21 0.09 Esophageal cancer 10.07 2.72 Stomach cancer 28.01 3.09 Colon and rectum cancer 7.83 3.81 Liver cancer 25.32 12.43 Gallbladder and biliary tract cancer 1.97 0.68 Pancreatic cancer 4.28 1.25 Larynx cancer 0.92 0.75 Tracheal, bronchus, and lung cancer 56.77 76.64 Malignant skin melanoma 0.13 0.05 Non-melanoma skin cancer 0.38 0.41 Breast cancer 3.71 1.30 Cervical cancer 1.21 0.93 Uterine cancer 0.57 0.13 Ovarian cancer 1.06 0.19 Prostate cancer 1.05 0.63 Testicular cancer 0.03 0.03 Kidney cancer 0.93 0.19 Bladder cancer 1.86 1.04 Brain and nervous system cancer 3.86 2.94 Thyroid cancer 0.29 0.19 Mesothelioma 0.05 0.03 Hodgkin lymphoma 0.24 0.04 Non-Hodgkin lymphoma 2.01 1.03 Multiple myeloma 0.52 0.23 Leukemia 3.93 2.56 Other malignant cancers 3.05 1.64 Other neoplasms 0.63 0.21 Cardiovascular diseases Rheumatic heart disease 1.99 3.70 Ischemic heart disease 153.22 34.12 Stroke 126.71 52.20 Hypertensive heart disease 10.24 2.11 Non-rheumatic valvular heart disease 0.10 0.03 Cardiomyopathy and myocarditis 0.48 0.77 Atrial fibrillation and flutter 0.04 0.01 Aortic aneurysm 0.41 0.12 Peripheral artery disease 0.08 0.03 Non-communicable diseases Endocarditis 0.04 0.07 Other cardiovascular and circulatory diseases 0.26 0.21 Chronic respiratory diseases Chronic obstructive pulmonary disease 61.18 96.10 Pneumoconiosis 0.06 0.46 Asthma 0.68 1.62 Interstitial lung disease and pulmonary sarcoidosis 0.67 0.05 Other chronic respiratory diseases 0.07 0.37 Digestive diseases Cirrhosis and other chronic liver diseases 3.23 4.88 Upper digestive system diseases 1.85 8.78 Appendicitis 0.03 0.25 Paralytic ileus and intestinal obstruction 0.49 1.29 Inguinal, femoral, and abdominal hernia 0.02 0.01 Inflammatory bowel disease 0.08 0.45 Vascular intestinal disorders 0.02 0.00 Gallbladder and biliary diseases 0.67 0.63 Pancreatitis 0.38 0.42 Other digestive diseases 0.11 0.53 Neurological disorders Alzheimer disease and other dementias 2.77 1.40 Parkinson disease 0.28 0.07 Epilepsy 0.58 1.17 Multiple sclerosis 0.01 0.00 Motor neuron disease 0.18 0.07 Other neurological disorders 0.32 0.26 Mental disorders Eating disorders 0.24 0.00 Substance use disorders Alcohol use disorders 0.43 2.19 Drug use disorders 0.03 0.17 Diabetes and kidney diseases Diabetes mellitus 3.70 3.70 Chronic kidney disease 4.72 4.90 Acute glomerulonephritis 0.20 0.70 Skin and subcutaneous diseases Bacterial skin diseases 0.02 0.11 Decubitus ulcer 0.14 0.77 Other skin and subcutaneous diseases 0.02 0.01 Musculoskeletal disorders Rheumatoid arthritis 0.19 0.83 Other musculoskeletal disorders 0.39 0.53 Other non-communicable diseases Congenital birth defects 1.80 2.21 Urinary diseases and male infertility 0.27 1.19 Gynecological diseases 0.03 0.05 Non-communicable diseases Hemoglobinopathies and hemolytic anemias 0.63 0.38 Endocrine, metabolic, blood, and immune disorders 0.38 0.65 Sudden infant death syndrome 0.03 0.00 Injuries Transport injuries Road injuries 21.00 10.67 Other transport injuries 0.38 0.60 Unintentional injuries Falls 3.11 18.32 Drowning 2.14 4.37 Fire, heat, and hot substances 0.55 0.74 Poisonings 2.00 3.05 Exposure to mechanical forces 1.22 5.62 Adverse effects of medical treatment 0.07 0.40 Animal contact 0.02 0.83 Foreign body 0.48 1.23 Environmental heat and cold exposure 0.17 0.13 Exposure to forces of nature 0.02 0.20 Other unintentional injuries 0.79 3.64 Self-harm and interpersonal violence Self-harm 6.19 9.49 Interpersonal violence 0.39 1.61 Executions and police conflict 0.01 0.04 Garbage codes 59.62 97.48 Still birth or Missing 0.17 0.03 Note. UCOD: Underlying Cause of Death; HIV: Human Immunodeficiency Virus; AIDS: Acquired Immune Deficiency Syndrome. -
Overall, after using CEM and LR approaches, the proportions of heart failure deaths unable to be changed to any other UCOD were 3.55% to 8.62%, respectively (Table 3).
Table 3. Results of the redistribution of heart failure
Weifang (n = 1,154) Xuanwei (n = 174) Redistribution target diseases Count, n Percent (%) Redistribution target diseases Count, n Percent (%) Approach 1 of coarsened exact matching Remaining heart failure 61.00 5.29 Remaining heart failure 15.00 8.62 Non-communicable diseases# 1,093.00 94.71 Non-communicable diseases# 159.00 91.38 Ischemic heart disease (IHD) 522.90 45.31 Ischemic heart disease (IHD) 42.97 24.70 Hypertensive heart disease (HHD) 248.82 21.56 Hypertensive heart disease (HHD) 17.36 9.98 Rheumatic heart disease (RHD) 36.13 3.13 Rheumatic heart disease (RHD) 8.45 4.86 Stroke 31.84 2.76 Stroke 0.25 0.14 Cardiovascular diseases except for IHD, HHD, RHD and Stroke (CD) 16.87 1.46 Cardiovascular diseases except for IHD, HHD, RHD and Stroke (CD) 2.23 1.28 Chronic obstructive pulmonary disease (COPD) 103.60 8.98 Diabetes mellitus and Chronic kidney disease (DMCKD) 40.45 23.25 Chronic respiratory diseases except for COPD 2.14 0.19 Chronic obstructive pulmonary disease (COPD) 28.02 16.10 Malignant neoplasms except for TBLC 52.12 4.52 Chronic respiratory diseases except for COPD 0.25 0.14 Tracheal, bronchus, and lung cancer (TBLC) 16.68 1.45 Other non-communicable diseases 4.57 2.62 Diabetes mellitus and Chronic kidney disease (DMCKD) 32.53 2.82 Malignant neoplasms except for TBLC 3.17 1.82 Digestive diseases 7.68 0.67 Tracheal, bronchus, and lung cancer (TBLC) 2.30 1.32 Other non-communicable diseases 6.94 0.60 Digestive diseases 2.90 1.67 Neurological disorders 4.51 0.39 Neurological disorders 0.50 0.29 Mental disorders and Substance use disorders 3.00 0.26 − − − Musculoskeletal disorders 1.79 0.16 − − − Other neoplasms 0.13 0.01 − − − Communicable, maternal, neonatal, and nutritional diseases 5.33 0.46 Communicable, maternal, neonatal, and nutritional diseases 5.58 3.21 Approach 2 linear regression Remaining heart failure 41.00 3.55 Remaining heart failure 9.00 5.17 Non-communicable diseases # 1,113.00 96.45 Non-communicable diseases # 165.00 94.83 Ischemic heart disease (IHD) 1,052.42 91.20 Chronic obstructive pulmonary disease (COPD) 165.00 94.83 Cardiovascular diseases except for IHD, HHD, RHD and Stroke (CD) 12.64 1.10 − − − Hypertensive heart disease (HHD) 1.33 0.12 − − − Rheumatic heart disease (RHD) 0.58 0.05 − − − Diabetes mellitus and Chronic kidney disease (DMCKD) 0.67 0.06 − − − Other garbage codes 45.36 3.93 − − − Note. #Diseases of three systems, cardiovascular diseases, chronic respiratory diseases and malignant neoplasms, are further divided into detailed diseases; — means no data. When using CEM, the numbers of “treatment records” and “control records” were 1,154 and 6,506 in Weifang, and 174 and 163 in Xuanwei, respectively. After redistribution by CEM, in Weifang, the deaths due to hypertensive heart disease (HHD), rheumatic heart disease (RHD) and cardiovascular diseases except for IHD, HHD, RHD and stroke (CD) most increased by 3.29%, 2.45% and 1.62%, respectively. In Xuanwei, the deaths due to HHD, diabetes mellitus and chronic kidney disease (DMCKD), RHD, and CD increased the most, with 7.79%, 4.11%, 2.16% and 1.70% of the increasing proportion, respectively (Supplementary Table S2, available in www.besjournal.com).
Table S2. Changes in death counts and ranks of the target diseases
Weifang Xuanwei original after heart failure correction further after heart failure redistribution rank among percentage of increase in death count (%, comparing to the count after correction) original after heart failure correction further after heart failure redistribution rank among percentage of increase in death count (%, comparing to the count after correction) all target diseases * all target diseases * coarsened exact matching linear regression coarsened exact matching linear regression coarsened exact matching linear regression coarsened exact matching linear regression Ischemic heart disease (IHD) 113147 113273 113795.90 114325.42 1 0.46 0.93 3609 3612 3654.97 3612.00 5 1.19 0.00 Hypertensive heart disease (HHD) 7533 7567 7815.82 7568.33 6 3.29 0.02 220 223 240.36 223.00 14 7.79 0.00 Rheumatic heart disease (RHD) 1472 1474 1510.13 1474.58 12 2.45 0.04 391 392 400.45 392.00 10 2.16 0.00 Stroke 93671 93674 93705.84 93674.00 2 0.03 0.00 5527 5527 5527.25 5527.00 3 0.01 0.00 Cardiovascular diseases except for IHD, HHD, RHD and Stroke (CD) 1040 1042 1058.87 1054.64 14 1.62 1.21 131 131 133.23 131.00 16 1.70 0.00 Chronic obstructive pulmonary disease (COPD) 45219 45229 45332.60 45229.00 4 0.23 0.00 10165 10174 10202.02 10339.00 1 0.28 1.62 Chronic respiratory diseases except for COPD 1101 1102 1104.14 1102.00 13 0.19 0.00 264 264 264.25 264.00 12 0.10 0.00 Tracheal, bronchus, and lung cancer (TBLC) 41966 41969 41985.68 41969.00 5 0.04 0.00 8114 8114 8116.30 8114.00 2 0.03 0.00 Malignant neoplasms except for TBLC 77195 77200 77252.12 77200.00 3 0.07 0.00 4146 4152 4155.17 4152.00 4 0.08 0.00 Diabetes mellitus and Chronic kidney disease (DMCKD) 6370 6374 6406.53 6374.67 7 0.51 0.01 985 985 1025.45 985.00 8 4.11 0.00 Digestive diseases 5083 5084 5091.68 5084.00 8 0.15 0.00 1825 1826 1828.90 1826.00 7 0.16 0.00 Other non-communicable diseases 2324 2326 2332.94 2326.00 11 0.30 0.00 473 474 478.57 474.00 9 0.96 0.00 Neurological disorders 3054 3055 3059.51 3055.00 10 0.15 0.00 314 314 314.50 314.00 11 0.16 0.00 Mental disorders and Substance use disorders 513 513 516.00 513.00 15 0.59 0.00 250 250 250.00 250.00 13 0.00 0.00 Musculoskeletal disorders 433 433 434.79 433.00 17 0.41 0.00 144 144 144.00 144.00 15 0.00 0.00 Other neoplasms 464 464 464.13 464.00 16 0.03 0.00 22 22 22.00 22.00 17 0.00 0.00 Communicable, maternal, neonatal, and nutritional diseases 3525 3526 3531.33 3526.00 9 0.15 0.00 2062 2063 2068.58 2063.00 6 0.27 0.00 Note. * The ranks always kept the same. After redistribution by LR, in Weifang, the deaths due to CD and IHD increased by 1.21% and 0.93%, respectively. In Xuanwei, the deaths due to COPD increased by 1.62% (Supplementary Table S2, available in www.besjournal.com). In Weifang, no redistribution proportions were estimated for heart failure deaths of 3 subgroups, 0–14 or 15–44 male and 45–64 female; in Xuanwei, those were estimated for heart failure deaths of 4 subgroups, 0–14 or 15–44 male and female (Supplementary Table S3, available in www.besjournal.com).
Table S3. The redistribution of heart failure by linear regression
Subgroups Weifang Xuanwei Count of heart failure in each subgroup Remaining heart failure in each subgroup after redistribution The count of heart failure redistributed to each target disease in each subgroup Count of heart failure in each subgroup Remaining heart failure in each subgroup after redistribution The count of heart failure redistributed to each target disease in each subgroup gender (1=male, 2=female) age group Rheumatic heart disease Hypertensive heart disease Chronic kidney disease Ischemic heart disease Cardiomyopathy and myocarditis Other Disease* Chronic obstructive pulmonary disease 1 0-14 2 2 2 2 1 15-44 12 12 2 2 1 45-64 58 0.00 0.00 0.00 0.00 12.64 45.36 8 8.00 1 65- 474 0.00 0.00 0.00 474.00 0.00 0.00 83 83.00 2 0-14 0 2 2 2 15-44 2 0.00 1.33 0.67 0.00 0.00 0.00 3 3 2 45-64 27 27 10 10.00 2 65- 579 0.00 0.00 0.00 578.42 0.00 0.00 64 64.00 0.58 0.00 0.00 0.00 0.00 0.00 Total 1154 41 0.58 1.33 0.67 1052.42 12.64 45.36 174 9 165.00 Note. *Other disease means the category 4 of garbage codes: unspecified causes within a larger cause grouping. Based on the above results, CEM led to a much more diverse spectrum of redistribution target diseases compared to LR. CEM determines the target diseases by considering the possible diseases occurred before the deceased die, while LR chose its TGs in advance based on the pathophysiology of heart failure. The LR redistribution results seemed to be strongly driven by the variation of the percentages of one or two TGs over the years, which may be the dominant ones in the dataset with large percentages. While in the publication of Ahern[10], the central tendency of redistribution to target diseases was not obvious. In some subgroups, heart failure was redistributed to 4 or more TGs out of 12. This may be because they used super region level databases (developed or developing countries). However, from the different age groups results, if the percentage of certain disease was high enough, we inferred that the variation of it between years may become difficult to identify, and this “stationary trend” could not drive the redistribution of heart failure towards it (Supplementary Table S4, available in www.besjournal.com).
Table S4. The percentages of heart failure and the 12 TGs in each year in Weifang
Sex Age group Year 2010 2011 2012 2013 2014 2015 2016 2017 Male 45–64 Heart failure 0.27% 0.58% 1.04% 0.57% 0.11% 0.16% 0.39% 0.05% TG No.12 0.07% 0.06% 0.00% 0.05% 0.00% 0.00% 0.00% 0.05% TG No.11 0.07% 0.12% 0.11% 0.05% 0.27% 0.05% 0.10% 0.24% TG No.10 0.27% 0.18% 0.05% 0.15% 0.16% 0.16% 0.10% 0.05% TG No.9 0.07% 0.06% 0.16% 0.10% 0.21% 0.05% 0.25% 0.00% TG No.8 0.13% 0.12% 0.22% 0.00% 0.16% 0.00% 0.15% 0.15% TG No.7 75.69% 75.35% 78.50% 80.09% 81.31% 80.56% 79.60% 81.57% TG No.6 8.04% 4.56% 3.84% 1.91% 1.49% 1.75% 3.10% 3.15% TG No.5 0.20% 0.18% 0.27% 0.41% 0.05% 0.27% 0.30% 0.15% TG No.4 0.13% 0.23% 0.27% 0.05% 0.00% 0.11% 0.05% 0.19% TG No.3 0.67% 0.35% 0.22% 0.67% 0.59% 0.49% 0.59% 0.63% TG No.2 14.13% 17.76% 14.65% 15.63% 14.75% 15.94% 14.79% 13.14% TG No.1 0.27% 0.47% 0.66% 0.31% 0.91% 0.44% 0.59% 0.63% Male 65– Heart failure 1.58% 1.20% 1.73% 0.32% 0.35% 0.44% 0.46% 0.20% TG No.12 0.01% 0.00% 0.00% 0.00% 0.00% 0.00% 0.00% 0.01% TG No.11 0.01% 0.03% 0.03% 0.03% 0.01% 0.05% 0.06% 0.08% TG No.10 0.12% 0.18% 0.13% 0.16% 0.05% 0.03% 0.05% 0.07% TG No.9 0.03% 0.03% 0.07% 0.01% 0.00% 0.05% 0.09% 0.05% TG No.8 0.12% 0.04% 0.04% 0.03% 0.02% 0.07% 0.04% 0.05% TG No.7 61.21% 64.11% 64.14% 66.84% 67.65% 69.36% 66.70% 68.72% TG No.6 10.47% 7.83% 4.59% 3.53% 4.01% 2.96% 5.02% 5.82% TG No.5 0.03% 0.03% 0.01% 0.01% 0.01% 0.01% 0.00% 0.02% TG No.4 0.06% 0.06% 0.08% 0.11% 0.01% 0.06% 0.05% 0.15% TG No.3 0.12% 0.18% 0.00% 0.05% 0.04% 0.06% 0.07% 0.03% TG No.2 26.16% 26.20% 28.98% 28.71% 27.73% 26.74% 27.31% 24.58% TG No.1 0.07% 0.12% 0.19% 0.20% 0.12% 0.18% 0.14% 0.22% Female 15–44 Heart failure 0.00% 0.00% 0.00% 0.00% 0.93% 1.16% 0.00% 0.00% TG No.12 0.00% 0.00% 1.11% 0.00% 0.93% 0.00% 0.97% 0.00% TG No.11 0.77% 0.00% 1.11% 0.00% 1.85% 0.00% 0.97% 2.94% TG No.10 2.31% 0.76% 2.22% 1.80% 0.93% 1.16% 0.00% 0.00% TG No.9 0.00% 0.00% 0.00% 0.00% 0.00% 0.00% 0.00% 0.00% TG No.8 0.00% 0.00% 0.00% 0.00% 0.00% 0.00% 0.00% 0.00% TG No.7 68.46% 71.76% 60.00% 73.87% 71.30% 75.58% 74.76% 74.51% TG No.6 8.46% 4.58% 2.22% 3.60% 0.93% 0.00% 3.88% 4.90% TG No.5 8.46% 8.40% 21.11% 8.11% 9.26% 11.63% 8.74% 6.86% TG No.4 0.77% 1.53% 2.22% 0.90% 0.00% 0.00% 0.00% 2.94% TG No.3 0.77% 1.53% 1.11% 1.80% 2.78% 1.16% 1.94% 1.96% TG No.2 10.00% 10.69% 7.78% 9.01% 10.19% 6.98% 7.77% 5.88% TG No.1 0.00% 0.76% 1.11% 0.90% 0.93% 2.33% 0.97% 0.00% Female 65– Heart failure 1.63% 1.22% 1.72% 0.41% 0.40% 0.54% 0.57% 0.26% TG No.12 0.04% 0.00% 0.00% 0.01% 0.00% 0.02% 0.03% 0.01% TG No.11 0.03% 0.04% 0.01% 0.06% 0.05% 0.09% 0.04% 0.05% TG No.10 0.18% 0.16% 0.11% 0.10% 0.12% 0.05% 0.04% 0.00% TG No.9 0.00% 0.03% 0.02% 0.02% 0.02% 0.01% 0.03% 0.05% TG No.8 0.00% 0.00% 0.01% 0.01% 0.00% 0.00% 0.00% 0.00% TG No.7 62.88% 66.09% 65.58% 69.73% 71.08% 70.98% 69.82% 72.38% TG No.6 10.39% 8.26% 6.09% 4.12% 4.21% 4.07% 4.96% 6.50% TG No.5 0.01% 0.04% 0.01% 0.03% 0.00% 0.01% 0.00% 0.00% TG No.4 0.11% 0.08% 0.05% 0.10% 0.05% 0.06% 0.03% 0.06% TG No.3 0.18% 0.11% 0.02% 0.02% 0.03% 0.03% 0.06% 0.03% TG No.2 24.52% 23.94% 26.28% 25.34% 23.97% 24.10% 24.40% 20.55% TG No.1 0.03% 0.04% 0.08% 0.04% 0.05% 0.04% 0.04% 0.10% Note. TG: target group. TG No.1: Aortic aneurysm, TG No.2: Chronic obstructive pulmonary disease (COPD), TG No.3: Cardiomyopathy, TG No.4: Chronic severe anemia, TG No.5: Congenital heart anomalies, TG No.6: Hypertensive heart disease, TG No.7: Ischemic heart disease, TG No.8: Other respiratory diseases, TG No.9: Other valve diseases, TG No.10: Pericarditis, endocarditis, myocarditis, TG No.11: Rheumatic heart disease, TG No.12: Thyroid disorders. Finally, the mortalities and ranks of all the causes originally after the redistribution of heart failure by two approaches were shown in Supplementary Table S5 (available in www.besjournal.com).
Table S5. The mortalities and ranks of all the causes originally after redistribution of heart failure by two approaches
Weifang Xuanwei Cause of death Original rate Rate after correction Rate after correction and redistribution by coarsened exact matching Rate after correction and redistribution by linear regression Original rank Rank after correction Rank after correction and redistribution by coarsened exact matching Rank after correction and redistribution by linear regression Original rate Rate after correction Rate after correction and redistribution by coarsened exact matching Rate after correction and redistribution by linear regression Original rank Rank after correction Rank after correction and redistribution by coarsened exact matching Rank after correction and redistribution by linear regression (/100,000) (/100,000) (/100,000) (/100,000) (/100,000) (/100,000) (/100,000) (/100,000) HIV/AIDS 0.03 0.03 0.03 0.03 98 100 102 100 0.94 0.94 0.94 0.94 45 44 45 44 Sexually transmitted diseases excluding HIV 0.01 0.01 0.01 0.01 107 109 111 109 0.04 0.04 0.04 0.04 85 84 87 84 Tuberculosis 0.41 0.41 0.41 0.41 57 57 58 57 1.20 1.20 1.20 1.20 40 39 41 39 Lower respiratory infections 0.95 0.95 0.95 0.95 39 39 39 39 7.24 7.24 7.25 7.24 13 13 13 13 Upper respiratory infections 0.04 0.04 0.04 0.04 95 97 99 97 0.18 0.18 0.18 0.18 76 75 77 75 Diarrheal diseases 0.07 0.07 0.07 0.07 89 90 92 90 0.72 0.72 0.72 0.72 52 51 52 51 Invasive Non-typhoidal Salmonella (iNTS) 0.02 0.02 0.02 0.02 102 104 106 104 0.03 0.03 0.03 0.03 86 85 88 85 Malaria 0.00 0.00 0.00 0.00 110 112 114 112 0.03 0.03 0.03 0.03 86 85 88 85 Leprosy 0.01 0.01 0.01 0.01 108 110 112 110 0.08 0.08 0.08 0.08 82 81 83 81 Chagas disease 0.00 0.00 0.00 0.00 110 112 114 112 0.00 0.00 0.00 0.00 89 88 91 88 Cysticercosis 0.00 0.00 0.00 0.00 110 112 114 112 0.00 0.00 0.00 0.00 89 88 91 88 Dengue 0.00 0.00 0.00 0.00 111 113 115 113 0.02 0.02 0.02 0.02 87 86 89 86 Rabies 0.04 0.04 0.04 0.04 95 97 99 97 0.09 0.09 0.09 0.09 81 80 82 80 Other neglected tropical diseases 0.06 0.06 0.06 0.06 91 92 94 92 0.00 0.00 0.00 0.00 89 88 91 88 Meningitis 0.19 0.19 0.19 0.19 74 74 76 74 0.63 0.63 0.63 0.63 57 56 57 56 Encephalitis 0.18 0.18 0.18 0.18 76 76 78 76 0.11 0.11 0.11 0.11 80 79 81 79 Tetanus 0.02 0.02 0.02 0.02 100 102 104 102 0.03 0.03 0.03 0.03 86 85 88 85 Measles 0.00 0.00 0.00 0.00 110 112 114 112 0.01 0.01 0.01 0.01 88 87 90 87 Varicella and herpes zoster 0.01 0.01 0.01 0.01 106 108 110 108 0.09 0.09 0.09 0.09 81 80 82 80 Acute hepatitis 0.17 0.17 0.17 0.17 77 77 79 77 0.49 0.49 0.49 0.49 61 60 61 60 Other unspecified infectious diseases 0.05 0.05 0.05 0.05 92 93 95 93 0.26 0.26 0.26 0.26 70 69 70 69 Maternal disorders 0.08 0.08 0.08 0.08 85 85 88 85 0.40 0.40 0.40 0.40 66 65 66 65 Neonatal disorders 2.09 2.09 2.09 2.09 27 27 27 27 5.70 5.70 5.73 5.70 14 14 14 14 Protein-energy malnutrition 0.12 0.12 0.12 0.12 82 82 84 82 0.56 0.56 0.56 0.56 59 58 59 58 Iron-deficiency anemia 0.00 0.00 0.00 0.00 109 111 113 111 0.01 0.01 0.01 0.01 88 87 90 87 Other nutritional deficiencies 0.22 0.22 0.22 0.22 71 71 72 71 0.64 0.64 0.66 0.64 56 55 56 55 Lip and oral cavity cancer 0.35 0.35 0.35 0.35 63 63 64 63 0.26 0.26 0.26 0.26 70 69 70 69 Nasopharynx cancer 0.60 0.60 0.61 0.60 47 47 48 47 0.60 0.60 0.60 0.60 58 57 58 57 Other pharynx cancer 0.21 0.21 0.21 0.21 72 72 73 72 0.09 0.09 0.09 0.09 81 80 82 80 Esophageal cancer 10.07 10.07 10.09 10.07 12 12 12 12 2.72 2.72 2.72 2.72 27 26 27 26 Stomach cancer 28.00 28.01 28.03 28.01 6 6 5 5 3.09 3.09 3.09 3.09 24 23 24 23 Colon and rectum cancer 7.83 7.83 7.83 7.83 14 14 14 14 3.81 3.81 3.81 3.81 20 20 21 20 Liver cancer 25.32 25.32 25.33 25.32 7 7 7 7 12.43 12.43 12.43 12.43 9 9 9 9 Gallbladder and biliary tract cancer 1.97 1.97 1.97 1.97 31 31 31 31 0.66 0.68 0.71 0.68 54 53 53 53 Pancreatic cancer 4.28 4.28 4.28 4.28 17 17 17 17 1.25 1.25 1.25 1.25 38 37 38 37 Larynx cancer 0.92 0.92 0.92 0.92 41 41 41 41 0.75 0.75 0.75 0.75 50 49 50 49 Tracheal, bronchus, and lung cancer 56.77 56.77 56.79 56.77 4 4 4 4 76.64 76.64 76.66 76.64 2 2 2 2 Malignant skin melanoma 0.13 0.13 0.13 0.13 81 81 83 81 0.05 0.05 0.05 0.05 84 83 86 83 Non-melanoma skin cancer 0.38 0.38 0.38 0.38 61 61 62 61 0.41 0.41 0.41 0.41 65 64 65 64 Breast cancer 3.71 3.71 3.71 3.71 20 20 21 20 1.30 1.30 1.30 1.30 36 35 36 35 Cervical cancer 1.21 1.21 1.21 1.21 36 36 36 36 0.93 0.93 0.93 0.93 46 45 46 45 Uterine cancer 0.57 0.57 0.57 0.57 49 49 50 49 0.13 0.13 0.13 0.13 78 77 79 77 Ovarian cancer 1.06 1.06 1.06 1.06 37 37 37 37 0.19 0.19 0.19 0.19 75 74 76 74 Prostate cancer 1.05 1.05 1.05 1.05 38 38 38 38 0.63 0.63 0.63 0.63 57 56 57 56 Testicular cancer 0.03 0.03 0.03 0.03 99 101 103 101 0.03 0.03 0.03 0.03 86 85 88 85 Kidney cancer 0.93 0.93 0.93 0.93 40 40 40 40 0.19 0.19 0.19 0.19 75 74 76 74 Bladder cancer 1.86 1.86 1.86 1.86 32 32 32 32 1.04 1.04 1.04 1.04 43 42 43 42 Brain and nervous system cancer 3.86 3.86 3.86 3.86 19 19 19 19 2.94 2.94 2.94 2.94 26 25 26 25 Thyroid cancer 0.29 0.29 0.29 0.29 65 65 66 65 0.19 0.19 0.19 0.19 75 74 76 74 Mesothelioma 0.05 0.05 0.05 0.05 93 94 96 94 0.03 0.03 0.03 0.03 86 85 88 85 Hodgkin lymphoma 0.24 0.24 0.24 0.24 70 70 71 70 0.04 0.04 0.04 0.04 85 84 87 84 Non-Hodgkin lymphoma 2.01 2.01 2.01 2.01 28 28 29 28 1.03 1.03 1.03 1.03 44 43 44 43 Multiple myeloma 0.52 0.52 0.52 0.52 51 51 52 51 0.23 0.23 0.23 0.23 72 71 72 71 Leukemia 3.93 3.93 3.93 3.93 18 18 18 18 2.54 2.56 2.56 2.56 28 27 28 27 Other malignant cancers 3.05 3.05 3.05 3.05 24 24 24 24 1.62 1.64 1.64 1.64 32 31 32 31 Other neoplasms 0.63 0.63 0.63 0.63 46 46 47 46 0.21 0.21 0.21 0.21 73 72 74 72 Rheumatic heart disease 1.99 1.99 2.04 1.99 30 30 28 30 3.69 3.70 3.78 3.70 22 21 22 21 Ischemic heart disease 153.05 153.22 153.93 154.65 1 1 1 1 34.09 34.12 34.52 34.12 5 5 5 5 Stroke 126.71 126.71 126.75 126.71 2 2 2 2 52.20 52.20 52.21 52.20 3 3 3 3 Hypertensive heart disease 10.19 10.24 10.57 10.24 11 11 10 11 2.08 2.11 2.27 2.11 31 30 29 30 Non-rheumatic valvular heart disease 0.10 0.10 0.11 0.10 84 84 86 84 0.03 0.03 0.03 0.03 86 85 88 85 Cardiomyopathy and myocarditis 0.48 0.48 0.49 0.50 54 54 54 52 0.77 0.77 0.78 0.77 48 47 48 47 Atrial fibrillation and flutter 0.04 0.04 0.04 0.04 95 96 98 96 0.01 0.01 0.01 0.01 88 87 90 87 Aortic aneurysm 0.41 0.41 0.41 0.41 56 56 57 56 0.12 0.12 0.12 0.12 79 78 80 78 Peripheral artery disease 0.08 0.08 0.08 0.08 86 86 87 86 0.03 0.03 0.03 0.03 86 85 88 85 Endocarditis 0.04 0.04 0.04 0.04 94 95 97 95 0.07 0.07 0.07 0.07 83 82 84 82 Other cardiovascular and circulatory diseases 0.26 0.26 0.26 0.26 68 68 69 68 0.21 0.21 0.22 0.21 73 72 73 72 Chronic obstructive pulmonary disease 61.17 61.18 61.32 61.18 3 3 3 3 96.01 96.10 96.36 97.66 1 1 1 1 Pneumoconiosis 0.06 0.06 0.06 0.06 90 91 93 91 0.46 0.46 0.46 0.46 62 61 63 61 Asthma 0.68 0.68 0.68 0.68 43 43 43 43 1.62 1.62 1.62 1.62 33 32 33 32 Interstitial lung disease and pulmonary sarcoidosis 0.67 0.67 0.67 0.67 44 44 45 44 0.05 0.05 0.05 0.05 84 83 86 83 Other chronic respiratory diseases 0.07 0.07 0.07 0.07 88 88 90 88 0.37 0.37 0.37 0.37 68 67 68 67 Cirrhosis and other chronic liver diseases 3.23 3.23 3.23 3.23 22 22 22 22 4.88 4.88 4.88 4.88 17 17 17 17 Upper digestive system diseases 1.85 1.85 1.85 1.85 33 33 33 33 8.78 8.78 8.79 8.78 12 12 12 12 Appendicitis 0.03 0.03 0.03 0.03 97 99 101 99 0.25 0.25 0.25 0.25 71 70 71 70 Paralytic ileus and intestinal obstruction 0.49 0.49 0.49 0.49 52 52 53 53 1.28 1.29 1.30 1.29 37 36 37 36 Inguinal, femoral, and abdominal hernia 0.02 0.02 0.02 0.02 100 102 104 102 0.01 0.01 0.01 0.01 88 87 90 87 Inflammatory bowel disease 0.08 0.08 0.08 0.08 87 87 89 87 0.45 0.45 0.47 0.45 63 62 62 62 Vascular intestinal disorders 0.02 0.02 0.02 0.02 101 103 105 103 0.00 0.00 0.00 0.00 89 88 91 88 Gallbladder and biliary diseases 0.67 0.67 0.67 0.67 45 45 44 45 0.63 0.63 0.63 0.63 57 56 57 56 Pancreatitis 0.38 0.38 0.38 0.38 62 62 63 62 0.42 0.42 0.42 0.42 64 63 64 63 Other digestive diseases 0.11 0.11 0.12 0.11 83 83 85 83 0.53 0.53 0.53 0.53 60 59 60 59 Alzheimer disease and other dementias 2.77 2.77 2.78 2.77 25 25 25 25 1.40 1.40 1.40 1.40 35 34 35 34 Parkinson disease 0.28 0.28 0.28 0.28 66 66 67 66 0.07 0.07 0.07 0.07 83 82 85 82 Epilepsy 0.58 0.58 0.58 0.58 48 48 49 48 1.17 1.17 1.17 1.17 42 41 42 41 Multiple sclerosis 0.01 0.01 0.01 0.01 107 109 111 109 0.00 0.00 0.00 0.00 89 88 91 88 Motor neuron disease 0.18 0.18 0.18 0.18 75 75 77 75 0.07 0.07 0.07 0.07 83 82 85 82 Other neurological disorders 0.32 0.32 0.32 0.32 64 64 65 64 0.26 0.26 0.26 0.26 69 68 69 68 Eating disorders 0.24 0.24 0.24 0.24 69 69 70 69 0.00 0.00 0.00 0.00 89 88 91 88 Alcohol use disorders 0.43 0.43 0.43 0.43 55 55 56 55 2.19 2.19 2.19 2.19 30 29 31 29 Drug use disorders 0.03 0.03 0.03 0.03 99 101 103 101 0.17 0.17 0.17 0.17 77 76 78 76 Diabetes mellitus 3.70 3.70 3.72 3.70 21 21 20 21 3.70 3.70 3.85 3.70 21 21 20 21 Chronic kidney disease 4.71 4.72 4.74 4.72 16 16 16 16 4.90 4.90 5.13 4.90 16 16 16 16 Acute glomerulonephritis 0.20 0.20 0.20 0.20 73 73 74 73 0.70 0.70 0.70 0.70 53 52 54 52 Bacterial skin diseases 0.02 0.02 0.02 0.02 103 105 107 105 0.11 0.11 0.11 0.11 80 79 81 79 Decubitus ulcer 0.14 0.14 0.14 0.14 80 80 82 80 0.77 0.77 0.77 0.77 49 48 49 48 Other skin and subcutaneous diseases 0.02 0.02 0.02 0.02 104 106 108 106 0.01 0.01 0.01 0.01 88 87 90 87 Rheumatoid arthritis 0.19 0.19 0.19 0.19 74 74 75 74 0.83 0.83 0.83 0.83 47 46 47 46 Other musculoskeletal disorders 0.39 0.39 0.40 0.39 58 58 59 58 0.53 0.53 0.53 0.53 60 59 60 59 Congenital birth defects 1.80 1.80 1.81 1.80 34 34 34 34 2.20 2.21 2.22 2.21 29 28 30 28 Urinary diseases and male infertility 0.27 0.27 0.27 0.27 67 67 68 67 1.19 1.19 1.20 1.19 41 40 40 40 Gynecological diseases 0.03 0.03 0.03 0.03 99 101 103 101 0.05 0.05 0.05 0.05 84 83 86 83 Hemoglobinopathies and hemolytic anemias 0.63 0.63 0.63 0.63 46 46 46 46 0.38 0.38 0.38 0.38 67 66 67 66 Endocrine, metabolic, blood, and immune disorders 0.38 0.38 0.38 0.38 60 60 61 60 0.65 0.65 0.67 0.65 55 54 55 54 Sudden infant death syndrome 0.03 0.03 0.03 0.03 96 98 100 98 0.00 0.00 0.00 0.00 89 88 91 88 Road injuries 21.00 21.00 21.00 21.00 8 8 8 8 10.67 10.67 10.67 10.67 10 10 10 10 Other transport injuries 0.38 0.38 0.38 0.38 61 61 62 61 0.60 0.60 0.60 0.60 58 57 58 57 Falls 3.11 3.11 3.11 3.11 23 23 23 23 18.32 18.32 18.32 18.32 8 8 8 8 Drowning 2.14 2.14 2.14 2.14 26 26 26 26 4.37 4.37 4.37 4.37 18 19 19 19 Fire, heat, and hot substances 0.54 0.55 0.55 0.55 50 50 51 50 0.74 0.74 0.74 0.74 51 50 51 50 Poisonings 2.00 2.00 2.00 2.00 29 29 30 29 3.05 3.05 3.05 3.05 25 24 25 24 Exposure to mechanical forces 1.22 1.22 1.22 1.22 35 35 35 35 5.60 5.62 5.62 5.62 15 15 15 15 Adverse effects of medical treatment 0.07 0.07 0.07 0.07 89 89 91 89 0.40 0.40 0.40 0.40 66 65 66 65 Animal contact 0.02 0.02 0.02 0.02 104 106 108 106 0.83 0.83 0.83 0.83 47 46 47 46 Foreign body 0.48 0.48 0.48 0.48 53 53 55 54 1.23 1.23 1.23 1.23 39 38 39 38 Environmental heat and cold exposure 0.17 0.17 0.17 0.17 79 79 81 79 0.13 0.13 0.13 0.13 78 77 79 77 Exposure to forces of nature 0.02 0.02 0.02 0.02 100 102 104 102 0.20 0.20 0.20 0.20 74 73 75 73 Other unintentional injuries 0.79 0.79 0.79 0.79 42 42 42 42 3.63 3.64 3.64 3.64 23 22 23 22 Self-harm 6.19 6.19 6.19 6.19 15 15 15 15 9.48 9.49 9.49 9.49 11 11 11 11 Interpersonal violence 0.39 0.39 0.39 0.39 59 59 60 59 1.61 1.61 1.61 1.61 34 33 34 33 Executions and police conflict 0.01 0.01 0.01 0.01 105 107 109 107 0.04 0.04 0.04 0.04 85 84 87 84 GC category 1 (including heart failure) 29.73 29.23 27.75 27.72 5 5 6 6 40.53 40.17 38.67 38.61 4 4 4 4 GC category 2 10.42 10.44 10.44 10.44 10 10 11 10 24.61 24.66 24.66 24.66 7 7 7 7 GC category 3 8.97 8.99 8.99 8.99 13 13 13 13 4.36 4.38 4.38 4.38 19 18 18 18 GC category 4 10.78 10.96 10.96 11.02 9 9 9 9 28.24 28.26 28.26 28.26 6 6 6 6 Still birth or Missing 0.17 0.17 0.17 0.17 78 78 80 78 0.03 0.03 0.03 0.03 86 85 88 85 Note. HIV: Human Immunodeficiency Virus; AIDS: Acquired Immune Deficiency Syndrome; GC: Garbage Code. Our study illustrated that the CEM might be better than the LR at city level. However, another study[6] conducted in Taiwan showed that multinomial logistic regression was the suitable model for GC redistribution, compared to naive Bayes classifier and CEM, which might be because Taiwan has a larger population quantity (23 million population) than that of Weifang or Xuanwei, indicating that the application of different models might be related to the scale of the population.
Several suggestions for the applicability of the two methods are proposed. LR is more recommended when the target codes are very clear, or the data sample size is large enough for modeling. While, CEM is recommended if the data sample size is small, or primary health workers are not requested for complex technology, without establishing statistical model.
doi: 10.3967/bes2024.173
A Case Study on Garbage Code Redistribution Methods for Heart Failure at City Level by Two Approaches
-
Organizing and analyzing the data, interpreting the results and drafting the manuscript, including the tables and figures: Liqun Liu and Zemin Cai. Supporting the data acquisition process, and helping explain the questions relating the operation of the death surveillance system: Xuewei Wang, Chunping Wang, Xiangyun Ma, Xianfeng Meng, Bofu Ning and Ning Li. Designing the study, guiding its implementation, helping with the interpretation of the results and revising the manuscript: Xia Wan. Reading and approving the final manuscript: All authors.
The authors declare that there are no conflict of interest.
&These authors contributed equally to this work.
注释:1) Authors’ Contributions: 2) Competing Interests: -
S1. The constituent ratio of GCs in Weifang and Xuanwei.
GC: Garbage Code. Garbage Code categories: category 1: causes that cannot or should not be considered as Underlying Cause of Death (UCOD); category 2: intermediate causes in the cause of death chain; category 3: immediate causes in the cause of death chain; category 4: unspecified causes within a larger cause grouping.
Table 1. Variables for dividing subgroups in Weifang and Xuanwei
Characteristics Weifang Xuanwei n Percent (%) n Percent (%) Gender Male 268,639 56.30 34,320 61.80 Female 208,425 43.68 21,216 38.20 Unknown* 72 0.02 − − Age group (years) 0- 5,513 1.16 2,120 3.82 15- 24,090 5.05 6,584 11.86 45- 103,215 21.63 12,472 22.46 65- 94,719 19.85 10,959 19.73 75- 150,839 31.61 15,322 27.59 85- 98,760 20.70 8,079 14.55 Death year 2010 56,264 11.79 7,054 12.70 2011 56,446 11.83 7,993 14.39 2012 56,333 11.81 7,737 13.93 2013 59,725 12.52 7,924 14.27 2014 58,323 12.22 8,335 15.01 2015 60,645 12.71 7,869 14.17 2016 63,638 13.34 8,610 15.50 2017 65,762 13.78 − − Between 2014—2016 but unknown* − − 14 0.03 The highest agency of diagnosis Tertiary hospital 106,308 22.28 10,018 18.04 Secondary hospital 270,190 56.63 22,579 40.66 Primary hospital 83,771 17.56 9,976 17.96 No hospital diagnosis or other or unknown* 16,867 3.54 12,963 23.34 Urban or rural resident Rural 263,743 55.28 − − Urban 213,166 44.68 − − Unknown* 227 0.05 − − Garbage code# Category 1 21,975 4.61 4,291 7.73 Category 2 7,706 1.62 2,606 4.69 Category 3 6,629 1.39 462 0.83 Category 4 7,967 1.67 2,990 5.38 Total 477,136 55,536 Note. *If the missing values could not be filled, ‘unknown’ was used as a category. #Garbage Code categories: category 1: causes that cannot or should not be considered as underlying cause of death (UCOD); category 2: intermediate causes in the cause of death chain; category 3: immediate causes in the cause of death chain; category 4: unspecified causes within a larger cause grouping; — means no data.  下载: 导出CSV
Table 2. The correction of heart failure by WHO guidelines
Item Weifang (n = 1,556) Xuanwei (n = 226) Corrected UCODs n Percent (%) Corrected UCODs n Percent (%) Garbage codes Remaining heart failure 1,154 74.16 Remaining heart failure 174 76.99 Other garbage codes 200 12.85 Other garbage codes 28 12.39 Correct UCOD 202 12.98 Correct UCOD 24 10.62 Non-communicable diseases# Ischemic heart disease (IHD) 126 8.10 Chronic obstructive pulmonary disease (COPD) 9 3.98 Hypertensive heart disease (HHD) 34 2.19 Malignant neoplasms except for TBLC 6 2.65 Stroke 3 0.19 Ischemic heart disease (IHD) 3 1.33 Rheumatic heart disease (RHD) 2 0.13 Hypertensive heart disease (HHD) 3 1.33 Cardiovascular diseases except for IHD, HHD, RHD and Stroke (CD) 2 0.13 Rheumatic heart disease (RHD) 1 0.44 Chronic obstructive pulmonary disease (COPD) 10 0.64 Other non-communicable diseases 1 0.44 Chronic respiratory diseases except for COPD 1 0.06 Digestive diseases 1 0.44 Malignant neoplasms except for TBLC 5 0.32 Tracheal, bronchus, and lung cancer (TBLC) 3 0.19 Diabetes mellitus and Chronic kidney disease (DMCKD) 4 0.26 Other non-communicable diseases 2 0.13 Digestive diseases 1 0.06 Neurological disorders 1 0.06 Injuries − 7 0.45 − 4 1.77 Communicable, maternal, neonatal, and nutritional diseases − 1 0.06 − 1 0.44 Note. #Diseases of three systems, cardiovascular diseases, chronic respiratory diseases and malignant neoplasms, are further divided into detailed diseases. ICD: International Statistical Classification of Diseases and Related Health Problems; UCOD: underlying cause of death; — means no data.
下载: 导出CSV
S1. Total mortality and cause-specific mortalities in Weifang and Xuanwei after UCOD correction
Causes Weifang 2010−2017 Xuanwei 2010−2016 Crude mortality (/100,000) Crude mortality (/100,000) Total 645.41 524.56 Communicable, maternal, neonatal, and nutritional diseases HIV/AIDS and sexually transmitted infections HIV/AIDS 0.03 0.94 Sexually transmitted diseases excluding HIV 0.01 0.04 Respiratory infections and tuberculosis Tuberculosis 0.41 1.20 Lower respiratory infections 0.95 7.24 Upper respiratory infections 0.04 0.18 Enteric infections Diarrheal diseases 0.07 0.72 Invasive Non-typhoidal Salmonella (iNTS) 0.02 0.03 Neglected tropical diseases and malaria Malaria < 0.01 0.03 Leprosy 0.01 0.08 Chagas disease < 0.01 0.00 Cysticercosis < 0.01 0.00 Dengue 0.00 0.02 Rabies 0.04 0.09 Other neglected tropical diseases 0.06 0.00 Other infectious diseases Meningitis 0.19 0.63 Encephalitis 0.18 0.11 Tetanus 0.02 0.03 Measles < 0.01 0.01 Varicella and herpes zoster 0.01 0.09 Acute hepatitis 0.17 0.49 Other unspecified infectious diseases 0.05 0.26 Maternal and neonatal disorders Maternal disorders 0.08 0.40 Neonatal disorders 2.09 5.70 Nutritional deficiencies Protein-energy malnutrition 0.12 0.56 Iron-deficiency anemia < 0.01 0.01 Other nutritional deficiencies 0.22 0.64 Non-communicable diseases Neoplasms Lip and oral cavity cancer 0.35 0.26 Nasopharynx cancer 0.60 0.60 Other pharynx cancer 0.21 0.09 Esophageal cancer 10.07 2.72 Stomach cancer 28.01 3.09 Colon and rectum cancer 7.83 3.81 Liver cancer 25.32 12.43 Gallbladder and biliary tract cancer 1.97 0.68 Pancreatic cancer 4.28 1.25 Larynx cancer 0.92 0.75 Tracheal, bronchus, and lung cancer 56.77 76.64 Malignant skin melanoma 0.13 0.05 Non-melanoma skin cancer 0.38 0.41 Breast cancer 3.71 1.30 Cervical cancer 1.21 0.93 Uterine cancer 0.57 0.13 Ovarian cancer 1.06 0.19 Prostate cancer 1.05 0.63 Testicular cancer 0.03 0.03 Kidney cancer 0.93 0.19 Bladder cancer 1.86 1.04 Brain and nervous system cancer 3.86 2.94 Thyroid cancer 0.29 0.19 Mesothelioma 0.05 0.03 Hodgkin lymphoma 0.24 0.04 Non-Hodgkin lymphoma 2.01 1.03 Multiple myeloma 0.52 0.23 Leukemia 3.93 2.56 Other malignant cancers 3.05 1.64 Other neoplasms 0.63 0.21 Cardiovascular diseases Rheumatic heart disease 1.99 3.70 Ischemic heart disease 153.22 34.12 Stroke 126.71 52.20 Hypertensive heart disease 10.24 2.11 Non-rheumatic valvular heart disease 0.10 0.03 Cardiomyopathy and myocarditis 0.48 0.77 Atrial fibrillation and flutter 0.04 0.01 Aortic aneurysm 0.41 0.12 Peripheral artery disease 0.08 0.03 Non-communicable diseases Endocarditis 0.04 0.07 Other cardiovascular and circulatory diseases 0.26 0.21 Chronic respiratory diseases Chronic obstructive pulmonary disease 61.18 96.10 Pneumoconiosis 0.06 0.46 Asthma 0.68 1.62 Interstitial lung disease and pulmonary sarcoidosis 0.67 0.05 Other chronic respiratory diseases 0.07 0.37 Digestive diseases Cirrhosis and other chronic liver diseases 3.23 4.88 Upper digestive system diseases 1.85 8.78 Appendicitis 0.03 0.25 Paralytic ileus and intestinal obstruction 0.49 1.29 Inguinal, femoral, and abdominal hernia 0.02 0.01 Inflammatory bowel disease 0.08 0.45 Vascular intestinal disorders 0.02 0.00 Gallbladder and biliary diseases 0.67 0.63 Pancreatitis 0.38 0.42 Other digestive diseases 0.11 0.53 Neurological disorders Alzheimer disease and other dementias 2.77 1.40 Parkinson disease 0.28 0.07 Epilepsy 0.58 1.17 Multiple sclerosis 0.01 0.00 Motor neuron disease 0.18 0.07 Other neurological disorders 0.32 0.26 Mental disorders Eating disorders 0.24 0.00 Substance use disorders Alcohol use disorders 0.43 2.19 Drug use disorders 0.03 0.17 Diabetes and kidney diseases Diabetes mellitus 3.70 3.70 Chronic kidney disease 4.72 4.90 Acute glomerulonephritis 0.20 0.70 Skin and subcutaneous diseases Bacterial skin diseases 0.02 0.11 Decubitus ulcer 0.14 0.77 Other skin and subcutaneous diseases 0.02 0.01 Musculoskeletal disorders Rheumatoid arthritis 0.19 0.83 Other musculoskeletal disorders 0.39 0.53 Other non-communicable diseases Congenital birth defects 1.80 2.21 Urinary diseases and male infertility 0.27 1.19 Gynecological diseases 0.03 0.05 Non-communicable diseases Hemoglobinopathies and hemolytic anemias 0.63 0.38 Endocrine, metabolic, blood, and immune disorders 0.38 0.65 Sudden infant death syndrome 0.03 0.00 Injuries Transport injuries Road injuries 21.00 10.67 Other transport injuries 0.38 0.60 Unintentional injuries Falls 3.11 18.32 Drowning 2.14 4.37 Fire, heat, and hot substances 0.55 0.74 Poisonings 2.00 3.05 Exposure to mechanical forces 1.22 5.62 Adverse effects of medical treatment 0.07 0.40 Animal contact 0.02 0.83 Foreign body 0.48 1.23 Environmental heat and cold exposure 0.17 0.13 Exposure to forces of nature 0.02 0.20 Other unintentional injuries 0.79 3.64 Self-harm and interpersonal violence Self-harm 6.19 9.49 Interpersonal violence 0.39 1.61 Executions and police conflict 0.01 0.04 Garbage codes 59.62 97.48 Still birth or Missing 0.17 0.03 Note. UCOD: Underlying Cause of Death; HIV: Human Immunodeficiency Virus; AIDS: Acquired Immune Deficiency Syndrome.
下载: 导出CSV
Table 3. Results of the redistribution of heart failure
Weifang (n = 1,154) Xuanwei (n = 174) Redistribution target diseases Count, n Percent (%) Redistribution target diseases Count, n Percent (%) Approach 1 of coarsened exact matching Remaining heart failure 61.00 5.29 Remaining heart failure 15.00 8.62 Non-communicable diseases# 1,093.00 94.71 Non-communicable diseases# 159.00 91.38 Ischemic heart disease (IHD) 522.90 45.31 Ischemic heart disease (IHD) 42.97 24.70 Hypertensive heart disease (HHD) 248.82 21.56 Hypertensive heart disease (HHD) 17.36 9.98 Rheumatic heart disease (RHD) 36.13 3.13 Rheumatic heart disease (RHD) 8.45 4.86 Stroke 31.84 2.76 Stroke 0.25 0.14 Cardiovascular diseases except for IHD, HHD, RHD and Stroke (CD) 16.87 1.46 Cardiovascular diseases except for IHD, HHD, RHD and Stroke (CD) 2.23 1.28 Chronic obstructive pulmonary disease (COPD) 103.60 8.98 Diabetes mellitus and Chronic kidney disease (DMCKD) 40.45 23.25 Chronic respiratory diseases except for COPD 2.14 0.19 Chronic obstructive pulmonary disease (COPD) 28.02 16.10 Malignant neoplasms except for TBLC 52.12 4.52 Chronic respiratory diseases except for COPD 0.25 0.14 Tracheal, bronchus, and lung cancer (TBLC) 16.68 1.45 Other non-communicable diseases 4.57 2.62 Diabetes mellitus and Chronic kidney disease (DMCKD) 32.53 2.82 Malignant neoplasms except for TBLC 3.17 1.82 Digestive diseases 7.68 0.67 Tracheal, bronchus, and lung cancer (TBLC) 2.30 1.32 Other non-communicable diseases 6.94 0.60 Digestive diseases 2.90 1.67 Neurological disorders 4.51 0.39 Neurological disorders 0.50 0.29 Mental disorders and Substance use disorders 3.00 0.26 − − − Musculoskeletal disorders 1.79 0.16 − − − Other neoplasms 0.13 0.01 − − − Communicable, maternal, neonatal, and nutritional diseases 5.33 0.46 Communicable, maternal, neonatal, and nutritional diseases 5.58 3.21 Approach 2 linear regression Remaining heart failure 41.00 3.55 Remaining heart failure 9.00 5.17 Non-communicable diseases # 1,113.00 96.45 Non-communicable diseases # 165.00 94.83 Ischemic heart disease (IHD) 1,052.42 91.20 Chronic obstructive pulmonary disease (COPD) 165.00 94.83 Cardiovascular diseases except for IHD, HHD, RHD and Stroke (CD) 12.64 1.10 − − − Hypertensive heart disease (HHD) 1.33 0.12 − − − Rheumatic heart disease (RHD) 0.58 0.05 − − − Diabetes mellitus and Chronic kidney disease (DMCKD) 0.67 0.06 − − − Other garbage codes 45.36 3.93 − − − Note. #Diseases of three systems, cardiovascular diseases, chronic respiratory diseases and malignant neoplasms, are further divided into detailed diseases; — means no data.
下载: 导出CSV
S2. Changes in death counts and ranks of the target diseases
Weifang Xuanwei original after heart failure correction further after heart failure redistribution rank among percentage of increase in death count (%, comparing to the count after correction) original after heart failure correction further after heart failure redistribution rank among percentage of increase in death count (%, comparing to the count after correction) all target diseases * all target diseases * coarsened exact matching linear regression coarsened exact matching linear regression coarsened exact matching linear regression coarsened exact matching linear regression Ischemic heart disease (IHD) 113147 113273 113795.90 114325.42 1 0.46 0.93 3609 3612 3654.97 3612.00 5 1.19 0.00 Hypertensive heart disease (HHD) 7533 7567 7815.82 7568.33 6 3.29 0.02 220 223 240.36 223.00 14 7.79 0.00 Rheumatic heart disease (RHD) 1472 1474 1510.13 1474.58 12 2.45 0.04 391 392 400.45 392.00 10 2.16 0.00 Stroke 93671 93674 93705.84 93674.00 2 0.03 0.00 5527 5527 5527.25 5527.00 3 0.01 0.00 Cardiovascular diseases except for IHD, HHD, RHD and Stroke (CD) 1040 1042 1058.87 1054.64 14 1.62 1.21 131 131 133.23 131.00 16 1.70 0.00 Chronic obstructive pulmonary disease (COPD) 45219 45229 45332.60 45229.00 4 0.23 0.00 10165 10174 10202.02 10339.00 1 0.28 1.62 Chronic respiratory diseases except for COPD 1101 1102 1104.14 1102.00 13 0.19 0.00 264 264 264.25 264.00 12 0.10 0.00 Tracheal, bronchus, and lung cancer (TBLC) 41966 41969 41985.68 41969.00 5 0.04 0.00 8114 8114 8116.30 8114.00 2 0.03 0.00 Malignant neoplasms except for TBLC 77195 77200 77252.12 77200.00 3 0.07 0.00 4146 4152 4155.17 4152.00 4 0.08 0.00 Diabetes mellitus and Chronic kidney disease (DMCKD) 6370 6374 6406.53 6374.67 7 0.51 0.01 985 985 1025.45 985.00 8 4.11 0.00 Digestive diseases 5083 5084 5091.68 5084.00 8 0.15 0.00 1825 1826 1828.90 1826.00 7 0.16 0.00 Other non-communicable diseases 2324 2326 2332.94 2326.00 11 0.30 0.00 473 474 478.57 474.00 9 0.96 0.00 Neurological disorders 3054 3055 3059.51 3055.00 10 0.15 0.00 314 314 314.50 314.00 11 0.16 0.00 Mental disorders and Substance use disorders 513 513 516.00 513.00 15 0.59 0.00 250 250 250.00 250.00 13 0.00 0.00 Musculoskeletal disorders 433 433 434.79 433.00 17 0.41 0.00 144 144 144.00 144.00 15 0.00 0.00 Other neoplasms 464 464 464.13 464.00 16 0.03 0.00 22 22 22.00 22.00 17 0.00 0.00 Communicable, maternal, neonatal, and nutritional diseases 3525 3526 3531.33 3526.00 9 0.15 0.00 2062 2063 2068.58 2063.00 6 0.27 0.00 Note. * The ranks always kept the same.
下载: 导出CSV
S3. The redistribution of heart failure by linear regression
Subgroups Weifang Xuanwei Count of heart failure in each subgroup Remaining heart failure in each subgroup after redistribution The count of heart failure redistributed to each target disease in each subgroup Count of heart failure in each subgroup Remaining heart failure in each subgroup after redistribution The count of heart failure redistributed to each target disease in each subgroup gender (1=male, 2=female) age group Rheumatic heart disease Hypertensive heart disease Chronic kidney disease Ischemic heart disease Cardiomyopathy and myocarditis Other Disease* Chronic obstructive pulmonary disease 1 0-14 2 2 2 2 1 15-44 12 12 2 2 1 45-64 58 0.00 0.00 0.00 0.00 12.64 45.36 8 8.00 1 65- 474 0.00 0.00 0.00 474.00 0.00 0.00 83 83.00 2 0-14 0 2 2 2 15-44 2 0.00 1.33 0.67 0.00 0.00 0.00 3 3 2 45-64 27 27 10 10.00 2 65- 579 0.00 0.00 0.00 578.42 0.00 0.00 64 64.00 0.58 0.00 0.00 0.00 0.00 0.00 Total 1154 41 0.58 1.33 0.67 1052.42 12.64 45.36 174 9 165.00 Note. *Other disease means the category 4 of garbage codes: unspecified causes within a larger cause grouping.
下载: 导出CSV
S4. The percentages of heart failure and the 12 TGs in each year in Weifang
Sex Age group Year 2010 2011 2012 2013 2014 2015 2016 2017 Male 45–64 Heart failure 0.27% 0.58% 1.04% 0.57% 0.11% 0.16% 0.39% 0.05% TG No.12 0.07% 0.06% 0.00% 0.05% 0.00% 0.00% 0.00% 0.05% TG No.11 0.07% 0.12% 0.11% 0.05% 0.27% 0.05% 0.10% 0.24% TG No.10 0.27% 0.18% 0.05% 0.15% 0.16% 0.16% 0.10% 0.05% TG No.9 0.07% 0.06% 0.16% 0.10% 0.21% 0.05% 0.25% 0.00% TG No.8 0.13% 0.12% 0.22% 0.00% 0.16% 0.00% 0.15% 0.15% TG No.7 75.69% 75.35% 78.50% 80.09% 81.31% 80.56% 79.60% 81.57% TG No.6 8.04% 4.56% 3.84% 1.91% 1.49% 1.75% 3.10% 3.15% TG No.5 0.20% 0.18% 0.27% 0.41% 0.05% 0.27% 0.30% 0.15% TG No.4 0.13% 0.23% 0.27% 0.05% 0.00% 0.11% 0.05% 0.19% TG No.3 0.67% 0.35% 0.22% 0.67% 0.59% 0.49% 0.59% 0.63% TG No.2 14.13% 17.76% 14.65% 15.63% 14.75% 15.94% 14.79% 13.14% TG No.1 0.27% 0.47% 0.66% 0.31% 0.91% 0.44% 0.59% 0.63% Male 65– Heart failure 1.58% 1.20% 1.73% 0.32% 0.35% 0.44% 0.46% 0.20% TG No.12 0.01% 0.00% 0.00% 0.00% 0.00% 0.00% 0.00% 0.01% TG No.11 0.01% 0.03% 0.03% 0.03% 0.01% 0.05% 0.06% 0.08% TG No.10 0.12% 0.18% 0.13% 0.16% 0.05% 0.03% 0.05% 0.07% TG No.9 0.03% 0.03% 0.07% 0.01% 0.00% 0.05% 0.09% 0.05% TG No.8 0.12% 0.04% 0.04% 0.03% 0.02% 0.07% 0.04% 0.05% TG No.7 61.21% 64.11% 64.14% 66.84% 67.65% 69.36% 66.70% 68.72% TG No.6 10.47% 7.83% 4.59% 3.53% 4.01% 2.96% 5.02% 5.82% TG No.5 0.03% 0.03% 0.01% 0.01% 0.01% 0.01% 0.00% 0.02% TG No.4 0.06% 0.06% 0.08% 0.11% 0.01% 0.06% 0.05% 0.15% TG No.3 0.12% 0.18% 0.00% 0.05% 0.04% 0.06% 0.07% 0.03% TG No.2 26.16% 26.20% 28.98% 28.71% 27.73% 26.74% 27.31% 24.58% TG No.1 0.07% 0.12% 0.19% 0.20% 0.12% 0.18% 0.14% 0.22% Female 15–44 Heart failure 0.00% 0.00% 0.00% 0.00% 0.93% 1.16% 0.00% 0.00% TG No.12 0.00% 0.00% 1.11% 0.00% 0.93% 0.00% 0.97% 0.00% TG No.11 0.77% 0.00% 1.11% 0.00% 1.85% 0.00% 0.97% 2.94% TG No.10 2.31% 0.76% 2.22% 1.80% 0.93% 1.16% 0.00% 0.00% TG No.9 0.00% 0.00% 0.00% 0.00% 0.00% 0.00% 0.00% 0.00% TG No.8 0.00% 0.00% 0.00% 0.00% 0.00% 0.00% 0.00% 0.00% TG No.7 68.46% 71.76% 60.00% 73.87% 71.30% 75.58% 74.76% 74.51% TG No.6 8.46% 4.58% 2.22% 3.60% 0.93% 0.00% 3.88% 4.90% TG No.5 8.46% 8.40% 21.11% 8.11% 9.26% 11.63% 8.74% 6.86% TG No.4 0.77% 1.53% 2.22% 0.90% 0.00% 0.00% 0.00% 2.94% TG No.3 0.77% 1.53% 1.11% 1.80% 2.78% 1.16% 1.94% 1.96% TG No.2 10.00% 10.69% 7.78% 9.01% 10.19% 6.98% 7.77% 5.88% TG No.1 0.00% 0.76% 1.11% 0.90% 0.93% 2.33% 0.97% 0.00% Female 65– Heart failure 1.63% 1.22% 1.72% 0.41% 0.40% 0.54% 0.57% 0.26% TG No.12 0.04% 0.00% 0.00% 0.01% 0.00% 0.02% 0.03% 0.01% TG No.11 0.03% 0.04% 0.01% 0.06% 0.05% 0.09% 0.04% 0.05% TG No.10 0.18% 0.16% 0.11% 0.10% 0.12% 0.05% 0.04% 0.00% TG No.9 0.00% 0.03% 0.02% 0.02% 0.02% 0.01% 0.03% 0.05% TG No.8 0.00% 0.00% 0.01% 0.01% 0.00% 0.00% 0.00% 0.00% TG No.7 62.88% 66.09% 65.58% 69.73% 71.08% 70.98% 69.82% 72.38% TG No.6 10.39% 8.26% 6.09% 4.12% 4.21% 4.07% 4.96% 6.50% TG No.5 0.01% 0.04% 0.01% 0.03% 0.00% 0.01% 0.00% 0.00% TG No.4 0.11% 0.08% 0.05% 0.10% 0.05% 0.06% 0.03% 0.06% TG No.3 0.18% 0.11% 0.02% 0.02% 0.03% 0.03% 0.06% 0.03% TG No.2 24.52% 23.94% 26.28% 25.34% 23.97% 24.10% 24.40% 20.55% TG No.1 0.03% 0.04% 0.08% 0.04% 0.05% 0.04% 0.04% 0.10% Note. TG: target group. TG No.1: Aortic aneurysm, TG No.2: Chronic obstructive pulmonary disease (COPD), TG No.3: Cardiomyopathy, TG No.4: Chronic severe anemia, TG No.5: Congenital heart anomalies, TG No.6: Hypertensive heart disease, TG No.7: Ischemic heart disease, TG No.8: Other respiratory diseases, TG No.9: Other valve diseases, TG No.10: Pericarditis, endocarditis, myocarditis, TG No.11: Rheumatic heart disease, TG No.12: Thyroid disorders.
下载: 导出CSV
S5. The mortalities and ranks of all the causes originally after redistribution of heart failure by two approaches
Weifang Xuanwei Cause of death Original rate Rate after correction Rate after correction and redistribution by coarsened exact matching Rate after correction and redistribution by linear regression Original rank Rank after correction Rank after correction and redistribution by coarsened exact matching Rank after correction and redistribution by linear regression Original rate Rate after correction Rate after correction and redistribution by coarsened exact matching Rate after correction and redistribution by linear regression Original rank Rank after correction Rank after correction and redistribution by coarsened exact matching Rank after correction and redistribution by linear regression (/100,000) (/100,000) (/100,000) (/100,000) (/100,000) (/100,000) (/100,000) (/100,000) HIV/AIDS 0.03 0.03 0.03 0.03 98 100 102 100 0.94 0.94 0.94 0.94 45 44 45 44 Sexually transmitted diseases excluding HIV 0.01 0.01 0.01 0.01 107 109 111 109 0.04 0.04 0.04 0.04 85 84 87 84 Tuberculosis 0.41 0.41 0.41 0.41 57 57 58 57 1.20 1.20 1.20 1.20 40 39 41 39 Lower respiratory infections 0.95 0.95 0.95 0.95 39 39 39 39 7.24 7.24 7.25 7.24 13 13 13 13 Upper respiratory infections 0.04 0.04 0.04 0.04 95 97 99 97 0.18 0.18 0.18 0.18 76 75 77 75 Diarrheal diseases 0.07 0.07 0.07 0.07 89 90 92 90 0.72 0.72 0.72 0.72 52 51 52 51 Invasive Non-typhoidal Salmonella (iNTS) 0.02 0.02 0.02 0.02 102 104 106 104 0.03 0.03 0.03 0.03 86 85 88 85 Malaria 0.00 0.00 0.00 0.00 110 112 114 112 0.03 0.03 0.03 0.03 86 85 88 85 Leprosy 0.01 0.01 0.01 0.01 108 110 112 110 0.08 0.08 0.08 0.08 82 81 83 81 Chagas disease 0.00 0.00 0.00 0.00 110 112 114 112 0.00 0.00 0.00 0.00 89 88 91 88 Cysticercosis 0.00 0.00 0.00 0.00 110 112 114 112 0.00 0.00 0.00 0.00 89 88 91 88 Dengue 0.00 0.00 0.00 0.00 111 113 115 113 0.02 0.02 0.02 0.02 87 86 89 86 Rabies 0.04 0.04 0.04 0.04 95 97 99 97 0.09 0.09 0.09 0.09 81 80 82 80 Other neglected tropical diseases 0.06 0.06 0.06 0.06 91 92 94 92 0.00 0.00 0.00 0.00 89 88 91 88 Meningitis 0.19 0.19 0.19 0.19 74 74 76 74 0.63 0.63 0.63 0.63 57 56 57 56 Encephalitis 0.18 0.18 0.18 0.18 76 76 78 76 0.11 0.11 0.11 0.11 80 79 81 79 Tetanus 0.02 0.02 0.02 0.02 100 102 104 102 0.03 0.03 0.03 0.03 86 85 88 85 Measles 0.00 0.00 0.00 0.00 110 112 114 112 0.01 0.01 0.01 0.01 88 87 90 87 Varicella and herpes zoster 0.01 0.01 0.01 0.01 106 108 110 108 0.09 0.09 0.09 0.09 81 80 82 80 Acute hepatitis 0.17 0.17 0.17 0.17 77 77 79 77 0.49 0.49 0.49 0.49 61 60 61 60 Other unspecified infectious diseases 0.05 0.05 0.05 0.05 92 93 95 93 0.26 0.26 0.26 0.26 70 69 70 69 Maternal disorders 0.08 0.08 0.08 0.08 85 85 88 85 0.40 0.40 0.40 0.40 66 65 66 65 Neonatal disorders 2.09 2.09 2.09 2.09 27 27 27 27 5.70 5.70 5.73 5.70 14 14 14 14 Protein-energy malnutrition 0.12 0.12 0.12 0.12 82 82 84 82 0.56 0.56 0.56 0.56 59 58 59 58 Iron-deficiency anemia 0.00 0.00 0.00 0.00 109 111 113 111 0.01 0.01 0.01 0.01 88 87 90 87 Other nutritional deficiencies 0.22 0.22 0.22 0.22 71 71 72 71 0.64 0.64 0.66 0.64 56 55 56 55 Lip and oral cavity cancer 0.35 0.35 0.35 0.35 63 63 64 63 0.26 0.26 0.26 0.26 70 69 70 69 Nasopharynx cancer 0.60 0.60 0.61 0.60 47 47 48 47 0.60 0.60 0.60 0.60 58 57 58 57 Other pharynx cancer 0.21 0.21 0.21 0.21 72 72 73 72 0.09 0.09 0.09 0.09 81 80 82 80 Esophageal cancer 10.07 10.07 10.09 10.07 12 12 12 12 2.72 2.72 2.72 2.72 27 26 27 26 Stomach cancer 28.00 28.01 28.03 28.01 6 6 5 5 3.09 3.09 3.09 3.09 24 23 24 23 Colon and rectum cancer 7.83 7.83 7.83 7.83 14 14 14 14 3.81 3.81 3.81 3.81 20 20 21 20 Liver cancer 25.32 25.32 25.33 25.32 7 7 7 7 12.43 12.43 12.43 12.43 9 9 9 9 Gallbladder and biliary tract cancer 1.97 1.97 1.97 1.97 31 31 31 31 0.66 0.68 0.71 0.68 54 53 53 53 Pancreatic cancer 4.28 4.28 4.28 4.28 17 17 17 17 1.25 1.25 1.25 1.25 38 37 38 37 Larynx cancer 0.92 0.92 0.92 0.92 41 41 41 41 0.75 0.75 0.75 0.75 50 49 50 49 Tracheal, bronchus, and lung cancer 56.77 56.77 56.79 56.77 4 4 4 4 76.64 76.64 76.66 76.64 2 2 2 2 Malignant skin melanoma 0.13 0.13 0.13 0.13 81 81 83 81 0.05 0.05 0.05 0.05 84 83 86 83 Non-melanoma skin cancer 0.38 0.38 0.38 0.38 61 61 62 61 0.41 0.41 0.41 0.41 65 64 65 64 Breast cancer 3.71 3.71 3.71 3.71 20 20 21 20 1.30 1.30 1.30 1.30 36 35 36 35 Cervical cancer 1.21 1.21 1.21 1.21 36 36 36 36 0.93 0.93 0.93 0.93 46 45 46 45 Uterine cancer 0.57 0.57 0.57 0.57 49 49 50 49 0.13 0.13 0.13 0.13 78 77 79 77 Ovarian cancer 1.06 1.06 1.06 1.06 37 37 37 37 0.19 0.19 0.19 0.19 75 74 76 74 Prostate cancer 1.05 1.05 1.05 1.05 38 38 38 38 0.63 0.63 0.63 0.63 57 56 57 56 Testicular cancer 0.03 0.03 0.03 0.03 99 101 103 101 0.03 0.03 0.03 0.03 86 85 88 85 Kidney cancer 0.93 0.93 0.93 0.93 40 40 40 40 0.19 0.19 0.19 0.19 75 74 76 74 Bladder cancer 1.86 1.86 1.86 1.86 32 32 32 32 1.04 1.04 1.04 1.04 43 42 43 42 Brain and nervous system cancer 3.86 3.86 3.86 3.86 19 19 19 19 2.94 2.94 2.94 2.94 26 25 26 25 Thyroid cancer 0.29 0.29 0.29 0.29 65 65 66 65 0.19 0.19 0.19 0.19 75 74 76 74 Mesothelioma 0.05 0.05 0.05 0.05 93 94 96 94 0.03 0.03 0.03 0.03 86 85 88 85 Hodgkin lymphoma 0.24 0.24 0.24 0.24 70 70 71 70 0.04 0.04 0.04 0.04 85 84 87 84 Non-Hodgkin lymphoma 2.01 2.01 2.01 2.01 28 28 29 28 1.03 1.03 1.03 1.03 44 43 44 43 Multiple myeloma 0.52 0.52 0.52 0.52 51 51 52 51 0.23 0.23 0.23 0.23 72 71 72 71 Leukemia 3.93 3.93 3.93 3.93 18 18 18 18 2.54 2.56 2.56 2.56 28 27 28 27 Other malignant cancers 3.05 3.05 3.05 3.05 24 24 24 24 1.62 1.64 1.64 1.64 32 31 32 31 Other neoplasms 0.63 0.63 0.63 0.63 46 46 47 46 0.21 0.21 0.21 0.21 73 72 74 72 Rheumatic heart disease 1.99 1.99 2.04 1.99 30 30 28 30 3.69 3.70 3.78 3.70 22 21 22 21 Ischemic heart disease 153.05 153.22 153.93 154.65 1 1 1 1 34.09 34.12 34.52 34.12 5 5 5 5 Stroke 126.71 126.71 126.75 126.71 2 2 2 2 52.20 52.20 52.21 52.20 3 3 3 3 Hypertensive heart disease 10.19 10.24 10.57 10.24 11 11 10 11 2.08 2.11 2.27 2.11 31 30 29 30 Non-rheumatic valvular heart disease 0.10 0.10 0.11 0.10 84 84 86 84 0.03 0.03 0.03 0.03 86 85 88 85 Cardiomyopathy and myocarditis 0.48 0.48 0.49 0.50 54 54 54 52 0.77 0.77 0.78 0.77 48 47 48 47 Atrial fibrillation and flutter 0.04 0.04 0.04 0.04 95 96 98 96 0.01 0.01 0.01 0.01 88 87 90 87 Aortic aneurysm 0.41 0.41 0.41 0.41 56 56 57 56 0.12 0.12 0.12 0.12 79 78 80 78 Peripheral artery disease 0.08 0.08 0.08 0.08 86 86 87 86 0.03 0.03 0.03 0.03 86 85 88 85 Endocarditis 0.04 0.04 0.04 0.04 94 95 97 95 0.07 0.07 0.07 0.07 83 82 84 82 Other cardiovascular and circulatory diseases 0.26 0.26 0.26 0.26 68 68 69 68 0.21 0.21 0.22 0.21 73 72 73 72 Chronic obstructive pulmonary disease 61.17 61.18 61.32 61.18 3 3 3 3 96.01 96.10 96.36 97.66 1 1 1 1 Pneumoconiosis 0.06 0.06 0.06 0.06 90 91 93 91 0.46 0.46 0.46 0.46 62 61 63 61 Asthma 0.68 0.68 0.68 0.68 43 43 43 43 1.62 1.62 1.62 1.62 33 32 33 32 Interstitial lung disease and pulmonary sarcoidosis 0.67 0.67 0.67 0.67 44 44 45 44 0.05 0.05 0.05 0.05 84 83 86 83 Other chronic respiratory diseases 0.07 0.07 0.07 0.07 88 88 90 88 0.37 0.37 0.37 0.37 68 67 68 67 Cirrhosis and other chronic liver diseases 3.23 3.23 3.23 3.23 22 22 22 22 4.88 4.88 4.88 4.88 17 17 17 17 Upper digestive system diseases 1.85 1.85 1.85 1.85 33 33 33 33 8.78 8.78 8.79 8.78 12 12 12 12 Appendicitis 0.03 0.03 0.03 0.03 97 99 101 99 0.25 0.25 0.25 0.25 71 70 71 70 Paralytic ileus and intestinal obstruction 0.49 0.49 0.49 0.49 52 52 53 53 1.28 1.29 1.30 1.29 37 36 37 36 Inguinal, femoral, and abdominal hernia 0.02 0.02 0.02 0.02 100 102 104 102 0.01 0.01 0.01 0.01 88 87 90 87 Inflammatory bowel disease 0.08 0.08 0.08 0.08 87 87 89 87 0.45 0.45 0.47 0.45 63 62 62 62 Vascular intestinal disorders 0.02 0.02 0.02 0.02 101 103 105 103 0.00 0.00 0.00 0.00 89 88 91 88 Gallbladder and biliary diseases 0.67 0.67 0.67 0.67 45 45 44 45 0.63 0.63 0.63 0.63 57 56 57 56 Pancreatitis 0.38 0.38 0.38 0.38 62 62 63 62 0.42 0.42 0.42 0.42 64 63 64 63 Other digestive diseases 0.11 0.11 0.12 0.11 83 83 85 83 0.53 0.53 0.53 0.53 60 59 60 59 Alzheimer disease and other dementias 2.77 2.77 2.78 2.77 25 25 25 25 1.40 1.40 1.40 1.40 35 34 35 34 Parkinson disease 0.28 0.28 0.28 0.28 66 66 67 66 0.07 0.07 0.07 0.07 83 82 85 82 Epilepsy 0.58 0.58 0.58 0.58 48 48 49 48 1.17 1.17 1.17 1.17 42 41 42 41 Multiple sclerosis 0.01 0.01 0.01 0.01 107 109 111 109 0.00 0.00 0.00 0.00 89 88 91 88 Motor neuron disease 0.18 0.18 0.18 0.18 75 75 77 75 0.07 0.07 0.07 0.07 83 82 85 82 Other neurological disorders 0.32 0.32 0.32 0.32 64 64 65 64 0.26 0.26 0.26 0.26 69 68 69 68 Eating disorders 0.24 0.24 0.24 0.24 69 69 70 69 0.00 0.00 0.00 0.00 89 88 91 88 Alcohol use disorders 0.43 0.43 0.43 0.43 55 55 56 55 2.19 2.19 2.19 2.19 30 29 31 29 Drug use disorders 0.03 0.03 0.03 0.03 99 101 103 101 0.17 0.17 0.17 0.17 77 76 78 76 Diabetes mellitus 3.70 3.70 3.72 3.70 21 21 20 21 3.70 3.70 3.85 3.70 21 21 20 21 Chronic kidney disease 4.71 4.72 4.74 4.72 16 16 16 16 4.90 4.90 5.13 4.90 16 16 16 16 Acute glomerulonephritis 0.20 0.20 0.20 0.20 73 73 74 73 0.70 0.70 0.70 0.70 53 52 54 52 Bacterial skin diseases 0.02 0.02 0.02 0.02 103 105 107 105 0.11 0.11 0.11 0.11 80 79 81 79 Decubitus ulcer 0.14 0.14 0.14 0.14 80 80 82 80 0.77 0.77 0.77 0.77 49 48 49 48 Other skin and subcutaneous diseases 0.02 0.02 0.02 0.02 104 106 108 106 0.01 0.01 0.01 0.01 88 87 90 87 Rheumatoid arthritis 0.19 0.19 0.19 0.19 74 74 75 74 0.83 0.83 0.83 0.83 47 46 47 46 Other musculoskeletal disorders 0.39 0.39 0.40 0.39 58 58 59 58 0.53 0.53 0.53 0.53 60 59 60 59 Congenital birth defects 1.80 1.80 1.81 1.80 34 34 34 34 2.20 2.21 2.22 2.21 29 28 30 28 Urinary diseases and male infertility 0.27 0.27 0.27 0.27 67 67 68 67 1.19 1.19 1.20 1.19 41 40 40 40 Gynecological diseases 0.03 0.03 0.03 0.03 99 101 103 101 0.05 0.05 0.05 0.05 84 83 86 83 Hemoglobinopathies and hemolytic anemias 0.63 0.63 0.63 0.63 46 46 46 46 0.38 0.38 0.38 0.38 67 66 67 66 Endocrine, metabolic, blood, and immune disorders 0.38 0.38 0.38 0.38 60 60 61 60 0.65 0.65 0.67 0.65 55 54 55 54 Sudden infant death syndrome 0.03 0.03 0.03 0.03 96 98 100 98 0.00 0.00 0.00 0.00 89 88 91 88 Road injuries 21.00 21.00 21.00 21.00 8 8 8 8 10.67 10.67 10.67 10.67 10 10 10 10 Other transport injuries 0.38 0.38 0.38 0.38 61 61 62 61 0.60 0.60 0.60 0.60 58 57 58 57 Falls 3.11 3.11 3.11 3.11 23 23 23 23 18.32 18.32 18.32 18.32 8 8 8 8 Drowning 2.14 2.14 2.14 2.14 26 26 26 26 4.37 4.37 4.37 4.37 18 19 19 19 Fire, heat, and hot substances 0.54 0.55 0.55 0.55 50 50 51 50 0.74 0.74 0.74 0.74 51 50 51 50 Poisonings 2.00 2.00 2.00 2.00 29 29 30 29 3.05 3.05 3.05 3.05 25 24 25 24 Exposure to mechanical forces 1.22 1.22 1.22 1.22 35 35 35 35 5.60 5.62 5.62 5.62 15 15 15 15 Adverse effects of medical treatment 0.07 0.07 0.07 0.07 89 89 91 89 0.40 0.40 0.40 0.40 66 65 66 65 Animal contact 0.02 0.02 0.02 0.02 104 106 108 106 0.83 0.83 0.83 0.83 47 46 47 46 Foreign body 0.48 0.48 0.48 0.48 53 53 55 54 1.23 1.23 1.23 1.23 39 38 39 38 Environmental heat and cold exposure 0.17 0.17 0.17 0.17 79 79 81 79 0.13 0.13 0.13 0.13 78 77 79 77 Exposure to forces of nature 0.02 0.02 0.02 0.02 100 102 104 102 0.20 0.20 0.20 0.20 74 73 75 73 Other unintentional injuries 0.79 0.79 0.79 0.79 42 42 42 42 3.63 3.64 3.64 3.64 23 22 23 22 Self-harm 6.19 6.19 6.19 6.19 15 15 15 15 9.48 9.49 9.49 9.49 11 11 11 11 Interpersonal violence 0.39 0.39 0.39 0.39 59 59 60 59 1.61 1.61 1.61 1.61 34 33 34 33 Executions and police conflict 0.01 0.01 0.01 0.01 105 107 109 107 0.04 0.04 0.04 0.04 85 84 87 84 GC category 1 (including heart failure) 29.73 29.23 27.75 27.72 5 5 6 6 40.53 40.17 38.67 38.61 4 4 4 4 GC category 2 10.42 10.44 10.44 10.44 10 10 11 10 24.61 24.66 24.66 24.66 7 7 7 7 GC category 3 8.97 8.99 8.99 8.99 13 13 13 13 4.36 4.38 4.38 4.38 19 18 18 18 GC category 4 10.78 10.96 10.96 11.02 9 9 9 9 28.24 28.26 28.26 28.26 6 6 6 6 Still birth or Missing 0.17 0.17 0.17 0.17 78 78 80 78 0.03 0.03 0.03 0.03 86 85 88 85 Note. HIV: Human Immunodeficiency Virus; AIDS: Acquired Immune Deficiency Syndrome; GC: Garbage Code.
下载: 导出CSV
-
[1] World Health Organization. International statistical classification of diseases and related health problems (10th revision): volume 2 Instruction manual. 5th ed. World Health Organization. 2015, 592-600. [2] Murray CJL, Lopez AD. The global burden of disease: a comprehensive assessment of mortality and disability from diseases, injuries, and risk factors in 1990 and projected to 2020: summary. World Health Organization. 1996. [3] Naghavi M, Makela S, Foreman K, et al. Algorithms for enhancing public health utility of national causes-of-death data. Popul Health Metr, 2010; 8, 9. doi: 10.1186/1478-7954-8-9 [4] GBD 2019 Diseases and Injuries Collaborators. Global burden of 369 diseases and injuries in 204 countries and territories, 1990-2019: a systematic analysis for the Global Burden of Disease Study 2019. Lancet, 2020; 396, 1204−22. doi: 10.1016/S0140-6736(20)30925-9 [5] Ellingsen CL, Ebbing M, Alfsen GC, et al. Injury death certificates without specification of the circumstances leading to the fatal injury - the Norwegian Cause of Death Registry 2005-2014. Popul Health Metr, 2018; 16, 20. doi: 10.1186/s12963-018-0176-2 [6] Ng TC, Lo WC, Ku CC, et al. Improving the use of mortality data in public health: a comparison of garbage code redistribution models. Am J Public Health, 2020; 110, 222−9. [7] Stevens GA, King G, Shibuya K. Deaths from heart failure: using coarsened exact matching to correct cause-of-death statistics. Popul Health Metr, 2010; 8, 6. doi: 10.1186/1478-7954-8-6 [8] The National Center for Chronic and Noncommunicable Disease Control and Prevention in China Center for Disease Control and Prevention. Chinese cause-of-death surveillance dataset 2015. China Science and Technology Press. 2016. (In Chinese). [9] Liu LQ, Liu XY, Liu Y, et al. Building the standard operating procedure for improving health insurance data quality: quality evaluation and improvement on the reimbursement records data of new rural cooperative medical system of a county in Henan Province, 2013-2015. Dis Surveill, 2021; 36, 261−9. (In Chinese) [10] Ahern RM, Lozano R, Naghavi M, et al. Improving the public health utility of global cardiovascular mortality data: the rise of ischemic heart disease. Popul Health Metr, 2011; 9, 8. doi: 10.1186/1478-7954-9-8 -

 点击查看大图
计量
- 文章访问数: 7194
- HTML全文浏览量: 2871
- PDF下载量: 32
- 被引次数: 0

 Quick Links