

 下载:
下载:


-
Tuberculosis (TB) caused by Mycobacterium tuberculosis (MTB) remains one of the deadliest infectious diseases globally, affecting approximately one-third of the world’s population. In 2022, the World Health Organization reported 10.6 million new cases, leading to an estimated 1.3 million deaths[1]. A hallmark pathological feature of TB is the formation of tuberculous granulomas with distinct morphologies at different disease stages. Early-stage granulomas are small and nodular, but enlarge and become necrotic as TB progresses[2].
Granulomas play a dual role in the progression of TB: they encapsulate infected cells to limit the spread of MTB within tissues and create a hypoxic environment that drives MTB dormancy. This dormancy enhances the survival of MTB, facilitates immune evasion, and promotes long-term persistence, potentially leading to TB reactivation or dissemination when the host immune system weakens[3,4].
Foamy macrophages (FMs) are a unique subset of macrophages, widely distributed in tuberculous granulomas[5,6]. Increasing evidence indicates that FMs are critical contributors to granuloma formation[7-10]. Death of FMs correlates temporally and spatially with the progression of granulomas to necrosis, which promotes MTB dissemination and highlights their association with the progression of TB[11]. Moreover, FMs support the persistence of MTB by providing lipid droplets as an energy source, which are essential for intracellular survival[12]. In vitro studies have demonstrated that MTB disrupts lipid homeostasis and induces a foamy phenotype in macrophages by modulating host cell metabolism[13]. Additionally, changes in lipid droplet content further influence the intracellular survival of MTB, although the mechanisms underlying this effect remain unclear.
In this study, we used oleic acid (OA) to establish an in vitro FM model and investigated the impact of FMs on the survival of MTB. Integrated transcriptomic and metabolomic analyses identified the molecular mechanisms by which FMs restrict the intracellular survival of MTB. Our findings highlight OA-induced FM formation as a potential strategy for reducing the survival of MTB, offering insights into novel therapeutic targets and advancing the development of host-directed treatment strategies for TB.
-
THP-1 cells (TIB-202; ATCC) were cultured in RPMI-1640 medium (C11875500BT; Gibco) supplemented with 10% fetal bovine serum. Differentiation into adherent macrophage-like cells was achieved by overnight treatment with 10 ng/mL phorbol 12-myristate 13-acetate (PMA, HY-18739; MedChemExpress). After PMA treatment, the cells were washed once with phosphate buffered solution (PBS) and transferred to a fresh RPMI-1640 medium for further culture.
-
THP-1 macrophages, differentiated using PMA, were exposed to a solution containing 400 μM OA (03008; Sigma-Aldrich) with 10% bovine serum albumin (BSA) for 48 h[8]. Lipid droplet accumulation was assessed using a Cell Navigator Fluorometric Lipid Droplet Assay Kit (AAT-22730; AAT Bioquest). FMs were also treated with 20 μM A939572 (B3607; APExBIO) or 100 μM Orlistat (O4139; Sigma-Aldrich) to inhibit lipid synthesis.
-
Total RNA was extracted from cells using TRIzol reagent (Invitrogen), following the manufacturer’s instructions. cDNA synthesis was performed using PrimeScript™ RT Master Mix (TaKaRa Bio). RT-qPCR was performed on an ABI 7100 RT-PCR Instrument (Applied Biosystems, Singapore) using SYBR Green Supermix (Bio-Rad), according to the manufacturer’s instructions. The primer sequences were: glyceraldehyde 3-phosphate dehydrogenase (GAPDH; Forward: 5'-GAGTCAACGGATTTGGTCGT-3’; Reverse: 5'-TTGATTTTGGAGGGATCTCG-3’); RAC-gamma serine/threonine-protein kinase (AKT3; Forward: 5'-AATGGACAGAAGCTATCCAGGC-3,’ Reverse: 5'-TGATGGGTTGTAGAGGCATCC-3’); GLI family zinc finger 3 (GLI3; Forward: 5'-GAAGTGCTCCACTCGAACAGA-3,’ Reverse: 5'-GTGGCTGCATAGTGATTGCG-3’); ATPase plasma membrane Ca2+ transporting 2 (ATP2B2; Forward: 5'-GAGGGCAACGAAGGATGTG-3,’ Reverse: 5'-GCCCCGGAACTGTTTCTCT-3’); and adenosine A1 receptor (ADORA1; Forward: 5'-CCACAGACCTACTTCCACACC-3,’ Reverse: 5'-TACCGGAGAGGGATCTTGACC-3’).
-
MTB H37Rv (27294; ATCC) was cultured in Middlebrook 7H9 medium (271310; BD) supplemented with 10% OA-albumin-dextrose-catalase (OADC) and 0.05% Tween-80 (CS9029; G-CLONE), or on Middlebrook 7H10 agar (262710; BD) supplemented with 10% OADC.
-
Differentiated THP-1 cells were infected with MTB at a multiplicity of infection of 5. After 4 h of infection, the cells were washed three times with pre-warmed PBS and incubated in a fresh RPMI-1640 medium. For the viability assay based on CFU, macrophages were lysed in 7H9 broth containing 0.05% SDS. Lysates were plated on Middlebrook 7H10 agar at specified time points, and colonies were counted after 3–4 weeks.
-
Cells were seeded on glass coverslips, fixed with 4% paraformaldehyde for 15 min at 25 °C, and permeabilized with 0.1% Triton X-100 for 10 min. Lipid droplets were stained for 30 min using a Cell Navigator Fluorimetric Lipid Droplet Assay Kit (ATT Bioquest). Coverslips were mounted onto glass slides using a mounting medium containing 4',6-diamidino-2-phenylindole (DAPI). Confocal microscopy images were captured using a model SP8 confocal microscope (Leica Microsystems) and analyzed using IPWIN32 software.
-
Five experimental groups were analyzed: MTB-0 (before MTB infection in normal macrophages), MTB-24 (24 h after MTB infection in normal macrophages), OA-MTB-0 (before MTB infection in FMs), OA-MTB-24 (24 h after MTB infection in FMs), and BSA (control treated with 10% BSA). Each group included three biological replicates. Total RNA was extracted, and transcriptomic sequencing was performed by Genechem Company. using the NEBNext® Ultra™ RNA Library Prep Kit for Illumina® (NEB).
Sequencing libraries were prepared, PCR products were purified using the AMPure XP system (Beckman Coulter), and the library quality was assessed using the Bioanalyzer 2100 system (Agilent). Clustering was performed on a cBot Cluster Generation System using the TruSeq PE Cluster Kit v3-cBot-HS (Illumina). Sequencing was performed on an Illumina NovaSeq platform, generating 150-bp paired-end reads. Clean reads were aligned to the reference genome using Hisat2 v2.0.5. Gene expression levels were normalized to fragments per kilobase of transcript per million mapped reads (FPKM), accounting for gene length and read counts.
Differentially expressed genes (DEGs) were identified using DESeq2 (v1.16.1) with |log2FC| ≥ 1 and P < 0.05. The resulting P-values were adjusted for multiple comparisons using Benjamini and Hochberg to control for the false discovery rate. Gene Ontology (GO, https://geneontology.org/) and Kyoto Encyclopedia of Genes and Genomes (KEGG, (https://www.genome.jp/kegg/pathway.html) pathway enrichment analyses were performed using the ClusterProfiler R package. Data visualization, including volcano plots, heat maps, and Venn diagrams, were performed using an online platform (https://www.bioinformatics.com.cn).
-
The same five groups described above were used for the metabolomic analysis, with six biological replicates per group. Metabolites were extracted and ultra-high-performance liquid chromatography-tandem mass spectrometry analysis was performed by Shanghai Genechem Co., Ltd., as previously described[14,15] using a Vanquish UHPLC system (Thermo Fisher Scientific) coupled with an Orbitrap Q ExactiveTM HF-X mass spectrometer (Thermo Fisher Scientific). Raw data for each metabolite were processed with Compound Discoverer 3.1 (Thermo Fisher Scientific) for peak alignment, peak picking, and quantitation. The identified metabolites were annotated using the KEGG database.
Univariate analysis (t-test) was used to calculate statistical significance (P-value). Differential metabolites (DMs) were identified using Variable Importance in Projection (VIP) > 1, P < 0.05, and |log2FC| ≥ 1. Functional annotation of metabolites and pathway analyses were performed using the KEGG database.
-
Transcriptomic studies provide valuable insights into gene expression at the RNA level; however, they often yield many DEGs and intricate regulatory networks, making it challenging to identify key pathways. Conversely, metabolomic studies examine changes in metabolic products downstream of biological activities, providing a snapshot of phenotypic state changes. Metabolomics alone cannot uncover the genetic mechanisms underlying these phenotypic variations.
To address these limitations, we analyzed transcriptomic and metabolomic data integrated, leveraging DEGs to link gene expression with metabolic alterations and identify key molecular pathways and mechanisms. Pathways that were significantly enriched in both datasets were identified using KEGG pathway enrichment analysis based on Fisher's Exact Test (P < 0.05). These shared pathways, which represent the interactions between gene expression and metabolic activity, are visually represented using bar charts. This integrative approach highlights the key molecular pathways underlying the ability of FMs to restrict the intracellular survival of MTB cells and provides insights into potential therapeutic targets.
-
Immunofluorescence examination revealed a substantial accumulation of neutral lipid droplets in cells following OA treatment, confirming the successful formation of FMs (Figure 1A). Determination of CFU data demonstrated a significant reduction in intracellular MTB survival within FMs compared to that in normal macrophages (Figure 1B). Treatment with the lipid synthesis inhibitor, A939572, reduced lipid droplet accumulation in FMs (Figure 1C). The suppressive effect of FMs on MTB survival was mitigated by treatment with these inhibitors (Figure 1D). These findings suggest a potential correlation between lipid accumulation and intracellular MTB survival in FMs.
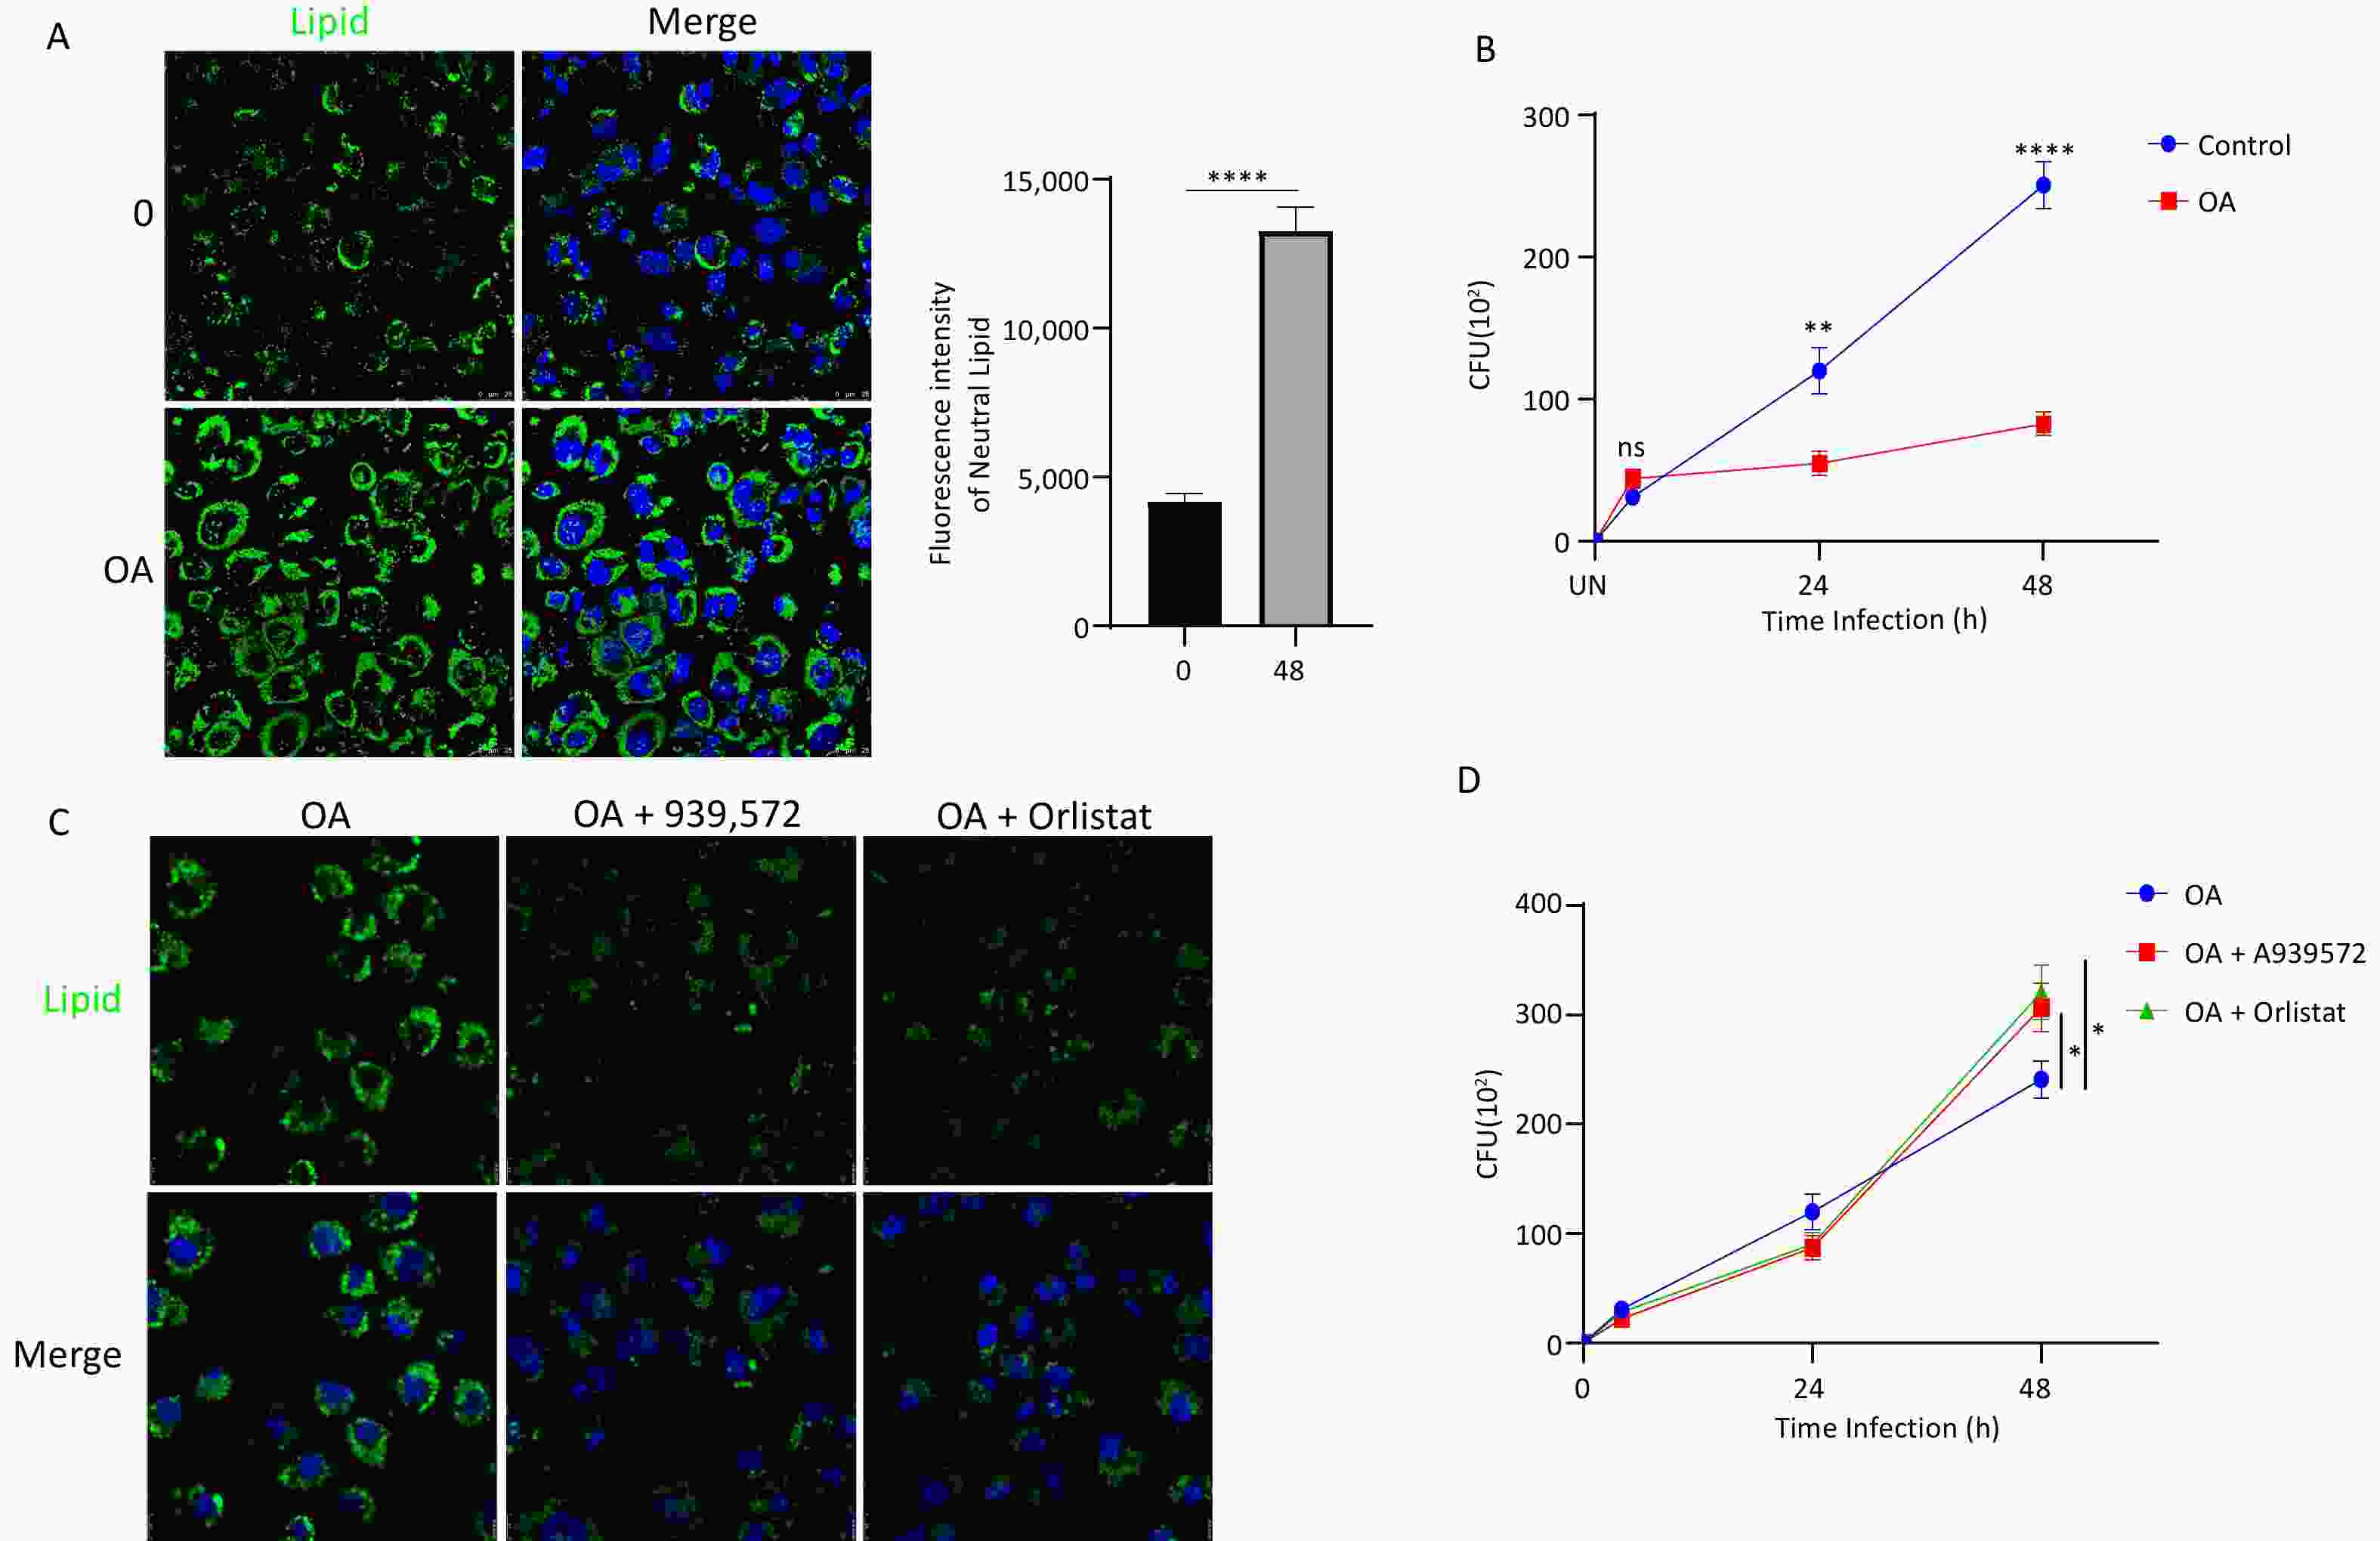
Figure 1. Lipid accumulation in foam macrophages (FMs) and influence on MTB survival. (A) Fluorescence microscopy visualization of neutral lipids in FMs and normal THP-1 cells. Nuclei are stained with DAPI (blue), and neutral lipids are stained with BODIPY (green). (B) MTB survival in FMs and normal THP-1 cells at 24 and 48 h post-infection. (C) Fluorescence microscopy visualization of neutral lipids in FMs treated with lipid synthesis inhibitors A939572 (10 μmol/L) or Orlistat (5 μmol/L). (D) Survival of MTB in FMs treated with A939572 (10 μmol/L) or Orlistat (5 μmol/L). Error bars represent mean ± standard deviation (SD) from three independent experiments. Statistical significance was determined using Student's t-test.
-
Transcriptomic analysis of 15 samples yielded 105.51 GB of valid data (Supplementary Table S1). Sample correlation analysis showed that the correlation coefficients among the three replicates in each group exceeded 0.97, indicating an exceptionally strong consistency (Supplementary Figure S1A). Principal component analysis (PCA) further validated this consistency, showing tight clustering of samples within the same group (Supplementary Figure S1B), underscoring the robustness of the experimental design and data quality.
Metabolomic analysis identified 1,008 metabolites across the five groups of 30 samples, with 738 metabolites detected in the positive-ion mode and 270 in the negative-ion mode. Partial least squares discriminant analysis (PLS-DA) revealed distinct clustering within each group, significant differences between the compared groups, and strong correlations within the groups (Supplementary Figure S2A, S2C, and S2E). Model validation confirmed the stability and reliability of the PLS-DA model, as indicated by the higher blue original points (R²) compared with the red predictability values (Q²).
-
Transcriptomic and metabolic analyses were performed to investigate the effects of in vitro OA treatment on macrophages (THP-1 cells). Transcriptomic data revealed significant changes in gene expression, with 1,060 upregulated and 2,979 downregulated genes observed following OA treatment (Figure 2A), highlighting the profound impact of OA on cellular processes. GO and KEGG enrichment analyses identified significantly altered pathways, including the acute inflammatory response (GO:0002526), positive regulation of the mitogen-activated protein kinase cascade (GO:0043410), and the Janus kinase/signal transducers and activators of transcription (JAK-STAT) signaling pathway (ko04630; Figure 2B and 2C).
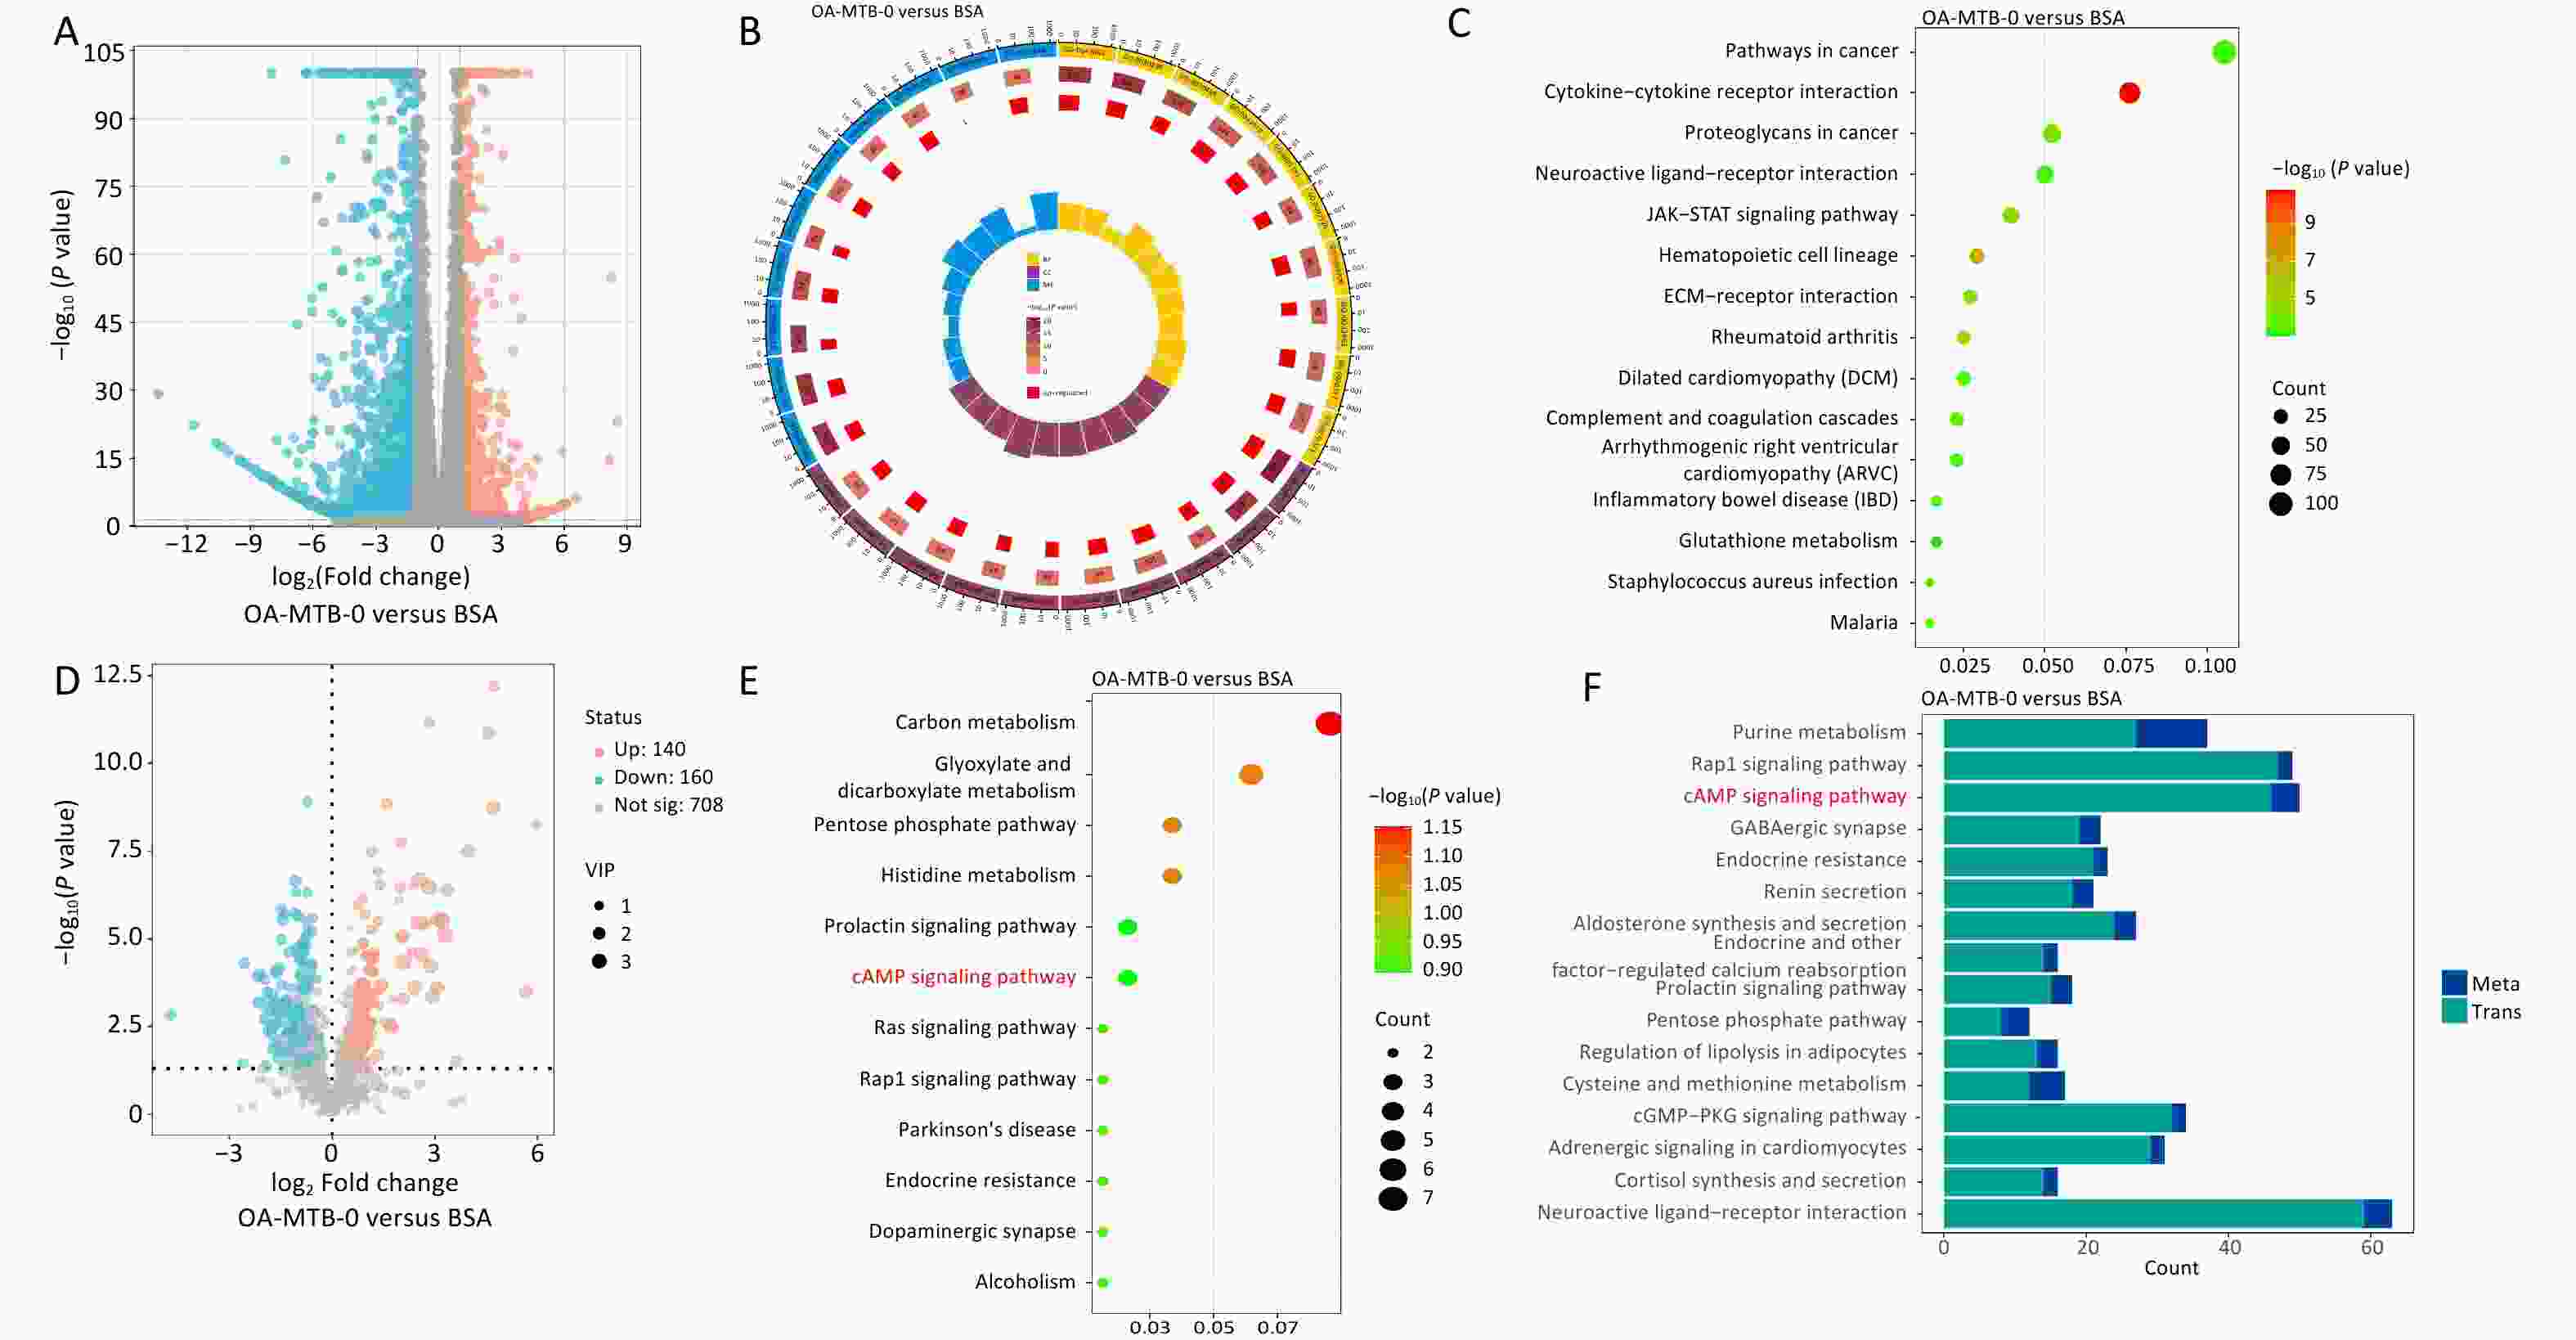
Figure 2. Transcriptomic and metabolomic changes in macrophages after OA treatment. (A) Volcano plot of differentially expressed genes (DEGs) in OA-treated macrophages compared to controls. (B) GO enrichment of DEGs. The top 10 terms from the biological process, cellular component, and molecular function categories are shown. (C) Top 15 KEGG pathways enriched among DEGs. (D) Volcano plot of differentially expressed metabolites (DMs) in OA-treated macrophages compared to controls. (E) KEGG enrichment analysis of DMs. (F) Shared KEGG enrichment pathways identified through integrated transcriptomic and metabolomic analyses.
Metabolomic analysis revealed 140 upregulated and 160 downregulated metabolites in the OA-MTB-0 group compared to those in the BSA group (Figure 2D). KEGG enrichment analysis identified key metabolic and signaling pathways that were influenced by OA treatment (Figure 2E). Shared pathways between the two omics analyses are shown in Figure 2F, with P-values ranging from smallest to largest. Notably, the top three enriched KEGG pathway terms were ‘purine metabolism’, ‘Rap1 signaling pathway,’ and ‘cAMP signaling pathway.’ These findings demonstrate that OA treatment markedly altered macrophage transcriptional and metabolic profiles, potentially affecting intracellular MTB survival in FMs.
-
In normal macrophages (MTB-24 vs. MTB-0), MTB infection was associated with 2,499 distinct DEGs, with 878 upregulated and 1,621 downregulated genes (Figures 3A and 3C). In FMs (OA-MTB-24 vs. OA-MTB-0), infection resulted in 1,071 downregulated and 362 upregulated genes (Figures 3A and 3D). Venn diagram analysis revealed that 577 genes were upregulated and 159 genes were downregulated exclusively in FMs during MTB infection. Additionally, 341 genes were upregulated in FMs, but downregulated in normal macrophages, whereas 531 genes exhibited the opposite pattern (Figure 3B). GO and KEGG enrichment analyses further highlighted distinct gene expression patterns between the two cell types (Figure 3E-H).
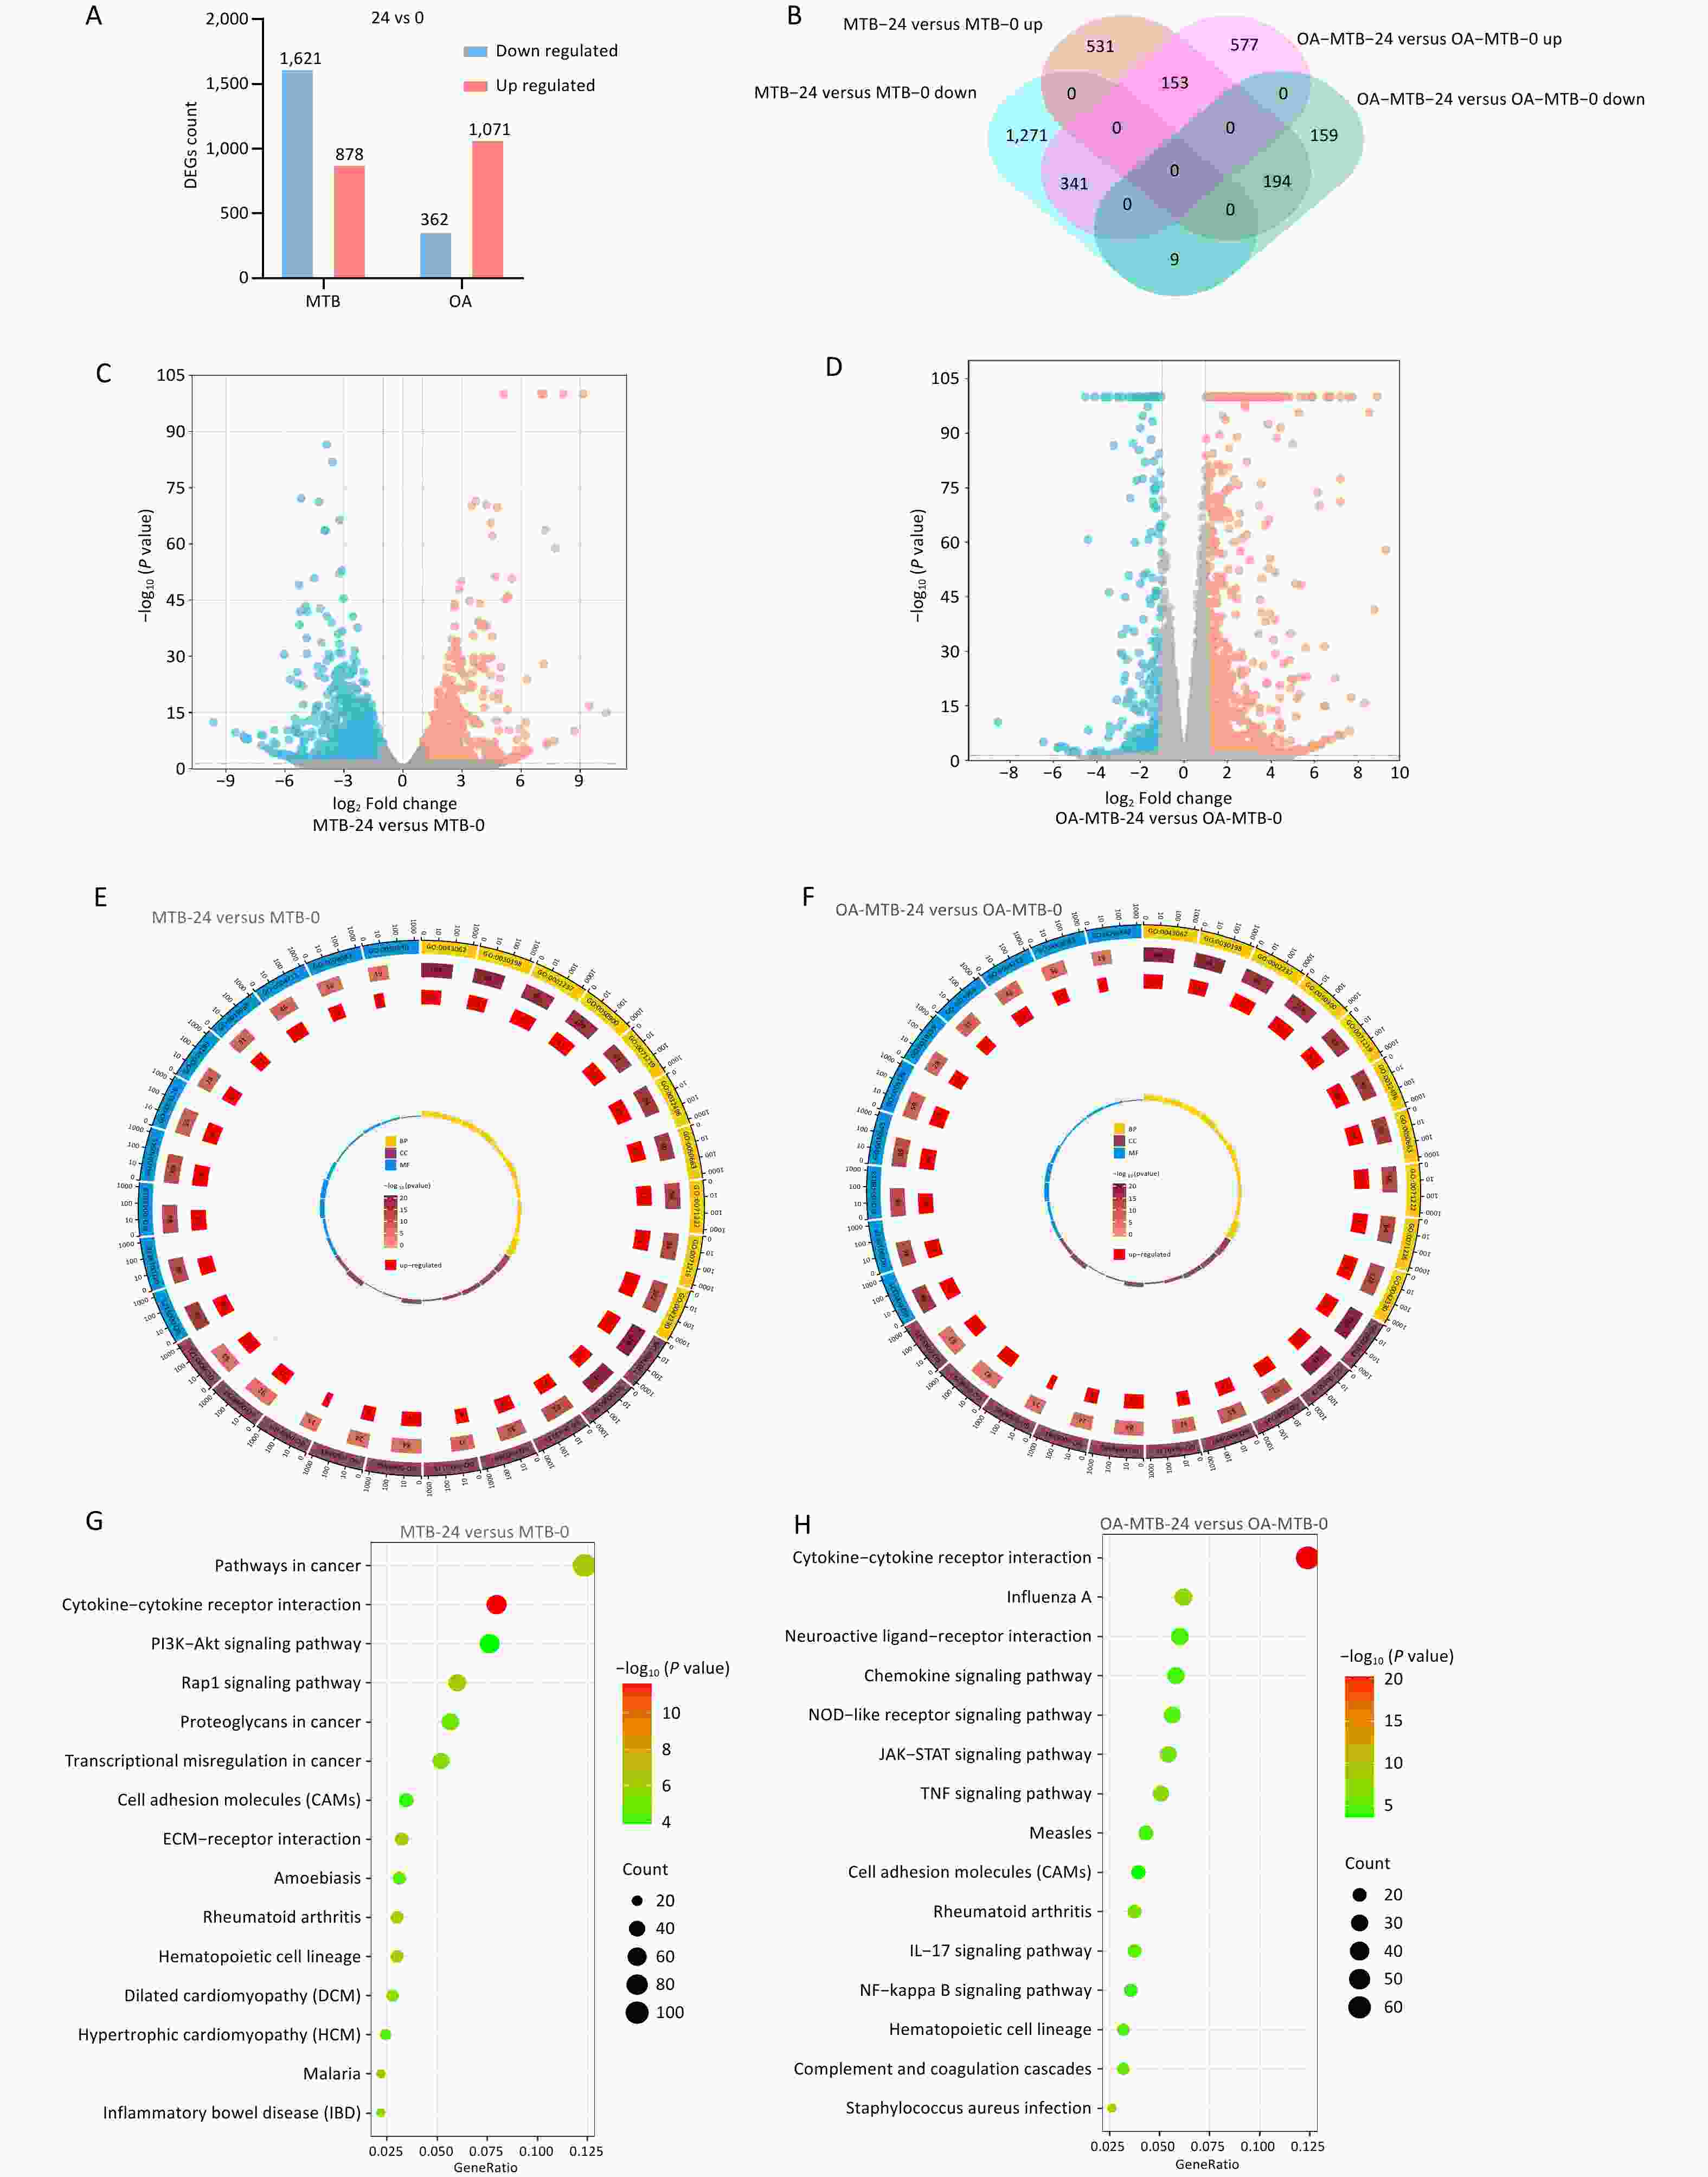
Figure 3. Transcriptomic comparison of the MTB infection process in normal and foam macrophages. (A) Bar plots showing the numbers of upregulated and downregulated genes in MTB-24 vs. MTB-0 and OA-MTB-24 vs. OA-MTB-0 groups. (B) Venn diagram depicting DEGs unique to or shared between MTB-24 vs. MTB-0 and OA-MTB-24 vs. OA-MTB-0 groups. (C-D) Volcano plots of DEGs in MTB-24 vs. MTB-0 (C) and OA-MTB-24 vs. OA-MTB-0 (D) groups (|log2FC| ≥ 1; P < 0.05). E-F. GO enrichment analysis of DEGs in MTB-24 vs. MTB-0 (E) and OA-MTB-24 vs. OA-MTB-0 (F) groups. G-H. KEGG enrichment analysis of DEGs in MTB-24 vs. MTB-0 (G) and OA-MTB-24 vs. OA-MTB-0 (H) groups.
Metabolomic analysis identified significant changes in metabolite levels, with 128 upregulated and 147 downregulated metabolites in the MTB-24 vs. MTB-0 comparison (Figure 4A and 4C). Among the FMs, 79 metabolites were upregulated, and 88 were downregulated in the OA-MTB-24 vs. OA-MTB-0 group (Figure 4A, 4D), and 41 were upregulated and 43 were downregulated in the OA-MTB-24 and OA-MTB-0 groups (Figure 4B). KEGG enrichment analysis showed that DMs in the MTB-24 vs. MTB-0 groups were significantly associated with seven metabolic pathways, three biosynthetic pathways, and three additional pathways (Figure 4E). In contrast, DMs in the OA-MTB-24 vs. OA-MTB-0 groups were enriched in terms related to four metabolic pathways, two cancer-related pathways, and five other pathways, including ‘cAMP signaling pathway’ (Figure 4F). These findings highlight the distinct metabolic responses of normal macrophages and FMs during MTB infection, reflecting the divergent roles of these cell types in pathogen-host interactions.
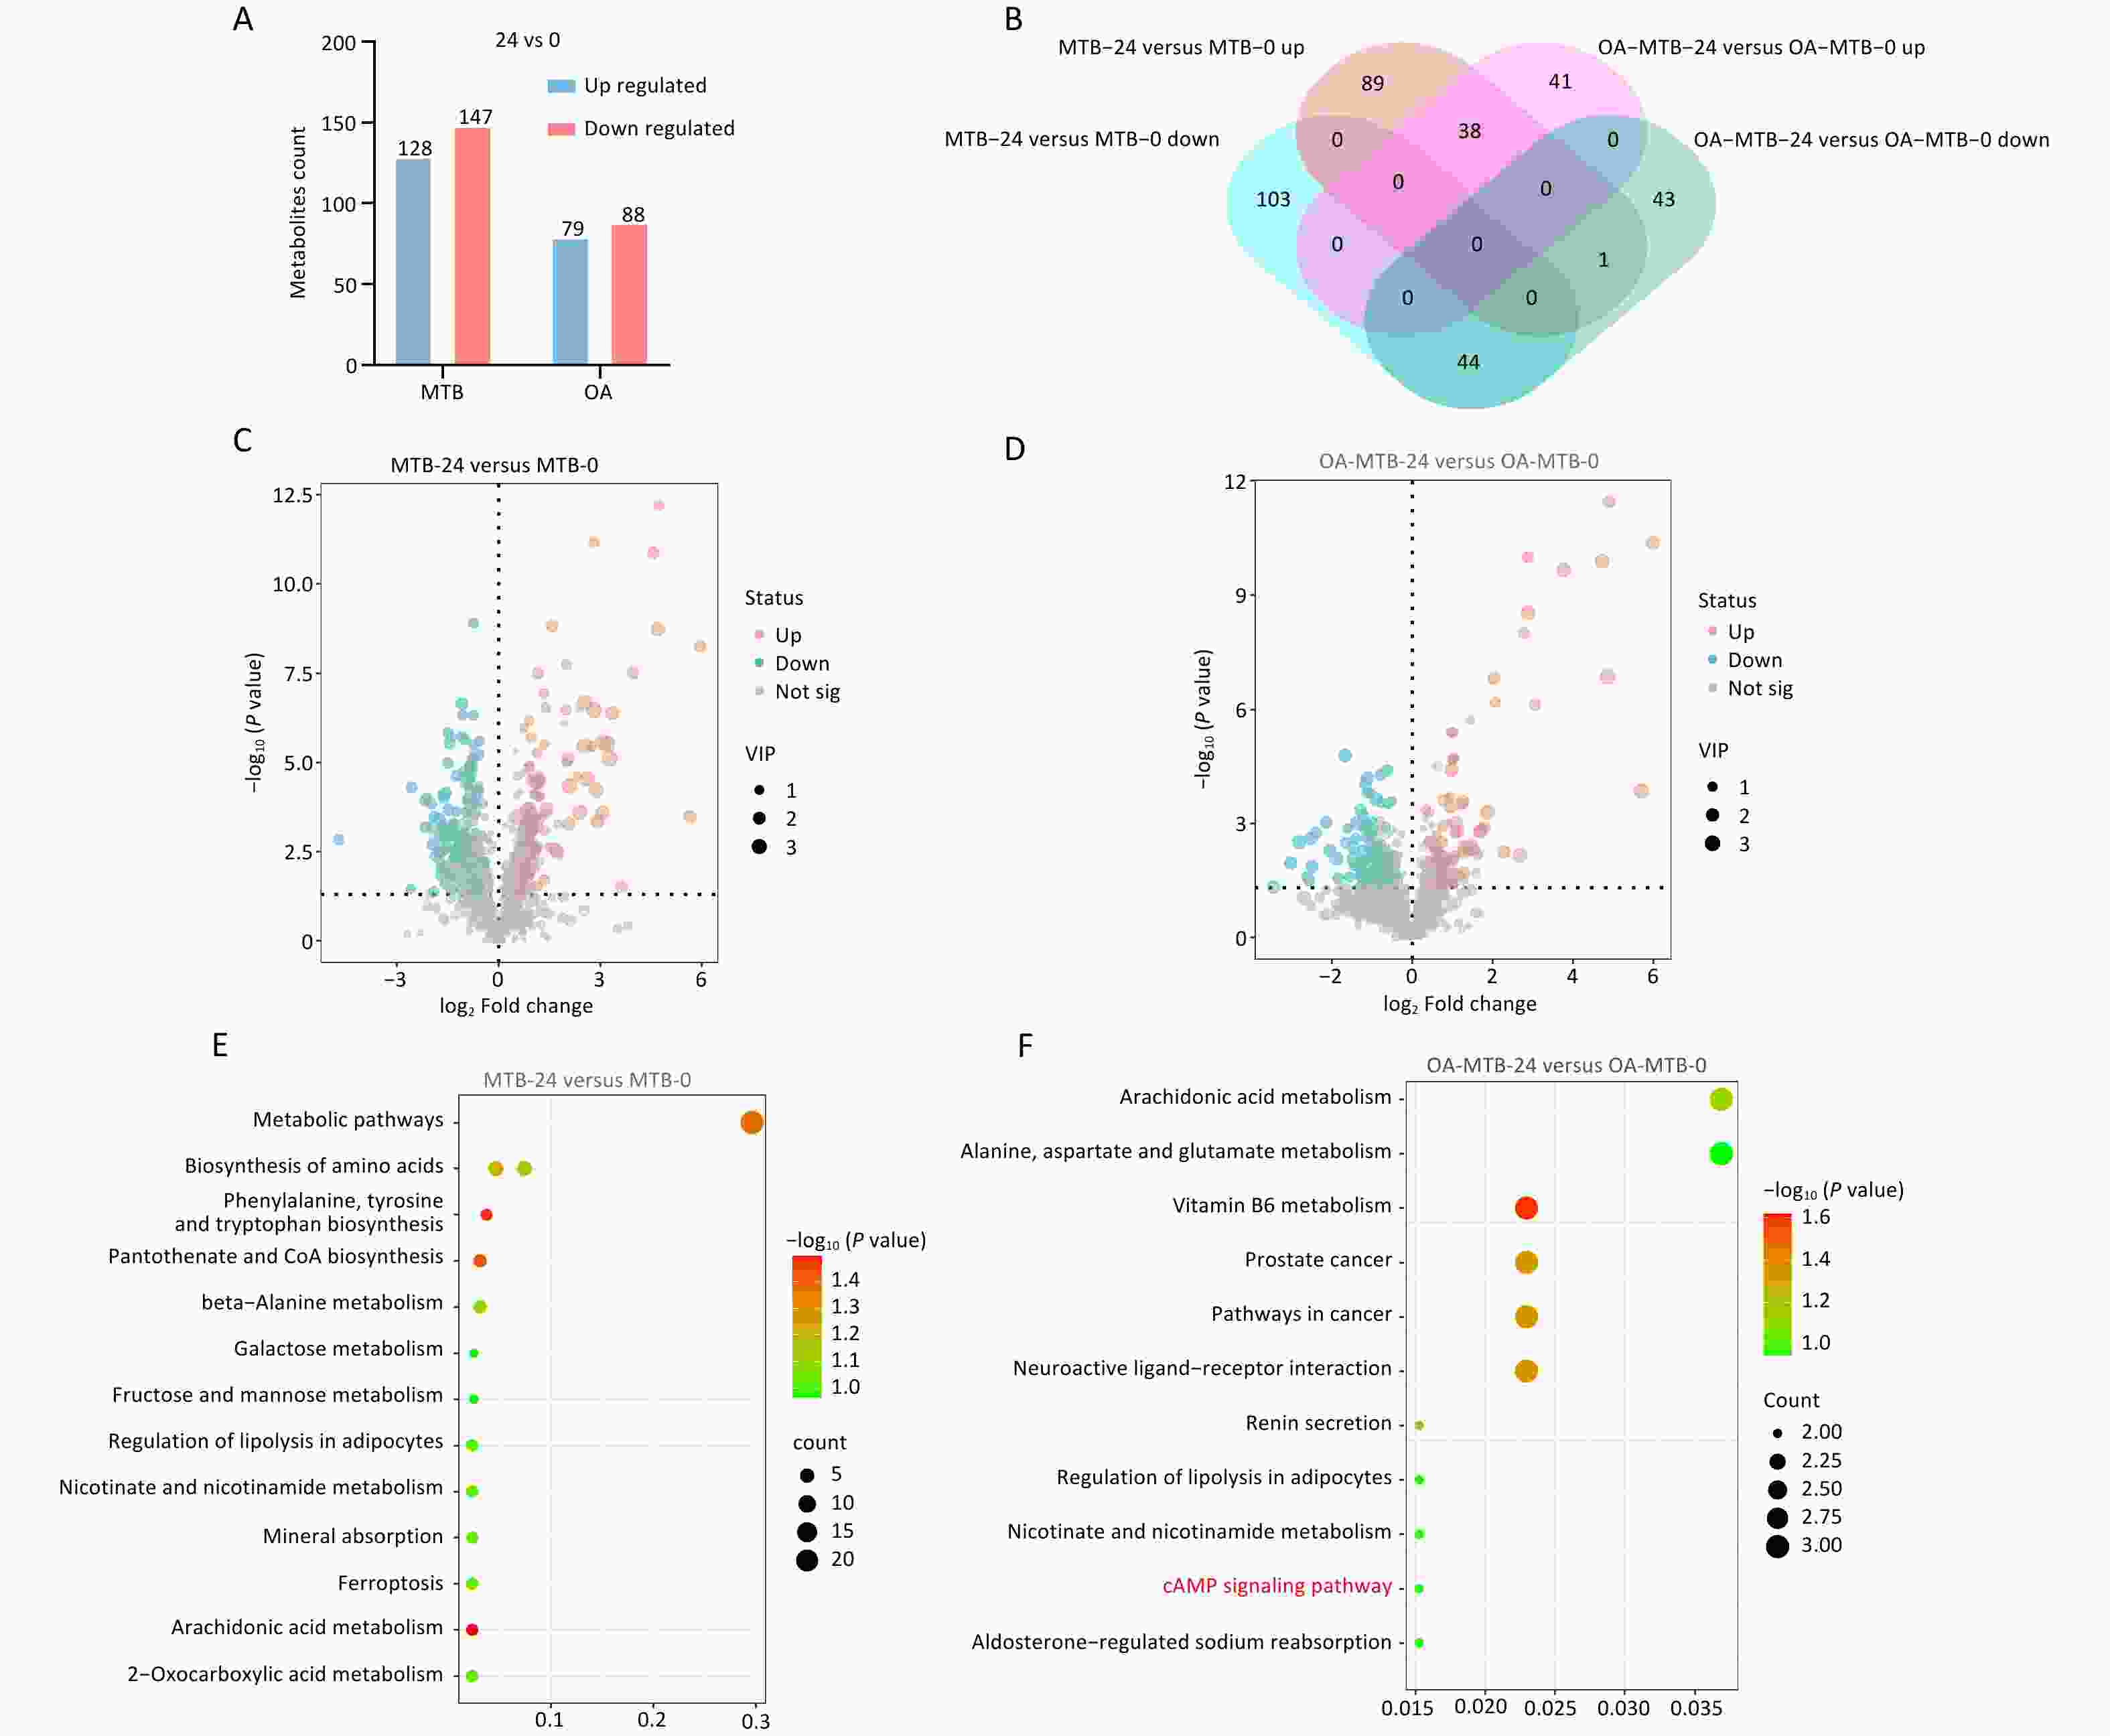
Figure 4. Metabolic comparison of the MTB infection process in normal macrophages and FMs. (A) Bar plots showing the numbers of upregulated and downregulated metabolites in MTB-24 vs. MTB-0 and OA-MTB-24 vs. OA-MTB-0 groups. (B) Venn diagram depicting metabolites unique to or shared between MTB-24 vs. MTB-0 and OA-MTB-24 vs. OA-MTB-0 groups. C-D. Volcano plots of differentially expressed metabolites (DMs) in MTB-24 vs. MTB-0 (C) and OA-MTB-24 vs. OA-MTB-0 (D) groups (|log2FC| ≥ 1; P < 0.05). (E-F) KEGG enrichment analysis of DMs in MTB-24 vs. MTB-0 (E) and OA-MTB-24 vs. OA-MTB-0 (F) groups.
-
We performed an integrated analysis of transcriptomic and metabolomic data to identify key molecular pathways involved in MTB survival. DEGs and DMs, identified based on previously defined criteria, were subjected to KEGG pathway enrichment analysis using Fisher’s Exact Test. Pathways that were significantly enriched in both datasets (P < 0.05) were considered critical for the physiological and pathological processes studied.
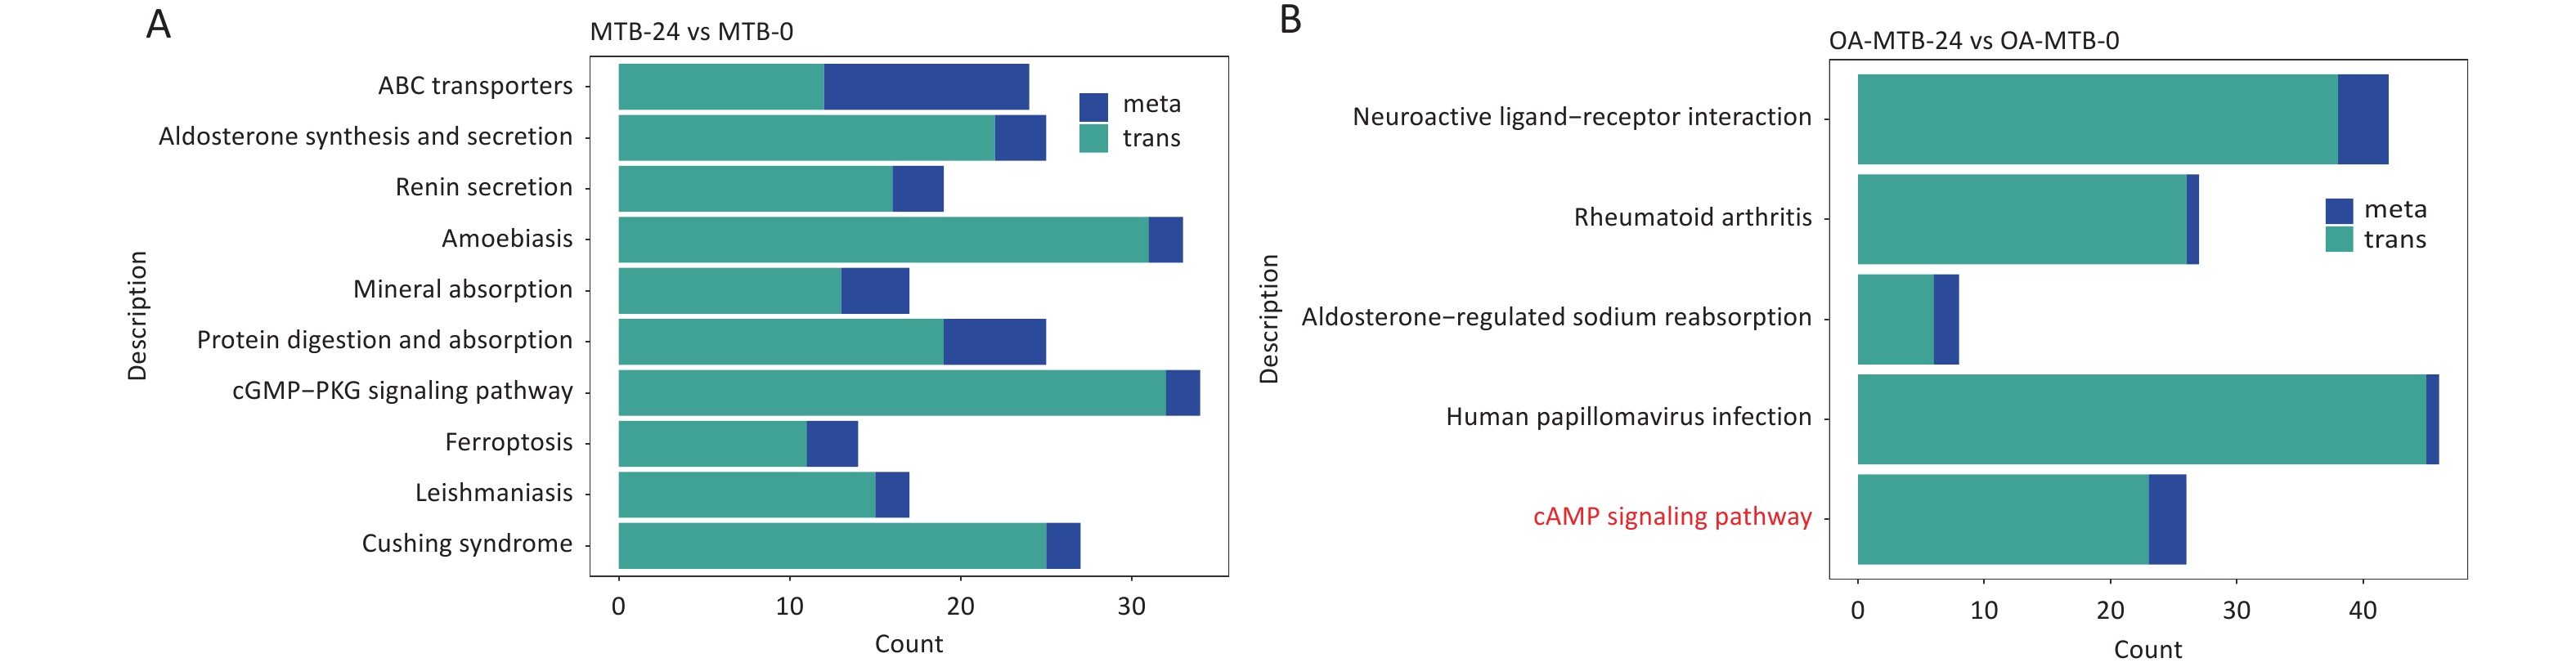
In the MTB-24 vs. MTB-0 groups, 10 significant shared KEGG pathway terms were observed, including ‘ABC transporters,’ ‘aldosterone synthesis and secretion,’ ‘renin secretion,’ ‘mineral absorption,’ ‘protein digestion and absorption,’ ‘cGMP-PKG signaling pathway,’ ‘ferroptosis,’ and three disease-related pathways (Figure 5A). In FMs (OA-MTB-24 vs. OA-MTB-0), five significant shared pathway terms were identified, including ‘neuroactive ligand-receptor interaction,’ ‘aldosterone-regulated sodium reabsorption,’ ‘cAMP signaling pathway,’ and two disease-related pathways (Figure 5B).
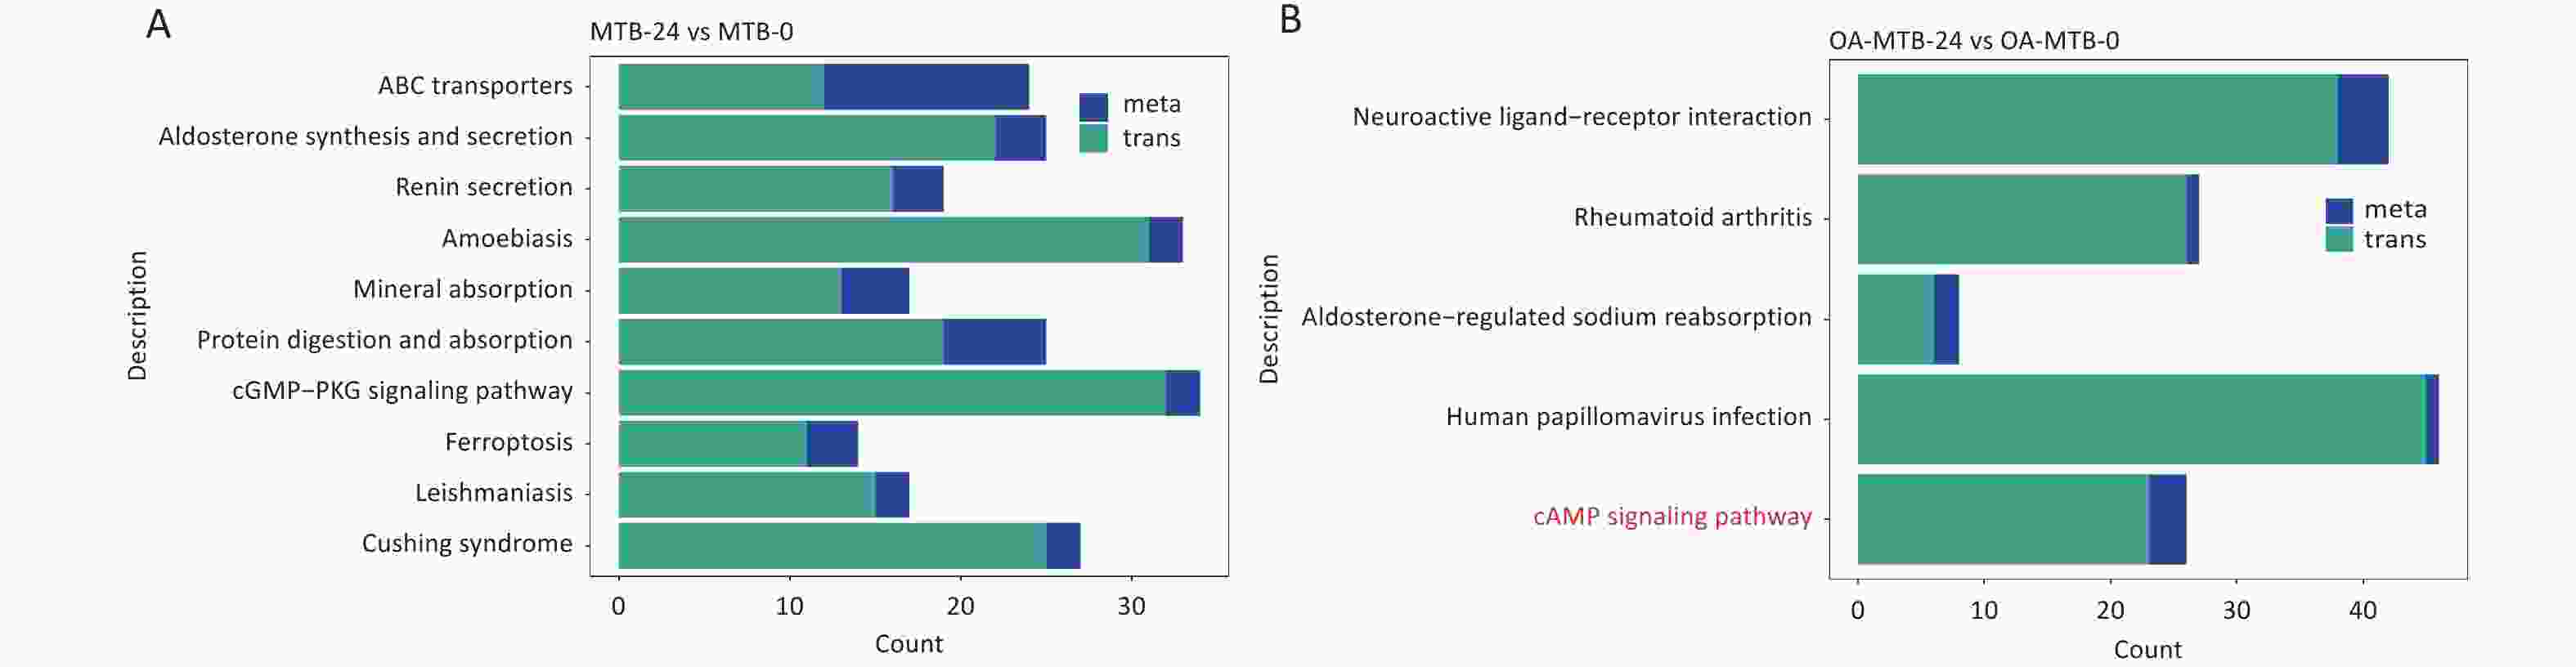
Figure 5. Integrated analysis of metabolomics and transcriptomics during MTB infection in normal macrophages and foam macrophages. (A) Shared KEGG enrichment pathways identified in the MTB-24 vs. MTB-0 groups. (B) Shared KEGG enrichment pathways identified in the OA-MTB-24 vs. OA-MTB-0 groups.
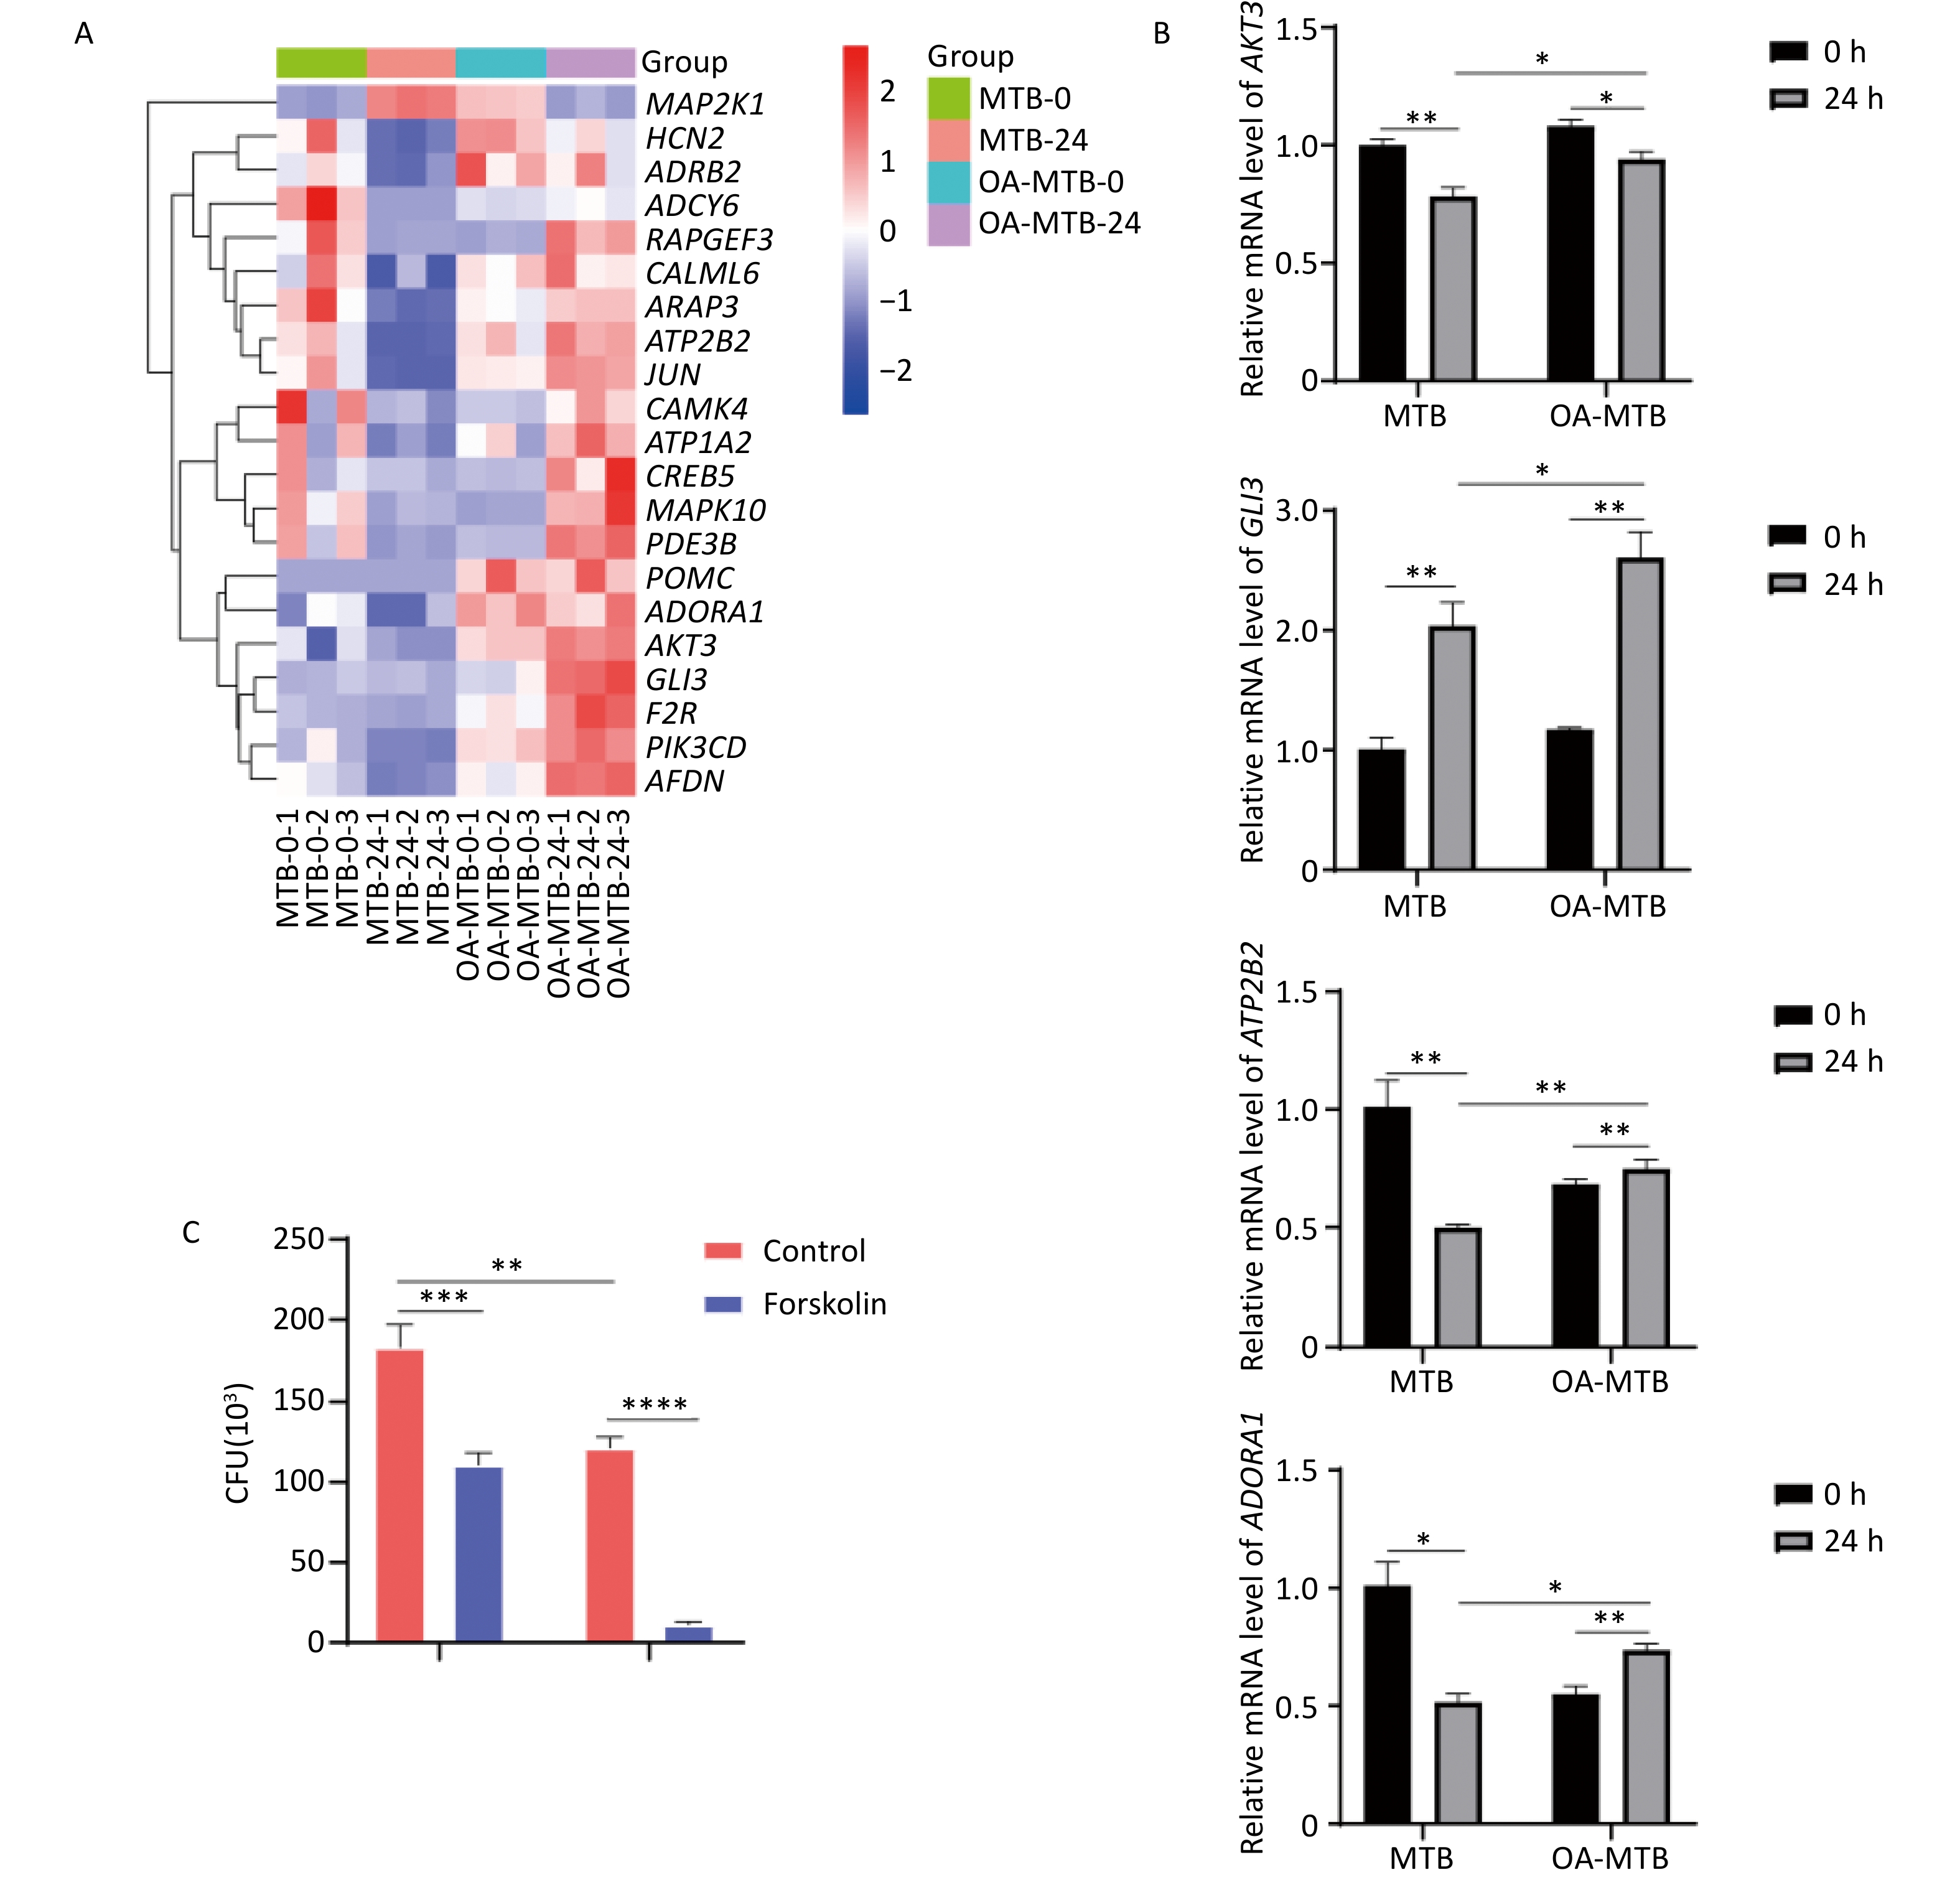
Notably, the term ’cAMP signaling pathway’ was uniquely enriched in FMs but absent in normal macrophages during MTB infection. Visual analysis of the KEGG pathways revealed the apparent activation of this pathway in MTB-infected FMs (Figure S2), supported by a gene expression-based heatmap showing the upregulation of numerous genes involved in the cAMP signaling pathway in infected FMs (Figure 6A).
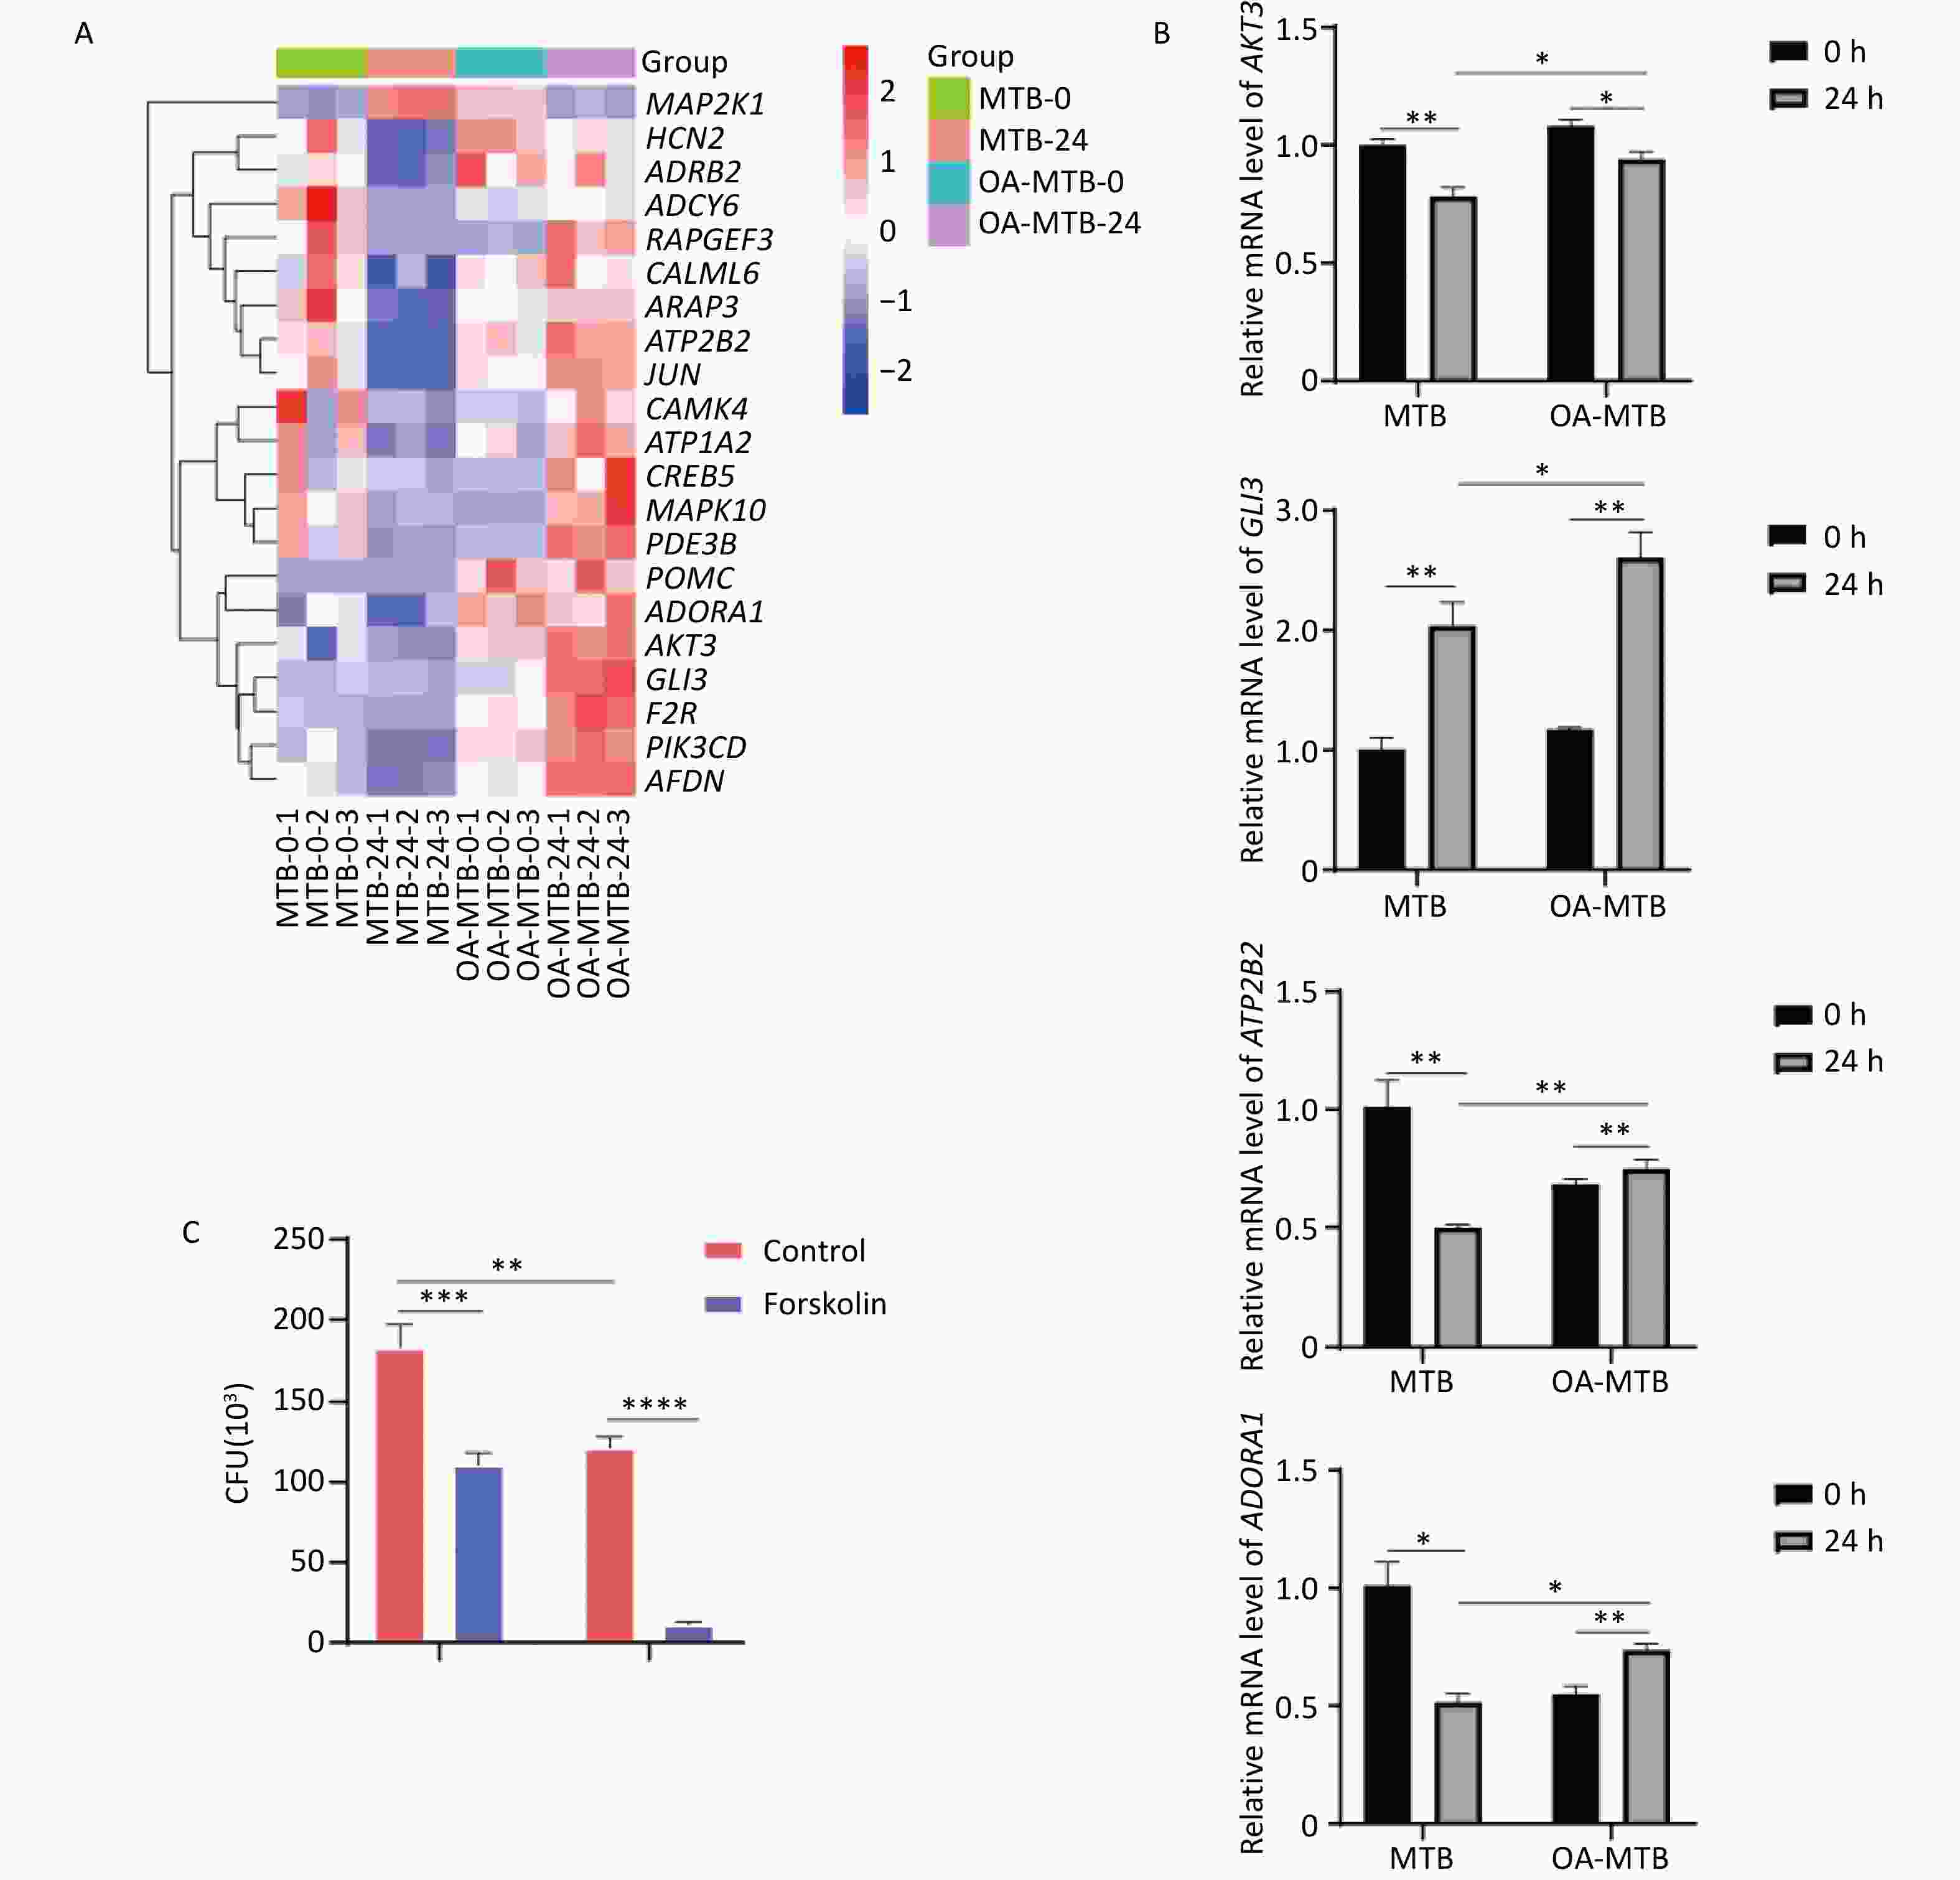
Figure 6. Contribution of the cAMP signaling pathway to MTB survival. (A) Heatmap showing clustered expression of genes involved in the cAMP signaling pathway. The color scale indicates fold changes of DEGs. (B) Expression levels of genes in the cAMP signaling pathway detected by qPCR. (C) MTB survival in foam and normal macrophages treated with forskolin (250 μmol/L) for 24 h. Error bars represent means ± SD of three groups. Statistical significance was determined using Student's t-test.
-
To further elucidate the role of the cAMP signaling pathway in restricting the survival of MTB, we treated both normal macrophages and FMs with forskolin, a cAMP signaling pathway activator. Determination of CFU data demonstrated that forskolin significantly reduced the survival of MTB in normal macrophages, and inhibited the survival of MTB in FMs (Figure 6C).
These findings were corroborated by qPCR validation of key genes involved in the cAMP signaling pathway, including ATP2B2, GLI3, AKT3, and ADORA1, which showed expression patterns consistent with our integrated transcriptomic and metabolomic analysis results (Figure 6B). Together, these results suggest that activation of the cAMP signaling pathway is a critical factor in the enhanced MTB restriction observed in foam macrophages, highlighting its potential as a therapeutic target for host-directed strategies to combat MTB infection.
-
We established an in vitro FM model using OA-treated THP-1 cells and observed that MTB survival was restricted in FMs. To explore the key molecular mechanisms contributing to this restrictive effect, integrated transcriptomic and metabolic analysis was performed. Our findings indicate that the cAMP signaling pathway is activated in FMs, potentially playing a critical role in restricting MTB survival and serving as a potential target for tuberculosis treatment. However, further research is required to identify the key molecules involved and elucidate the precise molecular mechanisms responsible for this effect.
In the present study, OA induction resulted in FM formation, which had a restrictive effect on MTB survival. Agarwala et al. reported that FMs induced by OA, or a mixture of OA and linoleic acid, effectively restricted the survival of MTB in vitro[8]. Similarly, a separate study demonstrated that fluvastatin-induced lipid accumulation in human peripheral blood mononuclear cells enhanced the inflammatory response and bactericidal effects against MTB[16]. Daniel et al. also observed that hypoxic conditions induce FM formation in THP-1 cells, restricting MTB survival[17]. However, contrasting findings have been reported, as mycolic acid[18] and oxidized low-density lipoprotein[19] promote FM formation while enhancing MTB survival. These conflicting results suggest that the impact of FMs on MTB survival may depend on various factors, including differences in the type and abundance of intracellular lipid droplets, or variations in the immune responses of different cells to MTB infection. Further investigation is warranted to clarify these discrepancies and decipher the complex interplay between FMs and MTB.
Transcriptomic analysis indicated that pathways associated with inflammation were activated during OA-induced FM formation, aligning with the established notion that FMs are inherently pro-inflammatory cells[11,16]. During MTB infection, inflammation-related pathways, such as tumor necrosis factor (TNF), JAK-STAT, and NF-κB signaling pathways, were activated in FMs (Figure 3H, Table S2). Pooja Agarwal et al. reported upregulated expression levels of pro-inflammatory cytokine interleukin (IL)-1β and TNF-α in FMs[8]. Similarly, fluvastatin-treated FMs exhibited upregulated IL-6 expression[16]. Because pro-inflammatory responses within granulomatous lesions are crucial for restricting TB infection[20,21], we hypothesized that inflammation-associated activation can limit MTB's survival in FMs.
Metabolomic analysis revealed that the cAMP signaling pathway was activated during both OA-induced FM formation (Figure 2E) and subsequent MTB infection (Figure 4F), a phenomenon not observed in normal macrophages infected with MTB. Integrative transcriptomic and metabolomic analyses confirmed these findings (Figure 2F and 5B). Treatment with cAMP activators led to limited survival of MTB in both normal macrophages and FMs (Figure 6C), suggesting that the cAMP signaling pathway plays an essential role in restricting MTB survival.
cAMP is a pivotal secondary messenger that is synthesized by adenylate cyclase, which converts adenosine triphosphate (ATP) into cAMP. Protein kinase A (PKA), the principal effector of cAMP signaling, is a dimeric protein kinase composed of two catalytic and two regulatory subunits. Upon binding to cAMP, the regulatory subunits dissociate, activating PKA, which phosphorylates target proteins to regulate various physiological functions and metabolic processes[22]. The cAMP signaling pathway modulates macrophage function during MTB infection. For example, inhibition of the cAMP signaling pathway by H-89 enhances the survival of MTB in J774 macrophages[23], whereas activation of the cAMP-PKA-PI3K-p38 pathway efficiently restricts the survival of MTB in mouse macrophages[24]. Additionally, Wager et al. revealed that MTB rapidly activates cAMP response element-binding protein (CREB), leading to elevated expression of genes, such as COX2, MCL-1, CCL8, and c-FOS, whereas inhibition of CREB activity restricts survival of MTB[25].
Interestingly, cAMP also significantly regulates bacterial physiology, including carbon metabolism, virulence gene expression, biofilm formation, drug resistance, and host cell signal transduction[26-28]. MTB has a more extensive array of cAMP signaling components than other bacteria, suggesting that cAMP plays an essential role in regulating the physiological responses of MTB to environmental changes. Elevated cAMP levels in MTB reduce the ability of the bacteria to metabolize fatty acids and cholesterol[29], while stimulation of cAMP synthesis affects cholesterol utilization by MTB[30]. Given that neutral lipids in FMs are the primary energy source for MTB survival[17], we speculate that activating the cAMP signaling pathway in these cells exerts a dual effect: modulating macrophage function and restricting MTB survival by altering MTB lipid utilization. This intriguing hypothesis warrants further investigation to fully elucidate how the cAMP signaling pathway regulates lipid metabolism by MTB and the survival of the bacteria within host cells. Unraveling these mechanisms could provide novel therapeutic avenues, potentially targeting the cAMP pathway to disrupt MTB's energy supply of MTB and enhance the ability of the host to combat infections.
In conclusion, this study highlights the pivotal role of the cAMP signaling pathway in FMs, as revealed by integrative transcriptomic and metabolomic analyses. Our findings suggest that cAMP influences the survival of MTB via inflammatory modulation and alterations in lipid metabolism. These insights offer potential therapeutic avenues for targeting the cAMP pathway to disrupt the energy supply to MTB and enhance host defense mechanisms. Further research is necessary to elucidate these mechanisms and to develop effective host-directed therapies for tuberculosis.
doi: 10.3967/bes2025.078
Comparative Transcriptomic and Metabolomic Analyses Reveal the Mechanism by Which Foam Macrophages Restrict Survival of Intracellular Mycobacterium tuberculosis
-
Abstract:
Objectives This study aimed to investigate the impact of foam macrophages (FMs) on the intracellular survival of Mycobacterium tuberculosis (MTB) and identify the molecular mechanisms influencing MTB survival. Methods An in vitro FM model was established using oleic acid induction. Transcriptomic and metabolomic analyses were conducted to identify the key molecular pathways involved in FM-mediated MTB survival. Results Induced FMs effectively restricted MTB survival. Transcriptomic and metabolomic profiling revealed distinct changes in gene and metabolite expression in FMs during MTB infection compared with normal macrophages. Integrated analyses identified significant alterations in the cyclic adenosine monophosphate (cAMP) signaling pathway, indicating that its activation contributes to the FM-mediated restriction of MTB survival. Conclusions FMs inhibit MTB survival. The cAMP signaling pathway is a key contributor. These findings enhance the understanding of the role of FMs in tuberculosis progression, suggest potential targets for host-directed therapies, and offer new directions for developing diagnostic and therapeutic strategies against tuberculosis. -
Key words:
- Tuberculosis /
- Foam macrophages /
- Metabolomic /
- Transcriptomic /
- cAMP signal pathway
The authors declare that they have no competing financial interests or personal relationships that may have influenced the work reported in this study.
This study is exempt from ethical review.
注释:1) Author Contributions: 2) Competing Interests: 3) Ethics:: -
Figure 1. Lipid accumulation in foam macrophages (FMs) and influence on MTB survival. (A) Fluorescence microscopy visualization of neutral lipids in FMs and normal THP-1 cells. Nuclei are stained with DAPI (blue), and neutral lipids are stained with BODIPY (green). (B) MTB survival in FMs and normal THP-1 cells at 24 and 48 h post-infection. (C) Fluorescence microscopy visualization of neutral lipids in FMs treated with lipid synthesis inhibitors A939572 (10 μmol/L) or Orlistat (5 μmol/L). (D) Survival of MTB in FMs treated with A939572 (10 μmol/L) or Orlistat (5 μmol/L). Error bars represent mean ± standard deviation (SD) from three independent experiments. Statistical significance was determined using Student's t-test.
Figure 2. Transcriptomic and metabolomic changes in macrophages after OA treatment. (A) Volcano plot of differentially expressed genes (DEGs) in OA-treated macrophages compared to controls. (B) GO enrichment of DEGs. The top 10 terms from the biological process, cellular component, and molecular function categories are shown. (C) Top 15 KEGG pathways enriched among DEGs. (D) Volcano plot of differentially expressed metabolites (DMs) in OA-treated macrophages compared to controls. (E) KEGG enrichment analysis of DMs. (F) Shared KEGG enrichment pathways identified through integrated transcriptomic and metabolomic analyses.
Figure 3. Transcriptomic comparison of the MTB infection process in normal and foam macrophages. (A) Bar plots showing the numbers of upregulated and downregulated genes in MTB-24 vs. MTB-0 and OA-MTB-24 vs. OA-MTB-0 groups. (B) Venn diagram depicting DEGs unique to or shared between MTB-24 vs. MTB-0 and OA-MTB-24 vs. OA-MTB-0 groups. (C-D) Volcano plots of DEGs in MTB-24 vs. MTB-0 (C) and OA-MTB-24 vs. OA-MTB-0 (D) groups (|log2FC| ≥ 1; P < 0.05). E-F. GO enrichment analysis of DEGs in MTB-24 vs. MTB-0 (E) and OA-MTB-24 vs. OA-MTB-0 (F) groups. G-H. KEGG enrichment analysis of DEGs in MTB-24 vs. MTB-0 (G) and OA-MTB-24 vs. OA-MTB-0 (H) groups.
Figure 4. Metabolic comparison of the MTB infection process in normal macrophages and FMs. (A) Bar plots showing the numbers of upregulated and downregulated metabolites in MTB-24 vs. MTB-0 and OA-MTB-24 vs. OA-MTB-0 groups. (B) Venn diagram depicting metabolites unique to or shared between MTB-24 vs. MTB-0 and OA-MTB-24 vs. OA-MTB-0 groups. C-D. Volcano plots of differentially expressed metabolites (DMs) in MTB-24 vs. MTB-0 (C) and OA-MTB-24 vs. OA-MTB-0 (D) groups (|log2FC| ≥ 1; P < 0.05). (E-F) KEGG enrichment analysis of DMs in MTB-24 vs. MTB-0 (E) and OA-MTB-24 vs. OA-MTB-0 (F) groups.
Figure 5. Integrated analysis of metabolomics and transcriptomics during MTB infection in normal macrophages and foam macrophages. (A) Shared KEGG enrichment pathways identified in the MTB-24 vs. MTB-0 groups. (B) Shared KEGG enrichment pathways identified in the OA-MTB-24 vs. OA-MTB-0 groups.
Figure 6. Contribution of the cAMP signaling pathway to MTB survival. (A) Heatmap showing clustered expression of genes involved in the cAMP signaling pathway. The color scale indicates fold changes of DEGs. (B) Expression levels of genes in the cAMP signaling pathway detected by qPCR. (C) MTB survival in foam and normal macrophages treated with forskolin (250 μmol/L) for 24 h. Error bars represent means ± SD of three groups. Statistical significance was determined using Student's t-test.
-
[1] World Health Organization. Global tuberculosis report 2023. Geneva: WHO, 2023. [2] Drain PK, Bajema KL, Dowdy D, et al. Incipient and subclinical tuberculosis: a clinical review of early stages and progression of infection. Clin Microbiol Rev, 2018; 31, e00021−18. [3] Weeratunga P, Moller DR, Ho LP. Immune mechanisms of granuloma formation in sarcoidosis and tuberculosis. J Clin Invest, 2024; 134, e175264. doi: 10.1172/JCI175264 [4] Rubin EJ. The granuloma in tuberculosis--friend or foe?. N Engl J Med, 2009; 360, 2471-3. [5] Ouimet M, Koster S, Sakowski E, et al. Mycobacterium tuberculosis induces the miR-33 locus to reprogram autophagy and host lipid metabolism. Nat Immunol, 2016; 17, 677−86. [6] Ramakrishnan L. Revisiting the role of the granuloma in tuberculosis. Nat Rev Immunol, 2012; 12, 352−66. doi: 10.1038/nri3211 [7] Genoula M, Franco JLM, Dupont M, et al. Formation of foamy macrophages by tuberculous pleural effusions is triggered by the interleukin-10/signal transducer and activator of transcription 3 axis through ACAT upregulation. Front Immunol, 2018; 9, 459. doi: 10.3389/fimmu.2018.00459 [8] Agarwal P, Combes TW, Shojaee-Moradie F, et al. Foam cells control Mycobacterium tuberculosis infection. Front Microbiol, 2020; 11, 1394. doi: 10.3389/fmicb.2020.01394 [9] Johansen MD, Kasparian JA, Hortle E, et al. Mycobacterium marinum infection drives foam cell differentiation in zebrafish infection models. Dev Comp Immunol, 2018; 88, 169−72. doi: 10.1016/j.dci.2018.07.022 [10] Zhou S, Zhang D, Li D, et al. Pathogenic mycobacterium upregulates cholesterol 25-hydroxylase to promote granuloma development via foam cell formation. iScience, 2024; 27, 109204. doi: 10.1016/j.isci.2024.109204 [11] Russell DG, Cardona PJ, Kim MJ, et al. Foamy macrophages and the progression of the human tuberculosis granuloma. Nat Immunol, 2009; 10, 943−8. doi: 10.1038/ni.1781 [12] Russell DG. Who puts the tubercle in tuberculosis?. Nat Rev Microbiol, 2007; 5, 39−47. doi: 10.1038/nrmicro1538 [13] Genoula M, Franco JLM, Maio M, et al. Fatty acid oxidation of alternatively activated macrophages prevents foam cell formation, but Mycobacterium tuberculosis counteracts this process via HIF-1α activation. PLoS Pathog, 2020; 16, e1008929. doi: 10.1371/journal.ppat.1008929 [14] Sellick CA, Hansen R, Stephens GM, et al. Metabolite extraction from suspension-cultured mammalian cells for global metabolite profiling. Nat Protoc, 2011; 6, 1241−9. doi: 10.1038/nprot.2011.366 [15] Yuan M, Breitkopf SB, Yang XM, et al. A positive/negative ion-switching, targeted mass spectrometry-based metabolomics platform for bodily fluids, cells, and fresh and fixed tissue. Nat Protoc, 2012; 7, 872−81. doi: 10.1038/nprot.2012.024 [16] Montero-Vega MT, Matilla J, Bazán E, et al. Fluvastatin converts human macrophages into foam cells with increased inflammatory response to inactivated Mycobacterium tuberculosis H37Ra. Cells, 2024; 13, 536. doi: 10.3390/cells13060536 [17] Daniel J, Maamar H, Deb C, et al. Mycobacterium tuberculosis uses host triacylglycerol to accumulate lipid droplets and acquires a dormancy-like phenotype in lipid-loaded macrophages. PLoS Pathog, 2011; 7, e1002093. doi: 10.1371/journal.ppat.1002093 [18] Vermeulen I, Baird M, Al-Dulayymi J, et al. Mycolates of Mycobacterium tuberculosis modulate the flow of cholesterol for bacillary proliferation in murine macrophages. J Lipid Res, 2017; 58, 709−18. doi: 10.1194/jlr.M073171 [19] Vrieling F, Wilson L, Rensen PCN, et al. Oxidized low-density lipoprotein (oxLDL) supports Mycobacterium tuberculosis survival in macrophages by inducing lysosomal dysfunction. PLoS Pathog, 2019; 15, e1007724. doi: 10.1371/journal.ppat.1007724 [20] Marakalala MJ, Raju RM, Sharma K, et al. Inflammatory signaling in human tuberculosis granulomas is spatially organized. Nat Med, 2016; 22, 531−8. doi: 10.1038/nm.4073 [21] Chai QY, Lu Z, Liu CH. Host defense mechanisms against Mycobacterium tuberculosis. Cell Mol Life Sci, 2020; 77, 1859−78. doi: 10.1007/s00018-019-03353-5 [22] Chen DK, Wang JJ, Cao J, et al. cAMP-PKA signaling pathway and anxiety: where do we go next?. Cell Signal, 2024; 122, 111311. doi: 10.1016/j.cellsig.2024.111311 [23] Kalamidas SA, Kuehnel MP, Peyron P, et al. cAMP synthesis and degradation by phagosomes regulate actin assembly and fusion events: consequences for mycobacteria. J Cell Sci, 2006; 119, 3686−94. doi: 10.1242/jcs.03091 [24] Lee HJ, Ko HJ, Song DK, et al. Lysophosphatidylcholine promotes phagosome maturation and regulates inflammatory mediator production through the protein kinase a-phosphatidylinositol 3 kinase-p38 mitogen-activated protein kinase signaling pathway during Mycobacterium tuberculosis infection in mouse macrophages. Front Immunol, 2018; 9, 920. doi: 10.3389/fimmu.2018.00920 [25] Wager CML, Bonifacio JR, Simper J, et al. Activation of transcription factor CREB in human macrophages by Mycobacterium tuberculosis promotes bacterial survival, reduces NF-kB nuclear transit and limits phagolysosome fusion by reduced necroptotic signaling. PLoS Pathog, 2023; 19, e1011297. doi: 10.1371/journal.ppat.1011297 [26] McDonough KA, Rodriguez A. The myriad roles of cyclic AMP in microbial pathogens: from signal to sword. Nat Rev Microbiol, 2011; 10, 27−38. [27] Chubukov V, Gerosa L, Kochanowski K, et al. Coordination of microbial metabolism. Nat Rev Microbiol, 2014; 12, 327−40. doi: 10.1038/nrmicro3238 [28] Molina-Quiroz RC, Silva-Valenzuela C, Brewster J, et al. Cyclic AMP regulates bacterial persistence through repression of the oxidative stress response and SOS-dependent DNA repair in uropathogenic Escherichia coli. mBio, 2018; 9, e02144−17. [29] Wong AI. , Beites T, Planck KA, et al. Schnappinger D, et al. Cyclic AMP is a critical mediator of intrinsic drug resistance and fatty acid metabolism in M. tuberculosis. Elife, 2023; 12, e81177. doi: 10.7554/eLife.81177 [30] Wilburn KM, Montague CR, Qin B, et al. Pharmacological and genetic activation of cAMP synthesis disrupts cholesterol utilization in Mycobacterium tuberculosis. PLoS Pathog, 2022; 18, e1009862. doi: 10.1371/journal.ppat.1009862 -

 点击查看大图

计量
- 文章访问数: 16
- HTML全文浏览量: 6
- PDF下载量: 0
- 被引次数: 0

 Quick Links