

 下载:
下载:

-
The prevalence of dementia is growing dramatically owing to the rapid aging of the population and an increase in life expectancy worldwide[1-3]. Currently, there are no effective therapies to reverse the progression of dementia; therefore, early diagnosis and intervention are crucial to address the global challenges it poses. Mild cognitive impairment (MCI) is an early clinical symptom of dementia, with more than half of patients progressing to dementia within 5 years[4-7]. Consequently, early detection and prediction of cognitive function may help reduce the incidence of dementia.
Although many predictive models for risk factors associated with MCI are currently available[8-10], these models provide limited clinical utility. Biomarkers for predicting the risk of disease can provide valuable clinical information, and the screening of biomarkers for cognitive function is of great significance. Considering that little is known about the mechanisms underlying cognitive dysfunction, exploration of its pathogenesis is needed. Genome-wide association studies (GWAS) have found that multiple genetic variants are associated with cognitive function[11,12], but how genetic risk affects the progression of cognitive dysfunction is not fully understood. As most genetic variants associated with diseases are located in non-coding regions of the genome, these variants are likely to influence disease susceptibility through regulatory mechanisms. In the post-GWAS era, quantitative trait locus (QTL) analysis is an important method for exploring the regulatory mechanisms of genetic variants using multiomics data[13]. Multiomics data provide an effective and feasible bridge for evaluating the biological mechanisms of genetic variants in complex diseases. Integrative analysis of QTLs using multiomics data has the potential to improve our understanding of the mechanisms underlying cognitive function.
Glycomic is located downstream of gene and protein expression, is closer to the disease, and has more practical significance in disease prediction[14,15]. Immunoglobulin G (IgG) is a primary antibody that controls infection of human tissues and regulates the immune system. IgG functionality can drastically change from anti- to pro-inflammatory owing to alterations in IgG N-glycan patterns. Previous studies have shown that IgG N-glycans are associated with the risk of cognitive impairment and related risk factors, such as aging, metabolic traits, and ischemic stroke[16-21]. Additionally, IgG N-glycosylation is involved in the transition from genetic variants to metabolic traits[22]. However, there is still a limited understanding of whether IgG N-glycosylation is involved in the regulatory role of genetic variants in cognitive function or the role of genetic regulation of IgG N-glycosylation in cognitive function.
Publicly accessible, summarized QTL and GWAS data provide a rich resource for exploring the complex pathogenesis of complex diseases. Post-GWAS strategies could transform the discovery of genetic architectures and elucidate the role of genetic mechanisms in complex diseases, such as Mendelian randomization (MR)[23] and Bayesian colocalization[24]. Recently, a framework combining MR and colocalization analyses has been widely applied to identify the etiological mechanisms of complex traits[24-26]. Therefore, we performed post-GWAS analyses combining MR and colocalization not only to discover novel genes and proteins but also to explore how they could influence the aberrant IgG N-glycosylation observed in diseases with inflammatory features. Characterizing the complex relationships between genetics, transcriptomics, proteomics, and IgG N-glycomics may help elucidate the pathogenesis of cognitive function.
-
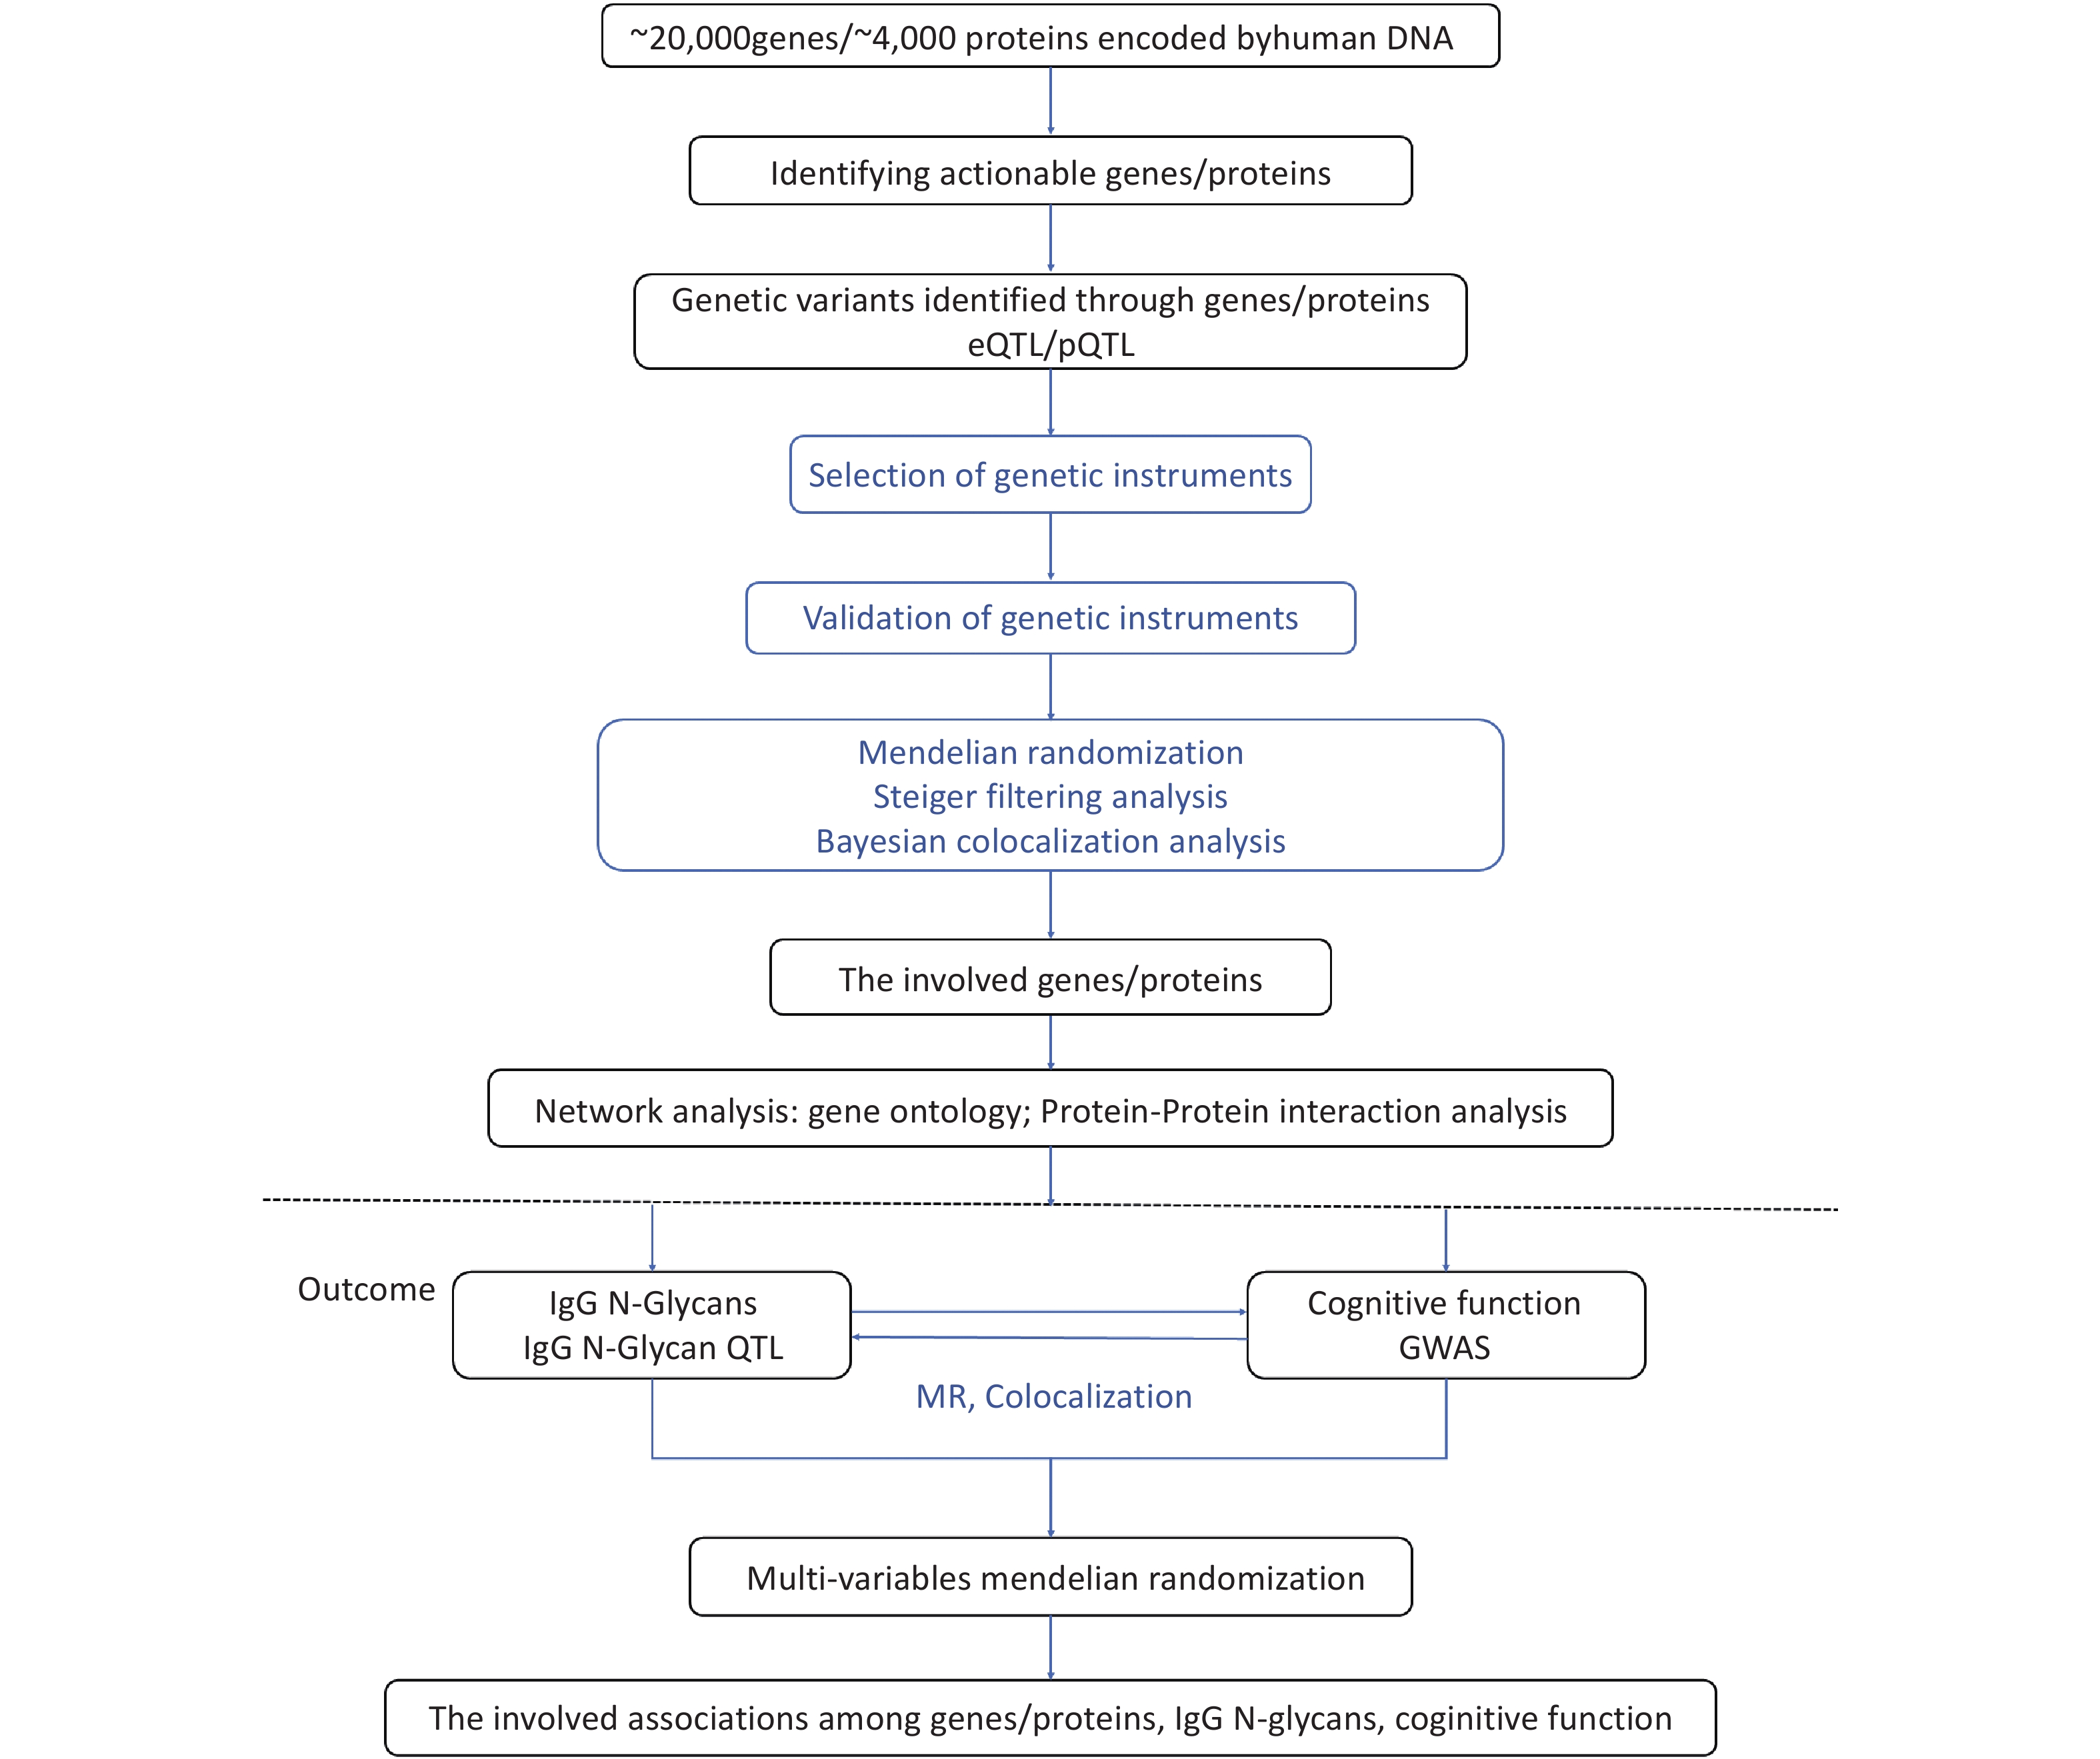
To investigate the regulatory mechanisms of cognitive function, we used high-throughput transcriptomic, proteomic, and glycomic techniques, in conjunction with genetic data. Specifically, we applied a post-GWAS method to determine the genomic architecture associated with gene expression, protein levels, and IgG N-glycan levels related to cognitive function. To systematically link omics to cognitive function, we followed a four-step approach, as illustrated in Figure 1. First, we integrated IgG N-glycan QTL data and summary GWAS data for cognitive function using a bidirectional MR framework that exploits genetic mapping to highlight the impact of shared causal variants on IgG N-glycan and cognitive function; we then used the Steiger filtering method to further confirm the direction of the effect (Step 1). Second, by leveraging the gene expression QTLs (eQTLs) and protein QTLs (pQTLs) with the IgG N-glycan QTL data, we identified the significant genes/proteins with IgG N-glycans (Step 2). Third, we used gene ontology and protein-protein interaction analysis to map the networks of the genes and proteins involved (Step 3). Finally, we performed a multivariable Mendelian randomization (MVMR) analysis to evaluate the associations between gene expression, proteins, IgG N-glycans, and cognitive function (Step 4).
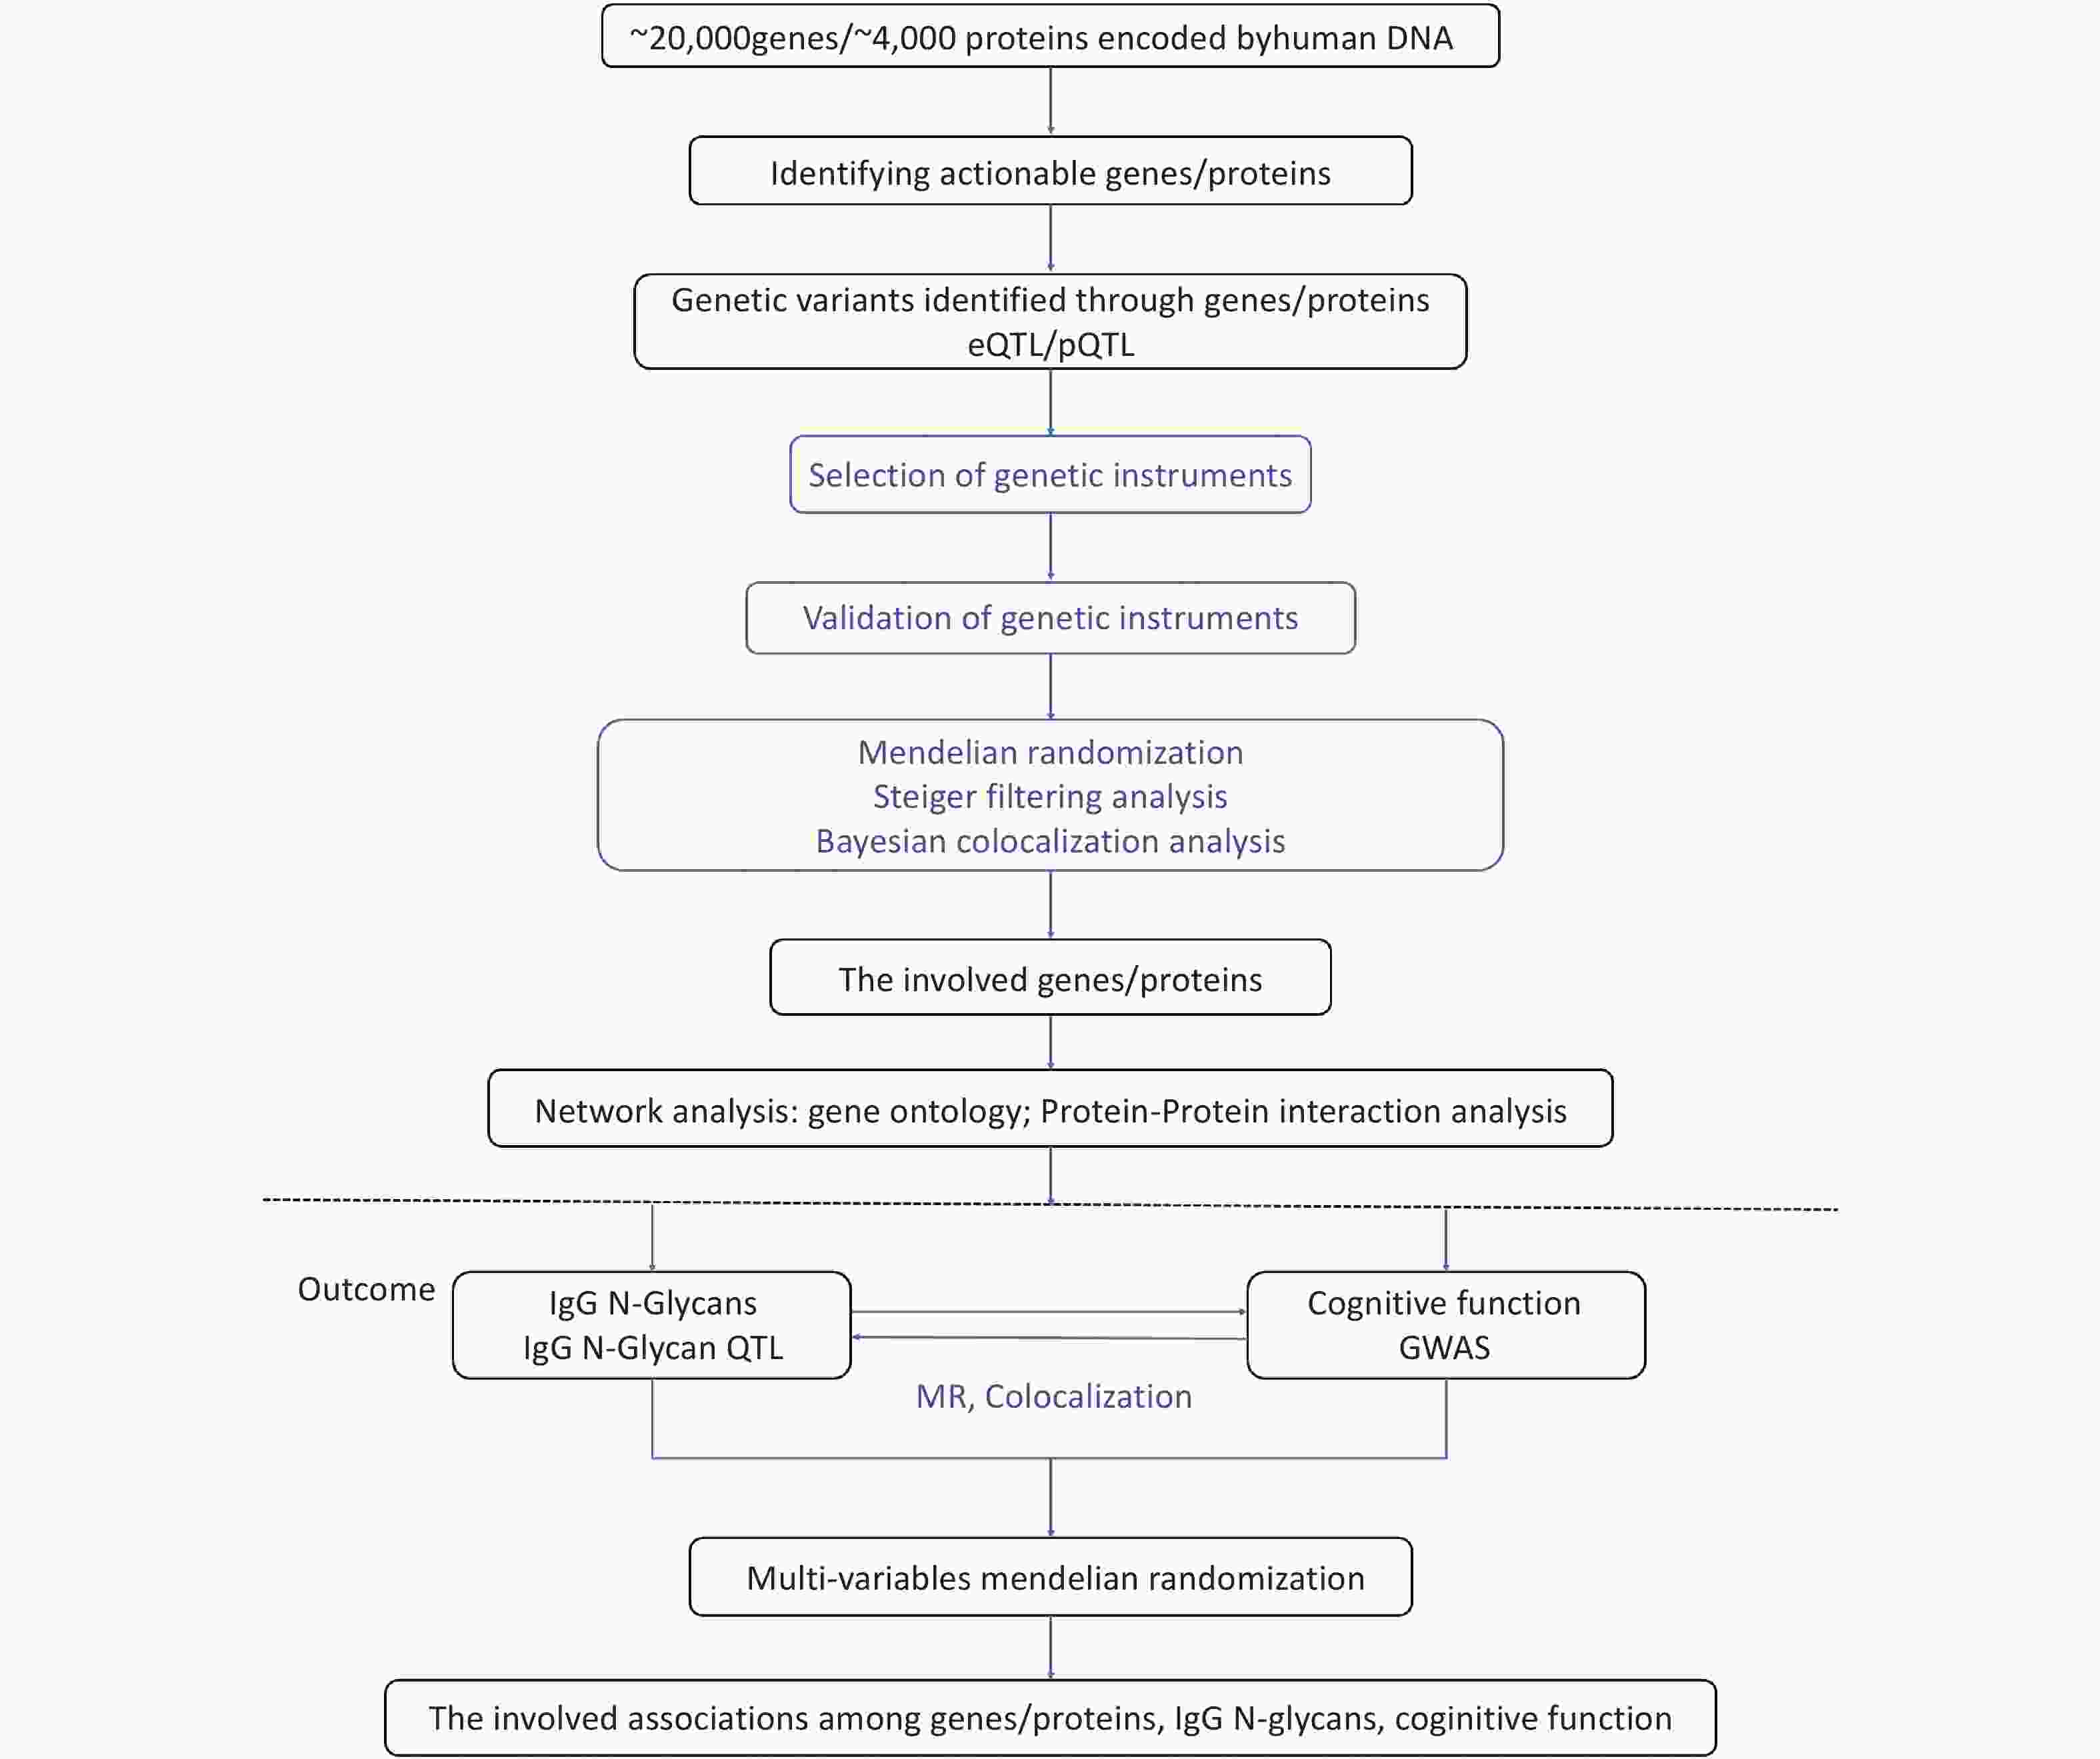
Figure 1. Overview of study analysis. QTL: quantitative trait locus; MR: Mendelian randomization.
MR is an approach that uses genetic variants as instrumental variables to test whether exposures causally affect outcomes[27,28]. This method provides unbiased estimates if three assumptions are met: (i) genetic variants are strongly associated with the exposure (relevance); (ii) genetic variants are not influenced by confounding factors (independence); and (iii) genetic variants affect the outcome only via the exposure (exclusion restriction).
-
The present study was based on the most recently published and largest sample size databases of European descent for the following analyses to ensure the accuracy and reliability of our findings.
-
We obtained whole-blood eQTL data from the eQTLGen Consortium to study associations between human gene expression and genetic variations. Gene expression in these samples was determined by paired-end RNA-seq of 31,684 participants and 19,942 human genes. Summarized eQTL data are available at https://gwas.mrcieu.ac.uk/datasets/.
-
Serum pQTLs were derived from the three largest GWAS analyses[29-31], which were used to explore the associations between human proteins and genetic variations. The study sample consisted of 3,394 predominantly European individuals, including data for 4,137 serum protein traits. Summarized pQTL data are available at https://gwas.mrcieu.ac.uk/datasets/.
-
Summary statistics of IgG N-glycan QTL data on the association of genetic variants with IgG N-glycans were based on 8,090 participants with 23 direct glycan peaks (GPs) detected by ultra performance liquid chromatography[32]. IgG N-glycan QTL data are available at https://shiny.igmm.ed.ac.uk/igg_glycans_gwas/.
-
The summarized GWAS data for cognitive function were based on a meta-analysis of the UK Biobank (UKB) and COGENT consortium (n = 257,841) data. Cognitive function was used as a continuous variable, with higher scores indicating better cognitive function. Detailed information on quality control is described in a previous GWAS[12]. GWAS data are available at https://gwas.mrcieu.ac.uk/datasets/.
-
Genetic variants that were robustly associated with genes, proteins, IgG N-glycans, or cognitive function (with P < 5 × 10⁻⁸) were considered to generate genetic instrumental variables (IVs). Conditionally uncorrelated variants (with the lowest P value having linkage disequilibrium [LD] r2 < 0.001) were selected as IVs. LD proxies were defined using 1,000 European genome samples. Genetic variants known to have pleiotropic effects were excluded from the analyses using the Open Targets Genetics Tool.
-
The inverse-variance weighted (IVW) method was used as the main analytical method to evaluate the MR analysis results. When only one genetic variant was available, the Wald ratio (WR) was used to evaluate the results. Complementary methods, including weighted median, MR-Egger, MR-PRESSO, and MR-RAPS, were also applied. In addition, the Steiger filtering method was used to determine the direction of the effect. A multiple testing threshold of P < 0.05/number of analyzed exposures was used to filter significant estimates. The analyses for the first step were two-sided, with P values < 0.05 regarded as suggestive evidence of significant associations. MVMR analysis was performed to evaluate the associations among gene expression, proteins, IgG N-glycans, and cognitive function. MR estimates were derived using the “TwoSampleMR” package in R 4.1.3.
-
We used this method to assess whether the two associated traits were consistent with shared causal variant (s) according to the included instrumental variables. As shown in Figure 1, this method was used in the first and second steps. Five mutually exclusive hypotheses were tested: (1) H0, there is no causal genetic variant for either trait; (2) H1, there is only one causal genetic variant for trait 1; (3) H2, there is only one causal genetic variant for trait 2; (4) H3, there are two distinct causal genetic variants, one for each trait; and (5) H4, there is a causal genetic variant for both traits. The posterior probability (PP) is used to quantify the support for each hypothesis, which is expressed as PPH0, PPH1, PPH2, PPH3, and PPH4. The evidence of colocalization was assessed using PPH4, which had values higher than >95%. These PPs were calculated using the “coloc” package in R 4.1.3. For each single nucleotide polymorphism (SNP) identified through MR analyses, colocalization analysis was implemented within its predefined cis-region, defined as a ± 500 kb range flanking the SNP.
-
To explore the underlying pathways of the significant genes and proteins, Gene Ontology (GO) enrichment of pathways and protein-protein interaction (PPI) networks of these genes and proteins were investigated. Moreover, we performed GO enrichment and PPI analyses for those genes with P < 0.001 and those proteins with P < 0.01 to gain further insight. GO enrichment and PPI analyses were performed using g: g:Profiler (https://biit.cs.ut.ee/gprofiler/gost) and the STRING database (https://string-DB.org/).
-
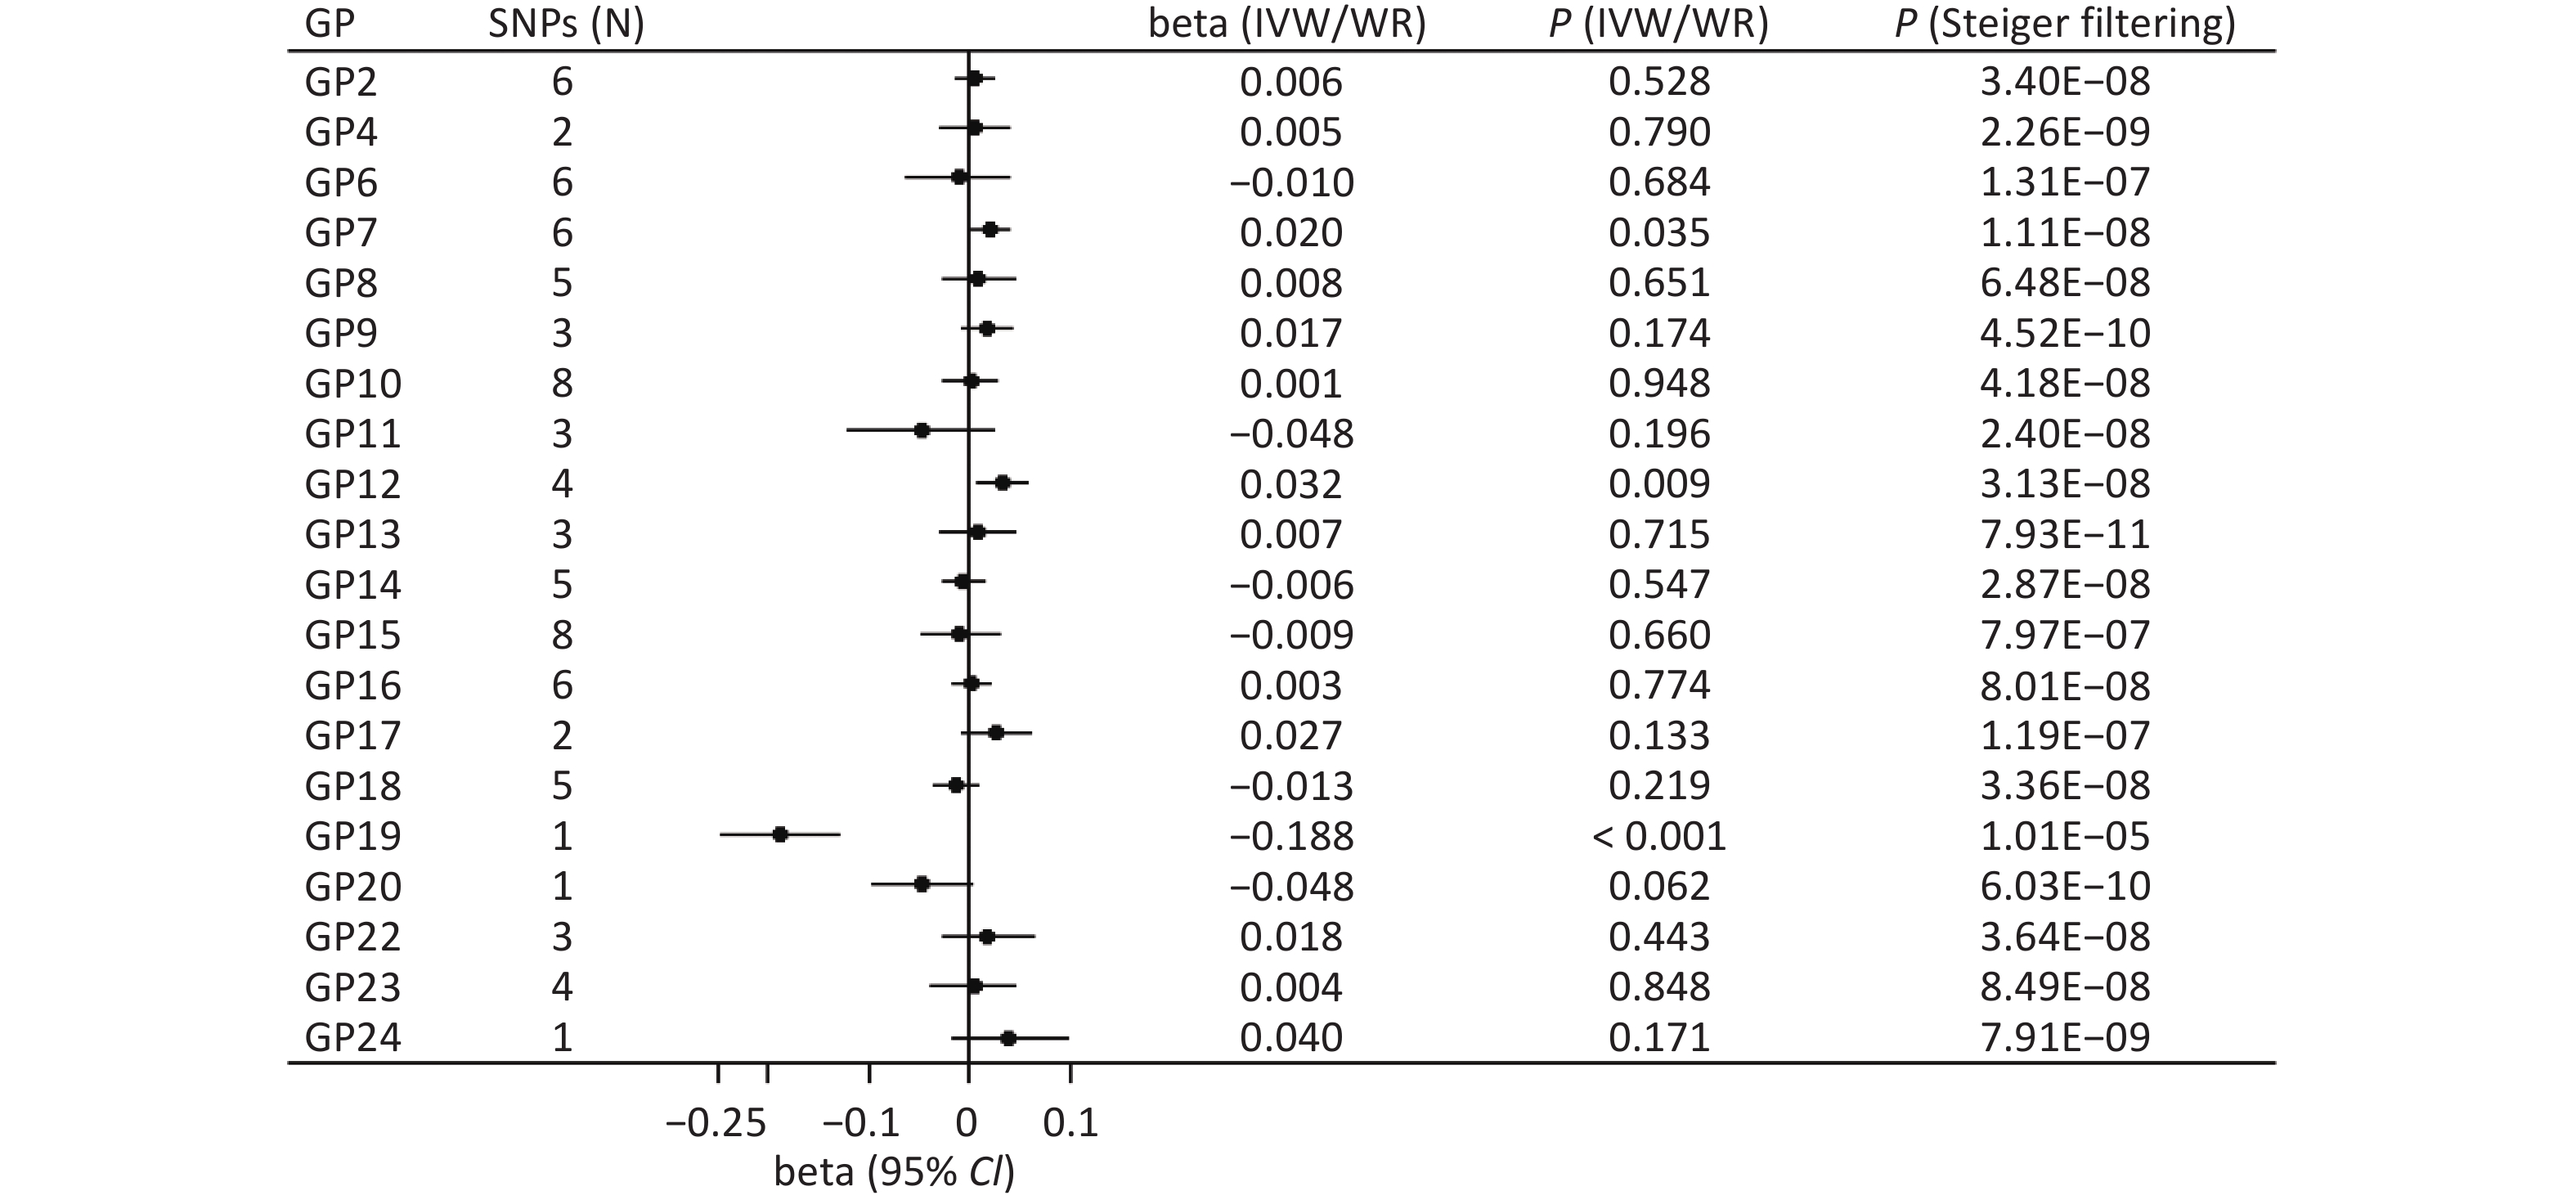
The main method showed a significant association between genetically instrumented IgG N-glycans (GP19) and cognitive function after multiple testing (WR: beta = −0.188, P < 0.001; Figure 2). In addition, the Steiger filtering results indicated the direction from GP9 to cognitive function (P < 0.001; Figure 2), and colocalization results showed that this association signal shared a common causal variant at the CHR22:39344350-40344350 locus (PPH4 = 99.20%; Supplementary Table S1).

Figure 2. Forward associations of IgG N-glycans with cognitive function by MR. CI: confidence interval; GP: glycan peak; IgG: immunoglobulin G; IVW: inverse-variance weighted; MR: Mendelian randomization; SNP: single nucleotide polymorphism; WR: Wald ratio; β: beta.
We also found suggestive associations between GP7 (IVW: beta = 0.020, P = 0.035) and GP12 (IVW: beta = 0.032, P = 0.009) and the risk of cognitive function (Figure 2). Sensitivity analysis showed robust results for GP7 (MR-PRESSO: beta = 0.020, P = 0.008; MR-RAPS: beta = 0.020, P = 0.040) and GP12 (WM: beta = 0.033, P = 0.034; PWM: beta = 0.033, P = 0.030; MR-PRESSO: beta = 0.033, P = 0.026; MR-RAPS: beta = 0.033, P = 0.012; Supplementary Table S2). In addition, the Steiger filtering results showed a direction from GP7 and GP12 to cognitive function (P < 0.05; Figure 2), but colocalization results indicated no shared signals between IgG N-glycans and cognitive function (all PPH4 < 95%; Supplementary Table S1). There was limited evidence of pleiotropic bias in these findings (all P values by Egger intercept test > 0.05).
-
As shown in Supplementary Figure S1, we performed a backward association analysis of cognitive function with IgG N-glycans. We found little evidence of reverse causality, although there were suggestive associations of genetically instrumented cognitive function with IgG N-glycans, including GP1 (beta = 0.289, P = 0.033) and GP8 (beta = −0.324, P = 0.020). However, the Steiger filtering results did not show a direction from cognitive function to GP1 or GP8 (all P > 0.05; Supplementary Figure S1), and colocalization analysis found no shared signals for either pair (all PPH4 < 95%; Supplementary Table S3).
-
Using MR, eight mRNA-coupled seven genes (FUT8, PIK3C2B, RGS9, SETBP1, SPRY1, TPRG1L, STARD3), seven mRNA-coupled six genes (FUT8, PIK3C2B, RGS9, SETBP1, SPRY1, LINC01341), and two mRNA-coupled two genes (MRPS18A and HLA-S) showed evidence of being causal with GP7, GP12, and GP19, respectively (Table 1). Furthermore, except for STARD3 to GP7 (P = 0.140; Table 1), the Steiger filtering results showed a direction from these genes to the IgG N-glycans (all Ps < 0.05; Table 1). However, no evidence of colocalization was found for FUT8, TPRG1L, or STARD3 with GP7, or for FUT8 with GP12. Similarly, no colocalization was detected between MRPS18A or HLA-S and GP19. (PPH4 < 95%; Supplementary Table S4). More detailed information is provided in Supplementary Tables S5–7.
Table 1. IgG N-glycan-associated genes identified using MR analysis
Genes mRNA ID CHR SNPs (n) βIVW/WR (95% CI) PIVW/WR PSteiger filtering GP7 FUT8 ENSG00000033170 14 2 –0.334 (–0.409, –0.260) 2.07 × 10⁻¹⁸ 5.23 × 10⁻³ PIK3C2B ENSG00000133056 1 1 –1.624 (–2.040, –1.204) 2.99 × 10⁻¹⁴ 2.31 × 10⁻⁴ RGS9 ENSG00000108370 17 1 –1.754 (–2.207, –1.298) 5.11 × 10⁻¹⁴ 1.05 × 10⁻⁴ None ENSG00000264198 17 1 0.607 (0.448, 0.766) 7.78 × 10⁻¹⁴ 2.15 × 10⁻¹⁹ SETBP1 ENSG00000152217 18 1 –1.931 (–2.442, –1.423) 1.23 × 10⁻¹³ 3.78 × 10⁻⁵ SPRY1 ENSG00000164056 4 1 –1.884 (–2.386, –1.386) 1.23 × 10⁻¹³ 5.24 × 10⁻⁵ TPRG1L ENSG00000158109 1 1 1.338 (0.840, 1.835) 1.36 × 10⁻⁷ 2.97 × 10⁻² STARD3 ENSG00000131748 17 1 –0.535 (–0.761, –0.308) 3.91 × 10⁻⁶ 1.40 × 10⁻¹ GP12 FUT8 ENSG00000033170 14 2 –0.282 (–0.357, –0.207) 1.49 × 10⁻¹³ 3.06 × 10⁻³ RGS9 ENSG00000108370 17 1 –1.343 (–1.795, –0.885) 8.62 × 10⁻⁹ 2.13 × 10⁻² PIK3C2B ENSG00000133056 1 1 –1.228 (–1.645, –0.810) 8.92 × 10⁻⁹ 4.13 × 10⁻² None ENSG00000264198 17 1 0.452 (0.293, 0.612) 2.51 × 10⁻⁸ 1.65 × 10⁻²⁴ SETBP1 ENSG00000152217 18 1 –1.452 (–1.966, –0.941) 2.56 × 10⁻⁸ 1.33 × 10⁻² SPRY1 ENSG00000164056 4 1 –1.414 (–1.917, –0.919) 2.56 × 10⁻⁸ 1.64 × 10⁻² LINC01341 ENSG00000227953 1 1 –0.389 (–0.546, –0.231) 1.42 × 10⁻⁶ 5.03 × 10⁻⁷ GP19 MRPS18A ENSG00000096080 6 1 –1.465 (–1.967, –0.960) 1.21 × 10⁻⁸ 1.75 × 10⁻² HLA-S ENSG00000225851 6 2 –0.613 (–0.847, –0.377) 3.36 × 10⁻⁷ 7.58 × 10⁻⁴ Note. This table shows that all genes are significantly associated with IgG N-glycans (Bonferroni-corrected P = 0.05/9488 = 5.26 × 10⁻⁶). CHR: chromosome; CI: confidence interval; GP: glycan peak; IgG: immunoglobulin G; IVW: inverse-variance weighted; MR: Mendelian randomization; SNP: single nucleotide polymorphism; WR: Wald ratio; β: beta. In addition, we found a causal association of the oxidoreductases HTATIP2 with GP7 and GP12, and the Kunitz protein of protease inhibitor 3 with GP19 (Table 2). The Steiger filtering results showed the direction from these proteins to IgG N-glycans (P < 0.05; Table 2), but colocalization analysis revealed no shared signals (PPH4 < 95%; Supplementary Table S8). More detailed information is provided in Supplementary Tables S9–11.
Table 2. Top five IgG N-glycan-associated proteins identified using MR analysis
Proteins GWAS ID SNPs (n) βIVW/WR (95% CI) PIVW/WR PSteiger filtering GP7 Oxidoreductase HTATIP2 prot-a-1390 1 0.137 (0.077, 0.196) 7.88 × 10⁻⁶ 4.25 × 10-64 Arfaptin-1 prot-a-145 1 –0.226 (–0.368, –0.082) 1.99 × 10⁻³ 2.15 × 10⁻¹⁰ Anaphase-promoting complex subunit 7 prot-a-91 1 0.587 (0.209, 0.965) 2.30 × 10⁻³ 1.52 × 10⁻³ Odourant-binding protein 2b prot-a-2139 2 –0.076 (–0.131, –0.022) 6.12 × 10⁻³ 1.74 × 10⁻¹⁹ a2-HS-Glycoprotein prot-c-3581_53_3 1 –0.080 (–0.139, –0.021) 7.94 × 10⁻³ 1.52 × 10⁻³¹ GP12 Oxidoreductase HTATIP2 prot-a-1390 1 0.143 (0.083, 0.204) 3.23 × 10⁻⁶ 2.34 × 10-63 Lactoperoxidase prot-a-1765 1 0.290 (0.134, 0.446) 2.82 × 10⁻⁴ 4.40 × 10⁻⁵ IGF-like family receptor 1 prot-a-1455 1 –0.183 (–0.286, –0.078) 5.86 × 10⁻⁴ 1.25 × 10-36 a2-HS-Glycoprotein prot-c-3581_53_3 1 –0.089 (–0.149, –0.028) 3.60 × 10⁻³ 4.15 × 10⁻³¹ Probable dimethyladenosine transferase prot-a-819 1 0.519 (0.164, 0.876) 4.24 × 10⁻³ 4.94 × 10⁻² GP19 Kunitz-type protease inhibitor 3 prot-a-2825 1 0.128 (0.068, 0.190) 3.53 × 10⁻⁵ 1.26 × 10-67 ERK-1 prot-c-2855_49_2 1 0.200 (0.080, 0.321) 1.11 × 10⁻³ 3.01 × 10⁻⁶ Beta-1,4-galactosyltransferase 1 prot-a-216 2 0.232 (0.093, 0.371) 1.11 × 10⁻³ 7.87 × 10⁻⁶ Adenosine deaminase CECR1 prot-a-506 1 0.063 (0.023, 0.103) 1.97 × 10⁻³ 8.93 × 10-205 C4 prot-c-4481_34_2 1 –0.166 (–0.272, –0.059) 2.35 × 10⁻³ 1.41 × 10⁻¹¹ Note. CI: Confidence interval; GP: glycan peak; GWAS: genome-wide association study; IgG: immunoglobulin G; IVW: inverse-variance weighted; MR: Mendelian randomization; SNP: single nucleotide polymorphism; WR: Wald ratio; β: beta. -
Two proteins (oxidoreductase HTATIP2 and Kunitz-type protease inhibitor 3) and 10 genes (FUT8, PIK3C2B, RGS9, SETBP1, SPRY1, TPRG1L, STARD3, LINC01341, HLA-S, and MRPS18A) are involved in the regulation of IgG N-glycosylation. The oxidoreductase HTATIP2 is involved in the biological processes of mitochondrial electron transport, NADH to ubiquinone, and mitochondrial respiratory chain complex I assembly (Supplementary Figure S2). The Kunitz-type protease inhibitor 3 protein is involved in antibacterial humoral and innate immune responses (Supplementary Figure S3). These genes were enriched in the biological process of the regulation of glycosyltransferases and immune responses (Supplementary Figure S4).
-
Considering the association of genes and proteins with IgG N-glycans, we performed MVMR to simultaneously determine the direct effect of IgG N-glycans on the cognitive function, conditioned on these genes and proteins. As shown in Table 3, the association between GP7 and cognition (P for MVMR < 0.05) was not influenced by FUT8 (P for MVMR > 0.05), and a similar result was found for the association of LINC01341 with GP12 and cognitive function. Although the Steiger filtering results did not support the direction from STARD3 to GP7, the MVMR results showed significant associations of both STARD3 and GP7 with cognitive function. This indicates that the association of STARD3 with GP7 jointly promoted cognitive function, similar to the association of FUT8 and PIK3C2B with GP12 and cognitive function. In addition, the association between GP12 and cognition (P for MVMR > 0.05) was influenced by RGS9.
Table 3. Causal relationships of IgG N-glycans with cognitive function adjusted for genes estimated by multivariable MR
GPs Genes GPs Genes βIVW (95% CI) PIVW βIVW (95% CI) PIVW GP7 FUT8 0.019 (0.003, 0.033) 1.67 × 10⁻² 0.009 (0.000, 0.019) 5.75 × 10⁻² PIK3C2B N/A N/A N/A N/A RGS9 N/A N/A N/A N/A None 0.009 (0.006, 0.012) 2.99 × 10⁻⁸ 0.022 (0.017, 0.026) 1.57 × 10⁻²⁰ SETBP1 N/A N/A N/A N/A SPRY1 N/A N/A N/A N/A TPRG1L N/A N/A N/A N/A STARD3 0.011 (0.004, 0.017) 8.79 × 10⁻⁴ 0.028 (0.016, 0.040) 8.50 × 10⁻⁶ GP12 FUT8 0.031 (0.019, 0.044) 1.05 × 10⁻⁶ 0.015 (0.007, 0.022) 7.64 × 10⁻⁵ RGS9 0.015 (–0.002, 0.032) 8.92 × 10⁻² –0.050 (–0.113, 0.014) 1.24 × 10⁻¹ PIK3C2B 0.011 (0.010, 0.012) 5.59 × 10-94 –0.050 (–0.052, –0.048) 2.93 × 10-228 None 0.014 (–0.003, 0.031) 1.05 × 10⁻¹ 0.020 (–0.002, 0.041) 7.87 × 10⁻² SETBP1 N/A N/A N/A N/A SPRY1 N/A N/A N/A N/A LINC01341 0.015 (0.001, 0.029) 3.35 × 10⁻² –0.006 (–0.023, 0.011) 4.48 × 10⁻¹ GP19 MRPS18A N/A N/A N/A N/A HLA-S N/A N/A N/A N/A Note. Values in bold indicate statistical significance (P < 0.05). The genes listed in this table were identified as significantly associated with IgG N-glycans (Bonferroni-corrected P = 0.05/9488 = 5.26 × 10⁻⁶) using MR and Bayesian colocalization analysis. CI: confidence interval; GP: glycan peak; IgG: immunoglobulin G; IVW: inverse-variance weighted; MR: Mendelian randomization; N/A: not available; β: beta. Similarly, we found that the association of proteins with GP7 and GP19 jointly promotes cognitive function, whereas the association between GP12 and cognition is influenced by these proteins. More detailed information is provided in Table 4.
Table 4. Causal relationships of IgG N-glycans with cognitive function adjusted for proteins estimated by multivariable MR
GPs Proteins GPs Proteins βIVW (95% CI) PIVW βIVW (95% CI) PIVW GP7 Oxidoreductase HTATIP2 0.018 (0.015, 0.022) 2.33 × 10⁻²⁰ –0.007 (–0.009, –0.005) 6.54 × 10⁻¹³ Arfaptin-1 0.013 (0.009, 0.018) 2.22 × 10⁻⁹ –0.006 (–0.013, 0.001) 1.12 × 10⁻¹ Anaphase-promoting complex subunit 7 0.015 (0.007, 0.023) 1.66 × 10⁻⁴ –0.010 (–0.014, –0.007) 6.74 × 10⁻⁹ Odourant-binding protein 2b 0.014 (0.010, 0.018) 2.87 × 10⁻¹¹ –0.005 (–0.008, –0.003) 2.14 × 10⁻⁵ a2-HS-Glycoprotein 0.017 (0.005, 0.029) 4.36 × 10⁻³ 0.006 (0.002, 0.009) 1.22 × 10⁻³ GP12 Oxidoreductase HTATIP2 0.017 (–0.023, 0.056) 4.12 × 10⁻¹ –0.007 (–0.022, 0.007) 3.19 × 10⁻¹ Lactoperoxidase 0.013 (–0.004, 0.029) 1.35 × 10⁻¹ –0.041 (–0.063, –0.018) 3.39 × 10⁻⁴ IGF-like family receptor 1 0.011 (–0.009, 0.032) 2.78 × 10⁻¹ –0.011 (–0.023, 0.002) 9.52 × 10⁻² a2-HS-Glycoprotein 0.005 (–0.067, 0.078) 8.91 × 10⁻¹ 0.004 (–0.015, 0.024) 6.75 × 10⁻¹ Probable dimethyladenosine transferase 0.012 (–0.007, 0.031) 2.29 × 10⁻¹ 0.014 (–0.027, 0.054) 5.05 × 10⁻¹ GP19 Kunitz-type protease inhibitor 3 N/A N/A N/A N/A ERK-1 N/A N/A N/A N/A Beta-1,4-galactosyltransferase 1 –0.192 (–0.237, –0.148) 1.58 × 10⁻¹⁷ 0.067 (0.048, 0.085) 2.45 × 10⁻¹² Adenosine deaminase CECR1 N/A N/A N/A N/A C4 N/A N/A N/A N/A Note. Values in bold indicate statistical significance (P < 0.05). The proteins listed in this table were identified as the top five proteins associated with IgG N-glycans using MR and Bayesian colocalization analysis. CI: confidence interval; GP: glycan peak; IgG: immunoglobulin G; IVW: inverse-variance weighted; MR: Mendelian randomization; N/A: not available; β: beta. -
Although great progress has been made in genetics, the etiology of cognitive dysfunction remains largely unclear. In this study, MR and Bayesian colocalization analyses were combined with eQTL, pQTL, IgG N-glycan-QTL, and GWAS datasets for cognitive function to identify the potential signaling pathways underlying cognitive function. We identified a potential causal association between the genetically determined IgG N-glycan levels (GP7, GP12, and GP19) and cognitive function. Subsequently, we identified two proteins (oxidoreductase HTATIP2 and Kunitz-type protease inhibitor 3) and 10 genes (FUT8, PIK3C2B, RGS9, SETBP1, SPRY1, TPRG1L, STARD3, LINC01341, HLA-S, and MRPS18A) involved in the regulation of IgG N-glycosylation. These proteins and genes were enriched in the biological processes related to glycosyltransferases regulation and immune responses. Using MVMR, we found complex associations between genes/proteins and IgG N-glycans that jointly promote or independently affect cognitive function. Our study reveals a novel regulatory mechanism whereby genetic variants in genes and proteins, coupled with modified IgG N-glycans, are involved in the development of cognitive function.
Biomarkers derived from cognitive function assessments that enable MCI risk prediction have the potential to provide actionable clinical information, underscoring the importance of research focused on identifying and validating screening indicators. Previous case-control studies have shown a potential causal association between IgG N-glycans and cognitive impairment[19,20]. Specifically, low levels of sialylated and highly bisecting GlcNAc N-glycan structures were observed in patients with dementia, whereas a similar pattern was characterized by low sialylation and high bisecting GlcNAc levels in patients with MCI. These findings suggest that IgG glycosylation may play a cascading role in the progression of dementia, as demonstrated in our study, further supporting the potential of IgG glycosylation as a biomarker for the early prediction of cognitive impairment. However, cohort studies are required to verify our findings. Moreover, the associations observed in observational studies may be affected by confounding factors or reverse causality. Our bidirectional MR analysis was used to discover potential causal associations, and Steiger filtering analysis was used to ensure the correct direction of the associations between IgG N-glycans and cognitive function.
In our study, a pipeline of analytical techniques was applied to discover the functional associations between genes, proteins, and IgG N-glycosylation and the risk of cognitive function. Several independent but complementary methods have been combined to identify novel genes, proteins, and IgG N-glycans involved in cognitive function. First, MR analysis aimed to discover the potential causal association; second, Steiger filtering analysis was performed to support the directionality of causal association; third, Bayesian colocalization analysis was conducted to verify the identified causal association, ensuring they were not distorted by LD or pleiotropy. Finally, MVMR analysis was used to elaborate complex network relationships. Integrated research based on glycomic technology and post-GWAS analysis has provided new insights and methods for predicting disease mechanisms. It should be emphasized that mediation analysis was not implemented in the present study; future investigations may employ specialized mediation models (e.g., two-step MR) to clarify the potential mediating effect of IgG N-glycans linking genes/proteins with cognitive function.
Multiple genes and proteins are involved in the regulation of IgG N-glycosylation. The oxidoreductase HTATIP2 protein, which is involved in nuclear import and regulation of angiogenesis, may be involved in the regulation of multiple sclerosis[33]. Given the association between cognitive function and multiple sclerosis[34], HTATIP2 may represent a novel drug target for cognitive function through the regulation of IgG N-glycosylation. In addition, the Kunitz-type protease inhibitor 3 protein, with amyloid precursor protein, is an important local factor for amyloid deposition in neuritic plaques, both in Alzheimer’s disease and in non-demented elderly individuals[35]. FUT8, which encodes an enzyme belonging to the fucosyltransferase family, plays an important role in the regulation of IgG N-glycosylation. RGS9 encodes G-protein-coupled receptor responses and is involved in nociception, analgesia, and antidepressant drug action[36]. SETBP1, which encodes a SET-binding protein that regulates self-renewal potential through HOXA protein activation, has been implicated in disrupted speech development[37]. SPRY1, TPRG1L, and STARD3 activate the inflammatory response[38]. The identified genes and proteins were enriched in the biological process related to the regulation of glycosyltransferases and immune responses. Therefore, our results further support the hypothesis that the immunity of IgG N-glycosylation could work together to contribute to inflammation, which is important for the pathogenesis of impaired cognitive function. Although these proteins and genes have not been directly linked to cognitive function in previous studies, they are indirectly related and may represent a new pathogenic pathway involved in cognition. Using genetic, proteomic, and transcriptomic approaches, this study identified compelling genes and proteins that provide important clues for future functional studies and potential drug targets for IgG N-glycosylation and cognitive function.
We first conducted a genetic study of molecular traits (omics) with the largest sample size, providing a cost-effective approach for evaluating the associations between gene expression, proteins, IgG N-glycans, and cognitive function. In addition, we apply several independent but complementary methods to confirm the robustness of our findings. However, our study has the following limitations. First, most genes and proteins have only one or two eQTLs and pQTLs as IVs, making it difficult to perform sensitivity analyses. In addition, due to the limited sample size (n = 8,090) for IgG N-glycan QTLs in European populations, only a small subset of SNPs was available for analysis. Future studies with larger sample sizes are required to confirm these findings. Second, eQTL, pQTL, and IgG N-glycan-QTL mapping could not resolve all GWAS signals. However, deciphering the biological progression of cognitive function at these levels remains challenging. To fully reveal the biological mechanisms of cognitive function, further focus on epigenetics, such as mQTLs and non-coding mRNA-QTLs, is needed. Third, a common limitation is that the GWAS datasets used in the current study originated from European population, which may not reflect the conditions in other ethnicities; evidence from other ancestral groups is still needed.
-
In conclusion, we have validated the causal association between IgG N-glycans and cognitive function, prioritizing the therapeutic significance of IgG N-glycans. The findings of genetic, proteomic, and transcriptomic approaches uncovered persuasive genes and proteins, providing important guidance for designing future functional studies and potential drug targets for IgG N-glycans and cognitive function.
doi: 10.3967/bes2026.043
Genetic Association of the Transcriptome and Immunoglobulin G N-glycome with Cognitive Function
-
Abstract:
Objective Immunoglobulin G (IgG) N-glycosylation is associated with mild cognitive impairment through the regulation of inflammatory balance; however, the underlying mechanisms remain unclear. Methods Our study utilized a post-genome-wide association studies (GWAS) method that integrated GWAS data for cognitive function with gene expression quantitative trait loci (eQTL), protein QTL (pQTL), and IgG N-glycan-QTL data. Results Mendelian randomization (MR) analyses suggested bidirectional causalities between glycan peaks (GPs) and cognitive function, with GP7, GP12, and GP19 showing a causal effect on cognitive function, while cognitive function conversely showed a causal effect on GP1 and GP8. Two proteins and 10 genes were implicated in the regulation of IgG N-glycosylation. Furthermore, multivariable MR results suggested complex causalities between genes/proteins and IgG N-glycans, which jointly promote or independently affect cognitive function. Conclusion Our study reveals a novel mechanism by which genes, proteins, and modified IgG N-glycans converge to pathologically affect cognitive function. -
Key words:
- Cognitive function /
- IgG N-glycans /
- Quantitative trait loci /
- Mendelian randomization /
- Genetic regulation /
- Post-GWAS
None of the authors has any conflict of interest to disclose.
We used the summarized data. All participants provided written informed consent in the original studies.
Study conception: Di Liu and Youxin Wang; Study design: Di Liu, Youxin Wang, Meiling Cao; Data extraction and analyses: Di Liu, Meiling Cao, Haotian Wang; Results presentation and interpretation: Di Liu, Meiling Cao, Jing Dong, Haotian Wang, Li Zhang, Xiaoni Meng, Jingyu Wang, and Youxin Wang; Manuscript drafting and revision: Di Liu, Meiling Cao, and Haotian Wang. All coauthors have approved the submitted version and agreed to its publication.
&These authors contributed equally to this work.
注释:1) Funding: 2) Competing Interests: 3) Ethics: 4) Authors’ Contributions: -
Figure 1. Overview of study analysis. QTL: quantitative trait locus; MR: Mendelian randomization.
Figure 2. Forward associations of IgG N-glycans with cognitive function by MR. CI: confidence interval; GP: glycan peak; IgG: immunoglobulin G; IVW: inverse-variance weighted; MR: Mendelian randomization; SNP: single nucleotide polymorphism; WR: Wald ratio; β: beta.
Table 1. IgG N-glycan-associated genes identified using MR analysis
Genes mRNA ID CHR SNPs (n) βIVW/WR (95% CI) PIVW/WR PSteiger filtering GP7 FUT8 ENSG00000033170 14 2 –0.334 (–0.409, –0.260) 2.07 × 10⁻¹⁸ 5.23 × 10⁻³ PIK3C2B ENSG00000133056 1 1 –1.624 (–2.040, –1.204) 2.99 × 10⁻¹⁴ 2.31 × 10⁻⁴ RGS9 ENSG00000108370 17 1 –1.754 (–2.207, –1.298) 5.11 × 10⁻¹⁴ 1.05 × 10⁻⁴ None ENSG00000264198 17 1 0.607 (0.448, 0.766) 7.78 × 10⁻¹⁴ 2.15 × 10⁻¹⁹ SETBP1 ENSG00000152217 18 1 –1.931 (–2.442, –1.423) 1.23 × 10⁻¹³ 3.78 × 10⁻⁵ SPRY1 ENSG00000164056 4 1 –1.884 (–2.386, –1.386) 1.23 × 10⁻¹³ 5.24 × 10⁻⁵ TPRG1L ENSG00000158109 1 1 1.338 (0.840, 1.835) 1.36 × 10⁻⁷ 2.97 × 10⁻² STARD3 ENSG00000131748 17 1 –0.535 (–0.761, –0.308) 3.91 × 10⁻⁶ 1.40 × 10⁻¹ GP12 FUT8 ENSG00000033170 14 2 –0.282 (–0.357, –0.207) 1.49 × 10⁻¹³ 3.06 × 10⁻³ RGS9 ENSG00000108370 17 1 –1.343 (–1.795, –0.885) 8.62 × 10⁻⁹ 2.13 × 10⁻² PIK3C2B ENSG00000133056 1 1 –1.228 (–1.645, –0.810) 8.92 × 10⁻⁹ 4.13 × 10⁻² None ENSG00000264198 17 1 0.452 (0.293, 0.612) 2.51 × 10⁻⁸ 1.65 × 10⁻²⁴ SETBP1 ENSG00000152217 18 1 –1.452 (–1.966, –0.941) 2.56 × 10⁻⁸ 1.33 × 10⁻² SPRY1 ENSG00000164056 4 1 –1.414 (–1.917, –0.919) 2.56 × 10⁻⁸ 1.64 × 10⁻² LINC01341 ENSG00000227953 1 1 –0.389 (–0.546, –0.231) 1.42 × 10⁻⁶ 5.03 × 10⁻⁷ GP19 MRPS18A ENSG00000096080 6 1 –1.465 (–1.967, –0.960) 1.21 × 10⁻⁸ 1.75 × 10⁻² HLA-S ENSG00000225851 6 2 –0.613 (–0.847, –0.377) 3.36 × 10⁻⁷ 7.58 × 10⁻⁴ Note. This table shows that all genes are significantly associated with IgG N-glycans (Bonferroni-corrected P = 0.05/9488 = 5.26 × 10⁻⁶). CHR: chromosome; CI: confidence interval; GP: glycan peak; IgG: immunoglobulin G; IVW: inverse-variance weighted; MR: Mendelian randomization; SNP: single nucleotide polymorphism; WR: Wald ratio; β: beta.  下载: 导出CSV
Table 2. Top five IgG N-glycan-associated proteins identified using MR analysis
Proteins GWAS ID SNPs (n) βIVW/WR (95% CI) PIVW/WR PSteiger filtering GP7 Oxidoreductase HTATIP2 prot-a-1390 1 0.137 (0.077, 0.196) 7.88 × 10⁻⁶ 4.25 × 10-64 Arfaptin-1 prot-a-145 1 –0.226 (–0.368, –0.082) 1.99 × 10⁻³ 2.15 × 10⁻¹⁰ Anaphase-promoting complex subunit 7 prot-a-91 1 0.587 (0.209, 0.965) 2.30 × 10⁻³ 1.52 × 10⁻³ Odourant-binding protein 2b prot-a-2139 2 –0.076 (–0.131, –0.022) 6.12 × 10⁻³ 1.74 × 10⁻¹⁹ a2-HS-Glycoprotein prot-c-3581_53_3 1 –0.080 (–0.139, –0.021) 7.94 × 10⁻³ 1.52 × 10⁻³¹ GP12 Oxidoreductase HTATIP2 prot-a-1390 1 0.143 (0.083, 0.204) 3.23 × 10⁻⁶ 2.34 × 10-63 Lactoperoxidase prot-a-1765 1 0.290 (0.134, 0.446) 2.82 × 10⁻⁴ 4.40 × 10⁻⁵ IGF-like family receptor 1 prot-a-1455 1 –0.183 (–0.286, –0.078) 5.86 × 10⁻⁴ 1.25 × 10-36 a2-HS-Glycoprotein prot-c-3581_53_3 1 –0.089 (–0.149, –0.028) 3.60 × 10⁻³ 4.15 × 10⁻³¹ Probable dimethyladenosine transferase prot-a-819 1 0.519 (0.164, 0.876) 4.24 × 10⁻³ 4.94 × 10⁻² GP19 Kunitz-type protease inhibitor 3 prot-a-2825 1 0.128 (0.068, 0.190) 3.53 × 10⁻⁵ 1.26 × 10-67 ERK-1 prot-c-2855_49_2 1 0.200 (0.080, 0.321) 1.11 × 10⁻³ 3.01 × 10⁻⁶ Beta-1,4-galactosyltransferase 1 prot-a-216 2 0.232 (0.093, 0.371) 1.11 × 10⁻³ 7.87 × 10⁻⁶ Adenosine deaminase CECR1 prot-a-506 1 0.063 (0.023, 0.103) 1.97 × 10⁻³ 8.93 × 10-205 C4 prot-c-4481_34_2 1 –0.166 (–0.272, –0.059) 2.35 × 10⁻³ 1.41 × 10⁻¹¹ Note. CI: Confidence interval; GP: glycan peak; GWAS: genome-wide association study; IgG: immunoglobulin G; IVW: inverse-variance weighted; MR: Mendelian randomization; SNP: single nucleotide polymorphism; WR: Wald ratio; β: beta.
下载: 导出CSV
Table 3. Causal relationships of IgG N-glycans with cognitive function adjusted for genes estimated by multivariable MR
GPs Genes GPs Genes βIVW (95% CI) PIVW βIVW (95% CI) PIVW GP7 FUT8 0.019 (0.003, 0.033) 1.67 × 10⁻² 0.009 (0.000, 0.019) 5.75 × 10⁻² PIK3C2B N/A N/A N/A N/A RGS9 N/A N/A N/A N/A None 0.009 (0.006, 0.012) 2.99 × 10⁻⁸ 0.022 (0.017, 0.026) 1.57 × 10⁻²⁰ SETBP1 N/A N/A N/A N/A SPRY1 N/A N/A N/A N/A TPRG1L N/A N/A N/A N/A STARD3 0.011 (0.004, 0.017) 8.79 × 10⁻⁴ 0.028 (0.016, 0.040) 8.50 × 10⁻⁶ GP12 FUT8 0.031 (0.019, 0.044) 1.05 × 10⁻⁶ 0.015 (0.007, 0.022) 7.64 × 10⁻⁵ RGS9 0.015 (–0.002, 0.032) 8.92 × 10⁻² –0.050 (–0.113, 0.014) 1.24 × 10⁻¹ PIK3C2B 0.011 (0.010, 0.012) 5.59 × 10-94 –0.050 (–0.052, –0.048) 2.93 × 10-228 None 0.014 (–0.003, 0.031) 1.05 × 10⁻¹ 0.020 (–0.002, 0.041) 7.87 × 10⁻² SETBP1 N/A N/A N/A N/A SPRY1 N/A N/A N/A N/A LINC01341 0.015 (0.001, 0.029) 3.35 × 10⁻² –0.006 (–0.023, 0.011) 4.48 × 10⁻¹ GP19 MRPS18A N/A N/A N/A N/A HLA-S N/A N/A N/A N/A Note. Values in bold indicate statistical significance (P < 0.05). The genes listed in this table were identified as significantly associated with IgG N-glycans (Bonferroni-corrected P = 0.05/9488 = 5.26 × 10⁻⁶) using MR and Bayesian colocalization analysis. CI: confidence interval; GP: glycan peak; IgG: immunoglobulin G; IVW: inverse-variance weighted; MR: Mendelian randomization; N/A: not available; β: beta.
下载: 导出CSV
Table 4. Causal relationships of IgG N-glycans with cognitive function adjusted for proteins estimated by multivariable MR
GPs Proteins GPs Proteins βIVW (95% CI) PIVW βIVW (95% CI) PIVW GP7 Oxidoreductase HTATIP2 0.018 (0.015, 0.022) 2.33 × 10⁻²⁰ –0.007 (–0.009, –0.005) 6.54 × 10⁻¹³ Arfaptin-1 0.013 (0.009, 0.018) 2.22 × 10⁻⁹ –0.006 (–0.013, 0.001) 1.12 × 10⁻¹ Anaphase-promoting complex subunit 7 0.015 (0.007, 0.023) 1.66 × 10⁻⁴ –0.010 (–0.014, –0.007) 6.74 × 10⁻⁹ Odourant-binding protein 2b 0.014 (0.010, 0.018) 2.87 × 10⁻¹¹ –0.005 (–0.008, –0.003) 2.14 × 10⁻⁵ a2-HS-Glycoprotein 0.017 (0.005, 0.029) 4.36 × 10⁻³ 0.006 (0.002, 0.009) 1.22 × 10⁻³ GP12 Oxidoreductase HTATIP2 0.017 (–0.023, 0.056) 4.12 × 10⁻¹ –0.007 (–0.022, 0.007) 3.19 × 10⁻¹ Lactoperoxidase 0.013 (–0.004, 0.029) 1.35 × 10⁻¹ –0.041 (–0.063, –0.018) 3.39 × 10⁻⁴ IGF-like family receptor 1 0.011 (–0.009, 0.032) 2.78 × 10⁻¹ –0.011 (–0.023, 0.002) 9.52 × 10⁻² a2-HS-Glycoprotein 0.005 (–0.067, 0.078) 8.91 × 10⁻¹ 0.004 (–0.015, 0.024) 6.75 × 10⁻¹ Probable dimethyladenosine transferase 0.012 (–0.007, 0.031) 2.29 × 10⁻¹ 0.014 (–0.027, 0.054) 5.05 × 10⁻¹ GP19 Kunitz-type protease inhibitor 3 N/A N/A N/A N/A ERK-1 N/A N/A N/A N/A Beta-1,4-galactosyltransferase 1 –0.192 (–0.237, –0.148) 1.58 × 10⁻¹⁷ 0.067 (0.048, 0.085) 2.45 × 10⁻¹² Adenosine deaminase CECR1 N/A N/A N/A N/A C4 N/A N/A N/A N/A Note. Values in bold indicate statistical significance (P < 0.05). The proteins listed in this table were identified as the top five proteins associated with IgG N-glycans using MR and Bayesian colocalization analysis. CI: confidence interval; GP: glycan peak; IgG: immunoglobulin G; IVW: inverse-variance weighted; MR: Mendelian randomization; N/A: not available; β: beta.
下载: 导出CSV
-
[1] 2021 Alzheimer's disease facts and figures. Alzheimers Dement. 2021 Mar;17(3): 327-406. ) [2] GBD 2019 Dementia Forecasting Collaborators. Estimation of the global prevalence of dementia in 2019 and forecasted prevalence in 2050: an analysis for the Global Burden of Disease Study 2019. Lancet Public Health, 2022; 7, e105−25. doi: 10.1016/S2468-2667(21)00249-8 [3] Jia LF, Du YF, Chu L, et al. Prevalence, risk factors, and management of dementia and mild cognitive impairment in adults aged 60 years or older in China: a cross-sectional study. Lancet Public Health, 2020; 5, e661−71. doi: 10.1016/S2468-2667(20)30185-7 [4] Rabin LA, Smart CM, Amariglio RE. Subjective cognitive decline in preclinical Alzheimer's disease. Annu Rev Clin Psychol, 2017; 13, 369−96. doi: 10.1146/annurev-clinpsy-032816-045136 [5] Langa KM, Levine DA. The diagnosis and management of mild cognitive impairment: a clinical review. JAMA, 2014; 312, 2551−61. doi: 10.1001/jama.2014.13806 [6] Liu XY, Li L, Xiao JQ, et al. Cognitive training in older adults with mild cognitive impairment. Biomed Environ Sci, 2016; 29, 356−64. [7] Mendoza-Holgado C, Lopez-Espuela F, Moran JM, et al. A pilot test for a one-year cognitive training intervention in elderly adults with mild cognitive impairment. Biomed Environ Sci, 2020; 33, 796−802. [8] Pu LN, Pan DG, Wang HH, et al. A predictive model for the risk of cognitive impairment in community middle-aged and older adults. Asian J Psychiatr, 2023; 79, 103380. doi: 10.1016/j.ajp.2022.103380 [9] Tran J, Nimojan T, Saripella A, et al. Rapid cognitive assessment tools for screening of mild cognitive impairment in the preoperative setting: a systematic review and meta-analysis. J Clin Anesth, 2022; 78, 110682. doi: 10.1016/j.jclinane.2022.110682 [10] Meng XN, Li XC, Cao ML, et al. Summarizing attributable factors and evaluating risk of bias of Mendelian randomization studies for Alzheimer's dementia and cognitive status: a systematic review and meta-analysis. Syst Rev, 2025; 14, 61. doi: 10.1186/s13643-025-02792-5 [11] Davies G, Lam M, Harris SE, et al. Study of 300, 486 individuals identifies 148 independent genetic loci influencing general cognitive function. Nat Commun, 2018; 9, 2098. doi: 10.1038/s41467-018-04362-x [12] Lee JJ, Wedow R, Okbay A, et al. Gene discovery and polygenic prediction from a genome-wide association study of educational attainment in 1.1 million individuals. Nat Genet, 2018; 50, 1112−21. doi: 10.1038/s41588-018-0147-3 [13] Ye YQ, Zhang Z, Liu YM, et al. A multi-omics perspective of quantitative trait loci in precision medicine. Trends Genet, 2020; 36, 318−36. doi: 10.1016/j.tig.2020.01.009 [14] Reily C, Stewart TJ, Renfrow MB, et al. Glycosylation in health and disease. Nat Rev Nephrol, 2019; 15, 346−66. doi: 10.1038/s41581-019-0129-4 [15] Wang W. Glycomedicine: the current state of the art. Engineering, 2022; 26, 12−5. [16] Liu D, Li QH, Zhang XY, et al. Systematic review: immunoglobulin G N-Glycans as next-generation diagnostic biomarkers for common chronic diseases. OMICS, 2019; 23, 607−14. doi: 10.1089/omi.2019.0032 [17] Liu D, Zhao ZY, Wang AX, et al. Ischemic stroke is associated with the pro-inflammatory potential of N-glycosylated immunoglobulin G. J Neuroinflammation, 2018; 15, 123. doi: 10.1186/s12974-018-1161-1 [18] Yu XW, Wang YX, Kristic J, et al. Profiling IgG N-glycans as potential biomarker of chronological and biological ages: a community-based study in a Han Chinese population. Medicine, 2016; 95, e4112. doi: 10.1097/MD.0000000000004112 [19] Zhang XY, Yuan H, Lyu JH, et al. Association of dementia with immunoglobulin G N-glycans in a Chinese Han Population. NPJ Aging, 2021; 7, 3. doi: 10.1038/s41514-021-00055-w [20] Wang M, Chen XY, Tang ZY, et al. Association between immunoglobulin G N-glycosylation and vascular cognitive impairment in a sample with atherosclerosis: a case-control study. Front Aging Neurosci, 2022; 14, 823468. doi: 10.3389/fnagi.2022.823468 [21] Meng XN, Liu D, Cao ML, et al. Potentially causal association between immunoglobulin G N-glycans and cardiometabolic diseases: bidirectional two-sample Mendelian randomization study. Int J Biol Macromol, 2024; 279, 135125. doi: 10.1016/j.ijbiomac.2024.135125 [22] Meng XN, Cao WJ, Liu D, et al. Bidirectional causality between immunoglobulin G N-glycosylation and metabolic traits: a Mendelian randomization study. Engineering, 2023; 26, 74−88. doi: 10.1016/j.eng.2022.11.004 [23] Davies NM, Holmes MV, Smith GD. Reading Mendelian randomisation studies: a guide, glossary, and checklist for clinicians. BMJ, 2018; 362, k601. [24] Zheng J, Haberland V, Baird D, et al. Phenome-wide Mendelian randomization mapping the influence of the plasma proteome on complex diseases. Nat Genet, 2020; 52, 1122−31. doi: 10.1038/s41588-020-0682-6 [25] Zuber V, Grinberg NF, Gill D, et al. Combining evidence from Mendelian randomization and colocalization: review and comparison of approaches. Am J Hum Genet, 2022; 109, 767−82. doi: 10.1016/j.ajhg.2022.04.001 [26] Kong JT, Wang MX, Zhang XZ, et al. Role of the gut-brain axis in chronotype-driven Alzheimer's disease: a Mendelian randomization study. Biomed Environ Sci, 2025; 38, 519−24. [27] Burgess S, Butterworth A, Thompson SG. Mendelian randomization analysis with multiple genetic variants using summarized data. Genet Epidemiol, 2013; 37, 658−65. doi: 10.1002/gepi.21758 [28] Sanderson E. Multivariable Mendelian randomization and mediation. Cold Spring Harb Perspect Med, 2021; 11, a038984. doi: 10.1101/cshperspect.a038984 [29] Sun BB, Maranville JC, Peters JE, et al. Genomic atlas of the human plasma proteome. Nature, 2018; 558, 73−9. doi: 10.1038/s41586-018-0175-2 [30] Folkersen L, Fauman E, Sabater-Lleal M, et al. Mapping of 79 loci for 83 plasma protein biomarkers in cardiovascular disease. PLoS Genet, 2017; 13, e1006706. doi: 10.1371/journal.pgen.1006706 [31] Suhre K, Arnold M, Bhagwat AM, et al. Connecting genetic risk to disease end points through the human blood plasma proteome. Nat Commun, 2017; 8, 14357. doi: 10.1038/ncomms14357 [32] Shen X, Klarić L, Sharapov S, et al. Multivariate discovery and replication of five novel loci associated with Immunoglobulin G N-glycosylation. Nat Commun, 2017; 8, 447. doi: 10.1038/s41467-017-00453-3 [33] Nakahara J, Kanekura K, Nawa M, et al. Abnormal expression of TIP30 and arrested nucleocytoplasmic transport within oligodendrocyte precursor cells in multiple sclerosis. J Clin Invest, 2009; 119, 169−81. [34] Manjaly ZM, Harrison NA, Critchley HD, et al. Pathophysiological and cognitive mechanisms of fatigue in multiple sclerosis. J Neurol Neurosurg Psychiatry, 2019; 90, 642−51. doi: 10.1136/jnnp-2018-320050 [35] Zhan SS, Sandbrink R, Beyreuther K, et al. APP with Kunitz type protease inhibitor domain (KPI) correlates with neuritic plaque density but not with cortical synaptophysin immunoreactivity in Alzheimer's disease and non-demented aged subjects: a multifactorial analysis. Clin Neuropathol, 1995; 14, 142−9. [36] Mitsi V, Terzi D, Purushothaman I, et al. RGS9-2--controlled adaptations in the striatum determine the onset of action and efficacy of antidepressants in neuropathic pain states. Proc Natl Acad Sci U S A, 2015; 112, E5088-97. [37] Eising E, Carrion-Castillo A, Vino A, et al. A set of regulatory genes co-expressed in embryonic human brain is implicated in disrupted speech development. Mol Psychiatry, 2019; 24, 1065−78. doi: 10.1038/s41380-018-0020-x [38] Liu HY, Yang YD, Ge YL, et al. TERC promotes cellular inflammatory response independent of telomerase. Nucleic Acids Res, 2019; 47, 8084−95. doi: 10.1093/nar/gkz584 -

 点击查看大图
计量
- 文章访问数: 23
- HTML全文浏览量: 8
- PDF下载量: 0
- 被引次数: 0

 Quick Links